Embed Size (px)
Citation preview

November 2013November 2013
Note: Detailed monthly reports on NAFA Funds are available on our website at www.nafafunds.com
114.2%
53.1%
22.2%
19.6%
-20.0%
0.0%
20.0%
40.0%
60.0%
80.0%
100.0%
120.0%
140.0%
28-O
ct-1
1
28-N
ov-1
1
28-D
ec-1
1
28-J
an-1
2
28-F
eb-1
2
28-M
ar-1
2
28-A
pr-1
2
28-M
ay-1
2
28-J
un-1
2
28-J
ul-1
2
28-A
ug-1
2
28-S
ep-1
2
28-O
ct-1
2
28-N
ov-1
2
28-D
ec-1
2
28-J
an-1
3
28-F
eb-1
3
31-M
ar-1
3
30-A
pr-1
3
31-M
ay-1
3
30-J
un-1
3
31-J
ul-1
3
31-A
ug-1
3
30-S
ep-1
3
31-O
ct-1
3
NSF NAAF NFSIF NGSLF
Annualised Return 44.0% 22.6% 10.1% 8.9%Annualised STDEV (Risk) 13.9% 6.9% 0.7% 0.2%
*Since Inception of NFSIF in October 2011
Relative Performance of NAFA's Key FundsFrom October 2011* to November 2013
Cumulative Return
29-N
ov-1
3

Table of Contents
Pg. 4NAFA Government Securities Liquid Fund
Pg. 5NAFA Money Market Fund
Pg. 7NAFA Riba Free Savings Fund
Pg. 8NAFA Financial Sector Income Fund
Pg. 10NAFA Multi Asset Fund
Pg. 11NAFA Islamic Multi Asset Fund
Pg. 9NAFA Asset Allocation Fund
Pg. 6NAFA Savings Plus Fund
Pg. 12NAFA Stock Fund
Pg. 3Capital Markets Review
Pg. 2CEO’s Write-up
Pg. 1Performance Summary Sheet of NAFA’s Key Funds
NAFA Income Fund Pg. 13
NAFA Islamic Aggressive Income Fund Pg. 14
NAFA Income Opportunity Fund Pg. 15
NAFA Pension Fund Pg. 16
NAFA Islamic Pension Fund Pg. 17

Performance Summary of NAFA’s Key FundsPerformance Summary of NAFA’s Key Funds
“November 2013”
Fund Size(Rs. In Crore)
StabilityRating / Star
Ranking*
NAFA Government Securities Liquid Fund
NAFA Money Market Fund
NAFA Savings Plus Fund
NAFA Riba Free Savings Fund
NAFA Financial Sector Income Fund
NAFA Asset Allocation Fund
NAFA Multi Asset Fund
NAFA Islamic Multi Asset Fund
NAFA Stock Fund
1,301
1,121
306
335
478
122
81
36
103
FY -2011
11.46%
n/a
10.64%
n/a
n/a
n/a
25.30%
28.44%
28.37%
10.86%
n/a
11.01%
10.80%
n/a
14.38%
15.54%
13.26%
21.98%
FY -2012
8.67%
9.16%
8.77%
8.73%
9.28%
31.94%
34.14%
36.25%
54.93%
FYTD -2014
FY -2013
7.30%
7.47%
7.43%
7.36%
7.73%
4.24%
7.11%
4.54%
12.16%
November- 2013
6.93%
6.94%
7.43%
8.06%
7.38%
1.57%
3.07%
2.32%
5.91%
Fund Name
Note: Detailed monthly reports on NAFA Funds are available on our website at www.nafafunds.com
AAA (f)
AA (f)
AA- (f)
AA- (f)
A+ (f)
(5-star)
(4-star)
(4-star)
(4-star)
* Stability rating for Fixed Income Funds and Star Ranking for Equity/Balanced Funds.
n/a = Not applicable.
- Return is reported where full period performance is available.
1 Returns upto November 30, 2013
2 Returns upto November 29, 2013
NG
SLF
NM
MF
NSP
FN
RFS
FN
FSIF
NA
AF
NM
FN
IMF
NSF
Low
est R
isk
Mod
erat
e R
isk
Hig
hest
Ris
k
Ris
k Pr
o�le
of
NA
FA’s
Key
Fun
ds
Fixed Income Funds Annualized Returns
Equity Related Funds Cumulative Returns
1
1
1
1
1
2
2
2
2

Local liquidity conditions remained notably easy over the last 2 years. Interest rates and money market yields declined to single-digits following 300bp cut in SBP discount rate to 9.0% on falling in�ation. Further, due to subdued private sector credit demand and ample loanable funds with yield-seeking commercial banks, corporate debt issues were scarce and tightly priced. Resultantly, different long-term asset classes such as bonds, stocks and real estate delivered solid capital gain income.
The improvement in liquidity was solely brought about by excessive note printing by State Bank of Pakistan (SBP) to fund a sizable chunk of the ballooning �scal de�cit, which more than offset the external liquidity crunch created by a precarious balance of payments position. Thus, despite considerable decline in Net Foreign Assets (NFAs) of the system and corresponding foreign exchange reserves attrition, money supply (M2) growth remained robust due to substantial jump in Net Domestic Assets (NDAs). Amid subdued in�ation numbers and moribund private sector credit demand, the aforesaid liquidity created by SBP kept the yield curve depressed during all this time.
Since June 30, 2011, NFAs of the banking sector have shrunk by nearly 95% or Rs738bn to just Rs42bn due to an adverse balance of payments position. In simple terms, this means Rs738bn have been converted into dollars and have left the system. However, more than making up for the dollar out�ow, SBP has injected Rs1849bn in the system through note printing to fund the �scal de�cit. The above has resulted in suf�cient growth in money supply to meet both public and private sector credit demand at lower rates.
Being cognizant of the above, we have kept maturities of our money market funds short and totally avoided investment in �xed rate instruments. Further, we have kept exposure to corporate bonds to a minimal due to less attractive yield spreads. Thus, our �xed income funds are well positioned to take full bene�t of higher expected yields in the coming months. Further, we have reduced our exposure in equities as stock market may react negatively to tighter liquidity conditions in the short-term. We are however bullish on the stock market over an investment horizon exceeding one year.
The above situation is about to change now as the new IMF loan agreement bars further government borrowing from the central bank. Moreover, under increasingly stringent quarterly borrowing targets, the government will have to retire Rs809bn to SBP by June 2014 to reduce its borrowing to Rs2,240bn from Rs3,049bn at present. Further, SBP has also increased policy rate by 100bp in the last two bi-monthly monetary policy reviews mainly on account of rising in�ationary pressures. On the credit demand side, we foresee ample government demand to �nance its �scal de�cit as well as a pick-up in private sector appetite due to improving macroeconomic environment. With restricted monetary expansion, the above should culminate into higher interest rates and wider credit spreads.
Net outstanding Govt. borrowing for budgetary support from SBP (PKRbn) *
700
1200
1700
2200
2700
3200
Jun-
11
Sep-
11
Dec
-11
Mar
-12
Jun-
12
Sep-
12
Dec
-12
Mar
-13
Jun-
13
Sep-
13
Dec
-13
Mar
-14
Jun-
14
Actual Nov. 15th
IMF quarterly targets for Dec. to Jun. 2014*

Capital Markets ReviewCapital Markets Review
Disclaimer: This publication is for informational purpose only and nothing herein should be construed as a solicitation, recommendation or an offer to buy or sell the fund. All investments in mutual funds are subject to market risks. The price of units may go up as well as down. Past Performance is not necessarily indicative of future results.
November 2013
During Nov-13, market continued with its bull run and closed at an all time high level of 24,302,generating an overall return of 6.7% during the month and taking the CY13 to date return to a mammoth 44%. Key triggers for this upbeat performance of the market include: continuing healthy foreign buying, SBP’s positively biased monetary policy statement, positive conclusion of IMF quarterly review, and benign Oct-13 current account de�cit number. Additionally, encouraging LSM numbers further upped the sentiments in the market. On the other hand, investors brushed aside the rising risks to the in�ation and interest rates and precarious external account position emanating from the depleting Forex reserves. Foreign Portfolio Investment was recorded at $26mn during Nov-13, as delays in Quantitative Easing by FED are keeping up foreign investments in the emerging markets. Average trading volumes registered an increase of 26.7% and clocked in at 147mn shares during the month under review. Oil & Gas sector underperformed the market as Iran’s agreement with six world powers over its nuclear program is expected to eventually put a downward pressure on oil prices. Personal goods outperformed the market with a wide margin on the expectations that EU will soon grant GSP plus status to Pakistan exports. Telecom sector slightly underperformed the general market as investors are still awaiting news on 3G license. Banks underperformed the market amid lower than expected increase in the discount rate by the SBP in the last monetary policy review.
We contend that road ahead is bumpy for the Pakistan’s economy and stock market mainly on account of likely reduction in liquidity, hike in interest rates in upcoming monetary policy review, a precarious external account position and tough IMF quarterly benchmarks in 2HFY14.
In November, SBP announced its monetary policy wherein continuing with its monetary tightening stance, policy rate was increased by 50bps to 10%. In�ation as measured by CPI for the month of November has crossed double digit mark as increase in power tariff and food prices have started re�ecting in consumer price index. Furthermore, we expect tight liquidity conditions in the coming months on account of GOP observing the ceiling on SBP borrowing in accordance with the target agreed with IMF. Currency depreciation on account of depleting forex reserves amid foreign loan payments is also fueling in�ation. Resultantly, we expect further interest rate hike in the upcoming monetary policy review scheduled in January. In the two T-Bills auctions during the month, MoF accepted Rs 611 billion (realized amount) against the target of Rs 500 billion and maturity of Rs 312 billion. The cut- off annualized yields for the last T- Bill auction came at around 9.87% for 3-month, while 6 and 12-month tenor bids were rejected. T-Bills auction bid pattern entirely skewed towards the 3-month as compared to 6 and 12 month tenors. In PIB auction during the month an amount of Rs. 45 billion was accepted against the target of Rs. 50 billion at a cut-off yield of 12.10%, 12.60% and 13.0% in the 3 year, 5 year and 10 year tenors respectively, whereas no bid was received in the 20-year tenor.
We had kept short maturities for our money market funds on the expectation of upside risk to the in�ation and interest rates. We are now deploying our funds in slightly longer maturities to take full advantage of upward movement in the yield curve.
Our Contacts

Dr. Amjad Waheed, CFA
Sajjad Anwar, CFA
Muhammad Ali Bhabha, CFA, FRM
Syed Suleman Akhtar, CFA
November 2013
November2013 *
* Annualized Simple Return - ** (Annualized Return Based on Morningstar Methodology)(Returns are net of management fee & all other expenses)
6.93%
7.53%
FYTDJul 2013 - Nov 2013*
7.30%
8.00%
30-Nov-13Asset Allocation (% of Total Assets)
WORKERS' WELFARE FUND (WWF)Credit Quality of the Portfolio as of November 30th, 2013 (% of Total Assets)
83.64%
-
9.41%
6.72%
0.23%
100.00%
Nil
T-Bills
Placements with Banks
Placements with DFIs
Cash Equivalents
Other including receivables
Total
Leverage
31-Oct-13
74.38%
5.23%
8.22%
11.95%
0.22%
100.00%
Nil
Trailing 12 MonthsDec 2012-Nov 2013*
7.71%
8.28%
10.14%
10.22%
Unit Price (30/11/2013): Rs. 10.0413
Launch Date: May 16, 2009Fund Size: Rs. 13,013 millionType: Open-end – Money Market FundDealing Days: Daily – Monday to SaturdayDealing Time: (Mon - Thr) 9:00 A.M to 5:00 P.M (Friday) 9:00 A.M to 5:30 P.M (Saturday) 9:00 A.M to 1:00 P.MSettlement: 2-3 business daysPricing Mechanism: Forward PricingLoad: Front end: 0%, Back end: 0%Management Fee: 10% of Gross Earnings (Min 1% p.a., Max 1.25% p.a. of Average Annual Net Assets)Risk Pro�le: Exceptionally LowFund Stability Rating: "AAA (f)" by PACRAListing: Lahore Stock ExchangeCustodian & Trustee: Central Depository Company (CDC)Auditors: "KPMG Taseer Hadi & Co. Chartered AccountantsBenchmark: 70% 3-Month T-Bills & 30% average 3-Month deposit rates (AA & above rated banks)Fund Manager: Muhammad Ali Bhabha, CFA, FRMMinimum Growth Unit: Rs. 10,000/-Subscription: Income Unit: Rs. 100,000/-Asset Manager Rating: AM2 by PACRA (Very High Investment Management Standards)
The scheme has maintained provisions against Workers' Welfare Fund's liability to the tune of Rs. 92,626,262/-. If the same were not made the NAV per unit/ last one year return of scheme would be higher by Rs. 0.0715/0.77%. For details investors are advised to read note 7 of the Financial Statements of the Scheme for the quarter ended September 30, 2013.
To generate optimal return with minimum risk, to provide easy liquidity and reasonable income to its unit holders by investing primarily in short-term Government Securities.
The Fund earned an annualized return of 6.9% during November 2013 versus the benchmark return of 7.5%. The annualized return for FYTD is 7.3% against the benchmark return of 8.0%. The return generated by the Fund is net of management fees and all other expenses.
NGSLF's stability rating is 'AAA (f)' awarded by PACRA. NGSLF is the largest Fund in Pakistan in this rating category. The rating re�ects exceptionally strong credit and liquidity pro�le of the Fund. Average daily allocation for the last 365 days in short-term T-Bills was around 82% of the Fund size. While at the end of the month, T-Bills comprised around 84% of the Total Assets and 85% of Net Assets. Weighted average time to maturity of the Fund is 34 days.
We had kept short maturities for our money market funds on the expectation of upside risk to the in�ation and interest rates. Taking advantage of the �exibility that we have, we are now deploying our funds in slightly longer maturities to bene�t from upward movement in the yield curve.
Monthly average yield of 3-month T-Bills for the last 12 months
0%
1%
2%
3%
4%
5%
6%
7%
8%
9%
10%
T-Bills (AAA rated), 83.64%
AAA, 0.11%
AA+, 9.60%
AA, 6.30% AA- & below, 0.12% Other including receivables, 0.23%

Nafa Money Market Fund (NMMF)NAFA Money Market Fund (NMMF)
Page 05
November 2013
To provide stable income stream with preservation of capital by investing in
AA and above rated banks and money market instruments.
The Fund earned an annualized return of 6.9% during November 2013 versus the benchmark return of 6.8%, thus registering an outperformance of 0.1% p.a. Since the launch of the Fund in February 2012, the Fund has outperformed its benchmark by 2.3% p.a. by earning an annualized return of 9.1%. This outperformance is net of management fee and all other expenses.
Being a money market scheme, the Fund has very restrictive investment guidelines. The authorized investments of the Fund include T-Bills, Bank Deposits and Money Market instruments. Minimum eligible rating is AA, while the Fund is not allowed to invest in any security exceeding six month maturity. The weighted average time to maturity of the Fund cannot exceed 90 days. The Fund is rated AA(f) by PACRA which denotes a very strong capacity to maintain relative stability in returns and very low exposure to risks. The allocation of the Fund in Treasury Bills is around 54% at month-end. The weighted average time to maturity of the Fund is 34 days. We had kept short maturities for our money market funds on the expectation of upside risk to the in�ation and interest rates. Taking full advantage of the �exibility that we have, we are now deploying our funds in slightly longer maturities to take bene�t from upward movement in the yield curve.
Unit Price (30/11/2013): Rs. 10.0076MONTHLY REPORT (MUFAP's Recommended Format)
Launch Date: February 24, 2012
Fund Size: Rs. 11,205 million
Type: Open-end – Money Market Fund
Dealing Days: Daily – Monday to Saturday
Dealing Time: (Mon - Thr) 9:00 A.M to 5:00 P.M
(Friday) 9:00 A.M to 5:30 P.M
(Saturday) 9:00 A.M to 1:00 P.M
Settlement: 2-3 business days
Pricing Mechanism Forward Pricing
Load: Front end: 0.5% (Nil on investment above Rs. 16
million), Back end: 0%
Management Fee: 1.00% per annum
Risk Pro�le: Very Low
Fund Stability Rating: "AA (f)" by PACRA
Listing: Lahore Stock Exchange
Custodian & Trustee: Central Depository Company (CDC)
Auditors: "A. F. Ferguson & Co
Chartered Accountants
Benchmark: 3-Month deposit rates (AA & above rated banks)
Fund Manager: Salman Ahmed
Minimum Growth Unit: Rs. 10,000/-
Subscription: Income Unit: Rs. 100,000/-
Asset Manager Rating: AM2 by PACRA (Very High Investment
Management Standards)
T-Bills Placements with Banks Placements with DFIs Cash Equivalents Others including receivables Total Leverage
Asset Allocation (% of Total Assets)
WORKERS' WELFARE FUND (WWF)
31-Oct-1354.43%31.28%11.49%2.48%0.32%
100.00%Nil
45.75%25.56%7.58%
20.51%0.60%
100.00%Nil
30-Nov-13
Credit Quality of the Portfolio as of November 30th, 2013 (% of Total Assets)
7.47%
6.61%
6.94%
6.84%
November2013*
7.99%
6.55%
Trailing 12 MonthsDec 2012-Nov 2013*
FYTDJul 2013 - Nov 2013*
9.09%
6.82%
Since LaunchFebruary 24, 2012**
* Annualized Simple Return - ** (Annualized Return Based on Morningstar Methodology)(Returns are net of management fee & all other expenses)
NAFA Money Market Fund
The scheme has maintained provisions against Workers' Welfare Fund's liability to the tune of Rs. 56,756,657/-. If the same were not made the NAV per unit/ last one year return of scheme would be higher by Rs. 0.0507/0.55%. For details investors are advised to read note 8 of the Financial Statements of the Scheme for the quarter ended September 30, 2013.
Dr. Amjad Waheed, CFA
Sajjad Anwar, CFA
Muhammad Ali Bhabha, CFA, FRM
Syed Suleman Akhtar, CFA
Salman Ahmed
T-Bills (AAA rated),54.43%AAA, 0.13%
AA+, 13.27%
AA, 31.68%
AA- & below, 0.17%Other including
receivables, 0.32%

Page 06
Trailing 12 MonthsDec 2012-Nov 2013*
November 2013
* Annualized Simple Return - ** (Annualized Return Based on Morningstar Methodology)(Returns are net of management fee & all other expenses)
7.43%
6.72%
November2013 *
7.43%
6.92%
30-Nov-13Asset Allocation (% of Total Assets)
WORKERS' WELFARE FUND (WWF)
Credit Quality of the Portfolio as of November 30th, 2013 (% of Total Assets)
T-Bills
Margin Trading System (MTS)
Cash Equivalents
Other including receivables
Total
Leverage
4.82%
11.60%
82.48%
1.10%
100.00%
Nil
31-Oct-13
4.80%
5.92%
87.93%
1.35%
100.00%
Nil
9.86%
7.87%
7.90%
6.84%
FYTDJul 2013 - Nov 2013*
Unit Price (30/11/2013): Rs. 10.0440
Launch Date: November 21, 2009
Fund Size: Rs.3,059 million
Type: Open-end – Income fund
Dealing Days: Daily – Monday to Saturday
Dealing Time: (Mon - Thr) 9:00 A.M to 5:00 P.M
(Friday) 9:00 A.M to 5:30 P.M
(Saturday) 9:00 A.M to 1:00 P.M
Settlement: 2-3 business days
Pricing Mechanism: Forward Pricing
Load: Front end: 0.5% (Nil on investment above
Rs. 16 million), Back end: 0%
Management Fee: 1.50% per annum
Risk Pro�le: Very Low
Fund Stability Rating: "AA- (f)" by PACRA
Listing: Lahore Stock Exchange
Custodian & Trustee: Central Depository Company (CDC)
Auditors: A. F. Ferguson & Co. Chartered Accountants
Benchmark: Average 6-Month deposit rate (A & above
rated banks)
Fund Manager: Muhammad Ali Bhabha, CFA, FRM
Minimum Growth Unit: Rs. 1,000/-
Subscription: Income Unit: Rs. 100,000/-
Asset Manager Rating: AM2 by PACRA (Very High Investment
Management Standards)
The scheme has maintained provisions against Workers' Welfare Fund's liability to the tune of Rs.8,034,978/-. If the same were not made the NAV per unit/ last one year return of scheme would be higher by Rs. 0.0264/0.28%. For details investors are advised to read note 8 of the Financial Statements of the Scheme for the quarter ended September 30, 2013.
To minimize risk, preserve capital and generate a reasonable return along with a high degree of liquidity from a portfolio primarily constituted of bank deposits and money market instruments.
The Fund earned an annualized return of 7.4% during the month versus the benchmark return of 6.9%, thus depicting an outperformance of 0.5% p.a. The annualized return in the CY13 is 7.8% against the benchmark return of 6.8%, hence an outperformance of 1.0% p.a. This outperformance is net of management fee and all other expenses.
NSPF is one of the highest rated income funds in the market due to its restrictive investment guidelines. It cannot invest in any avenue which has more than six months maturity nor can it invest in debt securities and Equities. Moreover, it cannot invest in money market instruments below credit rating of ‘AA-‘.
The portfolio of NSPF is invested in Treasury bills, MTS and bank deposits etc. The allocation in MTS is around 11.60%. Our internal guidelines permit MTS �nancing in only fundamentally strong companies with lower volatility. It is pertinent to mention that in this asset class the Fund provides �nancing at only pre-determined rates of return with no direct exposure to the stock market. The weighted average time to maturity of the entire Fund is around 8 days.
We are monitoring the developments in capital market conditions and will position the portfolio allocation accordingly.
Dr. Amjad Waheed, CFASajjad Anwar, CFA
Muhammad Ali Bhabha, CFA, FRMSyed Suleman Akhtar, CFA
T-Bills (AAA rated), 4.82% AAA, 0.14%
AA+, 0.11%
AA, 3.47%
AA- & below, 78.76%
MTS (Unrated), 11.60%
Other including receivables, 1.10%

Page 07
Dr. Amjad Waheed, CFASajjad Anwar, CFA
Muhammad Ali Bhabha, CFA, FRMSyed Suleman Akhtar, CFA
Salman Ahmed
November 2013
November2013 *
* Annualized Simple Return - ** (Annualized Return Based on Morningstar Methodology)(Returns are net of management fee & all other expenses)
8.06%
6.86%
7.36%
6.68%
GOP Ijara Sukuk - Govt. Backed Cash Equivalents Other including receivables Total Leverage
31-Oct-1314.97%83.31%1.72%
100.00%Nil
17.67%80.52%1.81%
100.00%Nil
30-Nov-13Asset Allocation (% of Total Assets)
Top Holdings (as at November 30, 2013)
WORKERS' WELFARE FUND (WWF)
Credit Quality of the Portfolio as of November 30th, 2013 (% of Total Assets)
9.65%
7.71%
Unit Price (30/11/2013): Rs. 10.0900
7.88%
6.78%
FYTDJul 2013 - Nov 2013*
Launch Date: August 21, 2010Fund Size: Rs. 3,353 millionType: Open-end – Shariah Compliant Income FundDealing Days: Daily – Monday to SaturdayDealing Time: (Mon - Thr) 9:00 A.M to 5:00 P.M (Friday) 9:00 A.M to 5:30 P.M (Saturday) 9:00 A.M to 1:00 P.MSettlement: 2-3 business daysPricing Mechanism Forward PricingLoad: Front end: 0.5% (Nil on investment above Rs. 16 million), Back end: 0%Management Fee: 1.25% per annumRisk Pro�le: Very LowFund Stability Rating: "AA-(f)" by PACRAListing: Lahore Stock ExchangeCustodian & Trustee: Central Depository Company (CDC)Auditors: A. F. Ferguson & Co. Chartered AccountantsBenchmark: Average 6-month deposit rate of A- and above rated Islamic BanksFund Manager: Salman AhmedMinimum Growth Unit: Rs. 10,000/-Subscription: Income Unit: Rs. 100,000/-Asset Manager Rating: AM2 by PACRA (Very High Investment ` Management Standards)
To provide preservation of capital and earn a reasonable rate of return along with a high degree of liquidity by investing in short-term Shariah compliant banks and money market / debt securities.
The Fund generated an annualized return of 8.1% for the month of November 2013 versus the benchmark return of 6.9% thus registering an outperformance of 1.2% p.a. During the last one year the Fund has outperformed its benchmark by 1.1% by earning an annualized return of 7.9%. This outperformance is net of management fee and all other expenses.
The Fund aims to consistently provide better return than the pro�t rates offered by Islamic Banks / Islamic windows of commercial banks, while also providing easy liquidity along with a high quality credit pro�le. The Fund is allowed to invest in short-term Shariah compliant money market securities of up to six months maturity rated AA- or better. The Fund is not authorized to invest in debt securities and the Equities. With stability rating of AA-(f), NRFSF is amongst the highest rated Islamic Income Funds in the market.
The allocation of the Fund is around 15% in GoP Ijarah Sukuks, which are �oating rate instruments with 6-months coupon re-setting. Around 83% of the portfolio is invested in bank deposits which further enhance liquidity pro�le of the Fund.
The weighted average duration of the Fund is 12 days and the weighted average time to maturity is 62 days. The Fund is invested in �oating rate securities. Therefore, the return on the Fund will improve with increase in interest rates. We will rebalance the portfolio based on the economic and market conditions.
The scheme has maintained provisions against Workers' Welfare Fund's liability to the tune of Rs.5,991,241/-. If the same were not made the NAV per unit/last one year return of scheme would be higher by Rs.0.0180/0.19%. For details investors are advised to read note 8 of the Financial Statements of the Scheme for the quarter ended September 30, 2013.
Name of SukukGOP Ijarah (Sukuk IX)GOP Ijarah (Sukuk VIII)GOP Ijarah (Sukuk XII)GOP Ijarah (Sukuk XIII)GOP Ijarah (Sukuk X)GOP Ijarah (Sukuk XIV)GOP Ijarah (Sukuk XI)GOP Ijarah (Sukuk VI)GOP Ijarah (Sukuk VII)Total
% of Total Assets5.57%2.97%1.49%1.40%1.19%0.74%0.72%0.65%0.24%14.97%
Trailing 12 MonthsDec 2012-Nov 2013*
GOP Ijarah Sukuk (AAA
rated), 14.97%
AA+, 3.55%AA, 1.27%
A, 78.44%
A-, 0.05%
Other including receivables, 1.72%

NAFA Financial Sector Income FundNAFA Financial Sector Income Fund (NFSIF)
Page 08
Dr. Amjad Waheed, CFASajjad Anwar, CFA
Muhammad Ali Bhabha, CFA, FRMSyed Suleman Akhtar, CFA
Salman Ahmed
Launch Date: October 28, 2011Fund Size: Rs. 4,782 MillionType: Open-end – Income FundDealing Days: Daily – Monday to SaturdayDealing Time: (Mon - Thr) 9:00 A.M to 5:00 P.M (Friday) 9:00 A.M to 5:30 P.M (Saturday) 9:00 A.M to 1:00 P.MSettlement: 2-3 business daysPricing Mechanism Forward PricingLoad: Front end: 1% (Nil on investment above Rs. 16 million) Back end: 0%Management Fee: 1.5% per annumRisk Pro�le: LowFund stability rating A+(f) by PACRAListing: Lahore Stock ExchangeCustodian & Trustee: Central Depository Company (CDC)Auditors: A. F. Ferguson & Co. Chartered AccountantsBenchmark: 70% 6-Month KIBOR & 30% average 3-Month deposit rates A & above rated banks)Fund Manager: Salman AhmedMinimum Growth Unit: Rs. 10,000/-Subscription: Income Unit: Rs. 100,000/-Asset Manager Rating: AM2 by PACRA (Very High Investment Management Standards)
To provide income enhancement and preservation of capital by investing in prime quality Financial Sector TFCs/Sukuks, Bank deposits and short-term money market instruments.
The Fund generated an annualized return of 7.4% for the month of November 2013 versus the benchmark return of 8.9%. Since its launch in October 2011, the Fund offered an annualized return of 10.1% against the benchmark return of 9.5%, hence an outperformance of 0.6% p.a. This outperformance is net of management fee and all other expenses.
The Fund is unique as it invests a minimum 70% of its assets in Financial Sector (mainly banks) debt securities, instruments or deposits. Minimum entity rating of issuers of debt securities is AA minus. This minimizes credit risk and at the same time enhances liquidity of the Fund. Duration of the overall portfolio cannot be more than one year. This minimizes interest rate or pricing risk. The Fund invests 25% of its assets in less than 90 days T-Bills or saving accounts with banks, which further enhances liquidity pro�le of the Fund.
Exposure in TFCs was 24.54% at the end of the month with average time to maturity of 3.99 years and Yield to Maturity of 10.84% p.a. The TFC portfolio of the Fund is predominantly �oating rate linked to KIBOR. The weighted average time-to-maturity of the Fund is 0.99 years.
As the Fund is invested in �oating rate TFCs and other short-term avenues any hike in interest rate is likely to improve the return of the Fund. We will rebalance the allocation of the portfolio proactively based on the capital market outlook.
November 2013
November2013 *
Since LaunchOctober 28, 2011 **
7.38%NAFA Financial Sector Income Fund
* Annualized Simple Return - ** (Annualized Return Based on Morningstar Methodology)(Returns are net of management fee & all other expenses)
8.86%
7.73%
8.51%
Trailing 12 MonthsDec 2012-Nov 2013*
FYTDJul 2013 - Nov 2013*
8.39%
8.57%
TFCs
Cash Equivalents
Other including receivables
Total
Leverage
24.54%
73.73%
1.73%
100.00%
Nil
23.57%
74.80%
1.63%
100.00%
Nil
30-Nov-13Asset Allocation (% of Total Assets) 31-Oct-13
Credit Quality of the Portfolio as of November 30th, 2013 (% of Total Assets)
10.08%
9.48%
Unit Price (30/11/2013): Rs. 10.4441
Top 10 TFC (as at November 30th, 2013)
WORKERS' WELFARE FUND (WWF)
Name of TFCBank Alfalah Limited IV - FTFaysal Bank Limited IIIAskari Bank Limited IIIBank Alfalah Limited IV - FXAllied Bank Limited IIStandard Chartered Bank (Pakistan) Limited IVPakistan Mobile Communication Limited (17 Sep 13)Askari Bank Limited IVPak Libya Holding CompanyAllied Bank Limited ITotal
% of Total Assets7.74%6.45%3.28%1.28%1.28%1.04%1.04%0.97%0.86%0.34%24.28%
The scheme has maintained provisions against Workers' Welfare Fund's liability to the tune of Rs. 12,566,893/- If the same were not made the NAV per unit/ last one year return of scheme would be higher by Rs.0.0274/0.28%. For details investors are advised to read note 8 of the Financial Statements of the Scheme for the quarter ended September 30, 2013.
AAA, 1.09% AA+, 0.09% AA, 4.63%
AA-, 81.29%
A, 11.10%
A-, 0.07%Other including
receivables, 1.73%

Page 09
FYTDJul 2013 - Nov 2013*
* Cumulative Returns**Annualized Return
[Net of management fee & all other expenses]
Dr. Amjad Waheed, CFASajjad Anwar, CFA
Muhammad Ali Bhabha, CFA, FRMSyed Suleman Akhtar, CFAAsim Wahab Khan, CFA
Muhammad Imran, CFA, ACCA
Characteristics of Equity Portfolio***
NAAFKSE-30
PER7.68.2
PBV1.72.1
DY6.4%6.7%
*** Based on NAFA's estimates
To generate income by investing in Debt & Money Market securities and to generate capital appreciation by investing in equity and equity related securities.
During the month under review, NAFA Asset Allocation Fund's (NAAF) unit price (NAV) increased by 1.6% while the benchmark increased by 2.1%. Thus your Fund underperformed the benchmark by 0.5%. Since inception on August 21, 2010 the Fund has posted 88.0% return, versus 50.7% by the benchmark. Thus, to date the cumulative outperformance of your Fund stands at 37.3%. This outperformance is net of management fee and all other expenses.
The stock market closed at an all time high level of 24,302, breaking the psychological barrier of 24,000, which it had resisted thrice during this �scal year. Continuation of foreign interest and less than expected hike in discount rate also contributed to the continued market bull run. NAAF started off the month with an allocation of around 13% in equities, which was increased to around 21% towards the end of the month. The Fund underperformed the benchmark as it was underweight in equities. During the month, allocation was increased in all the sectors barring Oil and Gas, Construction and Materials, and Personal Goods sectors, where the allocation was reduced.
Unit Price (29/11/2013): Rs.11.8610MONTHLY REPORT (MUFAP's Recommended Format)
November 2013
Equities / Stocks TFCs T-Bills Cash Equivalents Others including receivables Total Leverage
20.64%2.16%
57.89%18.22%1.09%
100.00%Nil
13.30%1.84%
20.02%63.80%1.04%
100.00%Nil
Launch Date: August 21, 2010Fund Size: Rs. 1,221 millionType: Open-end – Asset Allocation FundDealing Days: Daily – Monday to FridayDealing Time: (Mon-Thr) 9:00 A.M to 5:00 P.M (Friday) 9:00 A.M to 5:30 P.MSettlement: 2-3 business daysPricing Mechanism Forward PricingLoad: Front end – 3% (Nil on investment above Rs. 16 million) Back end - 0%Management Fee: 2% per annum Risk Pro�le ModerateListing: Lahore Stock ExchangeCustodian & Trustee: Central Depository Company (CDC)Auditors: A. F. Ferguson & Co. Chartered AccountantsBenchmark: 1/3 of average 3-month bank deposit rate; 1/3 of 6-month KIBOR; 1/3 of KSE 30 IndexFund Manager: Muhammad Imran, CFA, ACCAMinimum Growth Unit: Rs. 10,000/-Subscription: Income Unit: Rs. 100,000/-Asset Manager Rating: AM2 by PACRA (Very High Investment Management Standards)
Asset Allocation (% of Total Assets) 29-Nov-13 31-Oct-13
Asset Allocation (% of Total Assets)(as on 29th November, 2013)
WORKERS’ WELFARE FUND (WWF)
Bank AL-Habib Ltd Kot Addu Power Company LtdBank Al-Falah LtdNishat Mills Ltd Allied Bank Ltd ILucky Cement Ltd Pakistan Telecommunication ltdPakistan State Oil Co. LtdUnited Bank LtdFatima Fertilizer Company LtdTotal
EquityEquityEquityEquityTFC
EquityEquityEquityEquityEquity
4.40%4.29%4.13%1.56%1.50%1.05%0.96%0.88%0.81%0.76%
20.34%
% of TotalAssets
Top Ten Holdings (as on 29th November, 2013)
Performance %
PerformanceNovember
2013*
1.57%
2.07%
4.24%
6.35%
Trailing 12 MonthsDec. 2012 - Nov. 2013*
25.35%
16.71%
21.23%
13.33%
Since LaunchAugust 21, 2010**
NAFA Asset Allocation Fund *
Benchmark
The scheme has maintained provision against Workers’ Welfare Fund’s liability to the tune of Rs 7,387,844/-If the same were not made the NAV per unit/ last one year return of scheme would be higher by Rs 0.0718/0.76%.For details investors are advised to read Note 8 of the Financial Statements of the Scheme for the period ended September 30, 2013.
NAAF78.3%
Benchmark43.1%
Peers Avg.47.5%
-5.0%
5.0%
15.0%
25.0%
35.0%
45.0%
55.0%
65.0%
75.0%
85.0%
95.0%
30-N
ov-
10
31-J
an-1
1
31-M
ar-1
1
31-M
ay-1
1
31-J
ul-
11
30-S
ep
-11
30-N
ov-
11
31-J
an-1
2
31-M
ar-1
2
31-M
ay-1
2
31-J
ul-
12
30-S
ep
-12
30-N
ov-
12
31-J
an-1
3
31-M
ar-1
3
31-M
ay-1
3
31-J
ul-
13
30-S
ep
-13
NAAF Benchmark Peers Avg.Annualized Return 21.3% 12.7% 13.8%Ann. Std. Deviation 6.4% 5.3% 11.3%
Relative Performance of NAFA Asset Allocation Fund (NAAF)for the Last Three Years
Cum.Return
29-N
ov-
13
Cash Equivalents and Others including
receivables19.31%
T-Bills57.89%
TFCs 2.16%
Construction and Materials
1.17%
Banks9.34%
Oil and Gas1.69%
Personal Goods1.57% Others
2.39%Electricity
4.48%

Page 10
Dr. Amjad Waheed, CFASajjad Anwar, CFA
Muhammad Ali Bhabha, CFA, FRMSyed Suleman Akhtar, CFA
Asim Wahab khan, CFAMuhammad Imran, CFA, ACCA
November 2013
November2013*
Saudi Pak Leasing****
Eden Housing (Sukuk II)
Maple Leaf Cement (Sukuk I)
Pak Elektron Limited (Sukuk)
New Allied Electronics (Sukuk I)
Total
****Said TFC is performing but classi�ed as non Compliant on the basis of required rating. Due to this the difference betweenthe Value of Investment before provision and after provision is mark to market loss instead of provisioning.
TFC
SUKUK
SUKUK
SUKUK
SUKUK
29,015,360
15,937,500
77,197,065
17,142,857
10,000,000
149,292,782
-
5,555,988
46,318,239
16,457,143
10,000,000
78,331,370
1.78%
1.27%
3.79%
0.08%
-
6.92%
1.74%
1.24%
3.70%
0.08%
-
6.76%
59.42%
96.81%
41.15%
328.98%
-
14,507,680
10,381,512
30,878,826
685,714
-
56,453,732
To provide investors with a combination of capital growth and income. NMF aims to achieve attractive returns at moderate levels of risk by investing in a variety of asset classes such as stocks, bonds, money market instruments, CFS etc.
During the month under review, NAFA Multi Asset Fund's (NMF) unit price (NAV) increased by 3.1% while the benchmark increased by 2.9%. Thus your Fund outperformed the benchmark by 0.2%. Since inception on January 22, 2007 your Fund has posted 145.3% return, versus 77.7% by the benchmark. Thus, todate the cumulative out performance of your Fund stands at 67.6%. This outperformance is net of management fee and all other expenses.
The stock market closed at an all time high level of 24,302, breaking the psychological barrier of 24,000, which it had resisted thrice during this �scal year. Continuation of foreign interest and less than expected hike in discount rate also contributed to the continued market bull run. NMF started off the month with an allocation of around 42% in equities, which was maintained during the month. Despite being underweight in equities, the Fund outperformed the benchmark in November as the Fund’s key holdings in Banks, Fixed Line Telecommunication, and Personal Goods sectors outperformed the market. During the month, allocation was increased in Banks, Fixed Line Telecommunications, General Industrials, and Chemicals sectors, whereas it was reduced in all the other sectors.
Unit Price (29/11/2013): Rs.12.2632MONTHLY REPORT (MUFAP's Recommended Format)
3.07%
2.87%
7.11%
8.26%
30.13%
22.25%
13.96%
8.73%
Trailing 12 MonthsDec. 2012 - Nov. 2013* **
* Cumulative Returns**Annualized Return [Net of management fee & all other expenses]
Launch Date: January 22, 2007Fund Size: Rs 815 millionType: Open-end – Balanced FundDealing Days: Daily – Monday to FridayDealing Time: (Mon-Thr) 9:00 A.M to 5:00 P.M (Friday) 9:00 A.M to 5:30 P.MSettlement: 2-3 business daysPricing Mechanism Forward PricingLoad: Front end – 3% (Nil on investment above Rs. 16 million) Back end - 0%Management Fee: 2% per annumRisk Pro�le ModerateListing: Lahore Stock ExchangeCustodian & Trustee: Central Depository Company (CDC)Auditors: M. Yousuf Adil Saleem & Co. Chartered AccountantsBenchmark: 50% KSE-30 Index & 50% 3-month KIBORFund Manager: Asim Wahab Khan, CFAMinimum Growth Unit: Rs. 10,000/-Subscription: Income Unit: Rs. 100,000/-Asset Manager Rating: AM2 by PACRA (Very High Investment Management Standards)
Bank Al-Falah LtdKot Addu Power Co LtdBank AL-Habib Ltd Maple Leaf Cement IPakistan State Oil Co. Ltd
EquityEquityEquitySukukEquity
4.10%3.91%3.85%3.70%3.47%
% of TotalAssets
% of TotalAssets
Pakistan Petroleum LtdOil & Gas Dev.Co LtdPakistan Telecommunication Thal LtdNishat Mills Ltd
3.46%2.95%2.87%2.82%2.65%
EquityEquityEquityEquityEquity
Equities / Stocks TFCs / Sukuks T-Bills Cash Equivalents Others including receivables Total Leverage
41.19%9.59%
28.05%19.58%1.59%
100.00%Nil
42.11%10.21%
- 45.22%2.46%
100.00%Nil
Asset Allocation (% of Total Assets) 29-Nov-13 31-Oct-13
Asset Allocation (% of Total Assets)(as on 29th November , 2013)
WORKERS’ WELFARE FUND (WWF)
Top Ten Holdings (as on 29th November , 2013)
PER7.48.2
NMFKSE-30
PBV1.82.1
DY6.9%6.7%
The scheme has maintained provision against Workers’ Welfare Fund’s liability to the tune of Rs 10,807,010/-If the same were not made the NAV per unit/ last one year return of scheme would be higher by Rs 0.1627/1.73%.For details investors are advised to read Note 7 of the Financial Statements of the Scheme for the period ended September 30, 2013.
FYTDJul 2013 - Nov 2013 *
NMF84.7%
Benchmark53.6%
Peer Avg.61.0%
-10.0%
0.0%
10.0%
20.0%
30.0%
40.0%
50.0%
60.0%
70.0%
80.0%
90.0%
100.0%
30-N
ov-1
0
31-M
ar-1
1
31-J
ul-1
1
30-N
ov-1
1
31-M
ar-1
2
31-J
ul-1
2
30-N
ov-1
2
31-M
ar-1
3
31-J
ul-1
3
NMF Benchmark Peer Avg.
Annualized Return 22.7% 15.4% 17.2%
Annualised Std. Deviation 8.4% 8.0% 9.8%
Relative Performance of NAFA Multi Asset Fund (NMF)for the Last Three Years
Cum.Return
29-N
ov-1
3
Relative Performance of NAFA Multi Asset Fund (NMF)for the Last Three Years
Cum.Return
Personal Goods4.28%
Oil and Gas12.04%
Electricity4.95%
Fixed Line Telecommunication
2.87%
Banks10.74%Others
6.31%T-Bills28.05%
TFCs/Sukuks9.59%
Cash Equivalents and Others including
receivables21.17%
Page 11
*****Said TFC is performing but classi�ed as non Compliant on the basis of required rating. Due to this the difference betweenthe Value of Investment before provision and after provision is mark to market loss instead of provisioning.
‘s
November 2013
November2013*
2.32%
2.81%
4.54%
6.80%
29-Nov-13Asset Allocation (% of Total Assets)
Asset Allocation (% of Total Assets) (as on 29th November , 2013)
WORKERS’ WELFARE FUND (WWF)
Top Ten Holdings (as on 29th November , 2013)
Details of Non-Compliant Investments
Equities / Stocks Sukuks Cash Equivalents Others including receivables Total Leverage
40.93%7.64%
47.55%3.88%
100.00%Nil
42.72%6.03%
48.60%2.65%
100.00%Nil
31-Oct-13
PER7.87.9
PBV2.02.2
DY6.8%7.5%
12.83%
10.96***
28.64%
23.21%
Trailing 12 MonthsDec. 2012 - Nov. 2013* **
Unit Price (29/11/2013): Rs.12.4874
Launch Date: October 29, 2007Fund Size: Rs. 364 millionType: Shariah Compliant - Open-end – Balanced FundDealing Days: Daily – Monday to FridayDealing Time: (Mon-Thr) 9:00 A.M to 5:00 P.M (Friday) 9:00 A.M to 5:30 P.MSettlement: 2-3 business daysPricing Mechanism Forward PricingLoad: Front end – 3% (Nil on investment above Rs. 16 million) Back end - 0%Management Fee: 2% per annumRisk Pro�le ModerateListing: Lahore Stock ExchangeCustodian & Trustee: Central Depository Company (CDC)Auditors: KPMG Taseer Hadi & Co. Chartered AccountantsBenchmark: 50% KMI - 30 Index & 50% average 3-month pro�t rate of Islamic banks.Fund Manager: Asim Wahab Khan, CFAMinimum Growth Unit: Rs. 10,000/-Subscription: Income Unit: Rs. 100,000/-Asset Manager Rating: AM2 by PACRA (Very High Investment Management Standards)
To provide investors with a combination of capital growth and income by investing in Shariah compliant investments. NIMF aims to achieve attractive returns at moderate levels of risk by investing in a variety of Shariah compliant securities, instruments and avenues such as Equities, Musharakah, Murabahah, Ijarah etc.
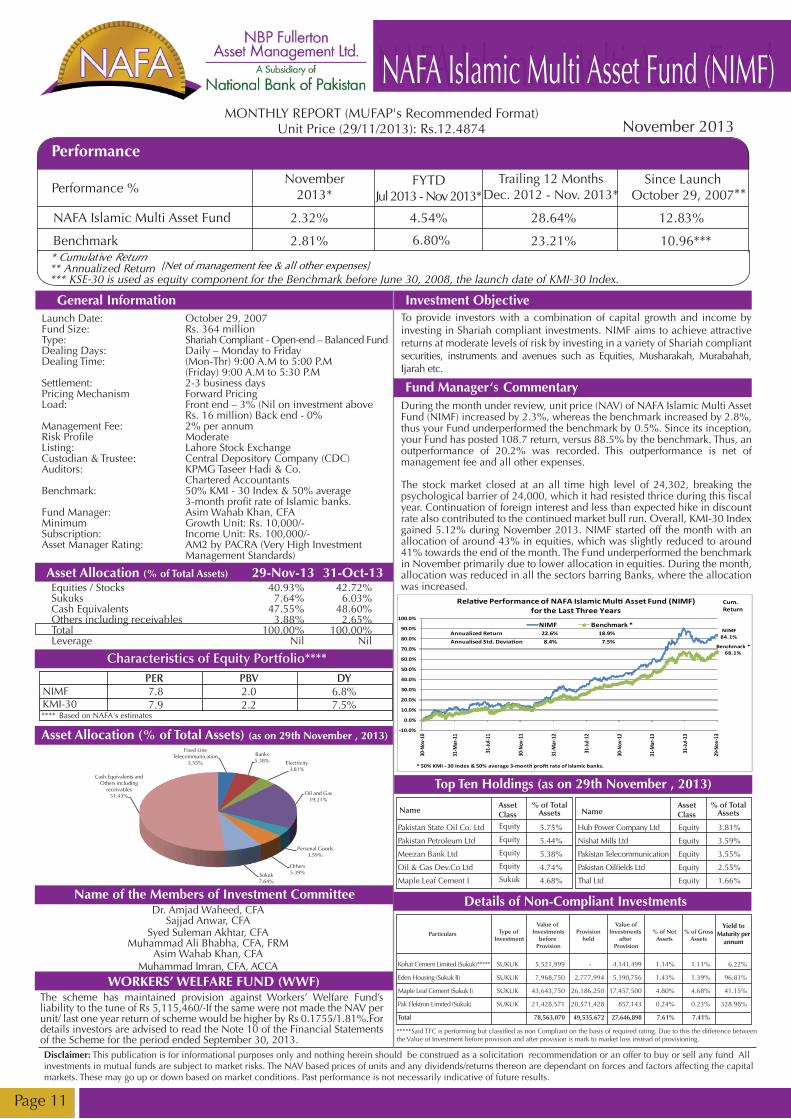
During the month under review, unit price (NAV) of NAFA Islamic Multi Asset Fund (NIMF) increased by 2.3%, whereas the benchmark increased by 2.8%, thus your Fund underperformed the benchmark by 0.5%. Since its inception, your Fund has posted 108.7 return, versus 88.5% by the benchmark. Thus, an outperformance of 20.2% was recorded. This outperformance is net of management fee and all other expenses.
The stock market closed at an all time high level of 24,302, breaking the psychological barrier of 24,000, which it had resisted thrice during this �scal year. Continuation of foreign interest and less than expected hike in discount rate also contributed to the continued market bull run. Overall, KMI-30 Index gained 5.12% during November 2013. NIMF started off the month with an allocation of around 43% in equities, which was slightly reduced to around 41% towards the end of the month. The Fund underperformed the benchmark in November primarily due to lower allocation in equities. During the month, allocation was reduced in all the sectors barring Banks, where the allocation was increased.
Pakistan State Oil Co. Ltd
Pakistan Petroleum Ltd
Meezan Bank Ltd
Oil & Gas Dev.Co Ltd
Maple Leaf Cement I
Kohat Cement Limited (Sukuk)*****
Eden Housing (Sukuk II)
Maple Leaf Cement (Sukuk I)
Pak Elektron Limited (Sukuk)
Total
5,521,999
7,968,750
43,643,750
21,428,571
78,563,070
-
2,777,994
26,186,250
20,571,428
49,535,672
1.14%
1.43%
4.80%
0.24%
7.61%
1.11%
1.39%
4.68%
0.23%
7.41%
6.22%
96.81%
41.15%
328.98%
Yield toMaturity per
annum
4,141,499
5,190,756
17,457,500
857,143
27,646,898
SUKUK
SUKUK
SUKUK
SUKUK
Hub Power Company Ltd
Nishat Mills Ltd
Pakistan Telecommunication
Pakistan Oil�elds Ltd
Thal Ltd
Equity
Equity
Equity
Equity
Equity
3.81%
3.59%
3.55%
2.55%
1.66%
Equity
Equity
Equity
Equity
Sukuk
5.75%
5.44%
5.38%
4.74%
4.68%
% of TotalAssets
% of TotalAssets
The scheme has maintained provision against Workers’ Welfare Fund’s liability to the tune of Rs 5,115,460/-If the same were not made the NAV per unit/ last one year return of scheme would be higher by Rs 0.1755/1.81%.For details investors are advised to read the Note 10 of the Financial Statements of the Scheme for the period ended September 30, 2013.
* Cumulative Return** Annualized Return*** KSE-30 is used as equity component for the Benchmark before June 30, 2008, the launch date of KMI-30 Index.
[Net of management fee & all other expenses]
Dr. Amjad Waheed, CFASajjad Anwar, CFA
Syed Suleman Akhtar, CFAMuhammad Ali Bhabha, CFA, FRM
Asim Wahab Khan, CFAMuhammad Imran, CFA, ACCA
FYTDJul 2013 - Nov 2013*
NIMF84.1%
Benchmark *68.1%
-10.0%
0.0%
10.0%
20.0%
30.0%
40.0%
50.0%
60.0%
70.0%
80.0%
90.0%
100.0%
30-N
ov-1
0
31-M
ar-1
1
31-Ju
l-11
30-N
ov-1
1
31-M
ar-1
2
31-Ju
l-12
30-N
ov-1
2
31-M
ar-1
3
31-Ju
l-13
NIMF Benchmark *Annualized Return 22.6% 18.9%
Annualised Std. Deviation 8.4% 7.5%
* 50% KMI - 30 Index & 50% average 3-month profit rate of Islamic banks.
Relative Performance of NAFA Islamic Multi Asset Fund (NIMF)for the Last Three Years
Cum. Return
29-N
ov-1
3
Fixed Line Telecommunication
3.55%
Banks5.38% Electricity
3.81%
Oil and Gas19.21%
Personal Goods3.59%
Others5.39%Sukuk
7.64%
Cash Equivalents and Others including
receivables51.43%

Page 12
,
* Cumulative Returns**Annualized Return
[Net of management fee & all other expenses]
‘
Launch Date: January 22, 2007Fund Size: Rs. 1,034 millionType: Open-end – Equity FundDealing Days: Daily – Monday to FridayDealing Time: (Mon-Thr) 9:00 A.M to 5:00 P.M (Friday) 9:00 A.M to 5:30 P.MSettlement: 2-3 business daysPricing Mechanism Forward PricingLoad: Front end – 3% (Nil on investment above Rs 16 million) Back end - 0%Management Fee: 2% per annumRisk Pro�le HighListing: Lahore Stock ExchangeCustodian & Trustee: Central Depository Company (CDC)Auditors: M. Yousuf Adil Saleem & Co. Chartered AccountantsBenchmark: KSE-30 IndexFund Manager: Asim Wahab khan, CFAMinimum Growth Unit: Rs. 10,000/-Subscription: Income Unit: Rs. 100,000/-Asset Manager Rating: AM2 by PACRA (very high investment management standards)
To provide investors with long term capital growth from an actively managed portfolio invested primarily in listed companies in Pakistan. The risk pro�le of the Fund will be moderate to high.
During the month under review, the benchmark increased by 5.0% whereas NAFA Stock Fund’s (NSF) unit price (NAV) increased by 5.9%, thus an outperformance of 0.9% was recorded. Since inception on January 22, 2007 your Fund has posted 139.9% return, versus 36.2% by the Benchmark. Thus, to date the cumulative outperformance of your Fund stands at 103.7%. This outperformance is net of management fee and all other expenses.
The stock market closed at an all time high level of 24,302, breaking the psychological barrier of 24,000, which it had resisted thrice during this �scal year. Continuation of foreign interest and less than expected hike in discount rate also contributed to the continued market bull run. NSF started off the month with an allocation of around 80% in equities, which was maintained during the month. The Fund outperformed the benchmark in November as the Fund’s key holdings in Banks, Fixed Line Telecommunication, and Personal Goods sectors outperformed the market. During the month, allocation was increased primarily in Banks, Electricity, Industrial Transportation and General Industrials sectors whereas it was reduced in all the other sectors.
November 2013
Trailing 12 MonthsDec. 2012-Nov. 2013*
November2013*
5.91%
5.01%
12.16%
12.57%
41.62%
35.94%
13.59%
4.61%
Equities / Stock Cash Equivalents Others including receivables Total Leverage
76.27%20.34%3.39%
100.00%Nil
80.46%13.99%5.55%
100.00%Nil
PER7.48.2
PBV1.82.1
DY6.5%6.7%
Bank Al-Falah Ltd
Bank AL-Habib Ltd
Kot Addu Power Co Ltd
Nishat Mills Ltd
Meezan Bank Ltd
Dr. Amjad Waheed, CFASajjad Anwar, CFA
Syed Suleman Akhtar, CFAAsim Wahab khan, CFA
Muhammad Imran, CFA, ACCA
Pakistan State Oil Co. Ltd
Oil & Gas Dev.Co Ltd
Pakistan Telecommunication Ltd
Pakistan Petroleum Ltd
Thal Ltd
7.53%
6.88%
6.01%
4.81%
4.74%
% of TotalAssets
% of TotalAssets
4.67%
4.02%
3.88%
3.72%
3.60%
29-Nov-13Asset Allocation (% of Total Assets) 31-Oct-13
Asset Allocation (% of Total Assets) (as on 29th November, 2013)
Top Ten Equity Holdings (as on 29th November, 2013)
Unit Price (29/11/2013): Rs.9.6919
The scheme has maintained provisions against Workers’ Welfare Fund’s liability to the tune of Rs 24,002,396 /-,If the same were not made the NAV per unit/ last one year return of scheme would be higher by Rs 0.2251 / 3.29%.For details investors are advised to read the Note 10 of the Financial Statements of the Scheme for the period ended September 30, 2013.
WORKERS’ WELFARE FUND (WWF)
FYTDJul 2013 - Nov 2013 *
NSF135.5%
Benchmark68.3%
Peers Avg.112.3%
-10.0%
10.0%
30.0%
50.0%
70.0%
90.0%
110.0%
130.0%
150.0%
30-N
ov-
10
28-F
eb-1
1
31-M
ay-1
1
31-A
ug-
11
30-N
ov-
11
29-F
eb-1
2
31-M
ay-1
2
31-A
ug-
12
30-N
ov-
12
28-F
eb-1
3
31-M
ay-1
3
31-A
ug-
13
NSF Benchmark Peers Avg.Annualized Return 33.0% 19.0% 28.5%Ann. Std. Deviation 14.2% 16.0% 14.2%
Relative Performance of NAFA Stock Fund (NSF)for the Last Three Years
Cum.Return
29-N
ov-
13
Construction and Materials
8.69%Oil and Gas15.15%
Banks21.73%
Fixed Line Telecommunication
3.88%
Personal Goods7.36%
Electricity8.90%
Chemicals4.13%
Others6.43%
Cash Equivalents and Others including
receivables23.73%

Page 13
NAFA Income FundNAFA Income Fund (NIF)
Credit Quality of the Portfolio as of November 29th, 2013 (% of Total Assets)
Top 10 TFC (as at November 29th, 2013)
WORKERS' WELFARE FUND (WWF)
General Information
Name of the Members of Investment Committee
Details of Non-Compliant Investments
Investment Objective
Fund Manager Commentary
Asset Allocation (% of Total Assets) 29-Nov-13
Dr. Amjad Waheed, CFASajjad Anwar, CFA
Muhammad Ali Bhabha, CFA, FRMSyed Suleman Akhtar, CFA
Name of TFC / SukukEngro Fertilizers Limited 30-NOV-07Standard Chartered Bank (Pakistan) Limited IVFaysal Bank LimitedSaudi Pak LeasingEden Housing (Sukuk II)Engro Fertilizer Limited (PPTFC)Bank Alfalah Limited (Floater)Allied Bank Limited IIWorld Call Telecom LimitedEngro Fertilizers Limited 17-DEC-09Total
% of Total Assets6.03%5.82%5.09%4.21%4.01%2.69%2.05%1.84%0.87%0.51%33.12%
Particulars
World Call Telecom Limited
Saudi Pak Leasing***
Eden Housing (Sukuk II)
Agritech Limited II
Agritech Limited V
New Allied Electronics (Sukuk II)
Total
***Said TFC is performing but classi�ed as Non-Compliant on the basis of required rating. Due to this the differencebetween the Value of Investment before provision and after provision is mark to market loss instead of provisioning.
29,982,002
43,523,040
31,875,000
149,875,800
22,180,000
49,054,371
326,490,213
25,484,702
-
11,111,976
149,875,800
22,180,000
49,054,371
257,706,848
4,497,300
21,761,520
20,763,024
-
-
-
47,021,845
0.88%
4.26%
4.06%
n/a
n/a
n/a
9.20%
0.87%
4.21%
4.01%
n/a
n/a
n/a
9.08%
34.07%
59.42%
96.81%
n/a
n/a
n/a
TFC
TFC
SUKUK
TFC
TFC
SUKUK
Type ofInvestment
Value of Investments
beforeProvision
Value of Investments
after Provision
%of Net Assets
%of GrossAssets
Yield to Maturity
per annum
Provisionheld
TFCs / Sukuks PIBs Placement with Banks Cash Equivalents Others including receivables Total Leverage
33.12%0.10%
19.33%45.13%2.32%
100.00%Nil
33.76%0.10%
14.70%49.57%1.87%
100.00%Nil
31-Oct-13
Launch Date: March 29, 2008Fund Size: Rs. 511 millionType: Open-end – Income FundDealing Days: Daily – Monday to FridayDealing Time: (Mon - Thr) 9:00 A.M to 5:00 P.M (Friday) 9:00 A.M to 5:30 P.MSettlement: 2-3 business daysPricing Mechanism: Forward PricingLoad: Front end: 1% (Nil on investment above Rs. 16 million), Back end: 0%Management Fee: 2.0% per annumRisk Pro�le: LowFund Stability Rating "A- (f)" by PACRAListing: Lahore Stock ExchangeCustodian & Trustee: MCB Financial Services LimitedAuditors: M. Yousuf Adil Saleem & Co. Chartered AccountantsBenchmark: 6-Month KIBOR Fund Manager: Muhammad Ali Bhabha, CFA, FRMMinimum Growth Unit: Rs. 10,000/-Subscription: Income Unit: Rs. 100,000/-Asset Manager Rating: AM2 by PACRA (Very High Investment Management Standards)
To earn a competitive rate of return while preserving capital to the extent possible by investing in liquid assets.
The Fund posted an annualized return of 4.9% during November 2013 versus the benchmark return of 9.7%. Subdued performance of the Fund during the month is due to mark to market loss in TFCs. The annualized return generated by the Fund in the CY-13 is 8.4% against the benchmark return of 9.4%.
As the allocation of the Fund shows, exposure in TFCs and Sukuks stand at 33.12%. The weighted average price of the TFC portfolio (excluding TFCs which are fully provided) is around Rs. 87 against the par value of Rs.100. All TFCs in the Fund are �oating rate instruments linked to KIBOR.
The weighted average Yield-to-Maturity of the Fund is around 15.90% p.a. while its weighted average time to maturity is 1.21 years. This yield does not include potential recovery in fully provided TFCs (Face Value of Rs. 221 million), which is potential upside for the Fund. Thus, the Fund is expected to perform well over the medium to long term horizon. However, since TFCs prices may go up or down, therefore, only investors with medium-term investment horizon are advised to invest in this Fund.
MONTHLY REPORT (MUFAP's Recommended Format)Unit Price (29/11/2013): Rs. 9.4200
Performance %
PerformanceNovember
2013 *
4.90%
9.75%
7.67%
9.35%
Trailing 12 MonthsDec 2012-Nov 2013*
FYTDJul 2013 - Nov 2013*
6.84%
9.43%
2.24%
11.76%
Since LaunchMarch 29, 2008 **
NAFA Income Fund
Benchmark
* Annualized Simple Return - ** (Annualized Return Based on Morningstar Methodology)(Returns are net of management fee & all other expenses)
November 2013
The scheme has maintained provisions against Workers' Welfare Fund's liability to the tune of Rs.2,647,585/-. If the same were not made the NAV per unit/ last one year return of scheme would be higher by Rs.0.0488/0.55%. For details investors are advised to read note 8 of the Financial Statements of the Scheme for the quarter ended September 30, 2013.
Govt. Securities (AAA rated), 0.10%
AAA, 6.10% AA+, 0.02%
AA, 2.98%
AA-, 50.70%
A & below,28.69%
D, 9.09%
Other including receivables, 2.32%

Page 14
NAFA Islamic Aggressive Income FundNAFA Islamic Aggressive Income Fund (NIAIF)
Performance
Performance %
Benchmark
Since LaunchOctober 29, 2007 **
NAFA Islamic Aggressive Income Fund
* Annualized Simple Return - ** (Annualized Return Based on Morningstar Methodology)(Returns are net of management fee & all other expenses)
November2013 *
7.03%
6.68%
5.21%
6.48%
Trailing 12 MonthsDec 2012-Nov 2013*
FYTDJul 2013 - Nov 2013*
8.59%
6.58%
5.18%
6.75%
General Information
Top 10 Sukuks (as at November 29th, 2013)
Name of the Members of Investment Committee
WORKERS' WELFARE FUND (WWF)
Credit Quality of the Portfolio as of November 29th, 2013 (% of Total Assets)
Investment Objective
Fund Manager Commentary
Dr. Amjad Waheed, CFASajjad Anwar, CFA
Muhammad Ali Bhabha, CFA, FRMSyed Suleman Akhtar, CFA
Muhammad Imran, CFA, ACCA
Asset Allocation (% of Total Assets) 29-Nov-13 31-Oct-13Sukuks GOP Ijara Sukuks - Govt. Backed Cash Equivalents Other including receivables Total Leverage
24.32%10.74%58.41%6.53%
100.00%Nil
24.86%16.55%52.10%6.49%
100.00%Nil
Launch Date: October 29, 2007Fund Size: Rs. 166 millionType: Open-end – Shariah Compliant Aggressive Income FundDealing Days: Daily – Monday to FridayDealing Time: (Mon - Thr) 9:00 A.M to 5:00 P.M (Friday) 9:00 A.M to 5:30 P.MSettlement: 2-3 business daysPricing Mechanism Forward PricingLoad: Front end: 1% (Nil on investment above Rs. 16 million), Back end: 0%Management Fee: 2.0% per annumRisk Pro�le: Low to MediumFund Stability Rating: "BBB+ (f)" by PACRAListing: Lahore Stock ExchangeCustodian & Trustee: MCB Financial Services LimitedAuditors: KPMG Taseer Hadi & Co. Chartered AccountantsBenchmark: Average 3-month deposit rate of Islamic BanksFund Manager: Muhammad Imran, CFA, ACCAMinimum Growth Unit: Rs. 10,000/-Subscription: Income Unit: Rs. 100,000/-Asset Manager Rating: AM2 by PACRA (Very High Investment Management Standards)
To seek maximum possible preservation of capital and a reasonable rate of return via investing primarily in Shariah Compliant money market & debt securities having good credit rating and liquidity.
During the month under review, the Fund posted an annualized return of 7.0% as compared to the benchmark return of 6.7%. Outperformance of the Fund during the month is due to the pro�t received from a non performing Sukuk of cement sector. During CY13 to date, the Fund has posted 8.0% annualized return versus 6.6% by the benchmark, hence an outperformance of 1.4% p.a.
The allocation in corporate Sukuks with current weightage at 24.32% is diversi�ed among Cement, Fertilizer and Consumer Electronics sub-sectors. Around 10.74% of the portfolio is allocated to AAA rated GoP Ijara Sukuks which coupled with 58.41% allocation in bank deposits provides diversi�-cation and liquidity to the portfolio. Going forward, the Fund intends to maintain the present allocation.
The weighted average Yield-to-Maturity (YTM) of the sukuk portfolio is around 17.89% p.a. and weighted average time to maturity is 1.52 years. The weighted average time to maturity of the Fund is 0.54 years. Hence, for investors with medium to long term investment horizon, the Fund offers an attractive opportunity to earn decent returns. However, since Sukuks prices may go up or down, therefore, only investors with medium-term investment horizon are advised to invest in this Fund.
Name of Sukuk
Engro Fertilizer Limited (Sukuk)Maple Leaf Cement (Sukuk I)GOP Ijarah (Sukuk X)Kohat Cement Limited (Sukuk)GOP Ijarah (Sukuk XI)GOP Ijarah (Sukuk XIII)GOP Ijarah (Sukuk VII)Pak Elektron Limited (Sukuk)Total
% of Total Assets
13.57%5.49%5.37%4.90%2.39%1.79%1.19%0.36%35.06%
Unit Price (29/11/2013): Rs. 8.9802MONTHLY REPORT (MUFAP's Recommended Format)
November 2013
The scheme has maintained provisions against Workers' Welfare Fund's liability to the tune of Rs.1,435,655/-. If the same were not made the NAV per unit/ last one year return of scheme would be higher by Rs.0.0776/0.94%. For details investors are advised to read note 7 of the Financial Statements of the Scheme for the quarter ended September 30, 2013.
GOP Ijarah Sukuk (AAA rated), 10.74%
AAA, 0.01%
AA, 0.33%
AA-, 0.02%
A, 58.05%
A-, 13.57%
BBB+ & below, 5.49%
D, 0.36%
Not Rated, 4.90%Other including
receivables, 6.53%

NAFA Income Opportunity FundNAFA Income Opportunity Fund (NIOF)
Page 15
Performance
Performance %
Benchmark
Since LaunchApril 22, 2006 **
NAFA Income Opportunity Fund
* Annualized Simple Return - ** (Annualized Return Based on Morningstar Methodology)(Returns are net of management fee & all other expenses)
7.05%
Trailing 12 MonthsDec 2012-Nov 2013*
FYTDJul 2013 - Nov 2013*
15.22%
9.43%
November2013 *
12.62%
9.76%
11.56%
9.35% 11.39%
General Information
Top 10 TFC/Sukuk Holdings (as at November 30th, 2013)
WORKERS' WELFARE FUND (WWF)
Name of the Members of Investment Committee
Details of Non-Compliant Investments
Credit Quality of the Portfolio as of November 30th, 2013 (% of Total Assets)
Investment Objective
Fund Manager Commentary
Asset Allocation (% of Total Assets) 30-Nov-13
Dr. Amjad Waheed, CFASajjad Anwar, CFA
Muhammad Ali Bhabha, CFA, FRMSyed Suleman Akhtar, CFA
Muhammad Imran, CFA, ACCA
TFCs / Sukuks Placement with Banks Equity Cash Equivalents Others including receivables Total Leverage
26.93%12.28%2.23%
36.16%22.40%
100.00%Nil
28.79%7.55%2.18%
37.43%24.05%
100.00%Nil
31-Oct-13
Name of TFCs / SukuksEngro Fertilizer Limited (PPTFC)Maple Leaf Cement (Sukuk I)Bank Alfalah Limited VAvari Hotels LimitedAllied Bank Limited IIBRR Guardian ModarabaEngro Fertilizer LimitedSaudi Pak LeasingKohat Cement Limited (Sukuk)World Call Telecom LimitedTotal
6.25%5.72%4.18%2.61%2.61%1.27%1.04%0.89%0.85%0.59%
26.01%
% of Total Assets
Launch Date: April 22, 2006Fund Size: Rs. 1,954 millionType: Open-end – Income FundDealing Days: Daily – Monday to SaturdayDealing Time: (Mon - Thr) 9:00 A.M to 5:00 P.M (Friday) 9:00 A.M to 5:30 P.M (Saturday) 9:00 A.M to 1:00 P.MSettlement: 2-3 business daysPricing Mechanism: Forward PricingLoad: Front end: 0%, Back end: 0%Management Fee: 1.5% per annumRisk Pro�le: LowFund Stability Rating: "BBB+(f)" by PACRAListing: Lahore Stock ExchangeCustodian & Trustee: Central Depository Company (CDC)Auditors: KPMG Taseer Hadi & Co. Chartered AccountantsBenchmark: 6-Month KIBORFund Manager: Muhammad Imran, CFA, ACCAMinimum Growth Unit: Rs. 10,000/-Subscription: Income Unit: Rs. 100,000/-Asset Manager Rating: AM2 by PACRA (Very High Investment Management Standards)
To seek preservation of Capital and earn a reasonable rate of return via investing in money market and debt securities with investment-grade rating, CFS and spread transactions.
The Fund posted an annualized return of 12.6% during November 2013 as compared to the benchmark return of 9.8%. Outperformance of the Fund during the month is due to the pro�t received from a non performing Sukuk of cement sector. During the last one year the Fund has outperformed its benchmark by 5.8% by earning an annualized return of 15.2%.
Weighted average price of the TFC portfolio (excluding TFCs which are fully provided) is Rs. 79.48 against the par value of Rs. 100. The weighted average Yield to Maturity of the Fund is around 14.19% p.a. and that of the TFC portfolio is 24.59% p.a. The weighted average time to maturity of the Fund is about 1.27 years. The Fund's sector allocation is fairly diversi�ed with exposure to Chemical, Banking, Construction & Material, Travel & Leisure and Financial Services sub-sectors. TFC portfolio of the Fund is predominantly �oating rate linked to KIBOR. Therefore, in case of increase in interest rates, the coupon income of the Fund will improve. However, since TFCs prices may go up or down, therefore, only investors with medium-term investment horizon are advised to invest in this Fund.
Particulars
***Said TFCs are performing but classi�ed as Non-Compliant on the basis of required rating. Due to this the difference betweenthe Value of Investment before provision and after provision is mark to market loss instead of provisioning.
BRR Guardian Modaraba***
Escort Investment Bank Limited***
Kohat Cement Limited (Sukuk)***
Saudi Pak Leasing***
World Call Telecom Limited
Eden Housing (Sukuk II)
Maple Leaf Cement (Sukuk I)
Pak Elektron Limited (Sukuk)
Agritech Limited I
Agritech Limited V
Azgard Nine Limited III
Azgard Nine Limited V
Dewan Cement Limited
Gharibwal Cement Limited (PPTFC)
New Allied Electronics (PPTFC)
New Allied Electronics (Sukuk II)
PACE Pakistan Limited
Azgard Nine Limited (Non-Voting Ordinary Shares)
Agritech Limited Shares
Total
SUKUK
TFC
SUKUK
TFC
TFC
SUKUK
SUKUK
SUKUK
TFC
TFC
TFC
TFC
TFC
TFC
TFC
SUKUK
TFC
Equity
Equity
41,250,000
4,995,960
27,609,995
43,523,040
96,370,722
14,662,500
349,150,000
51,428,571
149,860,200
32,320,000
108,376,850
82,180,000
150,000,000
24,355,500
31,706,536
44,148,934
149,820,000
12,854
141,403,150
1,543,174,812
-
-
-
-
81,915,114
5,111,509
209,490,000
49,371,428
149,860,200
32,320,000
108,376,850
82,180,000
150,000,000
24,355,500
31,706,536
44,148,934
149,820,000
12,854
86,902,336
1,205,571,261
30,937,500
3,683,801
20,707,496
21,761,520
14,455,608
9,550,991
139,660,000
2,057,143
-
-
-
-
-
-
-
-
-
-
54,500,814
297,314,874
1.58%
0.19%
1.06%
1.11%
0.74%
0.49%
7.15%
0.11%
n/a
n/a
n/a
n/a
n/a
n/a
n/a
n/a
n/a
n/a
2.79%
15.21%
1.27%
0.15%
0.85%
0.89%
0.59%
0.39%
5.72%
0.08%
n/a
n/a
n/a
n/a
n/a
n/a
n/a
n/a
n/a
n/a
2.23%
12.17%
47.23%
18.00%
6.22%
59.35%
33.99%
96.77%
41.08%
328.48%
n/a
n/a
n/a
n/a
n/a
n/a
n/a
n/a
n/a
n/a
n/a
Type ofInvestment
Value of Investments
before Provision
Value of Investments
after Provision
% of Net
Assets
% ofGrossAssets
Yield to Maturity
per annum
Provisionheld
Unit Price (30/11/2013): Rs. 10.5077MONTHLY REPORT (MUFAP's Recommended Format)
November 2013
The scheme has maintained provisions against Workers' Welfare Fund's liability to the tune of Rs.16,781,889/-. If the same were not made the NAV per unit/ last one year return of scheme would be higher by Rs. 0.0902/0.99%. For details investors are advised to read note 8 of the Financial Statement of the Scheme for the quarter ended September 30, 2013.
AAA, 0.14% AA+, 0.13% AA, 3.36%
AA-, 27.95%
A+, 0.01%
A, 18.89%A-, 14.95%
BBB+ & below, 5.87%
D, 3.22%
Equity (Un-rated) , 2.23%
NR & Other including receivables, 23.25%
Page 16
Disclaimer: This publication is for informational purposes only and nothing herein should be construed as a solicitation, recommendation or an offer to buy or sell any Pension fund. All investments in Pension funds are subject to market risks. The NAV based prices of units and any dividends/returns thereon are dependant on forces and factors affecting the capital markets. These may go up or down based on market conditions. Past performance is not necessarily indicative of future results.
NAFA Pension FundNAFA Pension Fund (NPF)
Dr. Amjad Waheed, CFASajjad Anwar, CFA
Muhammad Ali Bhabha, CFA, FRM, Syed Suleman Akhtar, CFA, Asim Wahab Khan, CFA, Muhammad Imran, CFA, ACCA
Salman Ahmed
NPF-Equity Sub-fund*
NPF-Debt Sub-fund**
NPF-Money Market Sub-fund**
45
42
39
111.5210
104.1380
104.0006
6.01%
6.10%
6.47%
10.43%
7.12%
6.73%
NAV Per Unit (Rs.)November 29, 2013 November 2013
Since LaunchJuly 02, 2013
Fund Size(Rs. in mn)
Asset Allocation (% of Total Assets)
29-Nov-13 31-Oct-13Equity Sub-fund
WORKERS' WELFARE FUND (WWF)
Credit Quality of the Portfolio as on 29th November, 2013
Government Securities (AAA rated)AAAAA+AAAA-AOthersTotal
EquityCash EquivalentsOthersTotal
87.32%10.43%2.25%
100.00%
88.99%7.80%3.21%
100.00%
58.25%5.52%
28.91%0.47%3.69%1.85%1.31%
100.00%
72.97%-
1.83%24.38%
--
0.82%100.00%
Debt Money Market
To provide a secure source of savings and regular income after retirement tothe Participants.
MONTHLY REPORT (MUFAP's Recommended Format) November 2013
NPF has maintained provisions against Workers’ Welfare Fund’s liability inindividual sub-Funds as stated below:
* Cumulative Return
**Simple Annualized Return [Net of management fee & all other expenses]
Cash EquivalentsTFC/SukukT-BillsOthersTotal
28.91%11.53%58.25%1.31%
100.00%
22.91%12.62%63.32%1.15%
100.00%29-Nov-13 31-Oct-13Money Market Sub-fund
Cash EquivalentsT-BillsOthersTotal
26.21%72.97%0.82%
100.00%
22.22%77.08%0.70%
100.00%
Equity Sub Fund Asset Allocation (% of Total Assets)(as on 29th November, 2013)
Equity Sub-Fund
Debt Sub-Fund
Money Market Sub-Fund
81,244
27,908
26,118
0.2012
0.0688
0.0694
0.20%
0.17%
0.17%
Since Inception
return would
otherwise have
been higher by:
Amount Per
Unit
Rs
Total amountProvided uptil
November 29, 2013
1
1 Cumulative, For details investors are advised to read the Note 7 of the Financial Statements of the Scheme for the period ended September 30, 2013.
2
2 Annualized
2
NAFA launched its open-end Voluntary Pension Scheme, NAFA Pension Fund (NPF), this July with the objective of providing a secure source of savings and regular income after retirement to the Participants.
During the month of November:
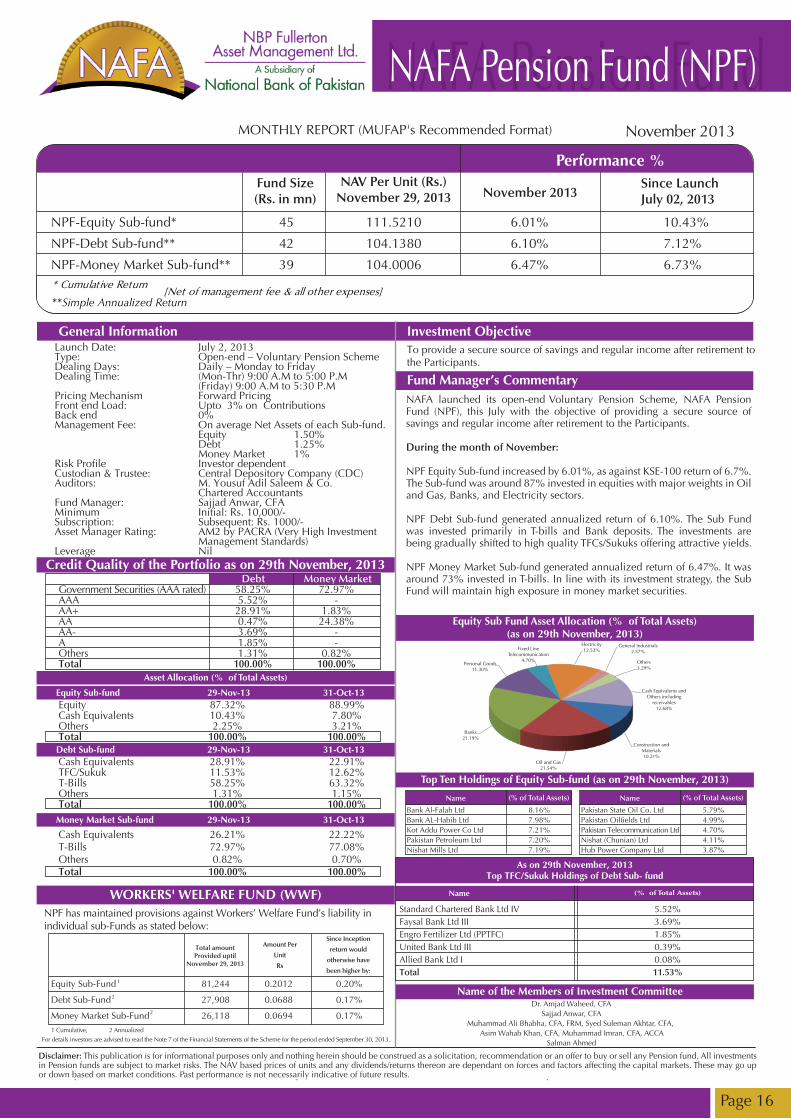
NPF Equity Sub-fund increased by 6.01%, as against KSE-100 return of 6.7%. The Sub-fund was around 87% invested in equities with major weights in Oil and Gas, Banks, and Electricity sectors.
NPF Debt Sub-fund generated annualized return of 6.10%. The Sub Fund was invested primarily in T-bills and Bank deposits. The investments are being gradually shifted to high quality TFCs/Sukuks offering attractive yields.
NPF Money Market Sub-fund generated annualized return of 6.47%. It was around 73% invested in T-bills. In line with its investment strategy, the Sub Fund will maintain high exposure in money market securities.
Standard Chartered Bank Ltd IV Faysal Bank Ltd III Engro Fertilizer Ltd (PPTFC) United Bank Ltd III Allied Bank Ltd I Total
5.52%3.69%1.85%0.39%0.08%11.53%
As on 29th November, 2013Top TFC/Sukuk Holdings of Debt Sub- fund
Name (% of Total Assets)
29-Nov-13 31-Oct-13Debt Sub-fund
Bank Al-Falah LtdBank AL-Habib Ltd Kot Addu Power Co LtdPakistan Petroleum LtdNishat Mills Ltd
8.16%7.98%7.21%7.20%7.19%
(% of Total Assets)
Pakistan State Oil Co. Ltd Pakistan Oil�elds Ltd Pakistan Telecommunication LtdNishat (Chunian) Ltd Hub Power Company Ltd
5.79%4.99%4.70%4.11%3.87%
(% of Total Assets)
Top Ten Holdings of Equity Sub-fund (as on 29th November, 2013)
Name of the Members of Investment Committee
Fund Manager’s Commentary
General Information Investment Objective
Performance %
Launch Date: July 2, 2013 Type: Open-end – Voluntary Pension SchemeDealing Days: Daily – Monday to FridayDealing Time: (Mon-Thr) 9:00 A.M to 5:00 P.M (Friday) 9:00 A.M to 5:30 P.MPricing Mechanism Forward Pricing Front end Load: Upto 3% on Contributions Back end 0% Management Fee: On average Net Assets of each Sub-fund. Equity 1.50% Debt 1.25% Money Market 1%Risk Pro�le Investor dependent Custodian & Trustee: Central Depository Company (CDC)Auditors: M. Yousuf Adil Saleem & Co. Chartered Accountants Fund Manager: Sajjad Anwar, CFA Minimum Initial: Rs. 10,000/- Subscription: Subsequent: Rs. 1000/- Asset Manager Rating: AM2 by PACRA (Very High Investment Management Standards) Leverage Nil
Construction and Materials10.21%
Oil and Gas21.54%
Banks21.19%
Personal Goods11.30%
Fixed Line Telecommunication
4.70%
Electricity12.52%
General Industrials2.57%
Others3.29%
Cash Equivalents and Others including
receivables12.68%

Page 17
NAFA Islamic Pension FundNAFA Islamic Pension Fund (NIPF)
Disclaimer: This publication is for informational purposes only and nothing herein should be construed as a solicitation, recommendation or an offer to buy or sell any Pension fund. All investments in Pension funds are subject to market risks. The NAV based prices of units and any dividends/returns thereon are dependant on forces and factors affecting the capital markets. These may go up or down based on market conditions. Past performance is not necessarily indicative of future results.
Total amountProvided uptil
November 29, 2013
Nishat Mills Ltd Meezan Bank LtdPakistan Petroleum LtdPakistan Oil�elds Ltd Pakistan State Oil Co. Ltd.
8.98%8.68%8.34%7.51%7.34%
(% of Total Assets)
Oil & Gas Dev.Co LtdHub Power Company LtdFauji Fertilizer Co LtdPakistan Telecommunication LtdThal Ltd
7.27%7.19%6.74%5.63%4.94%
(% of Total Assets)
GOP Ijarah (Sukuk XI) -Total
81.16% -81.16%
(% of Total Assets)
GOP Ijarah (Sukuk XI) -Total
12.46% -12.46%
(% of Total Assets)
Dr. Amjad Waheed, CFASajjad Anwar, CFA
Muhammad Ali Bhabha, CFA, FRM, Syed Suleman Akhtar, CFA, Asim Wahab Khan, CFA, Muhammad Imran, CFA, ACCA
Salman Ahmed
Performance %
NIPF-Equity Sub-fund*
NIPF-Debt Sub-fund**
NIPF-Money Market Sub-fund**
37
34
32
109.0549
104.1587
103.7215
5.14%
11.82%
6.04%
8.27%
7.73%
6.70%
NAV Per Unit (Rs.)November 29, 2013 November 2013
Since LaunchJuly 02, 2013
Fund Size(Rs. in mn)
General Information
Asset Allocation (% of Total Assets)
29-Nov-13 31-Oct-13Equity Sub-fund
WORKERS' WELFARE FUND (WWF)
Investment Objective
Fund Manager’s Commentary
Credit Quality of the Portfolio (as on 29th November, 2013)
EquityCash EquivalentsOthersTotal
89.45%8.10%2.45%
100.00%
89.47%7.66%2.87%
100.00%
Launch Date: July 2, 2013 Type: Open-end – Shariah Compliant Voluntary Pension SchemeDealing Days: Daily – Monday to Friday Dealing Time: (Mon-Thr) 9:00 A.M to 5:00 P.M (Friday) 9:00 A.M to 5:30 P.M Pricing Mechanism Forward Pricing Front end Load: Upto 3% on Contributions Back end 0% Management Fee: On average Net Assets of each Sub-fund. Equity 1.50% Debt 1.25% Money Market 1% Risk Pro�le Investor dependent Custodian & Trustee: Central Depository Company (CDC)Auditors: M. Yousuf Adil Saleem & Co. Chartered Accountants Fund Manager: Sajjad Anwar, CFA Minimum Initial: Rs. 10,000/- Subscription: Subsequent: Rs. 1,000/- Asset Manager Rating: AM2 by PACRA (Very High Investment Management Standards) Leverage Nil
To provide a secure source of savings and regular income after retirement tothe Participants.
MONTHLY REPORT (MUFAP's Recommended Format) November 2013
NIPF has maintained provisions against Workers’ Welfare Fund’s liability inindividual Sub-funds as stated below:
* C
Simple Annualized Return
umulative Return
**[Net of management fee & all other expenses]
29-Nov-13 31-Oct-13Debt Sub-fund
Cash EquivalentsSukuksOthersTotal
17.87%81.16%0.97%
100.00%
14.01%81.86%4.13%
100.00%29-Nov-13 31-Oct-13Money Market Sub-fund
Cash EquivalentsSukuksOthersTotal
86.94%12.46%0.60%
100.00%
5.44%90.27%4.29%
100.00%
Equity Sub Fund Asset Allocation (% of Total Assets)(as on 29th November, 2013)
Top Ten Holdings of Equity Sub-fund (as on 29th November, 2013)
Name of the Members of Investment CommitteeEquity Sub-Fund
Debt Sub-Fund
Money Market Sub-Fund
62,277
26,300
22,927
0.1843
0.0799
0.0745
0.18%
0.19%
0.18%
Since Inception
return would
otherwise have
been higher by:
Amount Per
Unit
Rs
1
1 Cumulative, For details investors are advised to read the Note 7 of the Financial Statements of the Scheme for the period ended September 30, 2013.
2
2 Annualized
2
Government Securities (AAA rated)AAAAA+OthersTotal
81.16%2.30%
15.57%0.97%
100.00%
12.46%2.24%
84.70%0.60%
100.00%
Debt Money Market
NAFA launched its Islamic open-end Voluntary Pension Scheme, NAFA Islamic Pension Fund (NIPF), this July with the objective of providing a secure source of shariah compliant savings and regular income after retirement to the Participants.
During the month of November:
NIPF Equity Sub-fund generated a return of 5.14% compared with KMI-30 Index, which increased by 5.12%. The Sub-fund was around 89% invested in equities with major weights in Oil and Gas, Construction and Materials, and Personal Goods sectors.
NIPF Debt Sub-fund generated annualized return of 11.82%. The Sub Fund was invested primarily in GoP Ijara Sukuks and Islamic bank deposits.
NIPF Money Market Sub-fund generated annualized return of 6.04%. The Sub Fund was invested primarily in short-term GoP Ijara Sukuks and Islamic bank deposits.
Top Holdings of Debt Sub-fund
Top Holdings of Money Market Sub-fundAs on 29th November, 2013
Construction and Materials12.97%
Oil and Gas30.46%
Banks8.68%
Fixed Line Telecommunication
5.63%
Chemicals6.74%
Electricity7.19% Personal Goods
8.98%
Others8.80%
Cash Equivalent and Others including
receivables10.55%

![World Bank Documentdocuments.worldbank.org/curated/en/223501528135196333/pdf/Turkey-Gas... · NBP National Balancing Point NGML Natural Gas Market Law ... Trust Funds [ ] Parallel](https://img.pdfslide.us/doc/110x75/5e7f8df7c83b66621b1385e8/world-bank-nbp-national-balancing-point-ngml-natural-gas-market-law-trust-funds.jpg)