Embed Size (px)
Citation preview
1 POVERTY REDUCTION AND ECONOMIC MANAGEMENT (PREM) NETWORK www.worldbank.org/economicpremise
NOVEMBER 2013 • Number 128
Making Trade Policy More Transparent: A New Database of Non-Tariff Measures
As tariff levels have reached all-time lows in recent decades, non-tariff measures (NTMs) have taken a central role in the international trade agenda. In a nutshell, NTMs are all types of trade regulations, other than tariffs, that directly or indirectly affect international trade. The World Trade Organization (WTO) recognizes the right of countries to intro-duce trade regulations to achieve legitimate objectives not related to trade, such as consumer health protection and food safety. However, NTMs can be hijacked and used as protectionist tools that can potentially drive up trade costs, divert managerial attention, and penalize small exporters—regardless of an NTM’s original intent. In the face of fragmented, inconsistent, and largely unavailable data on NTMs, the World Bank is at the forefront of an inter-institutional effort to codify, harmonize, and disseminate information on NTMs and their economic impacts. The goal is to increase policy makers awareness of NTMs and help them better understand not only the impacts of their main trading partners’ NTMs, but also of their own NTM policies on competitiveness, prices, and welfare.
The “New Frontier” of Trade Policy
NTMs, which tend to be less transparent than tariffs, have increasingly become the primary policy tool through which governments affect trade. Though most NTMs respond to the rising public demand for traceability and protection against health and environmental hazards, some are imposed for protectionist purposes. NTMs that are unnecessary, com-plicated, or poorly designed can negatively impact the quan-tity of goods traded, increase prices and harm competitive-ness, yet, at the same time, they also may serve legitimate policy objectives. Thus, their diversity and complexity truly make them the “new frontier” of trade policy (Cadot and Malouche 2012), as important in their content as in their manner of implementation. Furthermore, as NTMs encom-pass any policy measure that has an impact on trade but is not a tariff, their trade restrictiveness is only loosely moni-tored by WTO disciplines.
Mariem Malouche, José-Daniel Reyes, and Amir Fouad
Most information pertaining to the use of NTMs has emerged in the wake of the 2008–9 financial crisis. The WTO has released biannual reports since the outbreak of the crisis that monitor the use of trade-restrictive measures, in-cluding NTMs, implemented by G20 countries. Similarly, the Global Trade Alert (GTA), a network of think tanks coor-dinated by the Centre for Economic Policy Research, has kept track of trade-distorting measures implemented by both G20 and non-G20 countries since late 2008.1 Both sources report that G20 countries are continuing to introduce new trade-distorting measures in 2013, adding to the stock of measures put in place since the outbreak of the financial crisis. Al-though antidumping cases and other trade remedy investiga-tions remain the most frequently used trade-restrictive mea-sures among the G20, NTMs have been a prominent instrument in many countries’ trade policy arsenals over the last few years. Initiation of post-crisis NTMs peaked during
2 POVERTY REDUCTION AND ECONOMIC MANAGEMENT (PREM) NETWORK www.worldbank.org/economicpremise
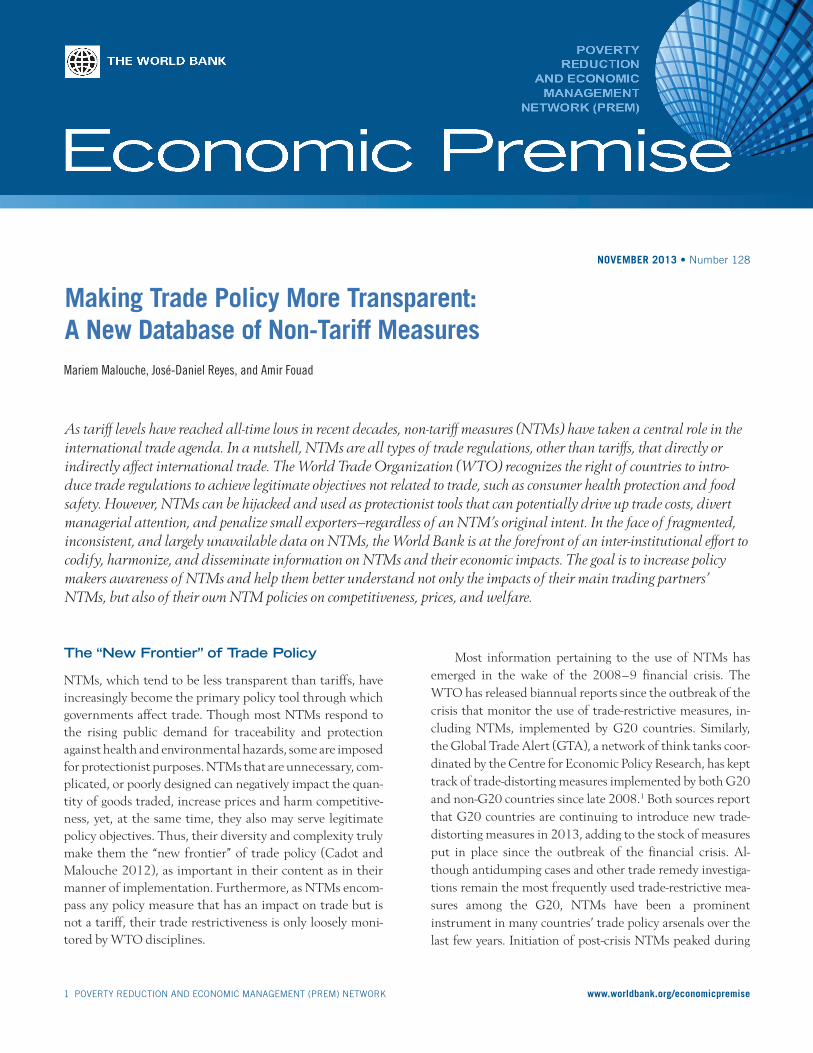
mid-2010 to mid-2012, when they accounted for over one-third of newly introduced trade-distorting measures (figure 1). According to the GTA, “governments have become very creative in evading WTO disciplines” (Evenett 2013).
The latest WTO monitoring report indicates that import requirements and restrictions persist as the most commonly introduced NTMs, at just over 25 percent of all such mea-sures implemented by G20 countries since the crisis began, and nearly 30 percent of such measures since October 2011 (figure 2). Furthermore, only 15.4 percent of G20-imposed NTMs have been removed to date, or are scheduled to be re-moved (WTO 2013). Argentina’s 20 NTMs since October 2011—mostly in the form of new import and export require-ments—make it the most prolific introducer of new NTMs over the last two years, while its total stock of post-crisis NTMs is surpassed only by India, and trailed closely by Indo-nesia and China (WTO 2013).
In addition to technical import requirements that act as trade barriers, legislation related to national preference is also on the rise in emerging-market G20 countries, with Brazil and India accounting for nearly half of such measures. These laws include “buy national” provisions, tax exemptions and price preferences for products with locally produced inputs, as well as discriminatory public procurement policies. In Jan-uary 2013, for example, Brazil stipulated preference in gov-ernment procurement for locally produced vehicles, and did the same for information technology products four months later (although the latter NTM is explicitly time bound). On one hand, policies like these can be interpreted as protection-ist attempts to nurture domestic industry; on the other hand, they are sometimes couched in explicit language to the con-trary, as in the case of India’s prioritization of locally produced electronic products “due to security considerations.”
As has been true since the beginning of the financial cri-sis, NTMs on exports continue to account for nearly one-third of G20-imposed NTMs. About half of export-related NTMs come in the form of technical requirements or re-strictions (primarily on agricultural products), and the vast majority of all post-crisis export NTMs have been imple-
mented by Argentina, China, and India. In Argentina’s case, the restrictions are mainly detailed, technical lists of “crite-rion” and “reference” values for myriad agricultural and min-eral products. Conversely, the latter two countries are more frequent users of export quotas (for example, rare-earth minerals in China) and bans (for example, on wheat, rice, onions, and edible oils in India). Tax rebates and other ex-port incentives account for approximately 6 percent of NTMs implemented since late 2011, most recently by Brazil for its production of motor vehicles.
The Need for Data Transparency
Most countries do not have a unique repository for NTM data because laws and regulations affecting trade are often promul-gated by different government agencies and regulatory bodies. Traders struggle to keep tabs on the latest measures affecting the goods they import and export, while policy makers find it difficult to identify areas for reform in their efforts to improve the domestic business environment for traders. Furthermore, NTMs are often conflated with more explicit “non-tariff barri-ers,”2 leading to calls for their complete removal. But given the legality or potential legitimacy of NTMs, the onus for policy makers should be not on suppression, but instead on lessening the trade restrictiveness of NTMs in general, and on reducing their administrative burden on users. Unfortunately, NTM data are typically fragmented and incomplete, plagued by a lack of a shared terminology, insufficient country coverage, and inconsistent collection procedures (WTO 2012). The longtime lack of a standard definition and absence of a global database have proven to be continuing impediments to effec-tively addressing the negative impacts of NTMs.
0510152025303540
01020304050607080
June 2009–May 2010
June 2010–May 2011
June 2011–May 2012
June 2012–May 2013
% o
f tot
al
# of
NTM
s
NTMsNTM share of total trade-restrictive measures
Figure 1. Number of NTMs Implemented by the G20 since June 2009
Source: Authors’ calculations using data from WTO (2013).
Figure 2. New G20 NTMs, October 2011 – May 2013
Source: Authors’ calculations using data from WTO (2013).a. Includes new import requirements, registration, “criterion” and “reference” values, and new administrative procedures. b. Includes new export requirements, registration, “criterion” and “reference” values, and new administrative procedures.c. Includes inspections, tariff rate quotas, and licensing and other requirements applied to both imports and exports.d. Includes tax refunds, tax breaks, and export financing.
export bans, 3%export incentives,d 6%
export quotas, 6%
import licensing, 6%
import quotas, 6%
other,c 10%
export restrictions,b
16%
national preference,
17%
import restrictions,a
29%
3 POVERTY REDUCTION AND ECONOMIC MANAGEMENT (PREM) NETWORK www.worldbank.org/economicpremise
In addition to its post-crisis monitoring of G20 coun-tries, the WTO has a trade policy notification system, though not one intended to compile a comprehensive database of any kind. Rather, WTO notifications act as a forum for partner countries to see drafts of regulations when amendments are still possible. Consequently, the WTO’s more than 200 dif-ferent notification requirements—which regrettably exclude NTMs such as finance measures, distribution restrictions, or restrictions on post-sale services—are noncompulsory to begin with and include no penalty for noncompliance (Bacchetta, Richtering, and Santana 2012).3 Meanwhile, the aforemen-tioned GTA maintains a list of every state initiative that has potential implications for foreign commercial interests, from those “as broad in scope as a state budget…or as narrow as a tariff increase on a single product” (Evenett 2009). While the GTA initiative provides greater transparency and monitoring of trade policy instruments, including NTMs, its extensive scope and lack of a codified classification system do little to fill the void of a comprehensive, NTM-specific data source based on a unified definition.
In 2006, the United Nations Conference on Trade and Development (UNCTAD) initiated a more ambitious and promising initiative on NTM data collection. It commis-sioned the Multi-Agency Support Team (MAST)4 to discuss the definition, classification, collection, and quantification of NTMs. A multiagency effort known as Transparency in Trade (TNT) was subsequently launched to improve the collection,
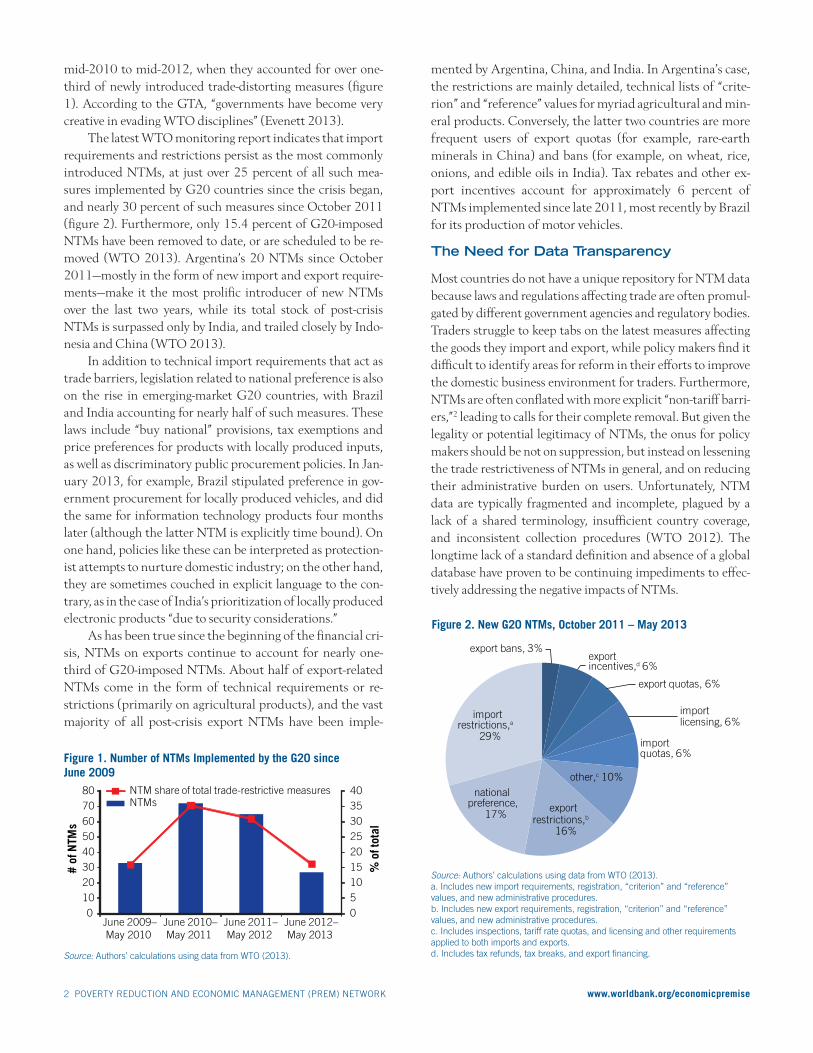
uniformity and availability of NTM data, as well as to mini-mize inconsistencies within existing data. Since 2009, local consultants have been tasked with drawing up NTM invento-ries in collaboration with ministries and agencies in 48 coun-tries (figure 3). Under the stewardship of UNCTAD, the data are scrutinized for possible duplications, omissions or any other problems to minimize inaccuracies, and then undergo verification and formatting.
The data collection is a work in progress. As more re-searchers work with the data, the cleaning process has been improving, but some deficiencies remain as a result of the heterogeneity in terms of the way the data are collected. In addition, researchers should be aware that many trade-relat-ed policies appearing in inventories are not binding, and thus have no observable effect on trade (for example, lower-ing the quantities traded or raising import prices), but as non-tariff trade policies they have been included in the data-base as NTMs. Nevertheless, although not yet perfect, the data collected by the TNT initiative constitute the best available information on NTM coverage levels across 46 de-veloping countries, plus the European Union and Japan.5 Due to their uniform classification system, the data allow for cross-country comparisons as well as long-term capacity building. Data for 33 of the countries have been made pub-licly available in the World Integrated Trade Solution (WITS) database, a free Web-based database hosted by the World Bank.6
Figure 3. Countries with NTM Data Collected
Source: Authors’ illustration.Note: Color coded by World Bank Region.
4 POVERTY REDUCTION AND ECONOMIC MANAGEMENT (PREM) NETWORK www.worldbank.org/economicpremise
Quantifying NTMs
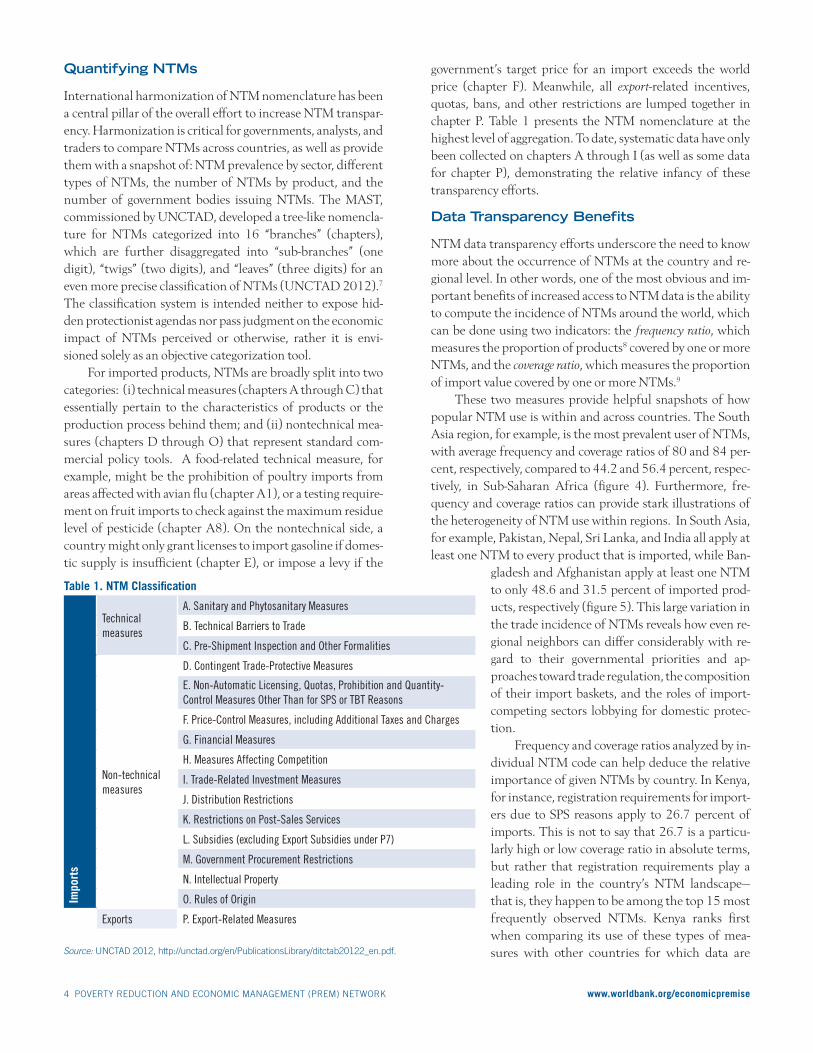
International harmonization of NTM nomenclature has been a central pillar of the overall effort to increase NTM transpar-ency. Harmonization is critical for governments, analysts, and traders to compare NTMs across countries, as well as provide them with a snapshot of: NTM prevalence by sector, different types of NTMs, the number of NTMs by product, and the number of government bodies issuing NTMs. The MAST, commissioned by UNCTAD, developed a tree-like nomencla-ture for NTMs categorized into 16 “branches” (chapters), which are further disaggregated into “sub-branches” (one digit), “twigs” (two digits), and “leaves” (three digits) for an even more precise classification of NTMs (UNCTAD 2012).7
The classification system is intended neither to expose hid-den protectionist agendas nor pass judgment on the economic impact of NTMs perceived or otherwise, rather it is envi-sioned solely as an objective categorization tool.
For imported products, NTMs are broadly split into two categories: (i) technical measures (chapters A through C) that essentially pertain to the characteristics of products or the production process behind them; and (ii) nontechnical mea-sures (chapters D through O) that represent standard com-mercial policy tools. A food-related technical measure, for example, might be the prohibition of poultry imports from areas affected with avian flu (chapter A1), or a testing require-ment on fruit imports to check against the maximum residue level of pesticide (chapter A8). On the nontechnical side, a country might only grant licenses to import gasoline if domes-tic supply is insufficient (chapter E), or impose a levy if the
government’s target price for an import exceeds the world price (chapter F). Meanwhile, all export-related incentives, quotas, bans, and other restrictions are lumped together in chapter P. Table 1 presents the NTM nomenclature at the highest level of aggregation. To date, systematic data have only been collected on chapters A through I (as well as some data for chapter P), demonstrating the relative infancy of these transparency efforts.
Data Transparency Benefits
NTM data transparency efforts underscore the need to know more about the occurrence of NTMs at the country and re-gional level. In other words, one of the most obvious and im-portant benefits of increased access to NTM data is the ability to compute the incidence of NTMs around the world, which can be done using two indicators: the frequency ratio, which measures the proportion of products8 covered by one or more NTMs, and the coverage ratio, which measures the proportion of import value covered by one or more NTMs.9
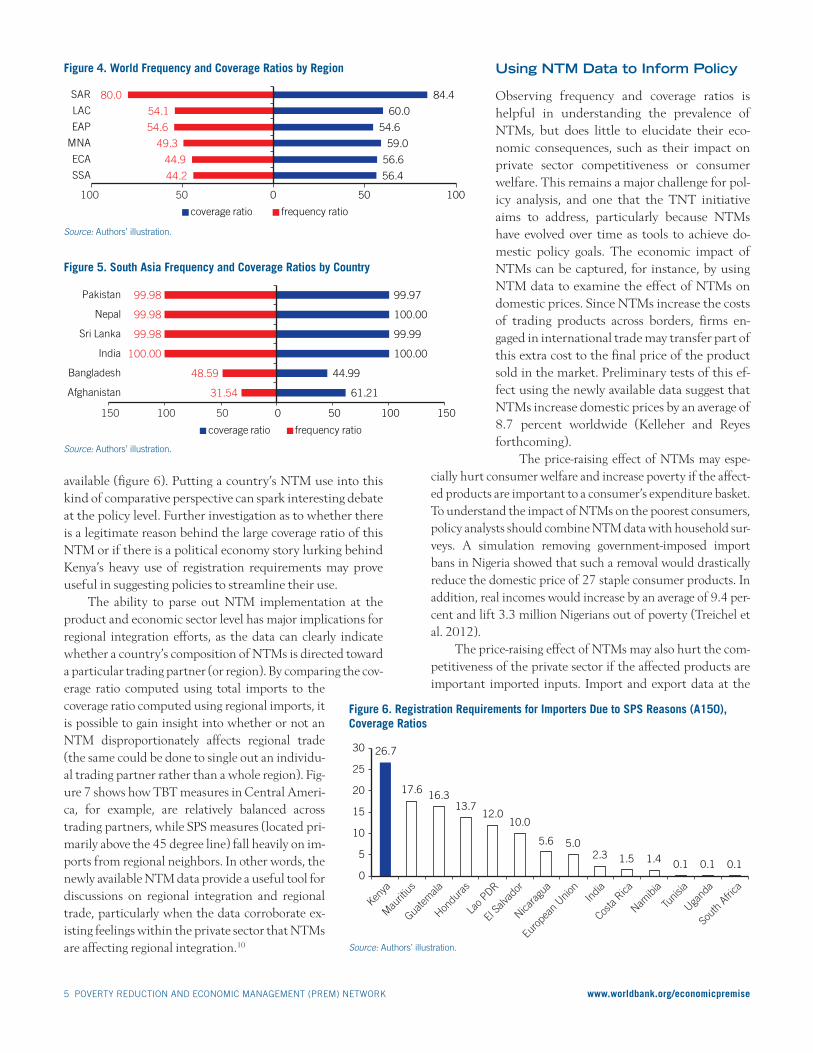
These two measures provide helpful snapshots of how popular NTM use is within and across countries. The South Asia region, for example, is the most prevalent user of NTMs, with average frequency and coverage ratios of 80 and 84 per-cent, respectively, compared to 44.2 and 56.4 percent, respec-tively, in Sub-Saharan Africa (figure 4). Furthermore, fre-quency and coverage ratios can provide stark illustrations of the heterogeneity of NTM use within regions. In South Asia, for example, Pakistan, Nepal, Sri Lanka, and India all apply at least one NTM to every product that is imported, while Ban-
gladesh and Afghanistan apply at least one NTM to only 48.6 and 31.5 percent of imported prod-ucts, respectively (figure 5). This large variation in the trade incidence of NTMs reveals how even re-gional neighbors can differ considerably with re-gard to their governmental priorities and ap-proaches toward trade regulation, the composition of their import baskets, and the roles of import-competing sectors lobbying for domestic protec-tion.
Frequency and coverage ratios analyzed by in-dividual NTM code can help deduce the relative importance of given NTMs by country. In Kenya, for instance, registration requirements for import-ers due to SPS reasons apply to 26.7 percent of imports. This is not to say that 26.7 is a particu-larly high or low coverage ratio in absolute terms, but rather that registration requirements play a leading role in the country’s NTM landscape—that is, they happen to be among the top 15 most frequently observed NTMs. Kenya ranks first when comparing its use of these types of mea-sures with other countries for which data are
Table 1. NTM Classification
Impo
rts
Technical measures
A. Sanitary and Phytosanitary Measures
B. Technical Barriers to Trade
C. Pre-Shipment Inspection and Other Formalities
Non-technical measures
D. Contingent Trade-Protective Measures
E. Non-Automatic Licensing, Quotas, Prohibition and Quantity-Control Measures Other Than for SPS or TBT Reasons
F. Price-Control Measures, including Additional Taxes and Charges
G. Financial Measures
H. Measures Affecting Competition
I. Trade-Related Investment Measures
J. Distribution Restrictions
K. Restrictions on Post-Sales Services
L. Subsidies (excluding Export Subsidies under P7)
M. Government Procurement Restrictions
N. Intellectual Property
O. Rules of Origin
Exports P. Export-Related Measures
Source: UNCTAD 2012, http://unctad.org/en/PublicationsLibrary/ditctab20122_en.pdf.
5 POVERTY REDUCTION AND ECONOMIC MANAGEMENT (PREM) NETWORK www.worldbank.org/economicpremise
Using NTM Data to Inform Policy
Observing frequency and coverage ratios is helpful in understanding the prevalence of NTMs, but does little to elucidate their eco-nomic consequences, such as their impact on private sector competitiveness or consumer welfare. This remains a major challenge for pol-icy analysis, and one that the TNT initiative aims to address, particularly because NTMs have evolved over time as tools to achieve do-mestic policy goals. The economic impact of NTMs can be captured, for instance, by using NTM data to examine the effect of NTMs on domestic prices. Since NTMs increase the costs of trading products across borders, firms en-gaged in international trade may transfer part of this extra cost to the final price of the product sold in the market. Preliminary tests of this ef-fect using the newly available data suggest that NTMs increase domestic prices by an average of 8.7 percent worldwide (Kelleher and Reyes forthcoming).
The price-raising effect of NTMs may espe-cially hurt consumer welfare and increase poverty if the affect-ed products are important to a consumer’s expenditure basket. To understand the impact of NTMs on the poorest consumers, policy analysts should combine NTM data with household sur-veys. A simulation removing government-imposed import bans in Nigeria showed that such a removal would drastically reduce the domestic price of 27 staple consumer products. In addition, real incomes would increase by an average of 9.4 per-cent and lift 3.3 million Nigerians out of poverty (Treichel et al. 2012).
The price-raising effect of NTMs may also hurt the com-petitiveness of the private sector if the affected products are important imported inputs. Import and export data at the
available (figure 6). Putting a country’s NTM use into this kind of comparative perspective can spark interesting debate at the policy level. Further investigation as to whether there is a legitimate reason behind the large coverage ratio of this NTM or if there is a political economy story lurking behind Kenya’s heavy use of registration requirements may prove useful in suggesting policies to streamline their use.
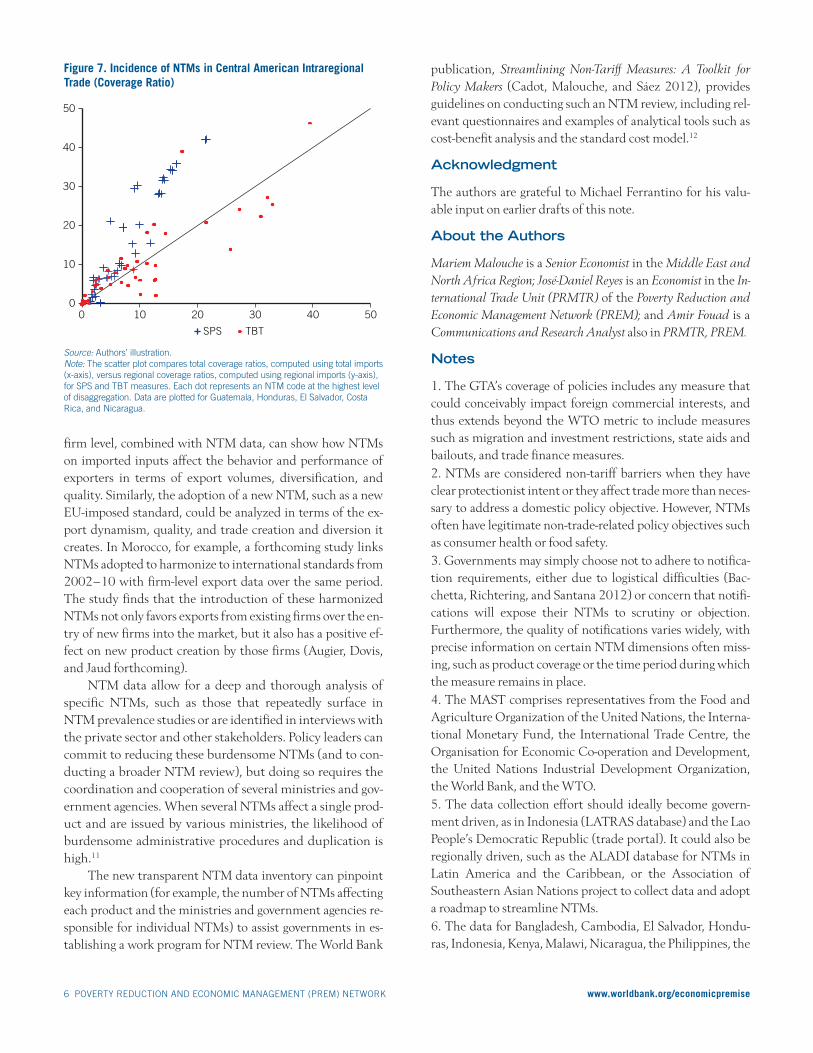
The ability to parse out NTM implementation at the product and economic sector level has major implications for regional integration efforts, as the data can clearly indicate whether a country’s composition of NTMs is directed toward a particular trading partner (or region). By comparing the cov-erage ratio computed using total imports to the coverage ratio computed using regional imports, it is possible to gain insight into whether or not an NTM disproportionately affects regional trade (the same could be done to single out an individu-al trading partner rather than a whole region). Fig-ure 7 shows how TBT measures in Central Ameri-ca, for example, are relatively balanced across trading partners, while SPS measures (located pri-marily above the 45 degree line) fall heavily on im-ports from regional neighbors. In other words, the newly available NTM data provide a useful tool for discussions on regional integration and regional trade, particularly when the data corroborate ex-isting feelings within the private sector that NTMs are affecting regional integration.10
Figure 4. World Frequency and Coverage Ratios by Region
Figure 5. South Asia Frequency and Coverage Ratios by Country
44.2
44.9
49.3
54.6
54.1
80.0
56.4
56.6
59.0
54.6
60.0
84.4
100 50 0 50 100
SSA
ECA
MNA
EAP
LAC
SAR
coverage ratio frequency ratio
31.54
48.59
100.00
99.98
99.98
99.98
61.21
44.99
100.00
99.99
100.00
99.97
150 100 50 0 50 100 150
Afghanistan
Bangladesh
India
Sri Lanka
Nepal
Pakistan
coverage ratio frequency ratio
Source: Authors’ illustration.
Source: Authors’ illustration.
Figure 6. Registration Requirements for Importers Due to SPS Reasons (A150), Coverage Ratios
26.7
17.6 16.3 13.7
12.0 10.0
5.6 5.0 2.3 1.4 0.1 0.1 0.1
0
5
10
15
20
25
30
Kenya
Mau
ritius
Guatem
ala
Hondu
ras
Lao P
DR
El Sa
lvado
r
Nicara
gua
Euro
pean
Unio
n
Costa
Rica
Namibi
a
Tunis
ia
Ugand
a
Sout
h Afri
caIn
dia
1.5
Source: Authors’ illustration.
6 POVERTY REDUCTION AND ECONOMIC MANAGEMENT (PREM) NETWORK www.worldbank.org/economicpremise
firm level, combined with NTM data, can show how NTMs on imported inputs affect the behavior and performance of exporters in terms of export volumes, diversification, and quality. Similarly, the adoption of a new NTM, such as a new EU-imposed standard, could be analyzed in terms of the ex-port dynamism, quality, and trade creation and diversion it creates. In Morocco, for example, a forthcoming study links NTMs adopted to harmonize to international standards from 2002–10 with firm-level export data over the same period. The study finds that the introduction of these harmonized NTMs not only favors exports from existing firms over the en-try of new firms into the market, but it also has a positive ef-fect on new product creation by those firms (Augier, Dovis, and Jaud forthcoming).
NTM data allow for a deep and thorough analysis of specific NTMs, such as those that repeatedly surface in NTM prevalence studies or are identified in interviews with the private sector and other stakeholders. Policy leaders can commit to reducing these burdensome NTMs (and to con-ducting a broader NTM review), but doing so requires the coordination and cooperation of several ministries and gov-ernment agencies. When several NTMs affect a single prod-uct and are issued by various ministries, the likelihood of burdensome administrative procedures and duplication is high.11
The new transparent NTM data inventory can pinpoint key information (for example, the number of NTMs affecting each product and the ministries and government agencies re-sponsible for individual NTMs) to assist governments in es-tablishing a work program for NTM review. The World Bank
publication, Streamlining Non-Tariff Measures: A Toolkit for Policy Makers (Cadot, Malouche, and Sáez 2012), provides guidelines on conducting such an NTM review, including rel-evant questionnaires and examples of analytical tools such as cost-benefit analysis and the standard cost model.12
Acknowledgment
The authors are grateful to Michael Ferrantino for his valu-able input on earlier drafts of this note.
About the Authors
Mariem Malouche is a Senior Economist in the Middle East and North Africa Region; José-Daniel Reyes is an Economist in the In-ternational Trade Unit (PRMTR) of the Poverty Reduction and Economic Management Network (PREM); and Amir Fouad is a Communications and Research Analyst also in PRMTR, PREM.
Notes
1. The GTA’s coverage of policies includes any measure that could conceivably impact foreign commercial interests, and thus extends beyond the WTO metric to include measures such as migration and investment restrictions, state aids and bailouts, and trade finance measures. 2. NTMs are considered non-tariff barriers when they have clear protectionist intent or they affect trade more than neces-sary to address a domestic policy objective. However, NTMs often have legitimate non-trade-related policy objectives such as consumer health or food safety.3. Governments may simply choose not to adhere to notifica-tion requirements, either due to logistical difficulties (Bac-chetta, Richtering, and Santana 2012) or concern that notifi-cations will expose their NTMs to scrutiny or objection. Furthermore, the quality of notifications varies widely, with precise information on certain NTM dimensions often miss-ing, such as product coverage or the time period during which the measure remains in place.4. The MAST comprises representatives from the Food and Agriculture Organization of the United Nations, the Interna-tional Monetary Fund, the International Trade Centre, the Organisation for Economic Co-operation and Development, the United Nations Industrial Development Organization, the World Bank, and the WTO. 5. The data collection effort should ideally become govern-ment driven, as in Indonesia (LATRAS database) and the Lao People’s Democratic Republic (trade portal). It could also be regionally driven, such as the ALADI database for NTMs in Latin America and the Caribbean, or the Association of Southeastern Asian Nations project to collect data and adopt a roadmap to streamline NTMs. 6. The data for Bangladesh, Cambodia, El Salvador, Hondu-ras, Indonesia, Kenya, Malawi, Nicaragua, the Philippines, the
Source: Authors’ illustration.Note: The scatter plot compares total coverage ratios, computed using total imports (x-axis), versus regional coverage ratios, computed using regional imports (y-axis), for SPS and TBT measures. Each dot represents an NTM code at the highest level of disaggregation. Data are plotted for Guatemala, Honduras, El Salvador, Costa Rica, and Nicaragua.
Figure 7. Incidence of NTMs in Central American Intraregional Trade (Coverage Ratio)
0
10
20
30
40
50
0 10 20 30 40 50
SPS TBT

7 POVERTY REDUCTION AND ECONOMIC MANAGEMENT (PREM) NETWORK www.worldbank.org/economicpremise
Russian Federation, Rwanda, South Africa, the Syrian Arab Republic, Turkey, and Uganda are still under verification by UNCTAD’s statistical division. 7. http://unctad.org/en/PublicationsLibrary/ditctab20122_en.pdf .8. Classified at the Harmonized System’s six-digit level of detail.9. Neither indicator is perfect. While the frequency ratio tends to overemphasize smaller products, the coverage ratio is dominated by the role of products with large import value, thus tending to underestimate the overall restrictiveness of NTMs. Both indicators are, however, highly correlated.10. This was found to be the case in a recent report that the International Trade Unit produced for the Central American region.11. In most countries, at least five ministries are responsible for most NTMs, and other than the ministry of trade, most have policy mandates unrelated to trade competitiveness and diversification. Such ministries do not always consider the least trade-restrictive measure or consult with govern-ment partners and the private sector about the different policy instruments that would help achieve the policy ob-jective without hurting firm competitiveness and consumer welfare. 12. The ASEAN Secretariat (ASEC) NTM review program was based on the classification of NTMs according to WTO principles: measures are transparent; measures do not dis-criminate; SPS measures have a scientific basis; and there is no better, least trade-restrictive alternative. ASEC specifically ac-counted for nontrade regulatory objectives such as revenue generation and protection of health and safety of consumers,
The Economic Premise note series is intended to summarize good practices and key policy findings on topics related to economic policy. They are produced by the Poverty Reduction and Economic Management (PREM) Network Vice-Presidency of the World Bank. The views expressed here are those of the authors and do not necessarily reflect those of the World Bank. The notes are available at: www.worldbank.org/economicpremise.
and introduced the concept of Trade Impact Criterion to esti-mate the relative effects of a given NTM on welfare.
References
Augier, P., M. Dovis, and M. Jaud. Forthcoming. “Impact of Non-Tariffs Measures on Firms’ Export Dynamics in Morocco.” World Bank, Washington, DC.
Bacchetta, M., J. Richtering, and R. Santana. 2012. “How Much Light Do WTO Notifications Shed on NTMs?” In Non-Tariff Measures: A Fresh Look at Trade Policy’s New Frontier, ed. O. Cadot and M. Malouche. Washington, DC: World Bank/Centre for Economic Policy Research.
Cadot, O., and M. Malouche. 2012. Non-Tariff Measures: A Fresh Look at Trade Policy’s New Frontier. Washington, DC: World Bank/Centre for Economic Policy Research.
Cadot, O., M. Malouche, and S. Sáez. 2012. Streamlining Non-Tariff Measures: A Toolkit for Policy Makers. Washington, DC: World Bank.
Evenett, S. J. 2009. “Global Trade Alert: Motivation and Launch.” Global Trade Alert, University of St. Gallen/Centre for Eco-nomic Policy Research.
———. 2013. “Protectionism’s Quiet Return: GTA’s Pre-G8 Sum-mit Report.” Global Trade Alert, Centre for Economic Policy Research.
Kelleher, S., and J.-D. Reyes. Forthcoming. “Non-Tariff Measures in Central America: Incidence, Price Effects, and Consumers’ Welfare.” World Bank, Washington, DC.
Treichel, V., M. Hoppe, O. Cadot, and J. Gourdon. 2012. “Import Bans in Nigeria Increase Poverty.” Africa Trade Policy Note No. 28, World Bank, Washington, DC.
UNCTAD (United Nations Conference on Trade and Develop-ment). 2012. Classification of Non-Tariff Measures. Geneva.
WTO (World Trade Organization). 2012. World Trade Report 2012: Trade and Public Policies: A Closer Look at Non-Tariff Measures in the 21st Century. Geneva.
———. 2013. Report on G20 Trade and Investment Measures. Geneva.


![SK9822 REV.01 EN [兼容模张] · 2016. 3. 18. · 3/ 12 SK9822 SK9822: The default is RGB chips with IC integration 6. General Information](https://img.pdfslide.us/doc/110x75/60c8dd7214333e138a661027/sk9822-rev01-en-fafff-2016-3-18.jpg)