Embed Size (px)
Citation preview
November 2010November 2010
www.apwcc.com2
This presentation may contain forward-looking statements concerning Asia Pacific Wire & Cable Corporation. The actual results may differ materially depending on a number of risk factors including, but not limited to, the following: general economic and business conditions, development, shipment, market acceptance, additional competition from existing and new competitors, changes in technology or product techniques, and various other factors beyond its control.
All forward-looking statements are expressly qualified in their entirety by this Cautionary Statement and the risk factors detailed in the Company's reports filed with the Securities and Exchange Commission. Asia Pacific Wire & Cable Corporation undertakes no duty to revise or update any forward-looking statements to reflect events or circumstances after the date of this presentation.
Safe Harbor StatementSafe Harbor Statement
www.apwcc.com3
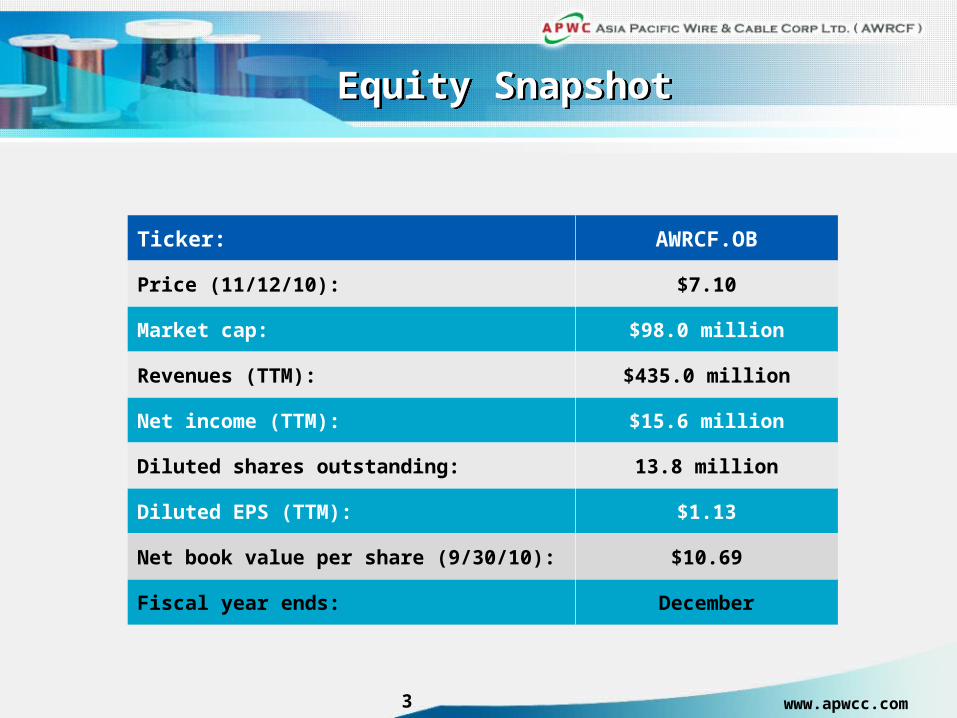
Equity SnapshotEquity Snapshot
Ticker: AWRCF.OB
Price (11/12/10): $7.10
Market cap: $98.0 million
Revenues (TTM): $435.0 million
Net income (TTM): $15.6 million
Diluted shares outstanding: 13.8 million
Diluted EPS (TTM): $1.13
Net book value per share (9/30/10): $10.69
Fiscal year ends: December
www.apwcc.com4
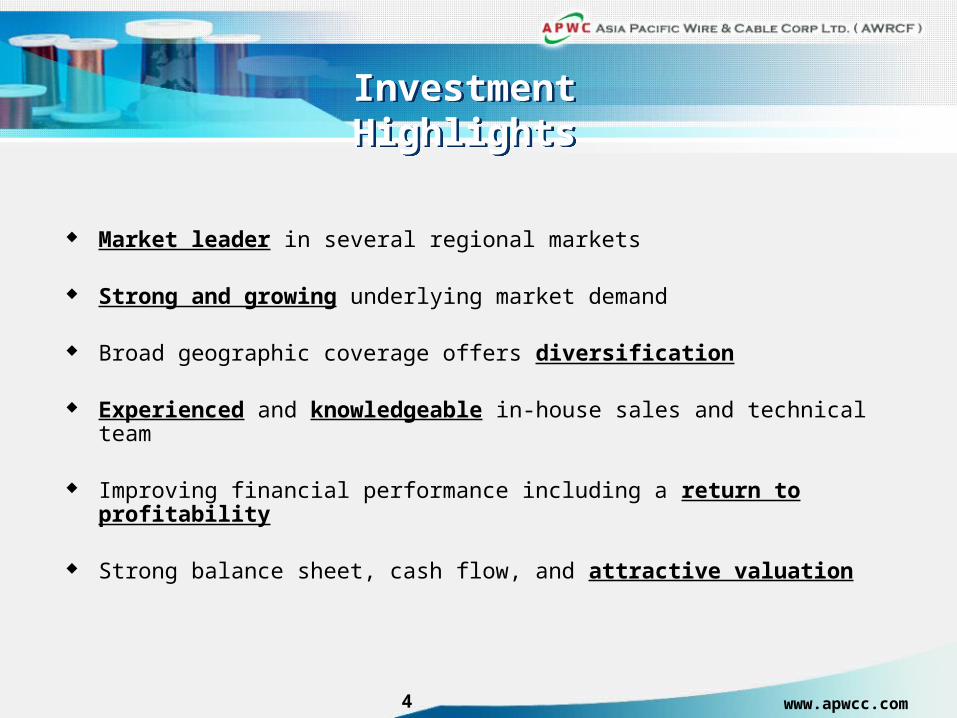
Market leader in several regional markets
Strong and growing underlying market demand
Broad geographic coverage offers diversification
Experienced and knowledgeable in-house sales and technical team
Improving financial performance including a return to profitability
Strong balance sheet, cash flow, and attractive valuation
Investment HighlightsInvestment Highlights
www.apwcc.com5
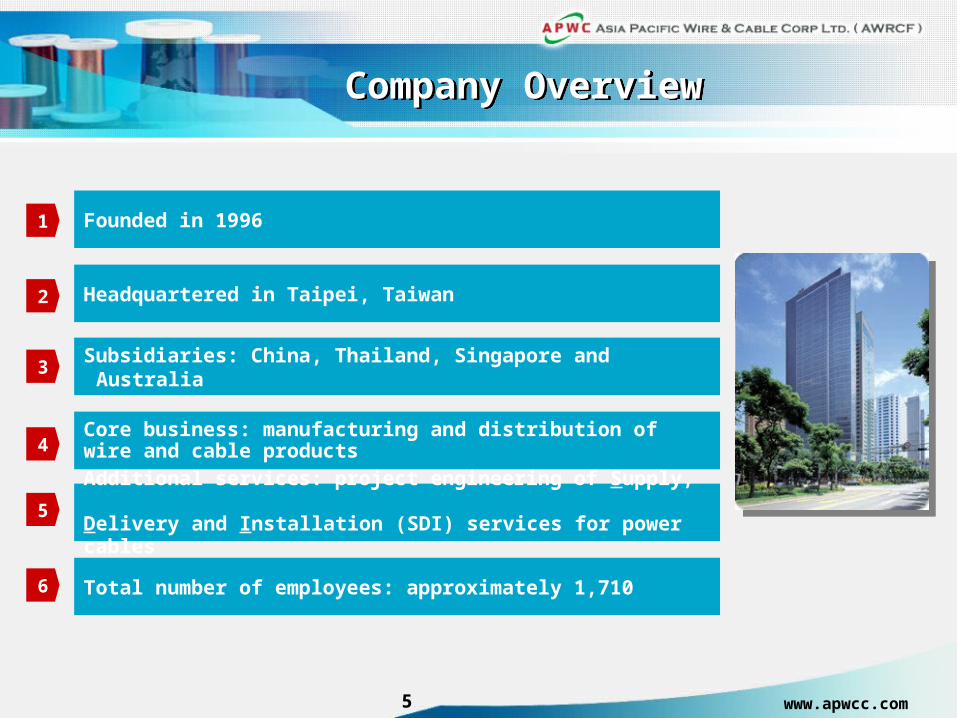
Company OverviewCompany Overview
1
2
3
4
5
Founded in 1996
Headquartered in Taipei, Taiwan
Subsidiaries: China, Thailand, Singapore and Australia
Core business: manufacturing and distribution of wire and cable products
Additional services: project engineering of Supply, Delivery and Installation (SDI) services for power cables
Total number of employees: approximately 1,7106
www.apwcc.com
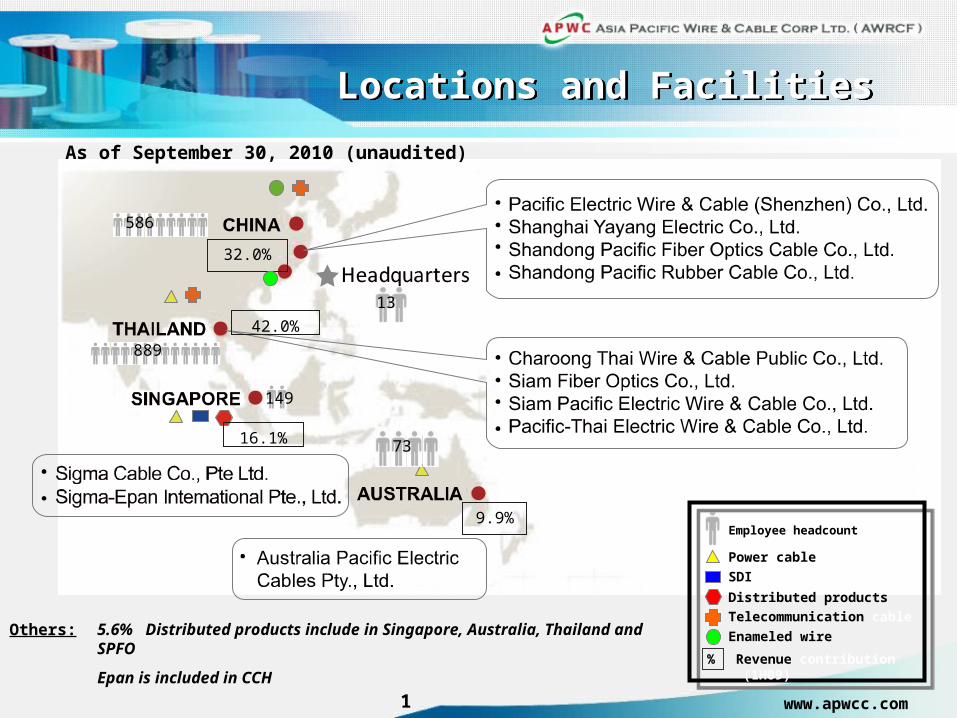
586
Locations and FacilitiesLocations and Facilities
SDI project engineering
Power cable
Distributed products
Telecommunication cable
Enameled wire
Employee headcount
% Revenue contribution (1H09)
Others: 5.6% Distributed products include in Singapore, Australia, Thailand and SPFO
Epan is included in CCH
889
149
32.0%
42.0%
16.1%
9.9%
As of September 30, 2010 (unaudited)
73
7313
1
www.apwcc.com7
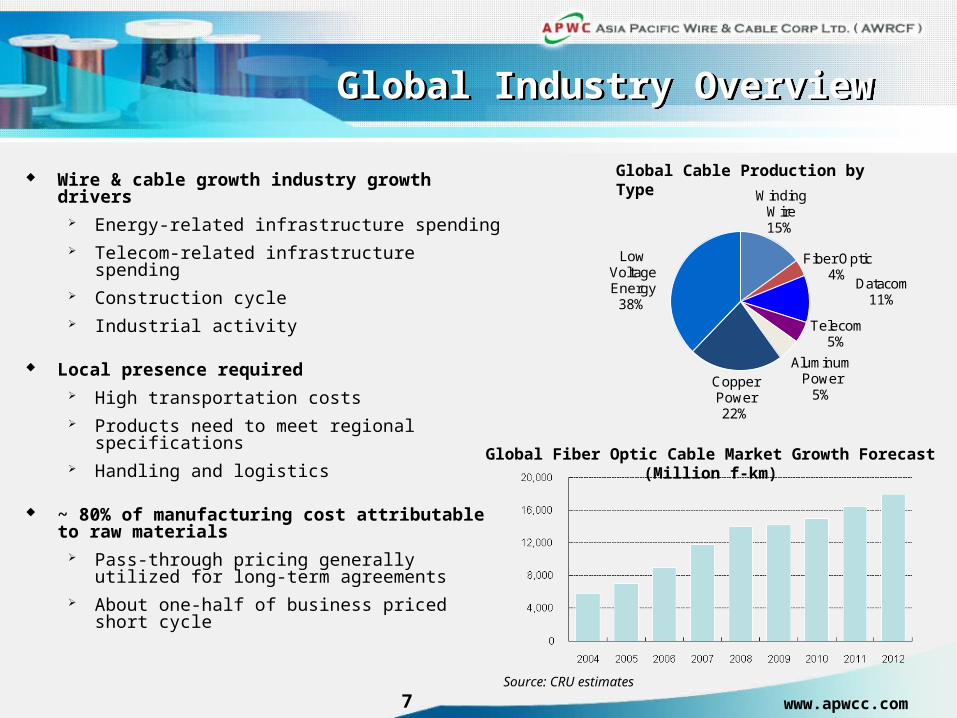
Global Industry OverviewGlobal Industry Overview
Wire & cable growth industry growth drivers Energy-related infrastructure spending Telecom-related infrastructure spending Construction cycle Industrial activity
Local presence required High transportation costs Products need to meet regional
specifications Handling and logistics
~ 80% of manufacturing cost attributable to raw materials
Pass-through pricing generally utilized for long-term agreements
About one-half of business priced short cycle
Winding Wire15%
Fiber Optic4%
Datacom11%
Telecom5%
Aluminum Power
5%Copper Power22%
Low Voltage Energy
38%
Global Cable Production by Type
Source: CRU estimates
Global Fiber Optic Cable Market Growth Forecast (Million f-km)
www.apwcc.com8
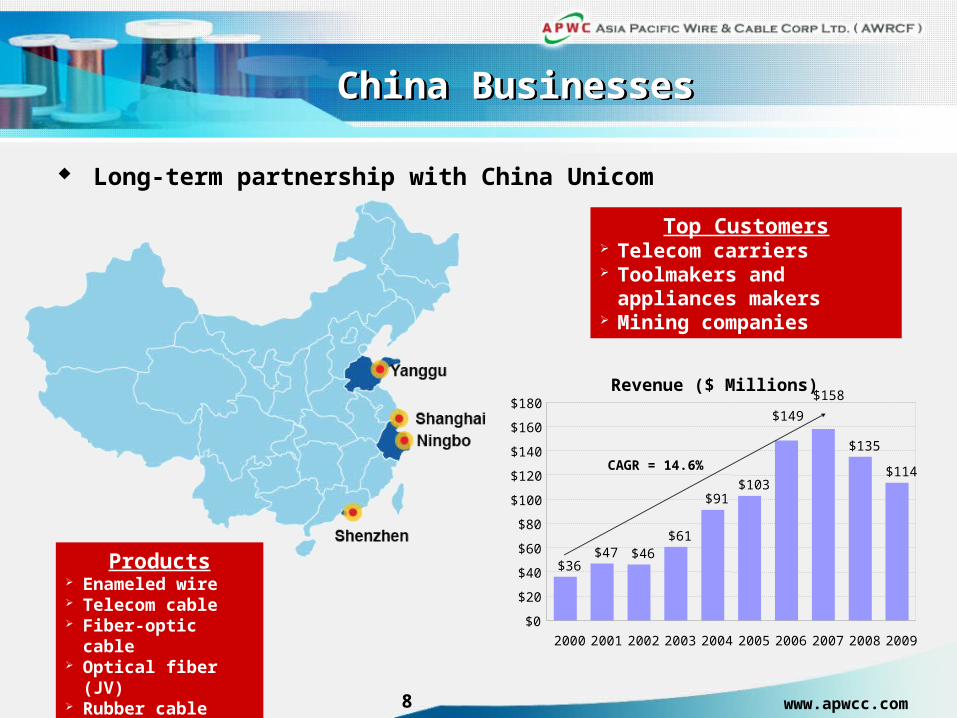
China BusinessesChina Businesses
Long-term partnership with China Unicom
Products Enameled wire Telecom cable Fiber-optic cable Optical fiber (JV) Rubber cable
Top Customers Telecom carriers Toolmakers and appliances
makers Mining companies
Revenue ($ Millions)
$36$47 $46
$61
$91$103
$135
$114
$158
$149
$0
$20
$40
$60
$80
$100
$120
$140
$160
$180
2000 2001 2002 2003 2004 2005 2006 2007 2008 2009
CAGR = 14.6%
www.apwcc.com9
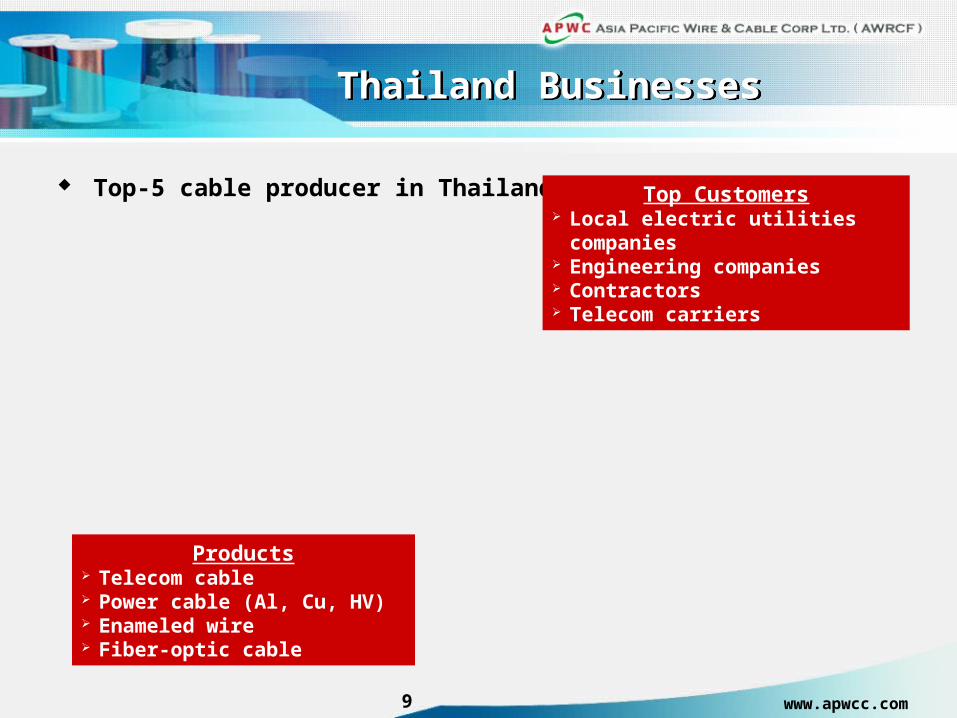
Thailand BusinessesThailand Businesses
Top-5 cable producer in Thailand
Products Telecom cable Power cable (Al, Cu, HV) Enameled wire Fiber-optic cable
Top Customers Local electric utilities companies Engineering companies Contractors Telecom carriers
Revenue ($ Millions)
$87 $81
$107$94
$130$149
$212
$249
$216
$119
$0
$50
$100
$150
$200
$250
$300
2000 2001 2002 2003 2004 2005 2006 2007 2008 2009
CAGR = 16.1%
www.apwcc.com10
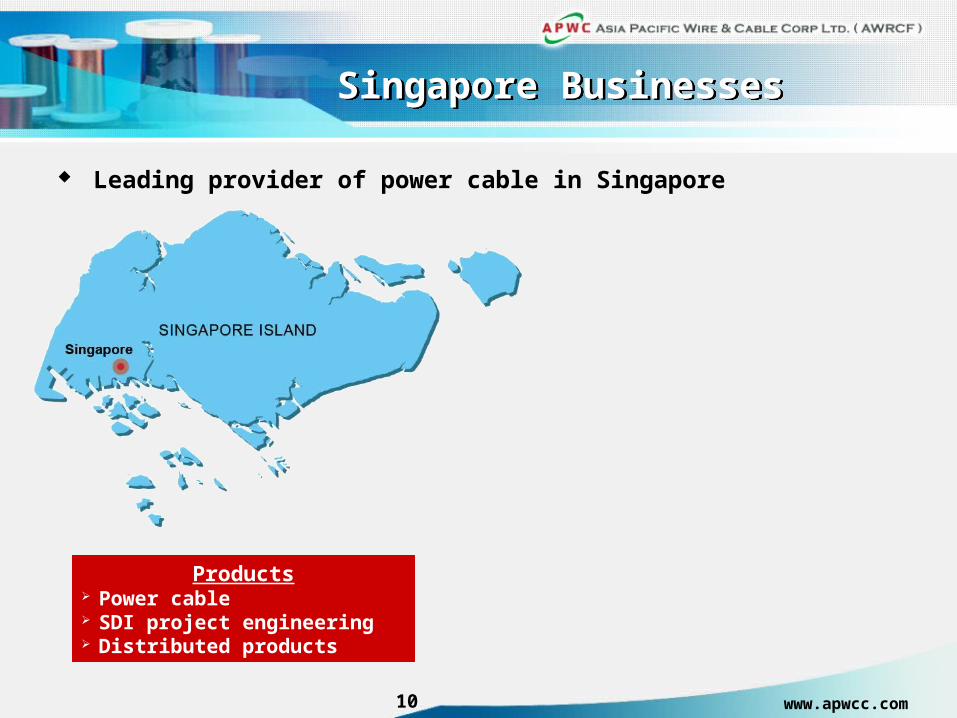
Singapore BusinessesSingapore Businesses
Leading provider of power cable in Singapore
Products Power cable SDI project engineering Distributed products
Revenue ($ Millions)
$52
$64$72
$32$42
$51$58
$48
$88$97
$0
$20
$40
$60
$80
$100
$120
2000 2001 2002 2003 2004 2005 2006 2007 2008 2009
Manufactured Distributed SDI
Top Customers Electrical contractors Distributors Public utilities Board
www.apwcc.com11
Australia BusinessesAustralia Businesses
Leading provider of power and construction cables
New opportunities for distribution due to pan – Asia trade agreement
Revenue ($ Millions)
$10 $11$14
$22
$30$35
$58$56
$63
$35
$0
$10
$20
$30
$40
$50
$60
$70
2000 2001 2002 2003 2004 2005 2006 2007 2008 2009
CAGR = 13.7%
Top Customers Contractors Distribution Centers
Products Low-voltage power cables Construction cables
www.apwcc.com12
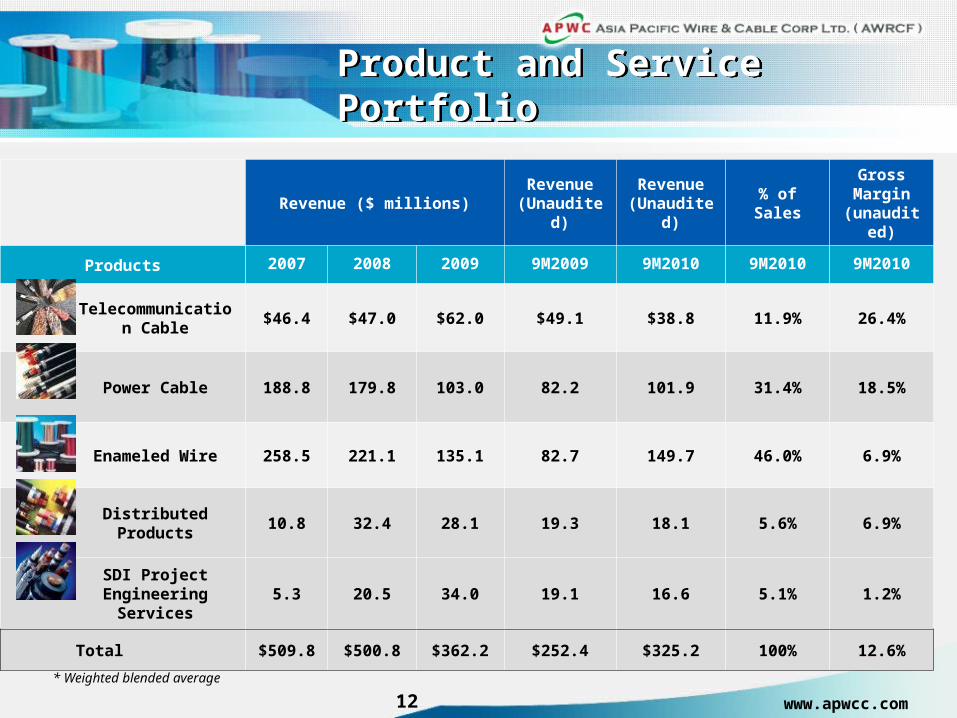
Product and Service PortfolioProduct and Service Portfolio
Revenue ($ millions)Revenue
(Unaudited)Revenue
(Unaudited)% of Sales
Gross Margin
(unaudited)
Products 2007 2008 2009 9M2009 9M2010 9M2010 9M2010
Telecommunication Cable
$46.4 $47.0 $62.0 $49.1 $38.8 11.9% 26.4%
Power Cable 188.8 179.8 103.0 82.2 101.9 31.4% 18.5%
Enameled Wire 258.5 221.1 135.1 82.7 149.7 46.0% 6.9%
Distributed Products 10.8 32.4 28.1 19.3 18.1 5.6% 6.9%
SDI Project Engineering
Services5.3 20.5 34.0 19.1 16.6 5.1% 1.2%
Total $509.8 $500.8 $362.2 $252.4 $325.2 100% 12.6%
* Weighted blended average
www.apwcc.com
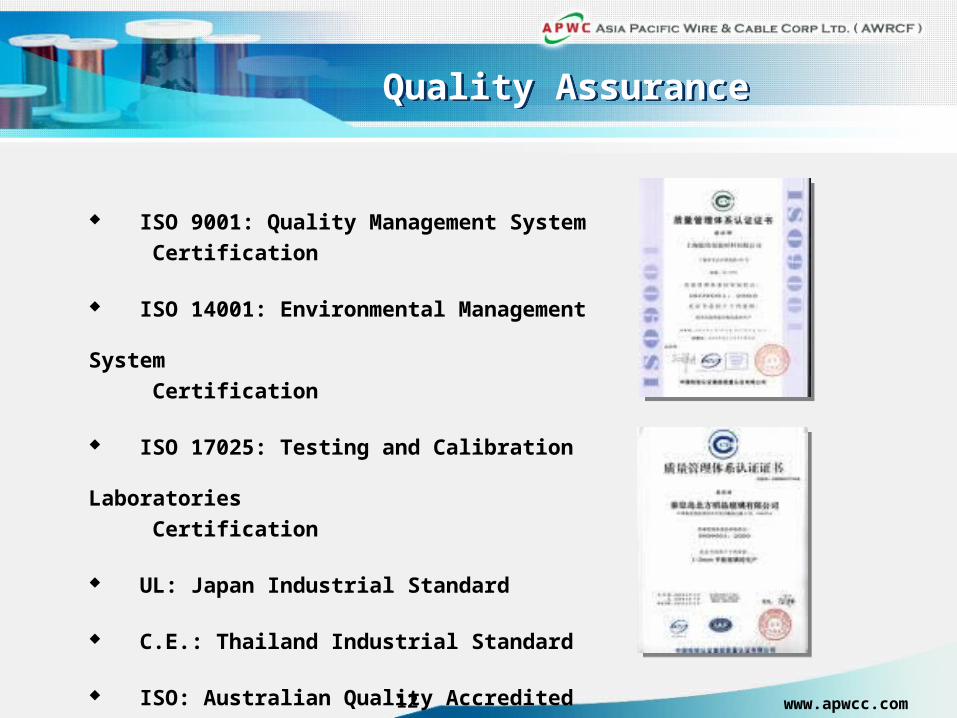
Quality AssuranceQuality Assurance
ISO 9001: Quality Management System
Certification
ISO 14001: Environmental Management System
Certification
ISO 17025: Testing and Calibration Laboratories
Certification
UL: Japan Industrial Standard
C.E.: Thailand Industrial Standard
ISO: Australian Quality Accredited
12
www.apwcc.com14
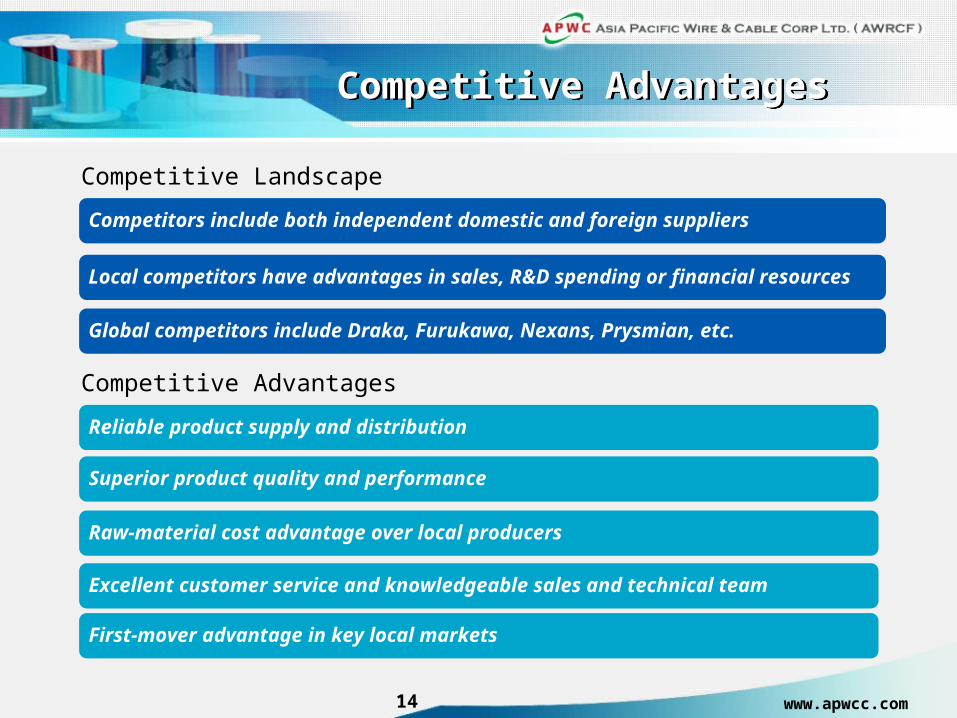
Competitive AdvantagesCompetitive Advantages
Global competitors include Draka, Furukawa, Nexans, Prysmian, etc.
Local competitors have advantages in sales, R&D spending or financial resources
Competitors include both independent domestic and foreign suppliers
Excellent customer service and knowledgeable sales and technical team
Raw-material cost advantage over local producers
Superior product quality and performance
Reliable product supply and distribution
Competitive Advantages
Competitive Landscape
First-mover advantage in key local markets
www.apwcc.com15
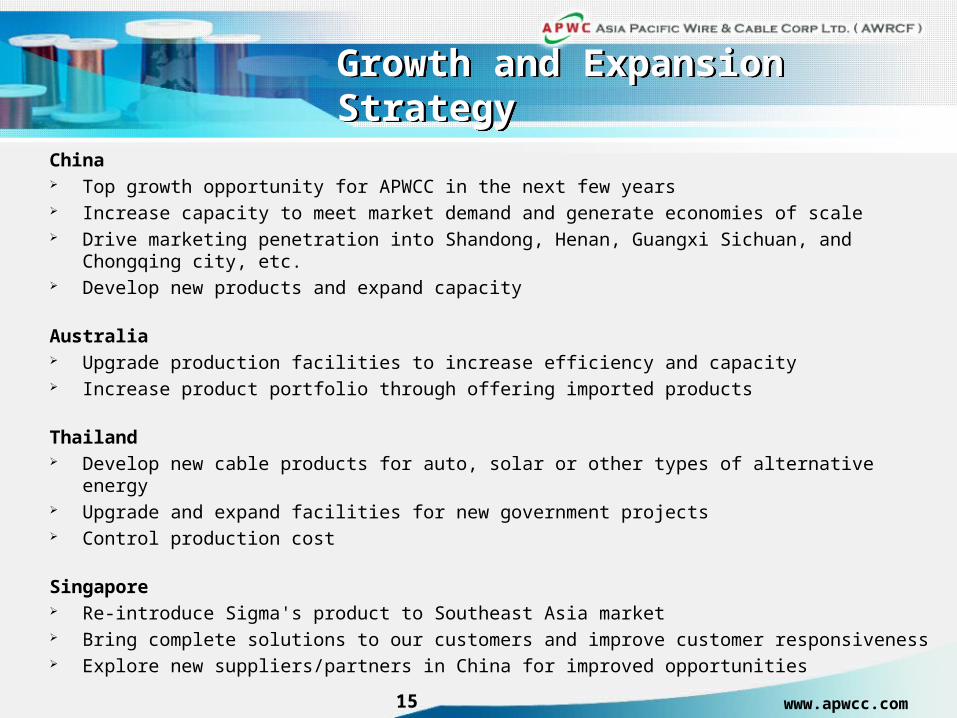
Growth and Expansion StrategyGrowth and Expansion Strategy
China Top growth opportunity for APWCC in the next few years Increase capacity to meet market demand and generate economies of scale Drive marketing penetration into Shandong, Henan, Guangxi Sichuan, and Chongqing city, etc. Develop new products and expand capacity
Australia Upgrade production facilities to increase efficiency and capacity Increase product portfolio through offering imported products
Thailand Develop new cable products for auto, solar or other types of alternative energy Upgrade and expand facilities for new government projects Control production cost
Singapore Re-introduce Sigma's product to Southeast Asia market Bring complete solutions to our customers and improve customer responsiveness Explore new suppliers/partners in China for improved opportunities
www.apwcc.com16
History of Revenue GrowthHistory of Revenue Growth
$211
$511$501
$362
$325
$192$197
$241 $294
$337
$468
$252
$0
$100
$200
$300
$400
$500
$600
200
0
200
1
200
2
200
3
200
4
200
5
200
6
200
7
200
8
200
9
9M09
9M10
US
D m
illio
n +29%CAGR = 13%
www.apwcc.com
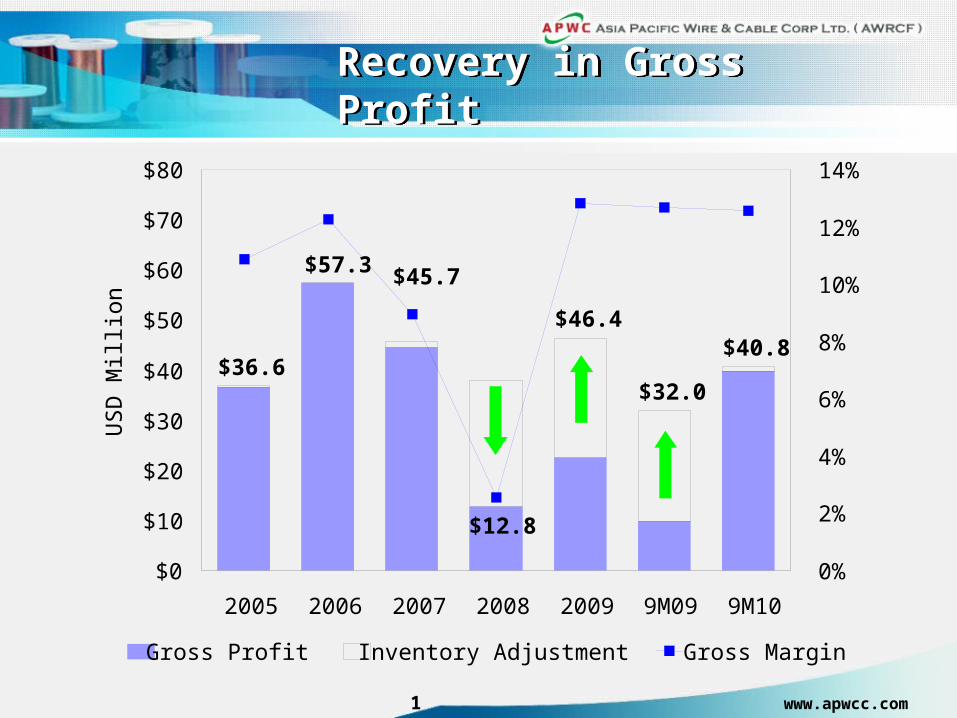
Recovery in Gross ProfitRecovery in Gross Profit
16
$36.6
$57.3 $45.7
$12.8
$46.4
$32.0
$40.8
$0
$10
$20
$30
$40
$50
$60
$70
$80
2005 2006 2007 2008 2009 9M09 9M10
US
D M
illio
n
0%
2%
4%
6%
8%
10%
12%
14%
Gross Profit Inventory Adjustment Gross Margin
www.apwcc.com18
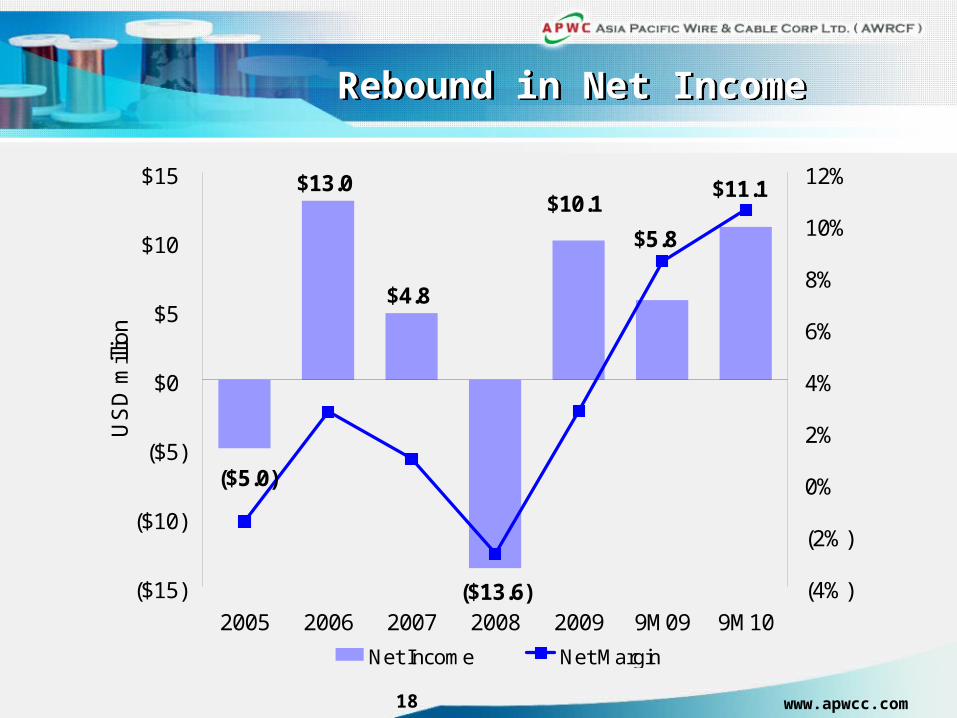
Rebound in Net IncomeRebound in Net Income
$13.0
$4.8
($13.6)
$11.1
$5.8
($5.0)
$10.1
($15)
($10)
($5)
$0
$5
$10
$15
2005 2006 2007 2008 2009 9M09 9M10
US
D m
illio
n
(4%)
(2%)
0%
2%
4%
6%
8%
10%
12%
Net Income Net Margin
www.apwcc.com19
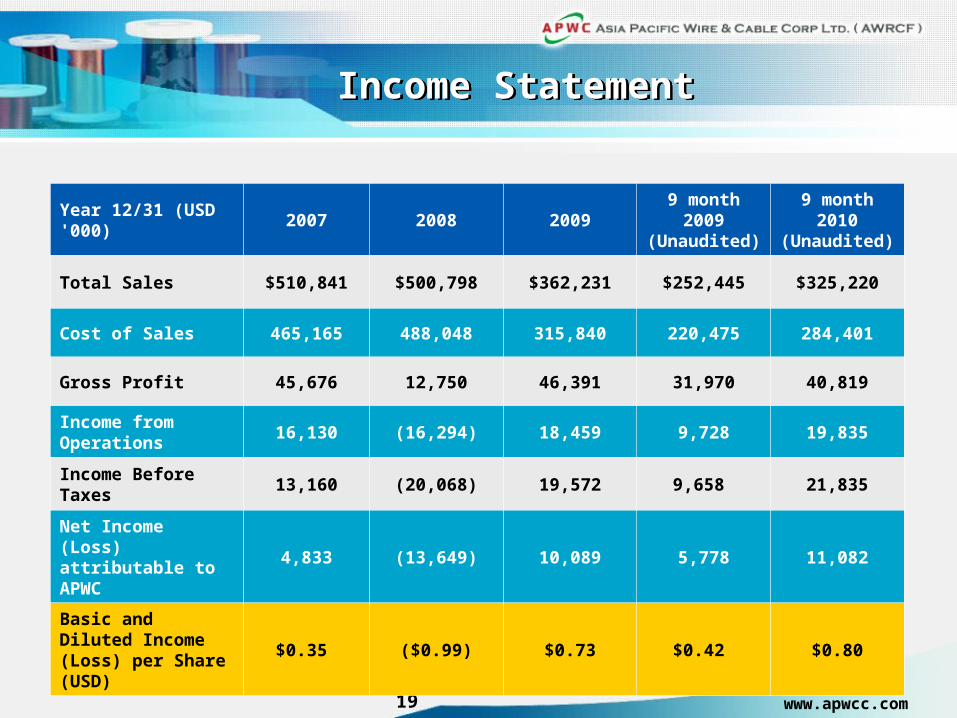
Income StatementIncome Statement
Year 12/31 (USD '000)
2007 2008 20099 month 2009(Unaudited)
9 month 2010(Unaudited)
Total Sales $510,841 $500,798 $362,231 $252,445 $325,220
Cost of Sales 465,165 488,048 315,840 220,475 284,401
Gross Profit 45,676 12,750 46,391 31,970 40,819
Income from Operations
16,130 (16,294) 18,459 9,728 19,835
Income Before Taxes 13,160 (20,068) 19,572 9,658 21,835
Net Income (Loss) attributable to APWC
4,833 (13,649) 10,089 5,778 11,082
Basic and Diluted Income (Loss) per Share (USD)
$0.35 ($0.99) $0.73 $0.42 $0.80
www.apwcc.com20
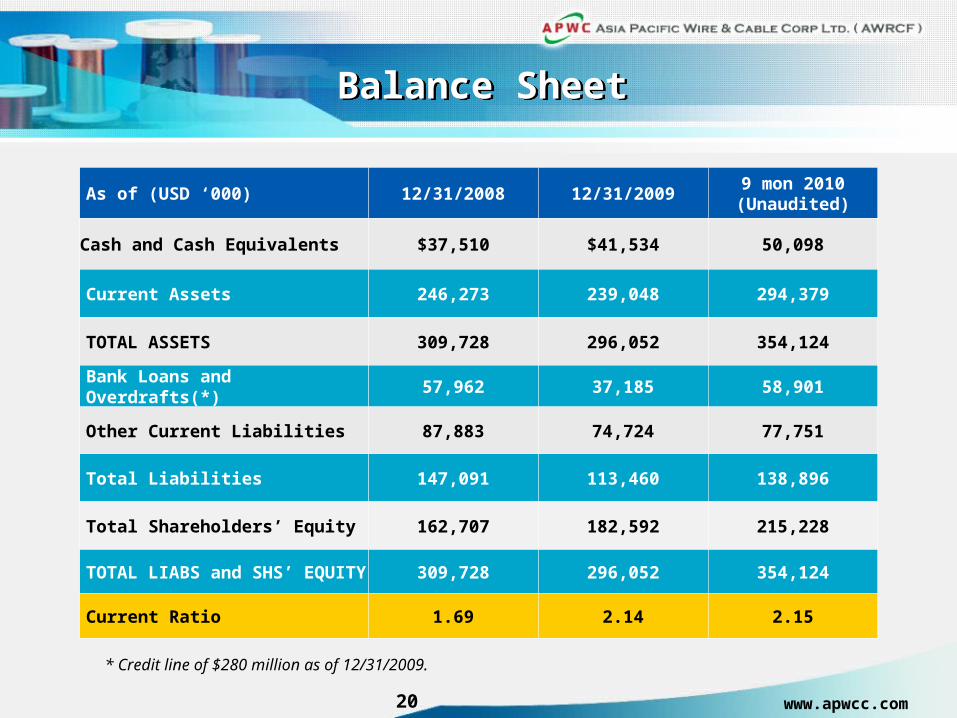
Balance SheetBalance Sheet
As of (USD ‘000) 12/31/2008 12/31/20099 mon 2010 (Unaudited)
Cash and Cash Equivalents $37,510 $41,534 50,098
Current Assets 246,273 239,048 294,379
TOTAL ASSETS 309,728 296,052 354,124
Bank Loans and Overdrafts(*) 57,962 37,185 58,901
Other Current Liabilities 87,883 74,724 77,751
Total Liabilities 147,091 113,460 138,896
Total Shareholders’ Equity 162,707 182,592 215,228
TOTAL LIABS and SHS’ EQUITY 309,728 296,052 354,124
Current Ratio 1.69 2.14 2.15
* Credit line of $280 million as of 12/31/2009.
www.apwcc.com21
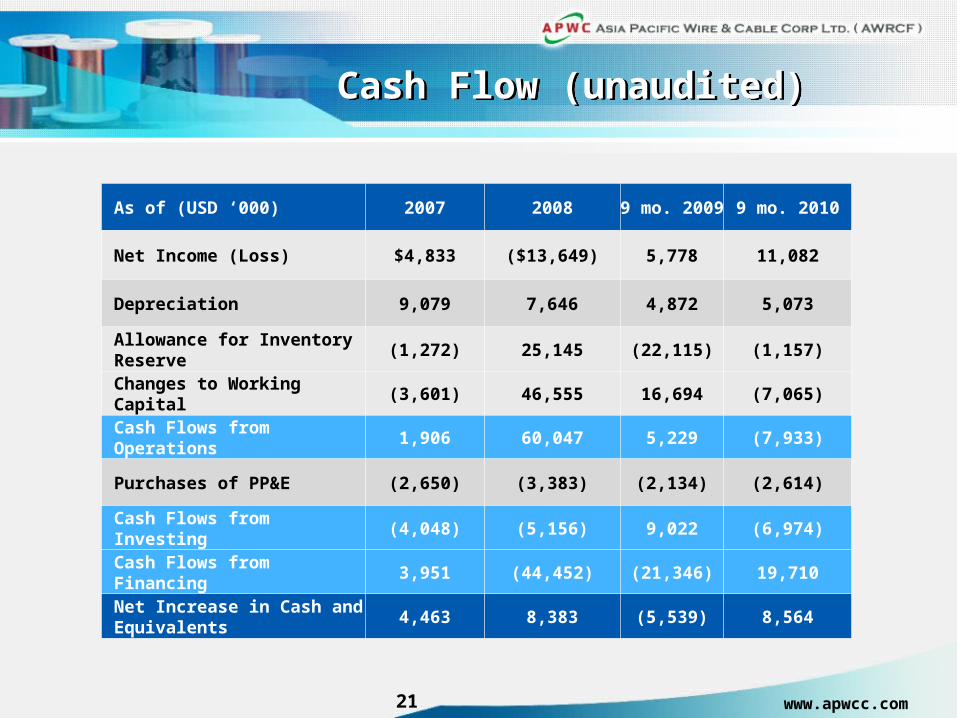
Cash Flow (unaudited)Cash Flow (unaudited)
As of (USD ‘000) 2007 2008 9 mo. 2009 9 mo. 2010
Net Income (Loss) $4,833 ($13,649) 5,778 11,082
Depreciation 9,079 7,646 4,872 5,073
Allowance for Inventory Reserve
(1,272) 25,145 (22,115) (1,157)
Changes to Working Capital (3,601) 46,555 16,694 (7,065)
Cash Flows from Operations 1,906 60,047 5,229 (7,933)
Purchases of PP&E (2,650) (3,383) (2,134) (2,614)
Cash Flows from Investing (4,048) (5,156) 9,022 (6,974)
Cash Flows from Financing 3,951 (44,452) (21,346) 19,710
Net Increase in Cash and Equivalents
4,463 8,383 (5,539) 8,564
www.apwcc.com22
Revenue and GP Analysis (unaudited)Revenue and GP Analysis (unaudited)
Revenue ($ Mil.)
$79.5 $85.6
$62.7
$24.6
$104.2
$136.4
$52.5
$32.2
+59%
+31%
(16%)
+31%
$0
$20
$40
$60
$80
$100
$120
$140
$160
China Thailand Singapore Australia
9M09 9M10
Gross Profit ($ Mil.)
$11.1$12.7
$4.1 $4.0
$10.5
$21.4
$3.4$5.6
+39%(18%)
(6%)
+68%
$0
$5
$10
$15
$20
$25
China Thailand Singapore Australia
9M09 9M10
www.apwcc.com23
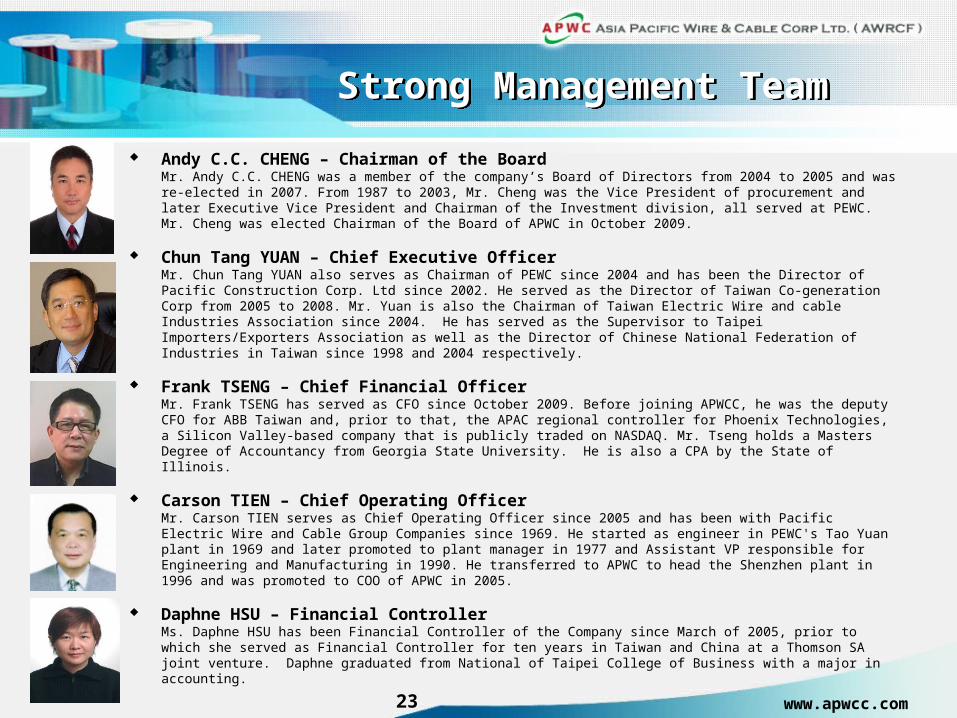
Strong Management TeamStrong Management Team
Andy C.C. CHENG – Chairman of the BoardMr. Andy C.C. CHENG was a member of the company’s Board of Directors from 2004 to 2005 and was re-elected in 2007. From 1987 to 2003, Mr. Cheng was the Vice President of procurement and later Executive Vice President and Chairman of the Investment division, all served at PEWC. Mr. Cheng was elected Chairman of the Board of APWC in October 2009.
Chun Tang YUAN – Chief Executive OfficerMr. Chun Tang YUAN also serves as Chairman of PEWC since 2004 and has been the Director of Pacific Construction Corp. Ltd since 2002. He served as the Director of Taiwan Co-generation Corp from 2005 to 2008. Mr. Yuan is also the Chairman of Taiwan Electric Wire and cable Industries Association since 2004. He has served as the Supervisor to Taipei Importers/Exporters Association as well as the Director of Chinese National Federation of Industries in Taiwan since 1998 and 2004 respectively.
Frank TSENG – Chief Financial OfficerMr. Frank TSENG has served as CFO since October 2009. Before joining APWCC, he was the deputy CFO for ABB Taiwan and, prior to that, the APAC regional controller for Phoenix Technologies, a Silicon Valley-based company that is publicly traded on NASDAQ. Mr. Tseng holds a Masters Degree of Accountancy from Georgia State University. He is also a CPA by the State of Illinois.
Carson TIEN – Chief Operating OfficerMr. Carson TIEN serves as Chief Operating Officer since 2005 and has been with Pacific Electric Wire and Cable Group Companies since 1969. He started as engineer in PEWC's Tao Yuan plant in 1969 and later promoted to plant manager in 1977 and Assistant VP responsible for Engineering and Manufacturing in 1990. He transferred to APWC to head the Shenzhen plant in 1996 and was promoted to COO of APWC in 2005.
Daphne HSU – Financial ControllerMs. Daphne HSU has been Financial Controller of the Company since March of 2005, prior to which she served as Financial Controller for ten years in Taiwan and China at a Thomson SA joint venture. Daphne graduated from National of Taipei College of Business with a major in accounting.
www.apwcc.com24
Experienced Board MembersExperienced Board Members
Anson Chan – Chairman of Audit Committee and Compensation Committee Member
Mr. Anson Chan has been an independent member of the Company’s Board of Directors since 2007 and serves on the Audit Committee as its Chairman. He qualified as a CPA by the State of Illinois in U.S.A. in 1992. Mr. Chan is also a Managing Director of the Bonds Group of Companies and was a Senior Advisor to Elliott Associates from 2005 to 2008.
Yichin Lee – Audit Committee Member
Dr. Yichin Lee has been an independent member of the Company’s Board of Directors since 2007 and serves on the Audit Committee. Dr. Lee is also the Managing Director of Giant Management Consulting LLC and an independent director of Giga Media Limited. Dr. Yichin Lee holds a doctorate degree in resource planning and management from Stanford University. Dr. Yichin Lee is not related to Mr. Michael C. Lee or Mr. Gai Poo Lee.
www.apwcc.com25
Market leader in several regional markets
Strong and growing underlying market demand
Broad geographic coverage offers diversification
Experienced and knowledgeable in-house sales and technical team
Improving financial performance including a return to profitability
Strong balance sheet, cash flow, and attractive valuation
Investment HighlightsInvestment Highlights
www.apwcc.com25
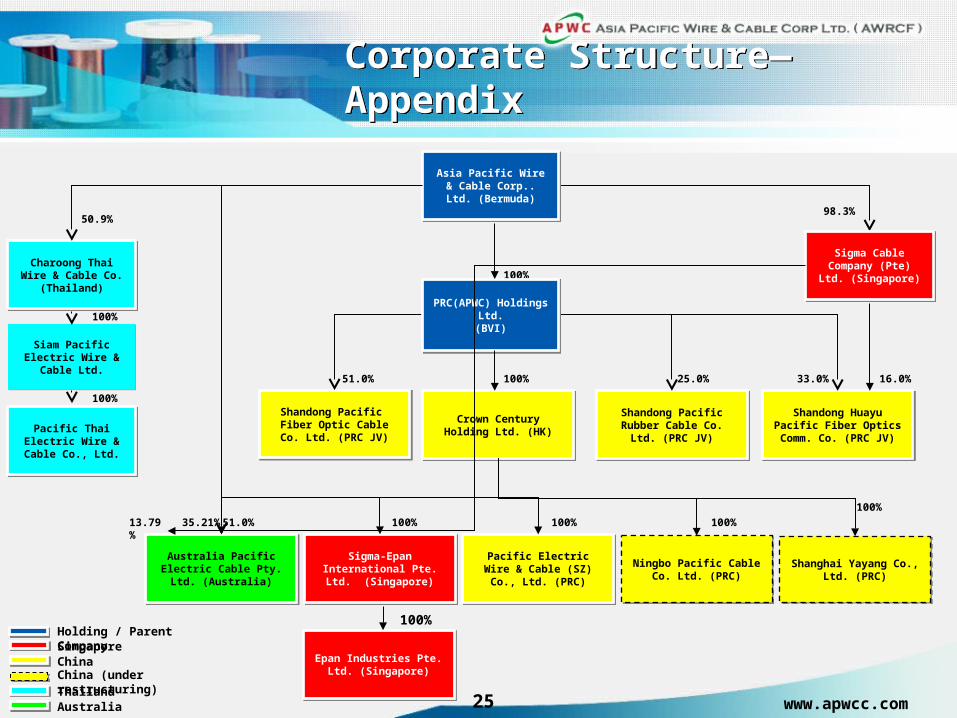
Corporate Structure—AppendixCorporate Structure—Appendix
Sigma-Epan International Pte. Ltd. (Singapore)
Sigma-Epan International Pte. Ltd. (Singapore)
Pacific Electric Wire & Cable (SZ) Co., Ltd. (PRC)
Pacific Electric Wire & Cable (SZ) Co., Ltd. (PRC)
Crown Century Holding Ltd. (HK)
Crown Century Holding Ltd. (HK)
Shanghai Yayang Co., Ltd. (PRC)
Shanghai Yayang Co., Ltd. (PRC)
Australia Pacific Electric Cable Pty. Ltd. (Australia)Australia Pacific Electric Cable Pty. Ltd. (Australia)
100%
100%
Shandong Pacific Rubber Cable Co. Ltd. (PRC JV)
Shandong Pacific Rubber Cable Co. Ltd. (PRC JV)
Shandong Huayu Pacific Fiber Optics Comm. Co.
(PRC JV)
Shandong Huayu Pacific Fiber Optics Comm. Co.
(PRC JV)
Shandong Pacific Fiber Optic Cable Co. Ltd. (PRC
JV)
Shandong Pacific Fiber Optic Cable Co. Ltd. (PRC
JV)
51.0% 25.0% 33.0%
PRC(APWC) Holdings Ltd.(BVI)
PRC(APWC) Holdings Ltd.(BVI)
Ningbo Pacific Cable Co. Ltd. (PRC)
Ningbo Pacific Cable Co. Ltd. (PRC)
Charoong Thai Wire & Cable Co. (Thailand)
Charoong Thai Wire & Cable Co. (Thailand)
Pacific Thai Electric Wire & Cable Co.,
Ltd.
Pacific Thai Electric Wire & Cable Co.,
Ltd.
Siam Pacific Electric Wire & Cable Ltd.
Siam Pacific Electric Wire & Cable Ltd.
Sigma Cable Company (Pte) Ltd.
(Singapore)
Sigma Cable Company (Pte) Ltd.
(Singapore)
98.3%
SingaporeChina
ThailandAustralia
Asia Pacific Wire & Cable Corp.. Ltd.
(Bermuda)
Asia Pacific Wire & Cable Corp.. Ltd.
(Bermuda)
100%
50.9%
100%
100%
Holding / Parent Company
China (under restructuring)
16.0%
Epan Industries Pte. Ltd. (Singapore)
Epan Industries Pte. Ltd. (Singapore)
100%
35.21% 51.0% 100% 100% 100%13.79%
www.apwcc.com27
Contact InformationContact Information
Asia Pacific Wire & Cable Corporation
Frank Tseng, Chief Financial Officer
Phone: +886 (2) 2712 2558 ext. 66
Email: [email protected]
www.apwcc.com
CCG Investor Relations
John Harmon, CFA, Sr. Acct. Manager
Phone: +86-10-6561-6886 Ext. 807
E-mail: [email protected]
Mr. Bryan Blake, MI Executive
Phone: +1-646-833-3416
E-mail: [email protected]
www.ccgirasia.com
Legal Counsel
Thompson Hine LLP
Auditor
Ernst & Young (Hong Kong)