Embed Size (px)
Citation preview

November 19, 2018
Japan Iron and Steel Federation
JISF long-term vision for climate change mitigation
A challenge towards zero-carbon steel
Introduction
In November 2014, the Japan Iron and Steel Federation announced the "Commitment to a Low
Carbon Society Phase II" with the target year of 2030. This plan is also reflected in Japan's NDC
(2030 target) based on the Paris Agreement, and each member of the Japan Iron and Steel
Federation is making constant efforts to achieve it.
The Paris Agreement invites all Parties to formulate and submit by 2020 a “long-term low
greenhouse gas emission development strategies” to achieve the long-term goal (2DS target).
Japanese government has set up the "advisory committee to establish the “national long-term
development strategies based on the Paris agreement”.
In response to such domestic and international movements, in addition to the ongoing efforts to
achieve the "Commitment to a Low Carbon Society Phase II", the Japan Iron and Steel
Federation has decided to formulate the “long term vision for climate change mitigation” for 2030
and beyond, which aims to realize the “zero-carbon steel”.
1. A prediction of future steel demand and supply
Steel materials are excellent in many aspects required in basic materials, such as resource
availability, manufacturing cost, diversity of functions, environmental burdens during production,
recyclability, etc. Because of this, they support our lives as the main materials that make up
social infrastructure and durable consumer goods, such as roads, railroads, buildings, cars and
home appliances.
In the beginning, steel materials are produced by reducing iron ore, which is a natural resource,
but steel has an excellent recycling characteristic (closed-loop recycling) which is not found in
other materials, where most of the reduced steel materials are recovered as scraps and are
reborn into new steel products after the end of life of finished products such as automobiles. As
a result, steel materials once produced from natural resources are accumulated in the society
while changing their shapes to various products (Fig. 1).
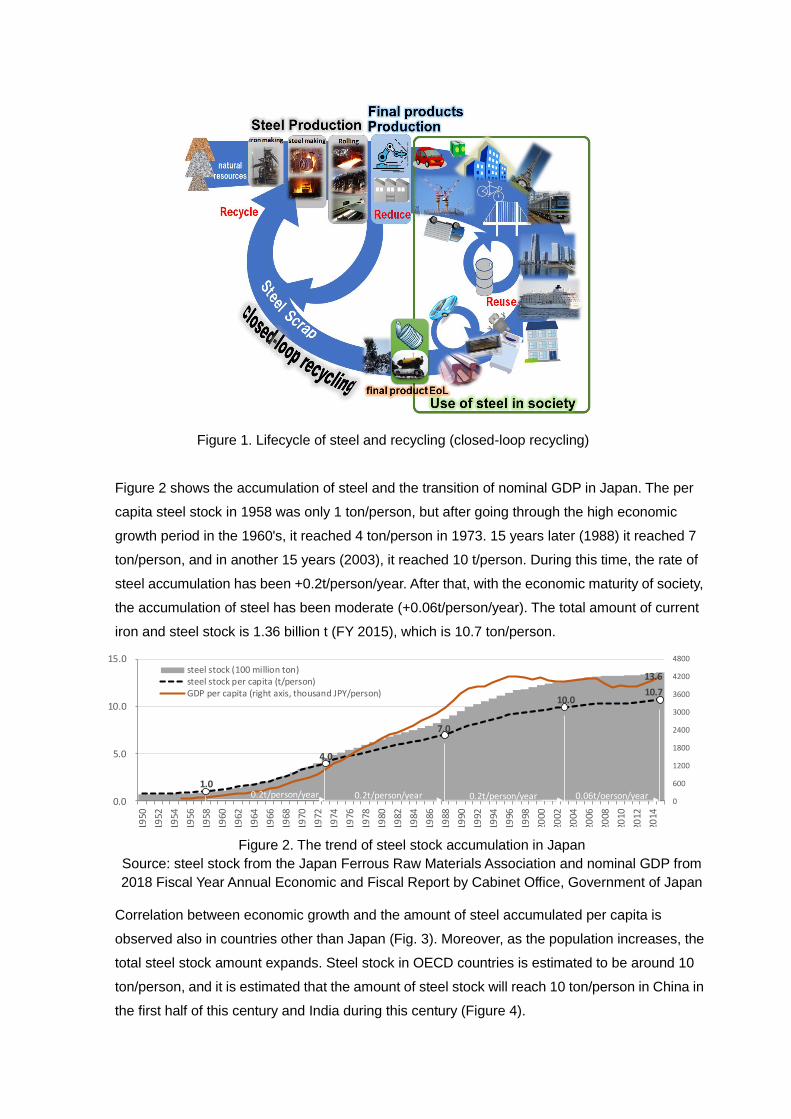
Figure 1. Lifecycle of steel and recycling (closed-loop recycling)
Figure 2 shows the accumulation of steel and the transition of nominal GDP in Japan. The per
capita steel stock in 1958 was only 1 ton/person, but after going through the high economic
growth period in the 1960's, it reached 4 ton/person in 1973. 15 years later (1988) it reached 7
ton/person, and in another 15 years (2003), it reached 10 t/person. During this time, the rate of
steel accumulation has been +0.2t/person/year. After that, with the economic maturity of society,
the accumulation of steel has been moderate (+0.06t/person/year). The total amount of current
iron and steel stock is 1.36 billion t (FY 2015), which is 10.7 ton/person.
Figure 2. The trend of steel stock accumulation in Japan
Source: steel stock from the Japan Ferrous Raw Materials Association and nominal GDP from
2018 Fiscal Year Annual Economic and Fiscal Report by Cabinet Office, Government of Japan
Correlation between economic growth and the amount of steel accumulated per capita is
observed also in countries other than Japan (Fig. 3). Moreover, as the population increases, the
total steel stock amount expands. Steel stock in OECD countries is estimated to be around 10
ton/person, and it is estimated that the amount of steel stock will reach 10 ton/person in China in
the first half of this century and India during this century (Figure 4).
13.6
1.0
4.0
7.0
10.0 10.7
0
600
1200
1800
2400
3000
3600
4200
4800
0.0
5.0
10.0
15.0
1950
1952
1954
1956
1958
1960
1962
1964
1966
1968
1970
1972
1974
1976
1978
1980
1982
1984
1986
1988
1990
1992
1994
1996
1998
2000
2002
2004
2006
2008
2010
2012
2014
steel stock (100 million ton)steel stock per capita (t/person)GDP per capita (right axis, thousand JPY/person)
0.2t/person/year 0.06t/oerson/year0.2t/person/year 0.2t/person/year

Table 1 shows the global steel stock in 2015 and the estimated values for 2050 and 2100. The
total amount of steel stock in the world in 2015 is estimated to be 29.4 billion tons and 4.0
ton/person. This is equivalent to Japan's steel stock level in 1973. The world population is
expected to increase in the future as well. Moreover, as the world economy grows, it is
assumed that in 2050 the total steel stock will reach 7.0 ton/person and 68.2 billion tons in total.
It is a macro-level assumption that it will take 35 years for the world to increase the steel stock
from 4 to 7 tons per capita, where it took Japan 15 years from 1973 to 1988, and that the world
steel stock would reach 7 tons per capita 62 years later than Japan. While the uncertainty
increases towards 2100, steel stock of 10 tons/person was assumed, supposing that the SDGs
(Sustainable Development Goals) are achieved, and the same level of wealth as the current
developed countries is realized across the world through economic growth and poverty
eradication.
Table 1. Estimates of world population and steel stock
*from UN, World Population Prospects 2017
Table 2 forecasts the steel production that would be necessary to satisfy such steel stock
accumulation. In 2015, actual steel production amounts in the world were 1.29 billion tons of
actual steel material used in the final products and 1.62 billion tons of crude steel production.
Among the iron sources were 1.22 billion tons of pig iron (including DRI) from the natural
resource route, and 560 million tons of scrap from recycling route. For the future, as the
demand for steel products increase (1.29 billion tons in 2015 → 2.13 billion tons in 2050 → 3.01
2015 2050 2100
7.38 9.77 11.18
Per Capita (t/person) 4.0 7.0 10.0
total (billion ton) 29.4 68.2 111.8
World Population (billion) *
Steel Stock
Source: Muller, et.al, “Patterns of Iron Use in Societal Evolution”, Environ. Sci. Technol. 2011, 45
Source: “Sustainable steel: at the core of a green economy”, World Steel Association, 2012
Figure 3. Relationship between GDP per capita and steel stock
Figure 4. Transition of steel stock per capita

billion tons in 2100), crude steel production will also increase (1. 62 billion tons in 2015 → 2.68
billion tons in 2050 → 3.79 billion tons in 2100 ). As for the iron source, the amount of scrap
used increases (560 million tons in 2015 → 1.55 billion tons in 2050 → 2.97 billion tons in 2100)
as the generation of scrap increases mainly due to the expansion of steel stock. However, as
scrap alone cannot meet steel demand, the production from the natural resource route is
essential for keeping up with the steel stock accumulation. Therefore, almost the same level of
pig iron production now (1.2 billion tons) will still be required in 2100. Figure 5 shows the
forecasts of steel accumulation and supply and demand of steel until 2100 (the preconditions of
calculation is given in Appendix I).
Table 2. Forecast of Steel Production
Figure 5. Forecasts of steel stock accumulation and steel production
2. Long-term global warming mitigation scenario of steel industry
BAU (Business as Usual) Scenario
The amount of crude steel production changes, while the CO2 intensity stays at the current
level for both natural resource route and the recycling route. The amount of scrap recovered (=
used) increases with the expansion of steel stock etc., leading to a rise of the scrap ratio in the
iron source. Since the scrap does not require the reduction process necessary for natural
resources, the CO2 emission per unit of crude steel produced will be reduced. However, the
total amount of CO2 emissions will increase due to the increase in the amount of crude steel
production.
(billion ton)
2015 2050 2100
1.29 2.13 3.01
1.62 2.68 3.79
1.22 1.4 1.2
0.56 1.55 2.97
Amount of steel in final products
Crude steel production
Pig iron production
Scrap consumption
29
68
112
7.4
9.8
11.2
4.0
7.0
1.62
2.68
3.79
1.22 1.40
1.20
0.56
1.55
2.97
0.0
2.0
4.0
6.0
8.0
10.0
12.0
0
20
40
60
80
100
120
20
11
20
13
20
15
20
17
20
19
20
21
20
23
20
25
20
27
20
29
20
31
20
33
20
35
20
37
20
39
20
41
20
43
20
45
20
47
20
49
20
51
20
53
20
55
20
57
20
59
20
61
20
63
20
65
20
67
20
69
20
71
20
73
20
75
20
77
20
79
20
81
20
83
20
85
20
87
20
89
20
91
20
93
20
95
20
97
20
99
2015
2050
2100
world population (right axis, billion)
total stock (left axis, billion t)
stock per capita (right axis)
crude steel production (right axis, billion t)
scrap generation (right axis, billion t)pig iron (right axis, billion t)

Maximum Introduction of BAT (Best Available Technologies) Scenario
Maximize the diffusion of existing advanced energy saving technologies to the world. IEA ETP
2014 assumes that the reduction potential by international diffusion of BAT is 21%, and that this
will be achieved by 2050. Although the CO2 intensity will be improved compared to the BAU
scenario, the total amount of CO2 emission will increase due to the increase in the amount of
crude steel production.
Maximum Introduction of Innovative Technologies Scenario
It is assumed that the innovative technology currently being developed (COURSE 50: hydrogen
reduction portion, ferro coke, etc) will be introduced at the maximum level from 2030 to 2050,
and the CO2 intensity in the natural resource route will be improved by 10%.
Super Innovative Technologies Development Scenario
With the introduction of super innovation technologies (hydrogen reduction steel production,
CCS, CCU etc.) that are not yet in place and the achievement of zero emission of the grid
power supply, it is assumed that "zero-carbon steel" will be realized in 2100. Based on the level
of achievement in 2050, low level case (20% reduction in CO2 intensity from the Maximum
Introduction of Innovation Technologies Scenario), middle level case (50% reduction) and high
level case (80% reduction) were estimated.
Figure 6. Transition of CO2 intensity in long-term climate change mitigation scenario
Figure 7. Transition of CO2 emission in long-term climate change mitigation scenario
1.84 1.67
1.40
1.97
1.69 1.32
1.05 1.23
0.97 0.98
0.61
0.25
0.00
0.50
1.00
1.50
2.00
2.50
2015 2030 2050 2100
low level case
mid level case
high level case
super innovative technologies scenarioH2 reductionCCS, CCUZero-emission electricity
BAU scenarioBAT max introduction scenarioinnovative technologies max introduction scenariosuper innovative technologies scenario
CO2 intensity( t-CO2/t-crude steel)
3.9 4.5
5.3
3.2 3.5
3.5 4.0
3.3
3.7
2.6
1.6
0.7
0.0
1.0
2.0
3.0
4.0
5.0
6.0
2015 2030 2050 2100
total emissions(billion t-CO2) BAU scenarioBAT max introduction scenarioinnovative technologies max introduction scenariosuper innovative technologies scenario
low level case
mid level case
high level case
super innovative technologies scenarioH2 reductionCCS, CCUZero-emission electricity

In addition, when the Super Innovative Technologies Scenario is executed only with CCS, the
total storage volume in 2030-2100 can be estimated as 91.1 billion t- CO2 in the low level case,
101.2 billion t- CO2 in the middle level case, 111.2 billion t- CO2 in high level case. It is also
necessary to solve the issues that go beyond technical aspects, such as securing CO2 storage
sites, acceptance from society, implementing entities, and distribution of the economic burdens.
Moreover, the amount of hydrogen required for producing pig iron in hydrogen reduction in
2100 is estimated to be 1.2 trillion Nm 3, and the low cost and stable supply of large amounts of
carbon-free hydrogen is a requirement for practical application.
3. Long-Term Climate Change Mitigation Measures by Japan Iron and Steel Federation
40% of the world's steel products are traded across national borders. More than 60% of the
steel produced in Japan is directly and indirectly exported, catering to the global steel demand.
In this way, both the supply chain and the market are globalized in the steel industry, and a
global viewpoint is indispensable for effective measures against global warming in the steel
sector.
Japan's steel industry has greatly contributed to the world's steel industry through excellent
energy saving and environmental technologies. In addition, it has been leading the world in
product functions, enhancing the international competitiveness of our country as well as the
compatibility of human wellness and global environment through development of steel products
contributing to improved functionality and efficiency of the final products, including weight
reduction and electrification of automobiles. These facts are the basis of the current
"Commitment to a Low Carbon Society" and constitute the basic idea in the long-term climate
change mitigation measures after 2030.
In consideration of the long-term target (2DS target) under the Paris Agreement, development
of super innovative technologies that exceed even the innovative technologies currently under
development is required, in addition to the existing technologies. Figure 8 shows the basic idea
of the Japan Iron and Steel Federation's long-term climate change mitigation strategy.
Figure 8. The Basic ideas of JISF’s long term climate change mitigation measures (3 ecos and
development of innovative technologies)
Eco ProductContribution through supplying high-
performance steel products required in a low-carbon society
Eco Process
Eco Solution
Efficiency improvement of production process
Contribution at a global level through diffusion of advanced energy efficient
technologies
Innovative technologies: COURSE 50, ferro coke, etc.Super innovative technologies: hydrogen reduction iron making, CCS, CCU,etc.

1) Efforts in “three ecos”
[Eco Process]
Triggered by the oil shock in the 1970s, the Japanese iron and steel industry has been
undertaking the development and introduction of energy efficient technologies on the basis of:
1) process innovation focusing on making processes continuous etc., 2) efficient use of
by-product gases generated in iron and steelmaking processes, 3) recovery and effective
utilization of waste energy, and 4) effective use of waste resources (Fig. 9). As a result, it has
achieved the world's highest energy efficiency processes (Figure 10). The Japanese steel
industry will continue to develop and introduce "eco-process" in the long-term climate change
mitigation strategy.
Reference: The effect of “eco process” (by 2030) in the Commitment to a Low Carbon Society
Phase II is 9 million t-CO2
Figure 9. Eco process activities by Japan iron and steel industry
Figure 10. Energy intensity of major steel producing countries
(index where 100 is set as Japan level)
Source: RITE, “Estimates of energy intensity in 2015” (translation into index by JISF)
[Eco solution]
Japan Iron and Steel Industry has been contributing to CO2 reduction on a global scale through
transfer of energy conservation technologies (BAT technology) developed and put to practical
use in Japan to countries where the steel industry is experiencing rapid growth, including China,
India and ASEAN, as well as through promotion of energy conservation in the framework of
’70s ’80s ’90s ’00s ’10s
gas holder, gas turbine combined cycle 2) efficient use of by-product gases H2 Supply, CO2 Separation & recovery
TRT, CDQ, etc3) heat recovery regenerative burners, tec. recovery& use of mid to low temperature heat
1) process innovation/efficiency improvement
CC, C.A.P.L PCI, coal moisture control SCOPE-21
AI/Logistics Efficiency, etc.
4) use of waste materials plastics, tires biomass
dust, sludge
73 the first oil shock Kyoto Protocol
COURSE50・Ferro-cokes
’20s ’30 and beyond
Paris Agreement
Voluntary Action Plan Commitment to a LowCarbon Society
long-term vison for climate change mitigation
su
pe
r inn
ov
ativ
e
tech
no
logie
s

multilateral cooperation, such as GSEP "Global Superior Energy Performance Partnership" etc..
In the research by the International Energy Agency (IEA), it is shown that the reduction
potential in overseas by introducing advanced energy-saving technologies (many of which
were developed in Japan) is extremely large (Fig. 11). Japan iron and steel industry will
continue to work on "eco solution".
Reference: The effect of “eco solution” (by 2030) in the Commitment to a Low Carbon Society
Phase II is 80 million t-CO2
Figure 11. International comparison of energy savings potential in steel industry
Source: IEA, “Energy Technology Perspective 2014”
[Eco Product]
Iron and steel materials have greatly improved their mechanical and electromagnetic properties.
For example, the strength of steel sheets for automobiles has been improved from the 1970's to
the present day, in response to various social backgrounds and needs. This led to an
improvement in fuel economy by reducing the weight of automobiles, and greatly contributed to
CO2 reduction. However, the characteristic level we put into practical use is only 1/10-1/3 (in
the case of strength) with respect to the theoretical limit value (Fig. 12). Japan iron and steel
industry will contribute to the reduction of CO2 in the entire life cycle, while supporting the
foundation of the future society, through not only further strengthening steel products but also
developing next-generation steel products for hydrogen infrastructure to be expected in the
future.
Reference: The effect of “eco product” (by 2030) in the Commitment to a Low Carbon Society
Phase II is 42 million t- CO2

Figure 12. History of high-tensile steel development and future potentials
2) Approach to development of super innovation technologies
The Japanese iron and steel industry is diligently pursuing the development of innovative iron
making technologies such as COURSE50 and ferro coke to realize practical application by
2030. When these technologies are put to practical use, they are expected to reduce CO2
emissions of natural resource routes by 10% (excluding CCS effect). It is necessary to advance
the establishment of low carbon technologies on the premise of blast furnace use, since the
blast furnace method is considered to be the mainstream of the steel manufacturing method in
the meantime, both technically and economically. However, these efforts alone cannot reach
the long-term target level of the Paris Agreement (Maximum Introduction of Innovative
Technologies Scenario in Figure 7), and "super innovation technologies" beyond them are
necessary. The Japanese iron and steel industry will, using the knowledge gained from the
development of COURSE50 and ferro coke as a foothold, challenge to develop technologies
that will ultimately achieves zero emissions from iron making process, including iron reduction
technologies using hydrogen, CCS (Carbon Capture and Sequestration) that would recover
and store CO2 from steel production and CCU (Carbon Capture and Utilization) that produces
valuable materials using CO2 as a raw material.
The practical application of hydrogen reduction iron making process is premised that hydrogen
is developed and maintained as a common energy carrier for the society, as it is widely used
not only in steel production but also in various sectors such as automobiles and consumer use.
Especially, an important requirement for hydrogen to be used for the production of steel, which
is a basic material, is stable supply at low cost, in addition to being carbon free. Moreover, the
implementation of CCS requires, in addition to the development of cheap transportation and
storage technologies for large quantities of CO2, solving issues that go beyond technical
aspects, such as securing CO2 storage sites, acceptance from society, implementing entities,
and distribution of the economic burdens.
0 1 2 3 4 5 6 7 8 9 10 11Tensile Strength (GPa)
steel plate for cars
bridge cable steel cord Theoretical strength: 10.4GPapiano wire
1960s 1970s 1980s 1990s 2000s 2010s
Changes in social background and needsrapid economic
growth fuel efficiency collision safety Kyoto Protocol Paris Agreementglobal warming
mild steel(easy workability)
high-tensile steel super high-tensile steel
~440MPa level ~590MPa level 780~980MPa 1180MPa~
potential

Figure 13 shows a road map for the development of super innovation technologies.
In Conclusion
The super long-term future beyond 2030 includes uncertainties that cannot be assumed at the
moment, such as social situation and technology trends, and the "long-term vision for climate
change mitigation" presented here is to indicate a direction towards achieving the long-term
goal of the Paris Agreement, and it signifies a challenge to realize "zero-carbon steel".
Each member company of the Japan Iron and Steel Federation will, while continuing to fulfill
the Commitment to a Low Carbon Society to achieve Japan's mid-term Paris Agreement target
(2030), tackle the climate change mitigation measures beyond 2030 with “three ecos” and
development of innovative technologies.
Development of technologies specific to iron & steel sector 2100
COURSE50 H2 reduction in BF (internal H2)
Super COURSE50 H2 reduction in BF (external H2)
H2 reduction iron making H2 reduction without using BF
CCS Recovery of CO2 from BF gas, etc.
CCU Adding value to CO2 from steel plant
Development of common fundamental technologies for society
Zero-emission electricity Zero-emission electricity through nuclear, renew ables, etc.
Carbon-free H2 Low cost, large quantity production w ith nuclear and renew ables
CCS/CCU cheap storage, location, adding value, etc.
2010 2020 2030 2040 2050
introduction
開発
introductionR&D
R&DStepping up
Stepping up introductionR&D
introductionR&D
introductionR&D
R&D
実機化開発 introductionR&D
introductionR&D

Appendix I: Assumptions for the calculation of the future steel demand and supply
a) Steel stock per capita
2015:4.0t/person (actual data)
2050:7.0t/person (assumed)
2100:10.0t/person (assumed)
b) Population
World Population Prospects2017, UN
c) Diffusion and loss
0.1% of the total steel stock was assumed to be diffused or lost.
d) The rate of scrap generation
d-1) internal scrap: 12.5% of total crude steel production (2015 actual data)
d-2) manufacturing scrap: 9.3% of total steel products shipped out (2015 actual data)
d-3) end-of-life scrap: assumed to increase gradually from 0.8% of total steel stock in 2015
(actual data) → 1.5% in 2050→ 2.0% in 2100.
e) Yield ratio of crude steel to iron source
Yield ratio of crude steel to iron source was set as 91% (2015 actual data) for both pig iron and
scrap
Table A-I Future estimates of steel supply and demand
Loss rate World Pop.
Pig iron internal/manufactur
ing/EoL/ total per capita (%) (billion)
DRI crude steel products steel stock (bill ion t) (t/person)
2015 1.62 1.22 0.56 0.20 0.13 0.22 12.5 9.3 0.8 29.4 4 0.1 7.38
2020 1.85 1.35 0.68 0.23 0.15 0.3 12.5 9.3 0.9 34.8 4.5 0.1 7.8
2030 2.1 1.38 0.92 0.26 0.17 0.49 12.5 9.3 1.1 46.2 5.4 0.1 8.55
2050 2.68 1.4 1.55 0.34 0.22 0.99 12.5 9.3 1.5 68.2 7 0.1 9.77
2100 3.79 1.2 2.97 0.47 0.31 2.19 12.5 9.3 2 111.8 10 0.1 11.18
Production (billion t) Scrap Generation (billion t) Scrap Generation Rate (%) Steel Stock
crude steel total internalmanufactur
ingend-of-life
2015 2050 2100
7.38 9.77 11.18
Per Capita (t/person) 4.0 7.0 10.0
total (billion ton) 29.4 68.2 111.8
World Population (billion)
Steel Stock

Appendix II: Consistency with IEA-ETP2017 2DS
IEA-ETP 2017 2DS assumes zero emission from the electricity sector and reduction of emission
from the industry sector by 30% from present level by 2060.
When zero emission from the electricity sector is achieved, emission from grid electricity consumed
in steel production process will becomes zero. Topping this with the effect of maximum
implementation of BAT and the effect of COURSE50 (Hydrogen reduction) from the Maximum
Introduction of Innovative Technologies Scenario, the emission level in 2060 comes near the 30%
reduction presented in the IEA-ETP 2017 2DS. Furthermore, when the CCS effect of COURSE50 is
added, the scenario shows almost 50% reduction by 2060.
Calculation assumptions:
1. Emission factor from gird electricity:combined average from IGES GRID EF v10.2
2. Grid electricity intensity in BF-BOF route: 140kWH/t-s (2016 average of Japan)
3. Grid electricity intensity in EAF route: 872kWH/t-s (2016 average of Japan)
4. CO2 emission factor in BF-BOF route: 2.4t- CO2/t-s
5. CO2 emission factor in EAF route: 1.0t- CO2/t-s
6. Yield of crude steel against iron source: 0.91 (both natural resource route and scrap route)
Fig A-lI Relationship between IEA-ETP 2017 2DS and long-term climate change mitigation scenarios
Gabi Professional TS DB
1.84
1.67 1.60 1.77
1.47 1.30
1.16
0.90
1.56
1.04
0.80
1.97
0.81
0.59
0.00
0.50
1.00
1.50
2.00
2.50
2015 2030 2050 2060
Emissions Intensity(t-CO2/t-crude steel)
BAU Scenario
Zero-Emission Electricity @2060
BAT max. introduction
COURSE50 (H2)
COURSE50(H2+CCS)
3.9
4.5 4.6
3.7
3.9 3.7
3.1
2.6 3.3
2.8
2.3
3.2
2.2
1.7
0.0
1.0
2.0
3.0
4.0
5.0
2015 2030 2050 2060
BAU Scenario
Zero-Emission Electricity @2060
BAT max. introduction
COURSE50 (H2)
COURSE50(H2+CCS)
Total Emissions (Billion t-CO2)
2DS scenario: -30%(2.24)@2060