Embed Size (px)
Citation preview
THE MINNEAPOLIS PLANTO END TOO BIG TO FAIL
NOVEMBER 16, 2016
FULL PROPOSAL
COMMENT PERIOD ENDS JANUARY 17, 2017
Sections of Discussion
Section 1 Summary of the Minneapolis Fed Plan to End Too Big To Fail (TBTF) 1
Section 2 Recommendations: Key Support and Motivation 5
Section 3 General Empirical Approach for the Capital and Leverage Tax Recommendations 15
Section 4 Technical Calculations Supporting the Capital and Leverage Tax Recommendations 30
Section 5 The Banking and Financial System Post-Proposal Implementation 35
Section 6 Request for Comments on the Minneapolis Plan to End Too Big to Fail 36
Appendix 38
Other References 49
TABLE OF CONTENTS
1 FEDERAL RESERVE BANK OF MINNEAPOLIS | THE MINNEAPOLIS PLAN
SECTION 1
Summary of the Minneapolis Plan to End Too Big to Fail (TBTF)
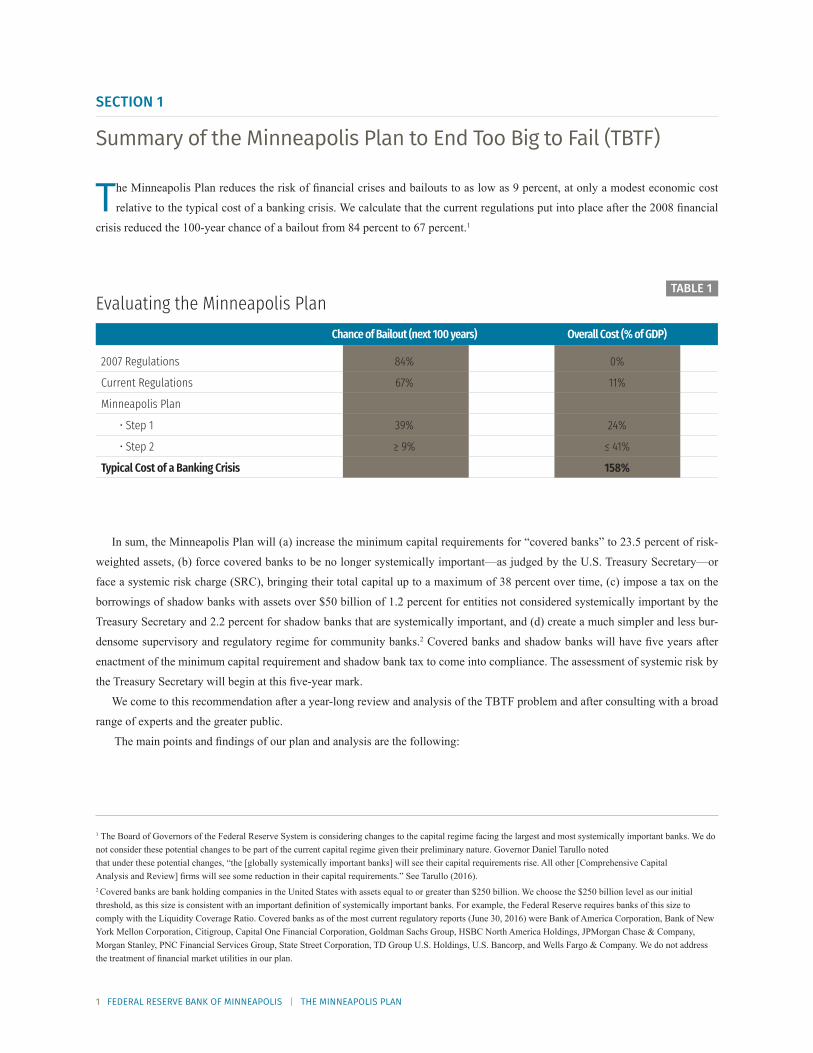
The Minneapolis Plan reduces the risk of financial crises and bailouts to as low as 9 percent, at only a modest economic cost
relative to the typical cost of a banking crisis. We calculate that the current regulations put into place after the 2008 financial
crisis reduced the 100-year chance of a bailout from 84 percent to 67 percent.1 TABLE 1
In sum, the Minneapolis Plan will (a) increase the minimum capital requirements for “covered banks” to 23.5 percent of risk-
weighted assets, (b) force covered banks to be no longer systemically important—as judged by the U.S. Treasury Secretary—or
face a systemic risk charge (SRC), bringing their total capital up to a maximum of 38 percent over time, (c) impose a tax on the
borrowings of shadow banks with assets over $50 billion of 1.2 percent for entities not considered systemically important by the
Treasury Secretary and 2.2 percent for shadow banks that are systemically important, and (d) create a much simpler and less bur-
densome supervisory and regulatory regime for community banks.2 Covered banks and shadow banks will have five years after
enactment of the minimum capital requirement and shadow bank tax to come into compliance. The assessment of systemic risk by
the Treasury Secretary will begin at this five-year mark.
We come to this recommendation after a year-long review and analysis of the TBTF problem and after consulting with a broad
range of experts and the greater public.
The main points and findings of our plan and analysis are the following:
1 The Board of Governors of the Federal Reserve System is considering changes to the capital regime facing the largest and most systemically important banks. We do not consider these potential changes to be part of the current capital regime given their preliminary nature. Governor Daniel Tarullo noted that under these potential changes, “the [globally systemically important banks] will see their capital requirements rise. All other [Comprehensive Capital Analysis and Review] firms will see some reduction in their capital requirements.” See Tarullo (2016).2 Covered banks are bank holding companies in the United States with assets equal to or greater than $250 billion. We choose the $250 billion level as our initial threshold, as this size is consistent with an important definition of systemically important banks. For example, the Federal Reserve requires banks of this size to comply with the Liquidity Coverage Ratio. Covered banks as of the most current regulatory reports (June 30, 2016) were Bank of America Corporation, Bank of New York Mellon Corporation, Citigroup, Capital One Financial Corporation, Goldman Sachs Group, HSBC North America Holdings, JPMorgan Chase & Company, Morgan Stanley, PNC Financial Services Group, State Street Corporation, TD Group U.S. Holdings, U.S. Bancorp, and Wells Fargo & Company. We do not address the treatment of financial market utilities in our plan.
TABLE 1Evaluating the Minneapolis Plan
Chance of Bailout (next 100 years) Overall Cost (% of GDP)
2007 Regulations 84% 0%
Current Regulations 67% 11%
Minneapolis Plan
• Step 1 39% 24%
• Step 2 ≥ 9% ≤ 41%
Typical Cost of a Banking Crisis 158%
2 FEDERAL RESERVE BANK OF MINNEAPOLIS | THE MINNEAPOLIS PLAN
The TBTF problem continues to be one of the most serious long-term risks to the U.S. economy.The TBTF problem arises when the largest and most systemically important banks fail and impose their losses onto other banks. The
spread of these losses fuel contagion as turmoil spreads throughout financial markets and into the rest of the economy. As the U.S.
economy experienced in the most recent crisis, these spillover losses have the ability to cause massive and widespread economic
devastation. When faced with economic catastrophe, government leaders are often compelled to act and to stop the hemorrhaging
by bailing out large banks, bank managers, and those who lent money to the banks.
In 2008, the risk of contagion presented by TBTF banks was central to the financial crisis. As a result, trillions of dollars in
American wealth was destroyed. Even now, eight years later, the effects of the crisis continue to be felt throughout the economy.
Despite reforms, the TBTF problem continues to persist. Soon after the crisis, policymakers moved swiftly to approve reforms to the financial system to help move the country in the right
direction. These reforms have indeed strengthened the financial system, and we support many of these efforts. However, many ex-
perts agree that TBTF still exists today because current plans to address it have not been fully implemented. More importantly, we
believe that the current plan, even when fully implemented, will not sufficiently minimize the threat of TBTF.
The current plan fundamentally rests on the belief that the government will, through a complicated scheme, force debt holders
of TBTF banks to absorb losses—even when the economy and financial markets appear weak. Yet our experience in the 2008 crisis
teaches us that when markets show weakness, even debt holders of TBTF financial firms who were informed that they would bear
losses in such times of distress do not actually incur any hit. This recent lesson of history and human behavior in times of market
stress makes clear that it is not credible to believe that any scheme, especially a complicated scheme, would work to impose losses
on debt holders of TBTF banks when the next crisis occurs. We have no reason to believe that the government will follow through
on its current plan in the next crisis because imposing losses on debt holders of TBTF banks in a weak environment will be viewed
as too risky and complex with a high likelihood of intensifying a crisis.
A wide range of transformational reforms to end TBTF were considered. Within our year-long ending TBTF initiative, our review included, but was not limited to, breaking up the banks, forcing banks
to become much safer through higher levels of equity funding, taxing leverage, and improving the resolution regime for banks. In
evaluating these various proposals, two guiding principles emerged as the basis of any policy recommendations: Reforms must be
simple enough that they can be easily implemented and allowed to work amid the chaos of a crisis, and reforms must pass a benefit
and cost test.
As discussed below, our proposal effectively melds ideas from virtually all of these transformative proposals. We advocate
for much higher capital levels for large banks and a tax on leverage for shadow banks. We also believe our plan will lead covered
banks to break themselves up to become non-systemically important while funded with much more capital. The societal benefit will
be a financial system with smaller banks with a much lower chance of failure. If these smaller banks do fail, they will not trigger
contagion to other banks and the broader economy.
We do not view improvements to currently proposed resolution schemes as a viable option because they focus on imposing losses
on creditors during a crisis. We also do not support breakup plans that merely separate investment banking from commercial banking.
This latter recommendation simply focuses on the wrong issue and would not prevent future bailouts.
GUIDING PRINCIPLES OF THE MINNEAPOLIS PLAN
After a year of study and analysis, we conclude that a higher equity requirement is the best reform policy because it is simple to
implement and directly addresses the TBTF issue. When covered banks issue more equity, their individual likelihood of failure is
reduced and the risk of and magnitude for contagion spreading across banks or throughout the economy are also lower. We stress
that the equity must be of high quality. In our plan, we restrict our definition of equity capital to be common equity or closely re-
3 FEDERAL RESERVE BANK OF MINNEAPOLIS | THE MINNEAPOLIS PLAN
lated items.3 We acknowledge that a byproduct of imposing higher capital requirements onto banks may be the migration of risky
activity from the banking sector to nonbank financial firms, where capital requirements are lower, if they exist at all. We address
this unequal treatment across sectors by taxing the borrowings of large nonbank financial firms—also known as shadow banks.
This tax would effectively make the cost of funds roughly equivalent between large banks and nonbanks.
In crafting the Minneapolis Plan, one of our concerns was the treatment of community banks. A primary purpose of the end-
ing TBTF initiative is to reduce the risk of contagion when systemically important banks fail. Community banks, however, do not
pose the same level of risk as large banks. It is certainly a traumatic event when a community bank, or even several, fails. We do
not minimize the consequences to those who are forced to take losses in such instances. Such localized failure, however, does not
threaten the overall economy. Thus, community banks deserve a separate regulatory and supervisory solvency regime that recog-
nizes their role in the financial system and focuses on the few, but important, factors that truly put them at risk of failure.
The Minneapolis Plan to end TBTF has four steps:
• Step 1. Dramatically increase common equity capital, substantially reducing the chance of bailouts
We will require covered banks to issue common equity equal to 23.5 percent of risk-weighted assets, with a corresponding
leverage ratio of 15 percent. This level of capital nearly maximizes the net benefits to society from higher capital levels. This
first step substantially reduces the chance of public bailouts relative to current regulations from 67 percent to 39 percent. This
substantial improvement in safety comes at a relatively low cost of gross domestic product (GDP). Covered banks will have five
years to come into compliance with this requirement.
• Step 2. Call on the U.S. Treasury Secretary to certify that covered banks are no longer systemically important, or else subject
those banks to extraordinary increases in capital requirements, leading many to fundamentally restructure themselves
Once the new 23.5 percent capital standard has been implemented, we will call on the Treasury Secretary to certify that
each covered bank is no longer systemically important. Our proposal gives the Treasury Secretary the discretion to make this
determination so that it can rely on the best information and analysis available. We suggest that the Treasury start by reviewing
existing metrics of systemic risk used to determine current GSIB surcharges. The Treasury will also have the authority to look
beyond covered banks in making its determination. If the Treasury refuses to certify that a covered bank is no longer systemi-
cally important, that bank will automatically face increasing common equity capital requirements, an additional 5 percent of
risk-weighted assets per year. This process will begin five years after enactment of the Minneapolis Plan. The bank’s capital
requirements will continue increasing either until the Treasury certifies it as no longer systemically important or until the bank’s
capital reaches 38 percent, the level of capital that reduces the 100-year chance of a crisis below 10 percent.
Step 2 is a critical step for ending TBTF. Under the current regulatory structure, there is no explicit timeline for ending TBTF,
and regulators never have to formally certify that large banks and shadow banks are no longer systemically important. Instead,
banks and designated nonbank financial firms can continue to operate under their explicit or implicit status as TBTF institutions
potentially indefinitely. The Minneapolis Plan reverses this approach and gives the Treasury Secretary a new mandate with a
hard deadline. Five years after enactment of the Minneapolis Plan, the Treasury either will certify that large banks are no longer
systemically important or those banks will face extraordinary increases in equity capital requirements.
We believe that these automatic increases in capital requirements will lead banks to restructure themselves such that their
failure will not pose the spillovers that they do today and lead to future bailouts. We chose the capital level that reduces the
3 We are counting as “common equity” the items that are allowed to count in the Common Equity Tier 1 requirement, which is defined as common shares for regula-tory purposes, surplus stock, retained earnings, accumulated other comprehensive income, and common shares issued by consolidated subsidiaries. The sum of these elements is subject to a limited set of regulatory adjustments. For more specifics, see the Federal Register, vol. 78, no. 198 from Oct. 11, 2013. This rule implements the Basel III regulatory capital reforms from the Basel Committee on Banking Supervision and certain changes required by the Dodd-Frank Wall Street Reform and Consumer Protection Act.
4 FEDERAL RESERVE BANK OF MINNEAPOLIS | THE MINNEAPOLIS PLAN
probability of a bailout in Organisation for Economic Co-operation and Development (OECD) countries to 10 percent or below
while keeping total costs below benefits. This level of capital is appropriate for the largest banks that remain systemically im-
portant, as their failure alone could bring down the banking system.
The only banks that could remain systemically important after the Minneapolis Plan has been fully implemented would have
38 percent common equity capital, with a risk of failure that is exceptionally low. This is a similar approach regulators have taken
with nuclear power plants: While not risk free, they are so highly regulated that the risks of failure are effectively minimized. Step
2 of the Minneapolis Plan reduces the chance of future bailouts to 9 percent over 100 years.
• Step3.PreventfutureTBTFproblemsintheshadowfinancialsectorthroughashadowbankingtaxonleverageWe discourage the movement of activity from the banking to shadow banking sector by levying a shadow bank tax. The tax
equalizes the funding costs between the two sectors. The tax will have two rates. To equalize funding costs with a 23.5 mini-
mum equity requirement, we would levy a tax on shadow bank borrowing of 1.2 percent. This tax rate would apply to shadow
banks that do not pose systemic risk as judged by the Treasury Secretary. A tax rate equal to 2.2 percent would apply to the
shadow banks that the Treasury refuses to certify as not systemically important. Thus, the shadow bank tax regime mirrors our
two-tier capital regime. These taxes should reduce the incentive to move banking activity from highly capitalized large banks to
less-regulated firms that are not subject to such stringent capital requirements. Nonbank financial firms that fund their activities
with equity do not pay the tax. Shadow banks will have five years from enactment of the Minneapolis Plan before they begin
paying the shadow bank tax. The Treasury Secretary will start making certifications as to the systemic importance of shadow
banks at that point. Here, too, we grant the Treasury discretion to look across all nonbank financial firms in its certification
process.
• Step 4. Reduce unnecessary regulatory burden on community banks
Ending TBTF means creating a regulatory system that maximizes the benefits from supervision and regulation while mini-
mizing the costs. The final step of the Minneapolis Plan would allow the government to reform its current supervision and regu-
lation of community banks to a system that is simpler and less burdensome while maintaining its ability to identify and address
bank risk-taking that threatens solvency.
The rest of this document is organized as follows: • Section 2 discusses the proposal in more detail, focusing on key support and motivation for our recommendations.
• Section 3 describes the general empirical approach behind our capital and leverage tax recommendations.
• Section 4 describes the more technical calculations behind the capital and leverage tax recommendations.
• Section 5 provides a very brief vision for the future of the banking system once the Minneapolis Plan is implemented.
• Section 6 is a request for comment on the Minneapolis Plan.
The appendix describes some but not all of the input we received in the process of engaging with the public and experts on steps
to end TBTF.
Other references are compiled at the end of the document.
A Summary for Policymakers can be found at www.minneapolisfed.org.
5 FEDERAL RESERVE BANK OF MINNEAPOLIS | THE MINNEAPOLIS PLAN
We propose to end TBTF through four steps. In Step 1, we propose significantly increasing the minimum capital requirements for covered banks. The capital requirement would
be 23.5 percent on a risk-weighted basis. New covered banks that come into existence due to mergers, acquisitions, or the formation
of a new holding company will be subject to the requirements upon completion of the corporate action. The Minneapolis Plan will
index the $250 billion in assets threshold that defines covered banks to nominal GDP so that it continues to target relatively large
banks in the future. Covered banks will have five years post plan implementation before they must comply with this requirement.
In Step 2, the Minneapolis Plan will force these banks to cease being systemically important—as judged by the Treasury Secre-
tary —or face the SRC--bringing their total capital up to a maximum of 38 percent over time. This process will also start five years
after enactment of the proposal.
In Step 3, the Minneapolis Plan will impose a tax on the borrowings of shadow banks with assets over $50 billion. All of the non-
systemic shadow banks—shadow banks are defined more specifically in Section 3—will face a tax rate of 1.2 percent of borrowings
outstanding. The shadow banks that remain systemically important will face a tax rate of 2.2 percent. The plan will also index the
$50 billion threshold to nominal GDP. This aspect of the plan will go into effect five years after enactment.
Finally, in Step 4, we propose creating a much simpler and less burdensome supervisory and regulatory regime for community
banks. This recommendation reflects the ultimate goal of our ending TBTF initiative: to create a safe and sound banking system
serving firms and households with effective and appropriately sized regulation and supervision.
In this section, we provide more details on our proposal with key specifics and methodologies spelled out in Sections 3 and 4.4
We then define the nature of the TBTF problem more precisely and explain why this problem remains so important even after the
government has enacted reforms to try to address it. We also explain the similarities and differences between our proposal and
other potential transformative options to end TBTF. Finally, we discuss what our proposal means for other banking supervision and
regulation policies, particularly with regard to community banks, but also with regard to current reforms aimed at TBTF.
The material in this section and throughout the proposal reflects the product of a year-long effort that included a public, broad
review of a wide variety of ideas to end TBTF. The appendix discusses this process and summarizes lessons learned and key points
made over the course of our TBTF initiative.
2.1 The Minneapolis Plan to End TBTFOur plan to end TBTF has four steps as just discussed. We provide a summary of key features of each aspect of our plan in this
section. We first offer two ways of understanding the totality of the plan.
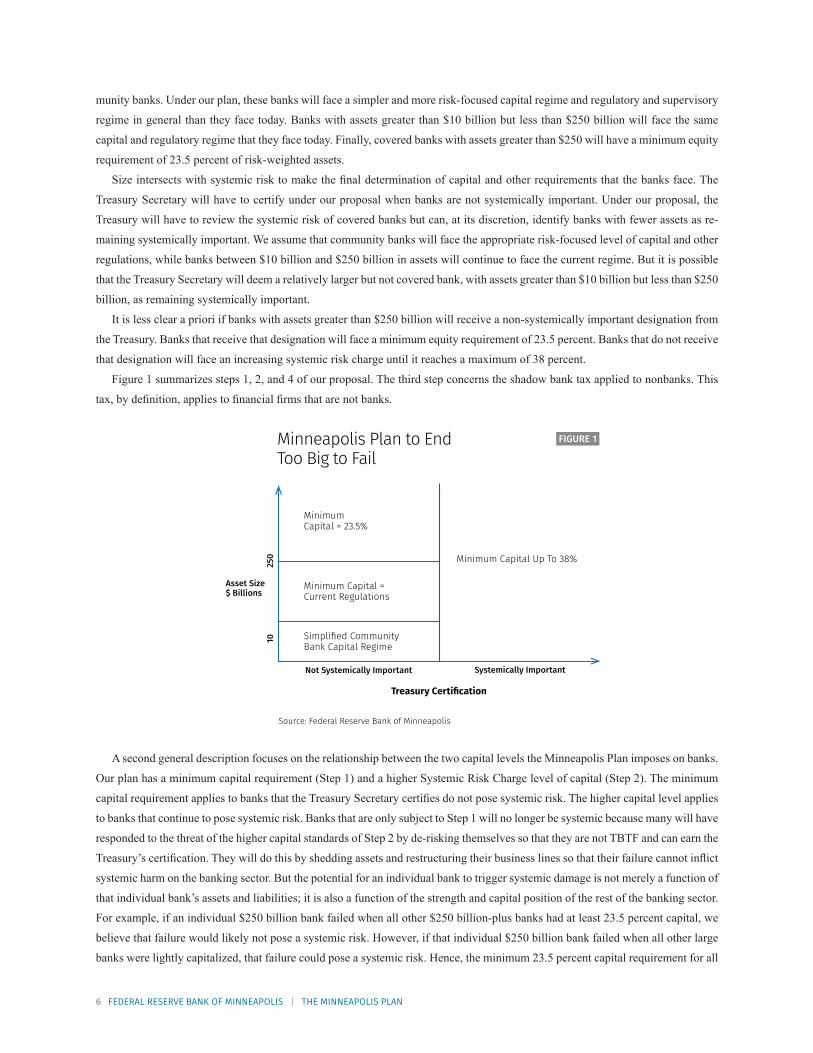
The first way focuses on the treatment of banks and is captured visually in Figure 1. The treatment that banks face under the
Minneapolis Plan varies by two factors: asset size and systemic risk. The larger the banks are, the more onerous the capital and
regulatory regime they will face. Banks that are systemically risky face a more onerous capital regime than banks that are not.
Naturally, firms that are both large and systemically important face the highest capital requirements, while small community banks
face the least costly regime, consistent with the risks they pose.
There are three key asset size groupings in the plan: Banks with assets greater than $250 billion, banks with assets between $10
billion and $250 billion, and banks with assets less than $10 billion. We define banks with asset sizes less than $10 billion as com-
SECTION 2
Recommendations: Key Support and Motivation
4 In later sections, we note many sources of uncertainty in our calculations and provide several types of sensitivity analysis. Here we note that any analytical effort to determine an appropriate level of capital or tax for systemically important banks and shadow banks with the goal of eliminating TBTF will face significant uncertainty and sensitivity in its calculations.
6 FEDERAL RESERVE BANK OF MINNEAPOLIS | THE MINNEAPOLIS PLAN
munity banks. Under our plan, these banks will face a simpler and more risk-focused capital regime and regulatory and supervisory
regime in general than they face today. Banks with assets greater than $10 billion but less than $250 billion will face the same
capital and regulatory regime that they face today. Finally, covered banks with assets greater than $250 will have a minimum equity
requirement of 23.5 percent of risk-weighted assets.
Size intersects with systemic risk to make the final determination of capital and other requirements that the banks face. The
Treasury Secretary will have to certify under our proposal when banks are not systemically important. Under our proposal, the
Treasury will have to review the systemic risk of covered banks but can, at its discretion, identify banks with fewer assets as re-
maining systemically important. We assume that community banks will face the appropriate risk-focused level of capital and other
regulations, while banks between $10 billion and $250 billion in assets will continue to face the current regime. But it is possible
that the Treasury Secretary will deem a relatively larger but not covered bank, with assets greater than $10 billion but less than $250
billion, as remaining systemically important.
It is less clear a priori if banks with assets greater than $250 billion will receive a non-systemically important designation from
the Treasury. Banks that receive that designation will face a minimum equity requirement of 23.5 percent. Banks that do not receive
that designation will face an increasing systemic risk charge until it reaches a maximum of 38 percent.
Figure 1 summarizes steps 1, 2, and 4 of our proposal. The third step concerns the shadow bank tax applied to nonbanks. This
tax, by definition, applies to financial firms that are not banks.
Source: Federal Reserve Bank of Minneapolis
FIGURE 1Minneapolis Plan to End Too Big to Fail
Not Systemically Important
Asset Size$ Billions
250
10
Systemically Important
Treasury Certification
Minimum Capital = 23.5%
Minimum Capital Up To 38%
Minimum Capital = Current Regulations
Simplified CommunityBank Capital Regime
A second general description focuses on the relationship between the two capital levels the Minneapolis Plan imposes on banks.
Our plan has a minimum capital requirement (Step 1) and a higher Systemic Risk Charge level of capital (Step 2). The minimum
capital requirement applies to banks that the Treasury Secretary certifies do not pose systemic risk. The higher capital level applies
to banks that continue to pose systemic risk. Banks that are only subject to Step 1 will no longer be systemic because many will have
responded to the threat of the higher capital standards of Step 2 by de-risking themselves so that they are not TBTF and can earn the
Treasury’s certification. They will do this by shedding assets and restructuring their business lines so that their failure cannot inflict
systemic harm on the banking sector. But the potential for an individual bank to trigger systemic damage is not merely a function of
that individual bank’s assets and liabilities; it is also a function of the strength and capital position of the rest of the banking sector.
For example, if an individual $250 billion bank failed when all other $250 billion-plus banks had at least 23.5 percent capital, we
believe that failure would likely not pose a systemic risk. However, if that individual $250 billion bank failed when all other large
banks were lightly capitalized, that failure could pose a systemic risk. Hence, the minimum 23.5 percent capital requirement for all
7 FEDERAL RESERVE BANK OF MINNEAPOLIS | THE MINNEAPOLIS PLAN
large banks is essential to enabling individual firms to make themselves no longer TBTF. The higher level of capital is needed for
the banks that continue to pose systemic risk to get their chance of failure down to minimal levels.
We now discuss more details of our plan.
2.1.1 Minimum Capital Requirement Proposal. The key features of the proposal are as follows:
• Only common equity or closely related items count toward meeting the requirement. Common equity is the most robust form of
capital for absorbing losses.
o Under current proposals, long-term debt counts toward measures of total loss-absorbing capacity (TLAC). We do not believe
long-term debt will actually absorb losses in a time of market stress. We believe the historical evidence is consistent with only
bank equity holders absorbing losses. In contrast, there is little historical domestic evidence to support the notion that bank debt
holders will absorb losses. There would be tremendous downside to taxpayers if the government counted on debt holders to
absorb bank losses and they did not.
• The 23.5 percent figure will apply to covered banks.
• The proposal also does not vary the minimum level of equity by bank or over time. This approach does have the downside of
potentially treating banks with varying levels of systemic risk the same in terms of equity requirements. However, we prefer a
less-complex capital regime. We also view 23.5 percent as the right minimum level of capital that all covered banks should fund
themselves with given our benefit and cost analysis.
• The 23.5 percent figure is a risk-weighted capital level. The equivalent leverage ratio is 15 percent.5
• We chose this level of minimum capital based on a benefit and cost analysis and by referencing current proposals.
o We detail our methodology in Sections 3 and 4. In summary, we consider the benefit of higher capital to be its ability to reduce
the likelihood of a banking crisis. We look at historical data on banking crises to calculate how a change in the capital level
of banks would reduce the chance of a country having a crisis and requiring government interventions like liquidity support,
restructuring, asset purchases, deposit freezes, or other guarantees. We consider such actions to constitute bailouts. Note that
there is a one-to-one relationship between calling an event a banking crisis and having a bank bailout in the data we review.
o The cost of higher capital is measured as the reduction in GDP that occurs because the cost of lending goes up, and thus less
lending occurs. Here, we follow the general methodology of the regulatory community and apply it using one of the Federal
Reserve Board’s models of the U.S. economy.
o This benefit and cost approach finds that a minimum capital requirement of about 22 percent maximizes net benefits. That is, it
is the point at which the marginal benefits of increased capital equal the marginal costs.
o The exact level of 23.5 percent comes from the TLAC proposal issued by the Board of Governors. This proposal applies to
banks in the United States considered to be global systemically important banks (GSIBs).6 The proposal sets the amount of
financial resources that the Board thinks GSIBs should have such that they can come out of an extraordinarily stressful period
without relying on public resources. Twenty-three and one-half percent of risk-weighted assets is the level of TLAC that the
Board would require of JPMorganChase at the time the proposed TLAC rule was released, which is the highest requirement for
any bank. We believe the Board’s sizing of financial resources that covered banks should have is reasonable.
• Step 1 goes into effect five years after enactment of our proposal.
5 We recommend the use of a corresponding leverage ratio target to avoid cases where the risk weights assigned to a given asset type are too low. In those cases, the amount of capital a bank issues relative to its underlying risk would also be too low and the bank would pose too high a chance of failure. We do not rely exclusively on a leverage ratio because that approach treats all assets as equally risky and thus can also not accurately set capital relative to the risk the bank takes on. We derive the proposed leverage ratio by determining the relationship between the total assets that covered banks use in their calculation of the leverage ratio relative to their risk weighted assets. We find that total assets for covered banks are 1.6 times risk weighted assets using year end 2015 data. We divide 23.5 by 1.6 to come to a cor-responding leverage ratio of 14.6 which we round to 15.6 The TLAC proposal as applied to the GSIBs is found at http://www.federalreserve.gov/aboutthefed/boardmeetings/ltd-chart-20151030.pdf. For the TLAC proposal, see http://www.federalreserve.gov/newsevents/press/bcreg/20151030a.htm.
8 FEDERAL RESERVE BANK OF MINNEAPOLIS | THE MINNEAPOLIS PLAN
2.1.2 Systemic Risk Charge. The key features of the proposal are:
• Five years after the enactment of our proposal, and every year thereafter, the Treasury Secretary must certify that covered banks
are not systemically important. The Treasury will also have the discretion to review the systemic risk posed by any bank.
• Firms that receive that certification continue to face the minimum capital requirement spelled out in Step 1 of our plan.
• Firms that do not receive this certification face an SRC, which will increase by five percentage points each year until either the
Treasury Secretary makes the certification or the capital level reaches 38 percent.
• 38 percent equity represents the level of capital that is needed to drive the chance of a bailout to less than 10 percent.
• We encourage the Treasury Secretary to start its analysis of banks’ systemic risk with the same metrics regulators use today for
measuring that risk.
• We believe many firms currently considered systemically important will restructure themselves to greatly reduce their systemic
risk and chance of bailout rather than issue capital up to the maximum SRC.
• Firms that do issue capital equal to the maximum SRC will have a much lower chance of bailout, as well, given their exception-
ally high ability to absorb losses.
2.1.3 Shadow Banking Tax. The key features of the proposal are:
• A two-tier shadow bank tax rate system mirrors our two-tier capital proposal.
• The tax applies to borrowings of shadow banks.
• A lower tax rate equal to 1.2 percent of borrowings applies to non-systemically important shadow banks with assets that exceed
$50 billion.
• A higher tax rate equal to 2.2 percent of borrowings applies to systemically important shadow banks with assets that exceed $50 billion.
• The Treasury Secretary will certify if shadow banks are not systemically important and will have the discretion to review all
nonbank financial firms when certifying that a given firm is not systemically important.
• We describe the methodology by which we set the tax in Sections 3 and 4. The general idea is that the government should want
the overall cost of funds within the shadow system to be the same as in the traditional banking system. We calculate the shadow
leverage tax rate so that the lower tax rate equalizes the funding costs of banks and shadow banks at the 23.5 percent capital re-
quirement. The higher tax rate makes funding costs equal at the SRC of 38 percent. This outcome will discourage the movement
of leveraged activity from the banking sector to the shadow sector. Moreover, this tax effectively removes the tax preference for
debt issuance for shadow banks.
• The tax will apply to firms specified in our proposal as nonbanks or shadow banks. We rely on the work of the Financial Stability
Board (FSB) to identify types of firms that are considered shadow banks. We include hedge funds, mutual funds, and finance
companies as shadow banks under this approach. The Treasury Secretary will have the discretion, however, to look beyond this
list of shadow banks in certifying that a given shadow bank is not systemically important.
• The tax will go into effect five years after enactment of the Minneapolis Plan.
• We make very conservative assumptions in making this calculation. At the same time, we recognize that the analytical frame-
work to support the shadow bank tax is nascent. As such, we particularly welcome feedback on this aspect of our proposal.
9 FEDERAL RESERVE BANK OF MINNEAPOLIS | THE MINNEAPOLIS PLAN
2.1.4 Right-Sized Community Bank Supervision and Regulation. The key features of the proposal are:
• Community banks, defined as any bank with less than $10 billion in assets, will face a separate and distinct solvency supervision
and regulation regime after our proposal becomes law.
• The new solvency regime will focus on bank activity that actually contributes to the risk that a bank could fail, such as fast asset
growth or concentrations in risky assets, and eliminate aspects of supervision that provide low benefits but impose high costs.
• The regime will also have a more simplified set of capital requirements and other regulations.
• Solvency and related aspects of Dodd-Frank that apply to community banks but do not have any clear link to the solvency risk
of these firms will be repealed.
2.2 Why TBTF Remains a Critical ThreatIn this section, we first define what we mean by TBTF, explain why TBTF is so important, and discuss why current reforms efforts
do not end TBTF.
2.2.1 Defining the problem. Banks are TBTF when their failure or potential insolvency threatens to spill over to other banks and
financial markets and ultimately to the rest of the economy. Such spillovers can greatly reduce economic output and throw the
economy into a recession or even depression. These spillovers are inherently problematic, even when they do not result in a bailout
of banks. But bailouts are part of the response to significant potential and realized bank spillovers, even though the creditors of
large banks should bear the losses of bank failure, not the public. Governments view bailouts as the only realistic option they have
to address the threat of spillovers that arises when the largest banks get into financial trouble.
This definition of the TBTF problem leaves two general solutions to it. Policymakers must either make it less likely that a bank
gets into trouble or limit spillovers when a bank does get into trouble. Government could make banks less likely to fail by requiring
that they have more financial resources to absorb losses, for example. Another option for governments to reduce spillovers is to
force banks to organize themselves in such a way that their failure is unlikely to spread to other firms. Some have argued that there
is a third option: Announce that the government will not bail out banks. We do not think that a mandate prohibiting the government
from responding to large bank failures is credible. Such a restriction on a government response will not work because the underly-
ing problem of spillovers remains, and the government will ultimately have to act or spillovers will cause damage to Main Street.
2.2.2 Importance of TBTF. The potential importance of TBTF is straightforward. As Minneapolis Fed President Neel Kashkari argued,
The externalities of large bank failures can be massive. I am not talking about just the fiscal costs of bailouts.
Even with the 2008 bailouts, the costs to society from the financial crisis in terms of lost jobs, lost income and
lost wealth were staggering—many trillions of dollars and devastation for millions of families. Failures of large
financial institutions pose massively asymmetric risks to society that policymakers must consider. We had a
choice in 2008: Spend taxpayer money to stabilize large banks, or don’t, and potentially trigger many trillions of
additional costs to society.
The view Kashkari expressed seems widely held and explains the global effort to address TBTF in a truly massive way, even if
those responses to the crisis impose some costs to the economy.
2.2.3 TBTF remains a serious danger. Some banks are currently TBTF. There is general, but not universal, agreement on this point
simply because current reform efforts that some believe will end TBTF have not yet been fully implemented. Consider the new
resolution regime, which is a cornerstone of the current effort to end TBTF. One option under current law is for banks to go through
the commercial bankruptcy regime. However, both the Federal Deposit Insurance Corporation (FDIC) and the Federal Reserve
System deemed the living wills of five of the most systemically important banks “not credible.” Two additional banks had plans
that were deemed “not credible” by either the FDIC or the Federal Reserve, but not both. This outcome is positive in the sense that
10 FEDERAL RESERVE BANK OF MINNEAPOLIS | THE MINNEAPOLIS PLAN
the regulatory agencies are taking steps to make these firms easier to resolve. But at the same time, this outcome effectively means
that these banks cannot go through commercial bankruptcy right now. In addition, key aspects of alternative resolution to commer-
cial bankruptcy have not been implemented. For example, the TLAC plan to have banks issue debt to convert to equity is central
to implementing the proposed alternative resolution approach to commercial bankruptcy. But that plan is not final. So banks must
therefore still be TBTF, a view consistent with expert presentations we heard during the past year.7
The key question is, Will banks remain TBTF once the current reforms go fully into effect? Supporters of the key effort say no.
We disagree for two reasons.
First, at least some of the reforms put into place seem aimed at preventing a reoccurrence of the last crisis. For example, some
reforms focus on aspects of the current derivative, proprietary trading, or securitization markets because of the role they played
during the run-up to the crisis. But a lesson from the 2008 crisis is that policymakers will not see the next cause of a banking panic
coming, and the exact form the crisis will take will not be the same as the last crisis.8
Second, the current reform effort to end TBTF relies on the TLAC proposal requiring the government to impose losses on debt
holders of the most systemically important banks in a stressed economic or financial environment. We believe this proposal is fun-
damentally unsound and will not work in practice for three reasons:9
1. The proposal is not compatible with the incentives of policymakers. As Kashkari argued, “Do we really believe that in the
middle of economic distress when the public is looking for safety that the government will start imposing losses on debt hold-
ers, potentially increasing fear and panic among investors? Policymakers didn’t do that in 2008. There is no evidence that their
response in a future crisis will be any different.” Some may respond that debt holders under current plans will receive warning
that they are at risk of loss. This warning, they argue, will make policymakers more comfortable in following through. But the
government has issued such warnings in the past, with regard to so-called subordinated debt holders, and did not follow through
in a crisis. Unfortunately, these warnings are not credible.
2. This approach is more complex relative to our preferred option of requiring covered banks to issue more equity; equity holders
have a long experience of suffering losses from bank failures in the United States. The government should just require banks to
issue more equity if the government wants a straightforward way of imposing losses on the funders of banks. Requiring the debt
holders to effectively recapitalize a failing bank during a crisis just increases the risk of contagion and systemic risk.
3. Finally, and our third and fourth reasons for not supporting the current direction, we do not find key specific arguments for
requiring debt to absorb losses over equity to be well reasoned.
Some supporters of the current debt-focused plans argue that having a smaller equity cushion will prompt supervisors to act
more quickly as the equity is erased by losses. At that point, the supervisors can move the firm into resolution where the debt
converts and becomes the equity of the recapitalized new firm, thus avoiding taxpayer bailouts. Supporters of this view believe
that a bank funded with more equity will see losses exceed the equity and thus have nothing left over for the recapitalization
of the firm by the government. This argument does not make sense to us. The concern that supervisors cannot act when a firm
still has positive equity should naturally lead policymakers to support rules allowing early closure. That is, requiring banks to
7 For an alternative view, see FDIC Chairman Martin Gruenberg’s statement from April 2016: “In my view, we are at a point today that if a systemically important financial institution in the United States were to experience severe distress, it would be resolved in an orderly way under either bankruptcy or the public Orderly Liquidation Authority.” See Lisa Lambert’s, “‘Too big to fail’ banks could be wound down safely,” Reuters, April 21, 2016, at http://www.reuters.com/article/us-usa-banks-fdic-idUSKCN0XI2KI.8 See Kashkari’s speech at the Brookings Institution for more on this view: https://www.minneapolisfed.org/news-and-events/presidents-speeches/lessons-from-the-crisis-ending-too-big-to-fail. 9 See Kashkari’s April 2016 speech before the Minnesota Chamber of Commerce discussing his lack of confidence that the contingent convertible debt included in the TLAC plan will actually face losses in a crisis: https://www.minneapolisfed.org/news-and-events/presidents-speeches/update-on-minneapolis-fed-ending-too-big-to-fail-initiative. For additional discussion on the challenge in converting debt to equity in the TLAC context, see Mark Flannery’s presentation on the topic at the Sept. 26, 2016, Too Big to Fail symposium sponsored by the Federal Reserve Bank of Minneapolis: https://www.minneapolisfed.org/~/media/files/publications/studies/endingtbtf/september-26-symposium-presentations/flannery_a-place-for-tlac.pdf?la=en.
11 FEDERAL RESERVE BANK OF MINNEAPOLIS | THE MINNEAPOLIS PLAN
issue more equity and mandating that government close banks when equity is still positive.10 This is not a novel idea. Indeed,
the closure regime before the crisis—called Prompt Corrective Action—required this step. However, it failed because triggers
for closure were based on measures of equity that overstated the solvency of weak banks.
The other key rationale for the equity and debt split focuses on the cost of debt versus equity. Requiring banks to issue only
equity raises concerns about the cost of regulation because equity costs more than debt. Allowing firms to issue debt, some
argue, is cheaper. But this alleged benefit of the debt-focused plans may not come to fruition. The debt securities will end up
being priced like equity if the bond holders are actually going to face losses. At that point, the government would have given up
the benefits of equity, while society would not have actually received the benefit of cheaper debt.
In sum, we believe equity is the best guard against a banking crisis and the related bailout of unsecured bank creditors. Some
losses in the future could exceed the high levels of equity our plan requires. If losses exceed the high levels of equity for a single
bank in trouble when the banking system and overall economy are strong, we believe something like the current resolution regime
could work if our proposal is put into place. But we do not think the current regime and any focus on immediate private recapital-
ization are credible responses to losses exceeding our high proposed levels of equity during periods of market stress. At that point,
we see public recapitalization, at least at the point of crisis, as the most credible response.
2.3 The Similarities Between the Minneapolis Plan and Other Transformative OptionsWe began the ending TBTF initiative with a commitment to review a wide range of transformative reforms. We specifically noted
three reforms at the outset: requiring more capital, breaking up the biggest banks, and taxing leverage. During the initiative, we
heard extensively about these three options. We also heard in detail from supporters of the current regime, including those who
would prefer to focus on what are incremental changes in the resolution framework currently under way. We have already explained
our reasons for rejecting a stay-the-course approach. In this section, we describe the similarities between our plan and those that
break up banks. In short, we believe our plan achieves the same objectives of break-up-the-banks proposals, but through a slightly
different route.
2.3.1 Breakup plans. We heard from supporters of two types of breakup plans. First, we reviewed plans that would put a cap on the
size of banks, perhaps as a share of GDP.11 Second, we discussed plans that would limit the types of activities that banks can engage
in, which would reduce their size for at least some period of time. Efforts in this dimension include “reinstating Glass-Steagall,” as
its proponents often put the issue.
2.3.2 Similarities to breakup plans. The key similarity between our plan and breakup plans is that both target the reduction of sys-
temic risk through restructuring of TBTF banks. Step 2 of our proposal would apply the SRC to covered banks that the Treasury
Secretary fails to certify as no longer posing material systemic risk. The Treasury could use current state-of-the-art measures of
systemic risk in this determination, which focus on factors like banks’ size, complexity, and interlinkages. We believe most banks
will take the steps necessary to reduce their systemic risk along these dimensions to avoid the SRC. Less systemic risk means less
chance of spillovers, which reduces the need for a bailout. The logic and goal just described are the same between breakup plans
and the Minneapolis plan.
Our tax on shadow banks has a similar feature. We have one tax rate for large shadow banks that are not systemically important
10 We do not include a requirement in our proposal to close covered banks when they still have a material positive capital level, but we are open to such proposals.11 One prominent breakup plan comes from Simon Johnson of MIT. Johnson’s plan focuses on reorganizing financial institutions into smaller entities so that any potential firm failure would be mitigated by its smaller footprint. Specifically, Johnson proposes capping the largest banks at 2 percent of GDP. Under the most recent available size data, the size cap would apply to any bank larger than $350 billion in assets. And if bank boards of directors and senior management did not comply with the size limitation, the bank would be subject to “significantly higher capital requirements.” See Simon Johnson’s, “A Size Cap for the Largest U.S. Banks,” April 4, 2016, at http://ritholtz.com/2016/04/size-cap-for-largest-banks/.
12 FEDERAL RESERVE BANK OF MINNEAPOLIS | THE MINNEAPOLIS PLAN
as judged by the Treasury Secretary. We propose another tax rate for shadow banks that remain systemically important. This regime
encourages shadow banks to make themselves less systemically important.
Superficially, the other similarity between our plan and many breakup plans is that both do not try to specify exactly how the
breakup or systemic risk reduction must occur. However, in our plan, banks would have to take account of their sources of systemic
risk and spillovers and the benefits and costs of their current organization when deciding if and how they will respond to the SRC.
Our plan tries to force banks to break themselves up such that the resulting entities created are not systemically important. This
feature of our plan could differ from other plans that do not limit the systemic risk posed by post-breakup entities.
The similarities between our proposal and other breakup plans may concern some observers. In particular, critics view breakup
plans as potentially ineffective and costly. The plans could be ineffective if they yield a group of smaller banks that would all fail
in the face of a common shock, reflecting the potential for many banks to “herd” around the same risk (e.g., commercial real estate
or exposure to developing countries). The breakup plans could be too costly if there are very large economies of scale to aspects of
banking, which are lost when covered banks break up.
We view these potential costs as real, but probably overstated in the context of our proposal. First, we try to account for the
potential for a common shock to large banks by ensuring that the minimum equity requirement is much higher than it is today. This
would make it much less likely that the idiosyncratic failure of one of the covered banks would spill over into another, because all
of the banks would have very high levels of capital. Moreover, we do not expect all banks that result from a breakup to be mirror
images of each other. Just as large banks today follow different business strategies, we expect banks of the future to do the same
and thus not have exactly the same exposure to risk factors. This combination of future outcomes suggests that the failure of a few
large but not systemically important banks at the same time should have a much lower systemic outcome under our plan than it
would today.
Second, and in terms of economies of scale, we agree that the breakup of certain firms could result in smaller firms that benefit
less from such economies.12 But measurement of these economies of scale is inherently difficult in a statistical sense given the
limited number of mega banks, the fact that they have been in existence for such a short period of time, and the challenge of defin-
ing what banks “produce” in the first place.13 Thus, it is not clear if the costs from potential loss of economies of scale are large
relative to the benefits from reducing the chance of a crisis. Moreover, the Minneapolis Plan would allow firms to maintain their
economies of scale if they funded themselves with a much higher level of equity. If the benefits of scale are very large, then society
would continue to gain from them. Finally, we note that the frameworks used by supervisors to measure the benefits and costs of
higher capital and other regulations after the 2008 crisis do not view potential reductions in economies of scale as a reason to avoid
regulation that could lead firms to change their organizational structure.
There is one key difference between our plan and some breakup plans. Those calling to reinstate Glass-Steagall do specify a
certain form of breakup, precisely the separation of commercial and investment banking. We understand the concerns that motivate
this type of reform. And the costs of such a reform may not be large. But we do not see this type of activity restriction as addressing
the spillover problem that defines TBTF. The record suggests that commercial banks without material investment banking activity
and investment banks with relatively little commercial bank activity can have high probabilities of failure and can also generate the
type of spillovers that prompt bailouts.
2.4 Implications of the Minneapolis Plan for Supervision and Regulation PolicyThis section reviews two implications of our proposal. First, what does this proposal mean for the supervision of banks that are not
TBTF? Second, what does our proposal mean for the various reform efforts already under way?
12 For a discussion of economies of scale in banking, see the presentation given by Joseph Hughes on the topic at the April 4, 2016, Too Big to Fail symposium spon-sored by the Federal Reserve Bank of Minneapolis: https://www.minneapolisfed.org/~/media/files/publications/studies/endingtbtf/april-4-symposium-presentations/hughes-does-scale-win-in-banking-minneapolis-fed-tbtf-conference.pdf?la=en.13 For a discussion of these issues, see Ron Feldman and Robert DeYoung in “Scale Economies in Banking” in the Federal Reserve Bank of Minneapolis The Region, September 2010 at https://www.minneapolisfed.org/publications/the-region/size-and-regulatory-reform-in-finance-important-but-difficult-questions.
13 FEDERAL RESERVE BANK OF MINNEAPOLIS | THE MINNEAPOLIS PLAN
2.4.1 Implications for community bank supervision. As noted, reforming the current supervision and regulation of community
banks to a system that is simpler and less burdensome but still robust is a key step in our proposal. In short, an effective plan must
try to reduce the fixed costs of regulation for community banks while maintaining rigor in responding to excessive risk-taking
where it presents itself. A reformed regime for community banks must recognize that the failure of a community bank is unwelcome
for its local community but does not present spillovers that pose a systemic risk for the U.S. economy.
The first key step for reforming the solvency supervision and regulation of community banks is for Congress to enact the reform
plan we recommend for covered banks. We think reforms for community banks will not occur when the threat from the banking
system to the economy remains large.
The second step is for Congress to create a separate solvency supervisory and regulatory regime for all banks with less than
$10 billion in assets. Three key features of the reformed solvency supervision and regulation for community banks we propose are:
1. Simple but appropriate capital standards for these banks. The high level of capital that we propose in the Minneapolis Plan
should not apply to community banks. Instead, community banks should face a lower capital requirement, and the method by
which banks must determine their capital levels and comply with this new standard should be as simple as possible.
2. A less-costly and less-complex system of supervision focused on fundamental sources of risk. Community banks face a huge
array of complicated and potentially unnecessary solvency supervisory expectations. These expectations cover almost every
aspect of bank operations, ranging from how banks interact with vendors to how they calculate their interest rate risk to how they
plan for many contingency events. There is also a burdensome process that banks face when they acquire other banks or change
their ownership structure. It is not clear how many of these expectations actually reduce the chance of bank failure. Rather,
these expectations and rules may just add additional expenses that fall disproportionally on small banks. A reformed system of
solvency supervision for community banks is possible once TBTF is addressed. This system should be much less complicated
and focus only on the key expectations that reduce the chance of failure. For example, this system should concentrate on the
amount of capital the bank issues, the rate at which the bank is growing, the concentration and quality of its assets, and the
stability of its funding. A much more focused supervisory solvency system could potentially produce the same benefits as the
current system but at much lower cost. This would then allow community banks to focus on extending safe and sound credit to
its local economy.
3. Finally, the reformed system should repeal solvency and other noncompliance-related provisions of the Dodd-Frank Act that
apply to community banks and that do not have a strong link to their chance of failure. For example, the Volcker rule should not
apply to community banks.
2.4.2 Implications for Current Reform Efforts, Including Resolution. As noted, the government already has under way a massive
program to address the TBTF problem, most notably through the Dodd-Frank Wall Street Reform and Consumer Protection Act,
but also through other efforts. Our proposal almost always builds on the current reform effort, which we think could make banks
more resilient to a shock that hits a single firm during good times. We only seek to modify the minimum capital requirements and
long-term debt/TLAC proposal for covered banks. We also create the SRC and the key requirement that the Treasury Secretary
certifies when banks are no longer are systemically important. The current capital and other regimes currently applied to banks that
are in between our definitions of covered banks and community banks will not change.
Of course, there will be technical interactions between our proposal and aspects of the current reform effort, but these can be
addressed at a future date.
A more fundamental interaction, however, concerns our proposal and the resolution regime currently under development. That
14 FEDERAL RESERVE BANK OF MINNEAPOLIS | THE MINNEAPOLIS PLAN
regime consists of two components. The first part of the regime concerns the so-called living will process.14 The second part con-
cerns the special resolution regime that could apply to systemically important banks when, generally speaking, the commercial
bankruptcy regime would not prove effective.15
We do not believe that either of these efforts will solve TBTF by themselves. But we see them as useful steps forward that could
complement our proposal. The living will regime could make the firms to which we apply our capital proposal, as well as other
firms, easier to resolve. Additionally, the new resolution regime could make it easier to address any remaining spillover concerns
once the Minneapolis Plan has been fully implemented.16
Will the combination of the new resolution regime, the Minneapolis Plan, and the other aspects of the current reforms mean that
bailouts will never occur? The answer is no. Some risks are impossible to eliminate completely, and assessing costs and benefits is
essential to finding the right balance. We believe the Minneapolis Plan reduces the chance of future bailouts as much as possible
while passing a cost and benefit test.
As noted above, we do believe that a banking crisis large enough to sweep over the capital wall we propose would justify the
government response of providing taxpayer support. We also believe that any reform proposal claiming to solve all future banking
crises, regardless of size, is not credible. Some crises are so costly that the only appropriate or available response will be a govern-
ment backstop rather than a resolution regime. Lastly, we do believe that government support in the future could differ from what
previously occurred during the 2008 financial crisis. These support options are not a focus of our current effort.
14 For more information on the living will process, see the Federal Reserve Board of Governors Resolution Plans website: https://www.federalreserve.gov/bankinforeg/resolution-plans.htm.15 For more details on this special resolution regime, see the FDIC’s press release announcing the Resolution Strategy here: https://www.fdic.gov/news/news/press/2013/pr13112.html; or for a more detailed description of the Single Point of Entry Strategy, see the Federal Register here: https://www.fdic.gov/news/board/2013/2013-12-10_notice_dis-b_fr.pdf. 16 Some experts have called for a new chapter of the bankruptcy code (chapter 14) to allow the code to facilitate the resolution of systemically important financial firms. For a discussion of efforts to reform current resolution mechanisms, see the work of the Bipartisan Policy Center’s Failure Resolution Task Force at http://cdn.bipartisanpolicy.org/wp-content/uploads/sites/default/files/TooBigToFail.pdf.
15 FEDERAL RESERVE BANK OF MINNEAPOLIS | THE MINNEAPOLIS PLAN
This section discusses the general empirical approach we used to support our capital and leverage tax recommendations. For
each of the recommendations, we summarize the relevant literature, describe our general methodology, identify key choices,
provide key results and, where appropriate, discuss alternative approaches and/or sensitivity analyses. Section 4 walks through
these calculations in detail.
3.1 Empirical Approach for the Minimum Capital Recommendations This section reviews our approach for determining the higher minimum capital requirement we are recommending. We also review
our approach for setting the SRC, which is an extension of the minimum capital charge approach. Our approach has one underly-
ing tenet: Rely on existing analytical frameworks used by regulators or related groups to analyze the benefits and costs of higher
capital requirements. At a very general level, this established approach calculates the benefits of higher capital as arising from fewer
banking crises. The cost of higher capital comes from increased costs of lending, which flow into the economy and reduce GDP.
3.1.1 Relevant Literature. We rely on the framework used by the Bank for International Settlements (BIS)—particularly work spon-
sored by the Financial Stability Board (FSB) and the Basel Committee on Banking Supervision—and the International Monetary Fund
(IMF) in analyzing the benefits and costs of higher minimum capital requirements as we developed the Minneapolis Plan.17 These anal-
yses rely on or reference in turn the broader literature on capital requirements and the benefits and costs of alternative requirements.
To calculate the benefits of preventing a crisis, we follow the method used by IMF staff, specifically the work of Dagher,
Dell’Ariccia, Laeven, Ratnovski, and Tong (DDLRT) published in March 2016.18 DDLRT approached the question of appropriate
levels of bank capital by analyzing a dataset of past crises from 1970 to 2011—the IMF’s Systemic Banking Crisis Database (IMF
database) compiled by Laeven and Valencia.19 DDLRT compile average peak nonperforming loan (NPL) ratios for each crisis
identified. By transforming the NPL ratios into equivalent risk-weighted capital ratios, they infer levels of capital that might have
prevented the need for the government intervention associated with these bank crises. The estimated capital levels are meant to
indicate amounts sufficient to cover industry losses and maintain solvency for the representative banking systems.
The DDLRT analysis focuses on total capital held by a banking system in its determination of capital levels needed to avoid a
crisis and bailout. We use these data to determine the capital level that covered banks should hold. This is a reasonable translation
for two reasons. First, covered banks hold nearly 70 percent of the total U.S. banking system assets. Second, some covered banks
could cause a crisis with their individual failure. We want these particularly systemically important banks to hold what amounts to
the level of capital needed to prevent a crisis.
In contrast, we follow the BIS approach of assessing the cost of higher capital requirements quite closely. This analysis exam-
ined the cost of higher capital requirements through a two-step process. First, it estimated the impact of higher capital requirements
SECTION 3
General Empirical Approach for the Capital and Leverage Tax Recommendations
17 In terms of the BIS analysis, we rely on: Bank for International Settlements, “Interim Report: Assessing the macroeconomic impact of the transition to stronger capi-tal and liquidity requirements,” August 2010; Bank for International Settlements, “An assessment of the long-term economic impact of stronger capital and liquidity requirements,” August 2010; Bank for International Settlements, “Final Report: Assessing the macroeconomic impact of the transition to stronger capital and liquidity requirements,” December 2010; Bank for International Settlements, “Assessing the economic costs and benefits of TLAC implementation,” November 2015. 18 See Dagher, Dell’Ariccia, Laeven, Ratnovskis, and Tong (2016).19 See Laeven and Valencia (2012).
16 FEDERAL RESERVE BANK OF MINNEAPOLIS | THE MINNEAPOLIS PLAN
on lending spreads. Second, it utilized central bank forecasting models to measure the impact of wider spreads on economic activ-
ity. We adhere to the same process and describe it more fully below. This framework is consistent with the literature that finds a
negative relationship between capital and lending.20
3.1.2 Describing the Benefits of Higher Capital Analysis and Results. In this section, we describe the general methodology we use,
the key assumptions we make, and our key results. We then report results from sensitivity analysis we performed.
Methodology. The benefit of higher capital is the avoidance of a banking crisis and the related bailout of banks. The logic is
straightforward. Banks with higher capital have a lower chance of failure, all else equal. The smaller the chance of bank failure, the
less likely a banking crisis occurs. As noted, there is a one-to-one relation between banking failures and crises and public support
for banks in the data we use. The lower the chance of failure and crisis, the lower the chance of bailout.
We implement this intuition by following DDLRT and reviewing the historical experience with banking crises. We use the IMF
database to identify the number of crises that could have been avoided if the minimum capital requirement applied to banks in a country
with a crisis was greater than or equal to the losses associated with those crises. The IMF database is set up for this exercise. It consists of
banking crises that occurred between 1970 and 2011 and the nonperforming loan ratios for each of these crises. The data set has 105 crises
with associated nonperforming loan rates.21 Twenty-eight of the crises for which we have nonperforming loan data occurred in OECD
countries.22 The rest occurred in developing countries. Section 4 provides the technical details of implementing this general approach.
Key Choices. We highlight several choices we make while using this methodology:First, we rely on the historical record of banking crises. This raises two potential concerns:
1. Banking crises are tail events. Thus, we have few observations. This means we are considering what might occur in the future
based on very limited history. As a result, our analysis faces a fundamental and unavoidable level of uncertainty. This challenge
is endemic in all analytical efforts to prevent future crises, such as the supervisory stress test. We are trying to prevent events
that simply do not occur very often; thus, we have limited experience with them. The BIS made this point in its analysis: “The
benefits of prudential regulation are inherently uncertain and difficult to assess. Moreover, while in the case of regulatory capital
requirements we can rely on historical evidence, we have only limited historical evidence that we can draw on to quantify the
precise impact of TLAC and orderly resolution.”23
2. We are assuming the historical record regarding banking crises helps inform the future likelihood of crises. This assumption may
not hold as well if the world has changed in some important ways relative to the past. Such changes could mean that the chance
of having a crisis in the past no longer helps estimate the chance of having a crisis in the future. In particular, there have been a
number of regulatory changes aimed at reducing the chance of a future crisis since the 2008 crisis. These changes may make it
less likely that a banking crisis will occur in the future.
Relying on historical data in this new world could overstate the chance of a future crisis. However, there are three reasons to dis-
count this concern with regard to our analysis. First, the historical data should understate future losses as well. Importantly, losses
in the past reflect government bailouts to end crises. Losses in the past would have been higher if government had not stepped in.
Some financial reforms since the financial crisis might also increase reported losses by, for example, forcing banks and supervisors
to recognize losses earlier. Board of Governors analysis suggests that the overstatement of future losses and the understatement
that arises from using historical crisis data may offset each other. The Board of Governors noted: “There are reasons to believe that
20 See Peek and Rosengren (1997, 2000).21 The IMF database consists of 147 banking crisis observations. Of those, 105 have associated nonperforming loan data. There are 29 OECD events reported in the database. All but one event has an NPL estimate.22 See http://www.oecd.org/about/membersandpartners/ for a list of current OECD countries. 23 See Bank for International Settlements, “Assessing the economic costs and benefits of TLAC implementation,” November 2015, 29.
17 FEDERAL RESERVE BANK OF MINNEAPOLIS | THE MINNEAPOLIS PLAN
the historical data underestimates the future trend and there are reasons to believe that those data overestimate the future trend.
Although the extent of the over- and underestimation cannot be rigorously quantified, a reasonable assumption is that they roughly
cancel each other out.”24 Second, and as implied in our first point, this concern would apply to the reforms to which we are compar-
ing our proposal, which also relied on the historical record. Third and finally, as already discussed, we are skeptical about the ability
of some of the key reforms enacted to reduce the chance of a bailout.
Second, and to help address the problem of limited data, we rely on cross country data on financial crises to estimate the chance
of a bailout under a given level of capital in the banking system in the United States. Of course, the United States has important dif-
ferences in its economy and financial system relative to other countries. However, cross country crisis data are the best information
that analysts have for making such estimates, and we follow general practices in using them.
Third, we have to decide whether to use data on all crises, including those in developing countries, or a subset of that data. We
use only the crisis data for OECD countries. We acknowledge that there are relatively few banking crises in the IMF database, and
looking at a subset of crises makes our already limited data sparser. Nevertheless, we think it reasonable to conclude that future
banking crises in the United States will be more like those that have occurred in OECD countries than in developing countries.
Fourth, higher capital requirements could make bank failure less likely in more than one way. Besides improving the ability of
firms to absorb losses in the face of unexpected shocks, they could change the behavior of banks such that they take on less risk and
thus face lower losses in the future. In our analysis, we do not account for the potential that higher capital could reduce risk-taking.
Instead, we account only for the loss-absorbing capacity of capital that makes failure less likely in the face of any given shock. We
take this view because (a) the effect of higher capital on risk-taking of banks is not clear and (b) assuming that capital can only
absorb losses rather than change behavior makes our estimates of benefits more conservative.25
Finally, and on a more technical level, we utilize the DDLRT cross-country NPL ratio information as a basis for understanding
the size of loss for a given crisis. Like DDLRT, we ignore potential accounting differences and prudential requirements related to
NPL ratios that could exist across countries.
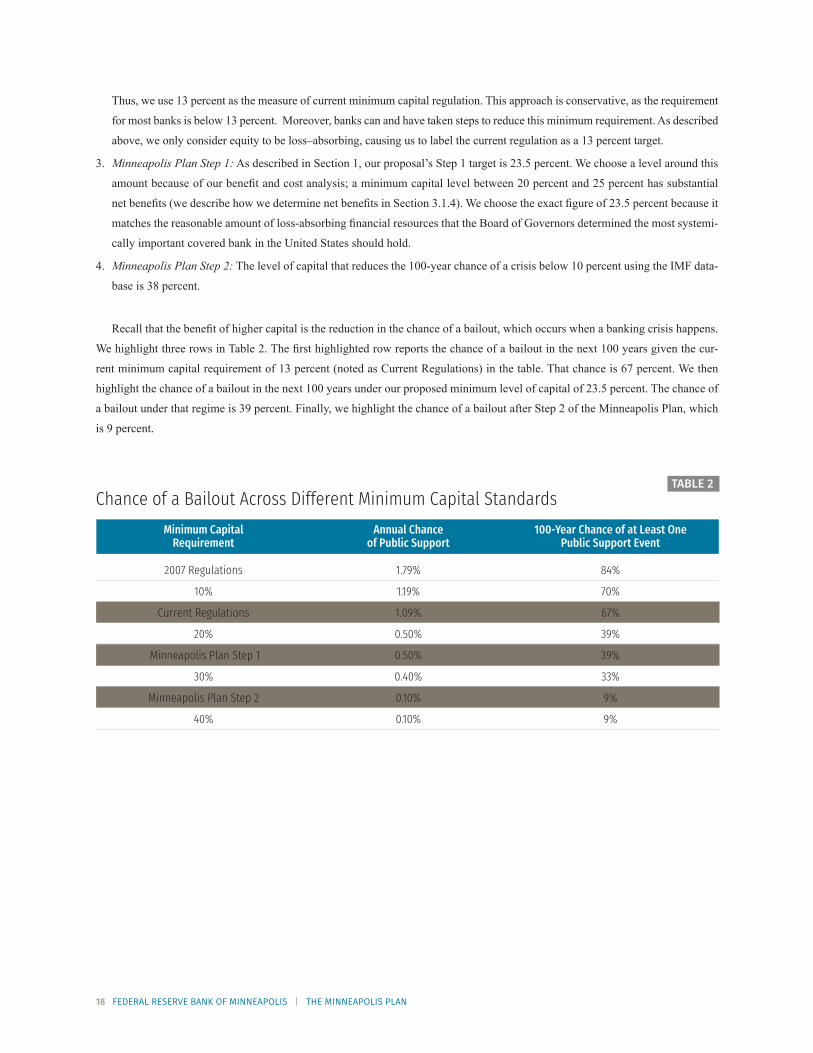
Key Results. Table 2 reports the key results of the benefits of higher capital using the methodology just described. In Table 2 and
subsequent tables, we refer to probabilities of a bailout and costs of regulation associated with several minimum capital require-
ments over time. Before describing our results, we explain the source of the minimum capital requirement figures:
1. 2007 Regulations: We want to compare the effect of our proposal relative to prior capital regimes, including the precrisis
capital regime. However, the pre- and post-crisis regimes have important differences in what they count as capital and the risk
weighting of assets. We use a 4 percent capital level to capture the precrisis regime. This is the precrisis Tier 1 risk-weighted
capital requirement. On the one hand, this number overstates the amount of capital required relative to today’s regime because
it counts as capital items that do not receive that treatment today. Moreover, the risk-weightings from the precrisis period are
more favorable to banks than today’s. On the other hand, choosing the 4 percent level understates the minimum requirement
because aspects of the precrisis system were akin to the capital buffers that we count in our current regulatory minimum figure
noted below. We do not count those buffers—arising from the well-capitalized level of capital in the precrisis Prompt Corrective
Action regime—in our determination of the precrisis minimum. In sum, this suggests that 4 percent is a reasonable selection,
recognizing that there are inherent challenges in comparing pre- and post-crisis capital minimums.26
2. Current Regulations: As of October 30, 2015, the TLAC proposal identified the maximum level of loss-absorbing capacity for the
eight GSIBs to be 23.5 percent, which includes long-term debt of approximately 10.5 percent and common equity of 13 percent.
24 See Board of Governors of the Federal Reserve System, Calibrating the GSIB Surcharge, July 2015, 8.25 Calem and Rob (1999) find that higher capital requirements can lead banks to take on more risk.26 As described in more detail in Section 4, we must use regulatory data on covered banks to complete the calculations. For example, we use data on capital levels and other bank holding company characteristics. We select those data as of year-end 2015. We use year-end data because they make our calculations more tractable with fewer assumptions and data manipulations.
18 FEDERAL RESERVE BANK OF MINNEAPOLIS | THE MINNEAPOLIS PLAN
Thus, we use 13 percent as the measure of current minimum capital regulation. This approach is conservative, as the requirement
for most banks is below 13 percent. Moreover, banks can and have taken steps to reduce this minimum requirement. As described
above, we only consider equity to be loss–absorbing, causing us to label the current regulation as a 13 percent target.
3. Minneapolis Plan Step 1: As described in Section 1, our proposal’s Step 1 target is 23.5 percent. We choose a level around this
amount because of our benefit and cost analysis; a minimum capital level between 20 percent and 25 percent has substantial
net benefits (we describe how we determine net benefits in Section 3.1.4). We choose the exact figure of 23.5 percent because it
matches the reasonable amount of loss-absorbing financial resources that the Board of Governors determined the most systemi-
cally important covered bank in the United States should hold.
4. Minneapolis Plan Step 2: The level of capital that reduces the 100-year chance of a crisis below 10 percent using the IMF data-
base is 38 percent.
Recall that the benefit of higher capital is the reduction in the chance of a bailout, which occurs when a banking crisis happens.
We highlight three rows in Table 2. The first highlighted row reports the chance of a bailout in the next 100 years given the cur-
rent minimum capital requirement of 13 percent (noted as Current Regulations) in the table. That chance is 67 percent. We then
highlight the chance of a bailout in the next 100 years under our proposed minimum level of capital of 23.5 percent. The chance of
a bailout under that regime is 39 percent. Finally, we highlight the chance of a bailout after Step 2 of the Minneapolis Plan, which
is 9 percent.
TABLE 2Chance of a Bailout Across Different Minimum Capital Standards Minimum Capital Annual Chance 100-Year Chance of at Least One Requirement of Public Support Public Support Event
2007 Regulations 1.79% 84%
10% 1.19% 70%
Current Regulations 1.09% 67%
20% 0.50% 39%
Minneapolis Plan Step 1 0.50% 39%
30% 0.40% 33%
Minneapolis Plan Step 2 0.10% 9%
40% 0.10% 9%
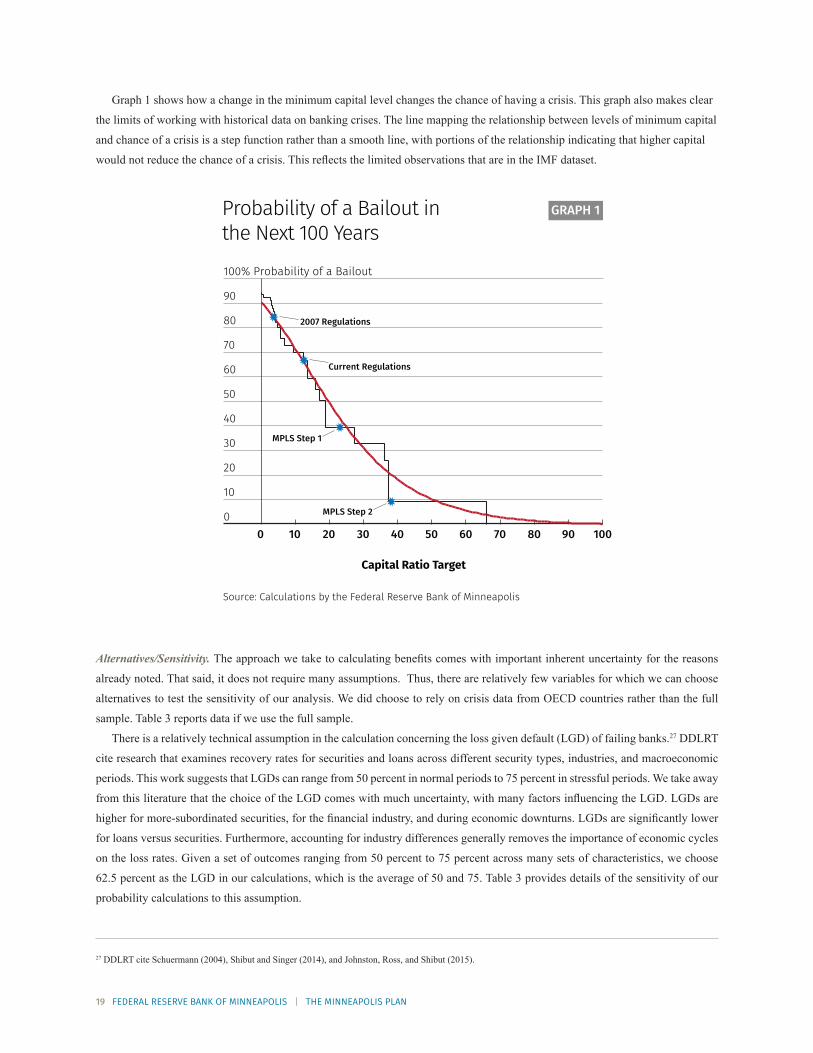
19 FEDERAL RESERVE BANK OF MINNEAPOLIS | THE MINNEAPOLIS PLAN
Graph 1 shows how a change in the minimum capital level changes the chance of having a crisis. This graph also makes clear
the limits of working with historical data on banking crises. The line mapping the relationship between levels of minimum capital
and chance of a crisis is a step function rather than a smooth line, with portions of the relationship indicating that higher capital
would not reduce the chance of a crisis. This reflects the limited observations that are in the IMF dataset.
Capital Ratio Target
Probability of a Bailout in the Next 100 Years
Source: Calculations by the Federal Reserve Bank of Minneapolis
GRAPH 1
0
10
20
30
40
50
60
70
80
90
100% Probability of a Bailout
0 10 20 30 40 50 60 70 80 90 100
MPLS Step 1
MPLS Step 2
2007 Regulations
Current Regulations
Alternatives/Sensitivity. The approach we take to calculating benefits comes with important inherent uncertainty for the reasons
already noted. That said, it does not require many assumptions. Thus, there are relatively few variables for which we can choose
alternatives to test the sensitivity of our analysis. We did choose to rely on crisis data from OECD countries rather than the full
sample. Table 3 reports data if we use the full sample.
There is a relatively technical assumption in the calculation concerning the loss given default (LGD) of failing banks.27 DDLRT
cite research that examines recovery rates for securities and loans across different security types, industries, and macroeconomic
periods. This work suggests that LGDs can range from 50 percent in normal periods to 75 percent in stressful periods. We take away
from this literature that the choice of the LGD comes with much uncertainty, with many factors influencing the LGD. LGDs are
higher for more-subordinated securities, for the financial industry, and during economic downturns. LGDs are significantly lower
for loans versus securities. Furthermore, accounting for industry differences generally removes the importance of economic cycles
on the loss rates. Given a set of outcomes ranging from 50 percent to 75 percent across many sets of characteristics, we choose
62.5 percent as the LGD in our calculations, which is the average of 50 and 75. Table 3 provides details of the sensitivity of our
probability calculations to this assumption.
27 DDLRT cite Schuermann (2004), Shibut and Singer (2014), and Johnston, Ross, and Shibut (2015).
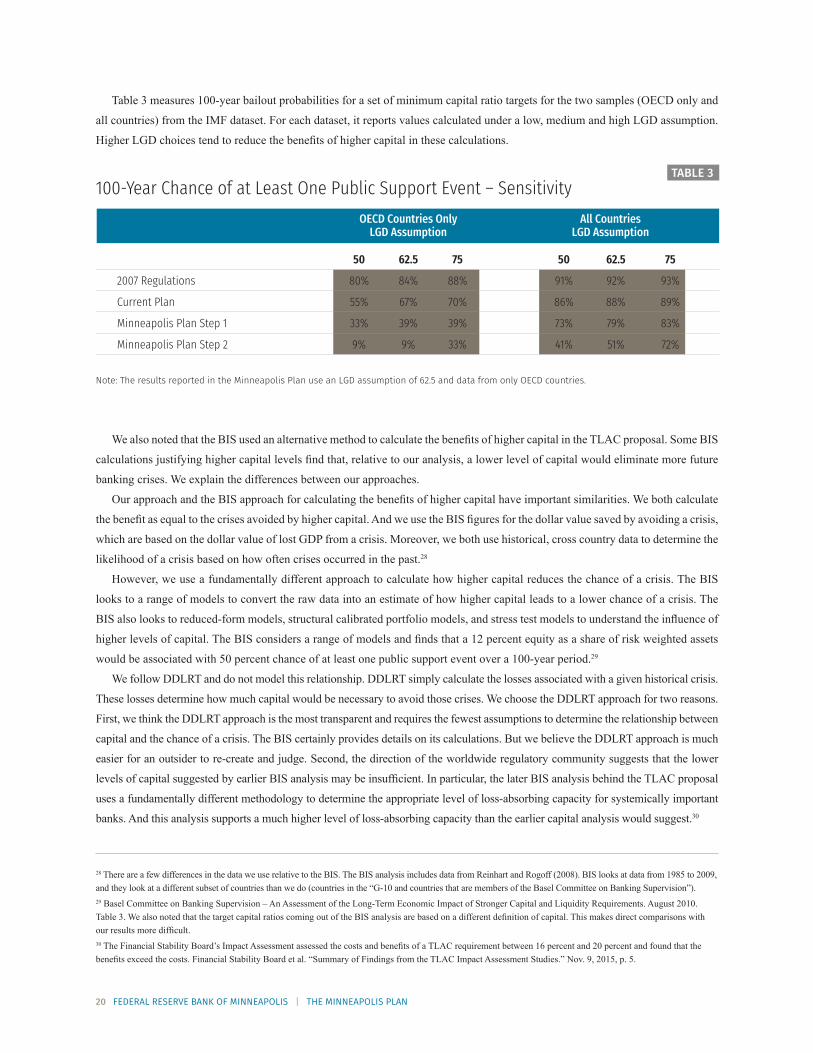
20 FEDERAL RESERVE BANK OF MINNEAPOLIS | THE MINNEAPOLIS PLAN
Table 3 measures 100-year bailout probabilities for a set of minimum capital ratio targets for the two samples (OECD only and
all countries) from the IMF dataset. For each dataset, it reports values calculated under a low, medium and high LGD assumption.
Higher LGD choices tend to reduce the benefits of higher capital in these calculations.
TABLE 3100-Year Chance of at Least One Public Support Event – Sensitivity OECD Countries Only All Countries LGD Assumption LGD Assumption
50 62.5 75 50 62.5 75
2007 Regulations 80% 84% 88% 91% 92% 93%
Current Plan 55% 67% 70% 86% 88% 89%
Minneapolis Plan Step 1 33% 39% 39% 73% 79% 83%
Minneapolis Plan Step 2 9% 9% 33% 41% 51% 72%
Note: The results reported in the Minneapolis Plan use an LGD assumption of 62.5 and data from only OECD countries.
We also noted that the BIS used an alternative method to calculate the benefits of higher capital in the TLAC proposal. Some BIS
calculations justifying higher capital levels find that, relative to our analysis, a lower level of capital would eliminate more future
banking crises. We explain the differences between our approaches.
Our approach and the BIS approach for calculating the benefits of higher capital have important similarities. We both calculate
the benefit as equal to the crises avoided by higher capital. And we use the BIS figures for the dollar value saved by avoiding a crisis,
which are based on the dollar value of lost GDP from a crisis. Moreover, we both use historical, cross country data to determine the
likelihood of a crisis based on how often crises occurred in the past.28
However, we use a fundamentally different approach to calculate how higher capital reduces the chance of a crisis. The BIS
looks to a range of models to convert the raw data into an estimate of how higher capital leads to a lower chance of a crisis. The
BIS also looks to reduced-form models, structural calibrated portfolio models, and stress test models to understand the influence of
higher levels of capital. The BIS considers a range of models and finds that a 12 percent equity as a share of risk weighted assets
would be associated with 50 percent chance of at least one public support event over a 100-year period.29
We follow DDLRT and do not model this relationship. DDLRT simply calculate the losses associated with a given historical crisis.
These losses determine how much capital would be necessary to avoid those crises. We choose the DDLRT approach for two reasons.
First, we think the DDLRT approach is the most transparent and requires the fewest assumptions to determine the relationship between
capital and the chance of a crisis. The BIS certainly provides details on its calculations. But we believe the DDLRT approach is much
easier for an outsider to re-create and judge. Second, the direction of the worldwide regulatory community suggests that the lower
levels of capital suggested by earlier BIS analysis may be insufficient. In particular, the later BIS analysis behind the TLAC proposal
uses a fundamentally different methodology to determine the appropriate level of loss-absorbing capacity for systemically important
banks. And this analysis supports a much higher level of loss-absorbing capacity than the earlier capital analysis would suggest.30
28 There are a few differences in the data we use relative to the BIS. The BIS analysis includes data from Reinhart and Rogoff (2008). BIS looks at data from 1985 to 2009, and they look at a different subset of countries than we do (countries in the “G-10 and countries that are members of the Basel Committee on Banking Supervision”).29 Basel Committee on Banking Supervision – An Assessment of the Long-Term Economic Impact of Stronger Capital and Liquidity Requirements. August 2010. Table 3. We also noted that the target capital ratios coming out of the BIS analysis are based on a different definition of capital. This makes direct comparisons with our results more difficult. 30 The Financial Stability Board’s Impact Assessment assessed the costs and benefits of a TLAC requirement between 16 percent and 20 percent and found that the benefits exceed the costs. Financial Stability Board et al. “Summary of Findings from the TLAC Impact Assessment Studies.” Nov. 9, 2015, p. 5.
21 FEDERAL RESERVE BANK OF MINNEAPOLIS | THE MINNEAPOLIS PLAN
We also note that some BIS analysis of the crisis data would support our recommended level of capital. In particular, a review of
historical losses and recapitalization needs from the global financial crisis found that the maximum loss and recapitalization need
for a systemically important bank was 25 percent of risk-weighted assets (in the case of Fortis).31 Our aim is to end TBTF. This goal
suggests that we set our minimum capital level at the amount that would have prevented the failure of systemically important banks
during the last financial crisis. Indeed, analysis of a broader set of historical banking/financial crises and related losses found that a
loss-absorbing capacity of 24 percent of risk-weighted assets would be necessary to absorb the losses from 95 percent of banks.32 In
a relatively similar vein, and even when limiting the analysis to the U.S. experience only, the Federal Reserve found that “the bank
holding company with the most severe loss experience during the great financial crisis incurred estimated losses and recapitaliza-
tion needs of roughly 19 percent of risk-weighted assets.”33
3.1.3 Describing the Costs of Higher Capital Analysis and Results. To calculate the costs of our proposal, we follow the methodol-
ogy of the BIS as closely as we can. We describe the general steps we take under this approach in this section while providing the
technical implementation in Section 4.
Methodology. The BIS approach has four main steps. First, the cost of any proposal reflects the amount of new capital banks
must issue. So we start our analysis by comparing the amount of equity banks currently have relative to a target amount. For ex-
ample, we compare current capital levels for covered banks to the proposed minimum level of 23.5 percent. The difference between
the two is the amount of capital a bank must raise.
Second, we determine how much it costs a bank to fund themselves with that much new capital. We use the following logic
to determine the cost of the additional capital. The bank has the choice of funding itself with equity or debt. Debt is cheaper than
equity in practice because banks can deduct the interest payments on debt, thus reducing their taxes, but they cannot deduct the
dividends they pay on equity. There are other reasons as well for debt being cheaper than equity, even if some models of how firms
finance themselves suggest that the two have the same cost. We discuss this point shortly. We calculate the cost of equity as being
equal to the return on equity that banks earn, while the cost of debt reflects the interest they pay on debt.
Third, we have to determine how banks respond to the higher costs associated with the larger share of equity funding and what
that response means for bank customers and the overall economy. Following the BIS methodology, we assume in our analysis that
covered banks are able to pass through some of these higher costs in the form of higher rates on loans. Key questions are how much
of the higher costs the covered banks can pass through and how banks that do not face the higher capital requirement respond. The
BIS analysis assumes that banks pass through all of the additional funding costs to their borrowers. This could be justified if the
market for loans were perfectly competitive and all banks were subject to additional capital requirements. But only the covered
banks face a higher capital regime under our proposal. As a result, our base case is that banks can pass through only half of the
higher costs. We discuss this decision below.
Finally, we must model how higher loan rates affect the economy. Higher loan rates should depress economic activity because
they raise the cost of borrowing. Higher borrowing costs reduce investment, which should reduce GDP. But by how much relative
to what would have occurred absent our higher capital requirement? To answer this question, we follow the BIS method and rely on
models of the economy that central banks already use to simulate how a change in one part of the economy can affect another. In our
case, we run such a simulation using the FRB/US model produced and made available to the public by the Federal Reserve Board.
Key Choices. Determining the cost of higher capital requirements using the BIS methodology is much more technical and re-
quires many more choices than the calculation of benefits we described above. But we believe there are two particularly important
choices that we should highlight.
31 Financial Stability Board et al. “Summary of Findings from the TLAC Impact Assessment Studies.” Nov. 9, 2015, p. 29.32 See The Vickers Report, available at http://researchbriefings.parliament.uk/ResearchBriefing/Summary/SN06171.33 Board of Governors. Notice of Proposed Rulemaking. Total Loss-Absorbing Capacity. Federal Register, vol. 80, no. 229, Nov. 30, 2015, 74932.
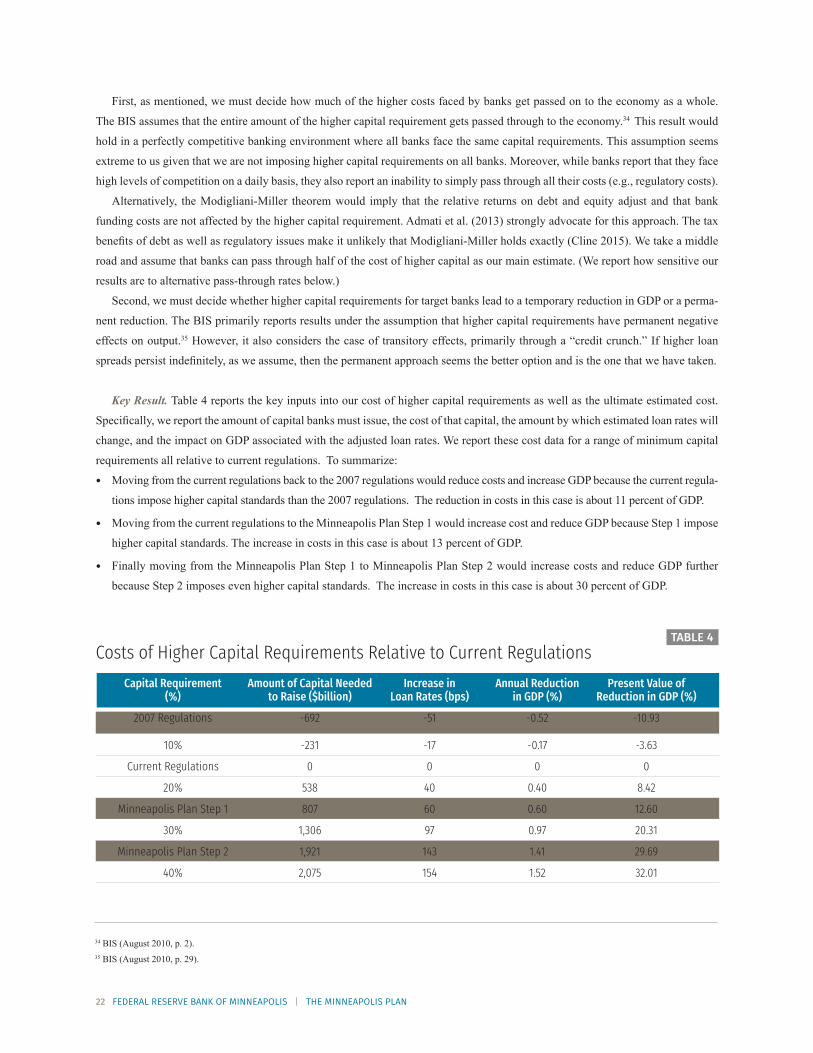
22 FEDERAL RESERVE BANK OF MINNEAPOLIS | THE MINNEAPOLIS PLAN
First, as mentioned, we must decide how much of the higher costs faced by banks get passed on to the economy as a whole.
The BIS assumes that the entire amount of the higher capital requirement gets passed through to the economy.34 This result would
hold in a perfectly competitive banking environment where all banks face the same capital requirements. This assumption seems
extreme to us given that we are not imposing higher capital requirements on all banks. Moreover, while banks report that they face
high levels of competition on a daily basis, they also report an inability to simply pass through all their costs (e.g., regulatory costs).
Alternatively, the Modigliani-Miller theorem would imply that the relative returns on debt and equity adjust and that bank
funding costs are not affected by the higher capital requirement. Admati et al. (2013) strongly advocate for this approach. The tax
benefits of debt as well as regulatory issues make it unlikely that Modigliani-Miller holds exactly (Cline 2015). We take a middle
road and assume that banks can pass through half of the cost of higher capital as our main estimate. (We report how sensitive our
results are to alternative pass-through rates below.)
Second, we must decide whether higher capital requirements for target banks lead to a temporary reduction in GDP or a perma-
nent reduction. The BIS primarily reports results under the assumption that higher capital requirements have permanent negative
effects on output.35 However, it also considers the case of transitory effects, primarily through a “credit crunch.” If higher loan
spreads persist indefinitely, as we assume, then the permanent approach seems the better option and is the one that we have taken.
Key Result. Table 4 reports the key inputs into our cost of higher capital requirements as well as the ultimate estimated cost.
Specifically, we report the amount of capital banks must issue, the cost of that capital, the amount by which estimated loan rates will
change, and the impact on GDP associated with the adjusted loan rates. We report these cost data for a range of minimum capital
requirements all relative to current regulations. To summarize:
• Moving from the current regulations back to the 2007 regulations would reduce costs and increase GDP because the current regula-
tions impose higher capital standards than the 2007 regulations. The reduction in costs in this case is about 11 percent of GDP.
• Moving from the current regulations to the Minneapolis Plan Step 1 would increase cost and reduce GDP because Step 1 impose
higher capital standards. The increase in costs in this case is about 13 percent of GDP.
• Finally moving from the Minneapolis Plan Step 1 to Minneapolis Plan Step 2 would increase costs and reduce GDP further
because Step 2 imposes even higher capital standards. The increase in costs in this case is about 30 percent of GDP.
TABLE 4Costs of Higher Capital Requirements Relative to Current Regulations Capital Requirement Amount of Capital Needed Increase in Annual Reduction Present Value of (%) to Raise ($billion) Loan Rates (bps) in GDP (%) Reduction in GDP (%)
2007 Regulations -692 -51 -0.52 -10.93
10% -231 -17 -0.17 -3.63
Current Regulations 0 0 0 0
20% 538 40 0.40 8.42
Minneapolis Plan Step 1 807 60 0.60 12.60
30% 1,306 97 0.97 20.31
Minneapolis Plan Step 2 1,921 143 1.41 29.69
40% 2,075 154 1.52 32.01
34 BIS (August 2010, p. 2).35 BIS (August 2010, p. 29).
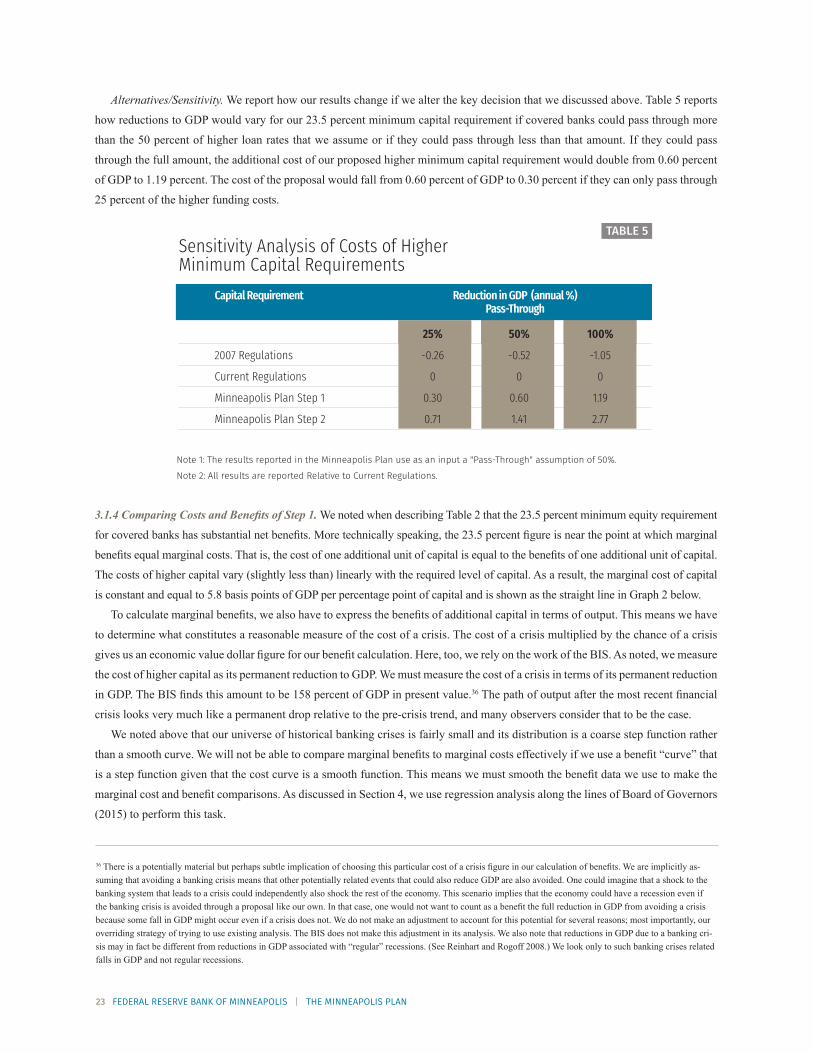
23 FEDERAL RESERVE BANK OF MINNEAPOLIS | THE MINNEAPOLIS PLAN
Alternatives/Sensitivity. We report how our results change if we alter the key decision that we discussed above. Table 5 reports
how reductions to GDP would vary for our 23.5 percent minimum capital requirement if covered banks could pass through more
than the 50 percent of higher loan rates that we assume or if they could pass through less than that amount. If they could pass
through the full amount, the additional cost of our proposed higher minimum capital requirement would double from 0.60 percent
of GDP to 1.19 percent. The cost of the proposal would fall from 0.60 percent of GDP to 0.30 percent if they can only pass through
25 percent of the higher funding costs.
TABLE 5 Sensitivity Analysis of Costs of Higher Minimum Capital Requirements Capital Requirement Reduction in GDP (annual %) Pass-Through
25% 50% 100%
2007 Regulations -0.26 -0.52 -1.05
Current Regulations 0 0 0
Minneapolis Plan Step 1 0.30 0.60 1.19
Minneapolis Plan Step 2 0.71 1.41 2.77
Note 1: The results reported in the Minneapolis Plan use as an input a "Pass-Through" assumption of 50%.
Note 2: All results are reported Relative to Current Regulations.
3.1.4 Comparing Costs and Benefits of Step 1. We noted when describing Table 2 that the 23.5 percent minimum equity requirement
for covered banks has substantial net benefits. More technically speaking, the 23.5 percent figure is near the point at which marginal
benefits equal marginal costs. That is, the cost of one additional unit of capital is equal to the benefits of one additional unit of capital.
The costs of higher capital vary (slightly less than) linearly with the required level of capital. As a result, the marginal cost of capital
is constant and equal to 5.8 basis points of GDP per percentage point of capital and is shown as the straight line in Graph 2 below.
To calculate marginal benefits, we also have to express the benefits of additional capital in terms of output. This means we have
to determine what constitutes a reasonable measure of the cost of a crisis. The cost of a crisis multiplied by the chance of a crisis
gives us an economic value dollar figure for our benefit calculation. Here, too, we rely on the work of the BIS. As noted, we measure
the cost of higher capital as its permanent reduction to GDP. We must measure the cost of a crisis in terms of its permanent reduction
in GDP. The BIS finds this amount to be 158 percent of GDP in present value.36 The path of output after the most recent financial
crisis looks very much like a permanent drop relative to the pre-crisis trend, and many observers consider that to be the case.
We noted above that our universe of historical banking crises is fairly small and its distribution is a coarse step function rather
than a smooth curve. We will not be able to compare marginal benefits to marginal costs effectively if we use a benefit “curve” that
is a step function given that the cost curve is a smooth function. This means we must smooth the benefit data we use to make the
marginal cost and benefit comparisons. As discussed in Section 4, we use regression analysis along the lines of Board of Governors
(2015) to perform this task.
36 There is a potentially material but perhaps subtle implication of choosing this particular cost of a crisis figure in our calculation of benefits. We are implicitly as-suming that avoiding a banking crisis means that other potentially related events that could also reduce GDP are also avoided. One could imagine that a shock to the banking system that leads to a crisis could independently also shock the rest of the economy. This scenario implies that the economy could have a recession even if the banking crisis is avoided through a proposal like our own. In that case, one would not want to count as a benefit the full reduction in GDP from avoiding a crisis because some fall in GDP might occur even if a crisis does not. We do not make an adjustment to account for this potential for several reasons; most importantly, our overriding strategy of trying to use existing analysis. The BIS does not make this adjustment in its analysis. We also note that reductions in GDP due to a banking cri-sis may in fact be different from reductions in GDP associated with “regular” recessions. (See Reinhart and Rogoff 2008.) We look only to such banking crises related falls in GDP and not regular recessions.
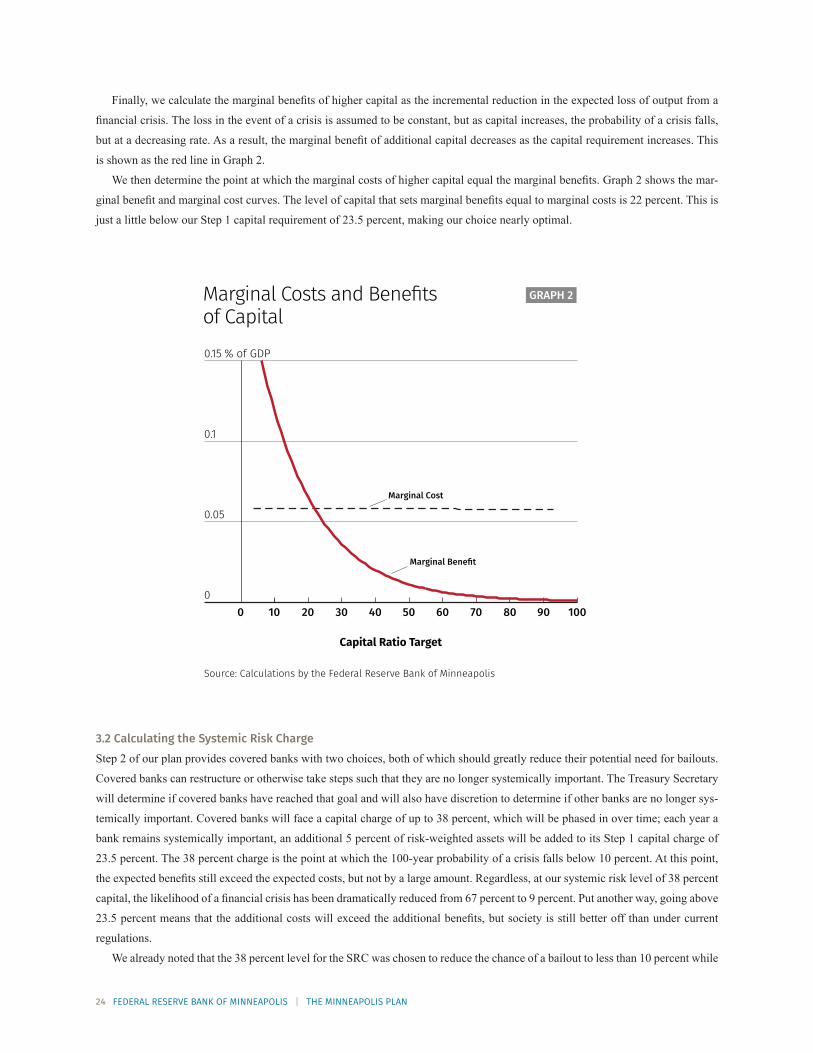
24 FEDERAL RESERVE BANK OF MINNEAPOLIS | THE MINNEAPOLIS PLAN
Finally, we calculate the marginal benefits of higher capital as the incremental reduction in the expected loss of output from a
financial crisis. The loss in the event of a crisis is assumed to be constant, but as capital increases, the probability of a crisis falls,
but at a decreasing rate. As a result, the marginal benefit of additional capital decreases as the capital requirement increases. This
is shown as the red line in Graph 2.
We then determine the point at which the marginal costs of higher capital equal the marginal benefits. Graph 2 shows the mar-
ginal benefit and marginal cost curves. The level of capital that sets marginal benefits equal to marginal costs is 22 percent. This is
just a little below our Step 1 capital requirement of 23.5 percent, making our choice nearly optimal.
Capital Ratio Target
Source: Calculations by the Federal Reserve Bank of Minneapolis
GRAPH 2
0
0.05
0.1
% of GDP0.15
0 10 20 30 40 50 60 70 80 90 100
Marginal Costs and Benefits of Capital
Marginal Cost
Marginal Benefit
3.2 Calculating the Systemic Risk ChargeStep 2 of our plan provides covered banks with two choices, both of which should greatly reduce their potential need for bailouts.
Covered banks can restructure or otherwise take steps such that they are no longer systemically important. The Treasury Secretary
will determine if covered banks have reached that goal and will also have discretion to determine if other banks are no longer sys-
temically important. Covered banks will face a capital charge of up to 38 percent, which will be phased in over time; each year a
bank remains systemically important, an additional 5 percent of risk-weighted assets will be added to its Step 1 capital charge of
23.5 percent. The 38 percent charge is the point at which the 100-year probability of a crisis falls below 10 percent. At this point,
the expected benefits still exceed the expected costs, but not by a large amount. Regardless, at our systemic risk level of 38 percent
capital, the likelihood of a financial crisis has been dramatically reduced from 67 percent to 9 percent. Put another way, going above
23.5 percent means that the additional costs will exceed the additional benefits, but society is still better off than under current
regulations.
We already noted that the 38 percent level for the SRC was chosen to reduce the chance of a bailout to less than 10 percent while
25 FEDERAL RESERVE BANK OF MINNEAPOLIS | THE MINNEAPOLIS PLAN
passing a benefit and cost test.37 In this section, we describe the process by which we think the Treasury will make its determination
on a firm’s systemic importance.
3.2.2 Determining Ongoing Systemic Risk of Designated Systemically Important Banks and Financial Firms, Step 2 of our
plan gives firms a choice: Cease to be considered systemically important or face the SRC just described. Our plan will charge the
Treasury Secretary with determining if firms remain systemically important. Our charge for the Treasury regarding determining
the systemic risk posed by banks and shadow banks differs from the current framework for assessing the systemic importance of
financial firms. Today, the Dodd-Frank Act effectively determines which banks are systemically important, not the Treasury Secre-
tary. The Financial Stability Oversight Committee (FSOC) determines which nonbank financial firms are systemically important.
In our proposal, the Treasury Secretary must certify if a bank or shadow bank is not systemically important; the FSOC will not
carry out its former role in designating nonbank financial firms as systemically important. Of course, systemic risk is inherently
hard to measure. Thus, we provide the Treasury Secretary with the ultimate authority to make this determination. The Treasury
can take advantage of the full range of data collection and analysis across the federal government to help it identify and respond to
systemic risk and financial instability. And our plan gives the Treasury the discretion to determine if it cannot certify that any bank
or shadow bank is not systemically important.
But the Treasury Secretary would not start with a blank slate. There is a set of metrics and measurements that bank supervisors,
including the Board of Governors, use to assess the systemic risk posed by banks. They do so in the context of applying a so-called
SIFI surcharge to GSIBs.38 We would call on the Treasury to look to this measurement approach used by other regulators in making
its certification that a bank does not pose systemic risk. Of course, this need not be the only methodology, but it could contribute
to its assessment.
Given that we recommend that the Treasury Secretary start with this approach to assessing systemic risk, it is worth noting that
this approach generates a much smaller systemic risk surcharge than our proposal. Thus, we briefly describe why this outcome
occurs. The Board analysis behind the calibration of the GSIB surcharge chooses an additional amount of capital to equalize the
expected loss of a particular GSIB relative to a reference bank holding company that is not a GSIB in the event of a default.39
Specifically, a higher capital level is sought for the GSIB to offset the fact that its default would impose more losses on society
than a non-GSIB given its systemic nature. Mechanically, this approach attempts to reduce the GSIB’s probability of default by an
amount that offsets its larger loss given default relative to a non-GSIB.
In the current period, the Board’s approach generates a capital surcharge roughly between one to five percentage points. As
noted, our proposal would impose a much larger effective surcharge for banks deemed systemically important. A bank determined
to be systemically important under our proposal would ultimately face a capital charge of up to 38 percent, which is about 15 per-
centage points higher than banks that the Treasury Secretary affirms are not systemically important.
This difference reflects the fact that we focus on trying to determine the level of capital funding banks need to reduce the chance
of a banking crisis to less than 10 percent. As noted, we use cross country data on banking crises to make this calculation. In con-
trast, the Board calibration relies on return on risk-weighted assets experience from large banks in the United States alone and over
crisis and non-crisis periods. The use of non-stress periods in this exercise suggests that the tail outcomes may not be as extreme
as those we are considering. We believe that continuing to focus on the distribution of outcomes from the IMF database is more
appropriate and conservative. Specifically, the IMF database includes only financial crisis outcomes.
37 Relative to current regulations, the benefits of this requirement continue to exceed the costs even assuming that all of the banks covered by Step 1 are also covered by Step 2. In this case, we mean total benefits and total costs, not marginal benefits and marginal costs.38 A detailed description of the charge can be found at https://www.federalreserve.gov/apps/reportforms/reportdetail.aspx?sOoYJ+5BzDaRHakir9P9vg== https://www.federalreserve.gov/newsevents/press/bcreg/20150720a.htm.39 The underlying data set comes from the Y-9C. It measures returns on risk-weighted assets for the largest 50 bank holding companies quarterly from 1987 to 2014. See “Calibrating the GSIB Surcharge,” Board of Governors of the Federal Reserve System, July 20, 2015.
26 FEDERAL RESERVE BANK OF MINNEAPOLIS | THE MINNEAPOLIS PLAN
3.3 Empirical Approach for Shadow Bank Tax RecommendationsSetting a capital charge at the level we advocate raises concerns regarding nonbank financial institutions, or shadow banks, with
whom banks compete but which will not face the same capital standard. The big concern is that bank activities will move to the
shadow banking sector, where they could receive less monitoring and fewer constraints. Over time, such movement could erode
the ability of the new minimum capital requirement and systemic risk charge to end the TBTF problem. This activity could end up
being funded with debt, and such leverage is a key source of risk that leads to spillovers.
We propose addressing this potential threat by levying a tax on borrowing in the shadow sector. This tax would try to make
funding a balance sheet as costly in the shadow sector as it is in the banking sector. We would apply the tax to the borrowing of
firms central to the shadow banking sector, with the determination of those firms informed by FSB analysis. Specifically, we would
apply it to firms with assets greater than $50 billion (including off-balance-sheet assets and assets under management). Of course,
firms and investment vehicles with no borrowings would not pay the tax.
Taxing to discourage borrowing, or at least to not encourage it, in the financial sector is not an original idea (see the literature
review below). But there is much less research on applying a leverage tax to the shadow banking system than there is on setting
capital requirements. As such, we believe additional analysis, research, and feedback on this aspect of our proposal will certainly
improve it. This additional work would be particularly important for our proposal, as we take a very conservative approach that will
impose the tax on borrowing even to firms that have high levels of equity capital.
3.3.1 Relevant Literature. Our motivation for the shadow bank surcharge is related to, but different from, most analysis on banks,
nonbanks, capital regulation, and taxes or surcharges. The main strand of the literature focuses on the tax-advantaged status of debt
in most countries. The favorable treatment of debt in the United States, for example, encourages banks to take on more leverage
(all else equal). Higher leverage raises the chance of bank failure. Moreover, bank failure can impose costs on society that bank
owners and managers do not account for, leading to a classic externality problem. This outcome could potentially lead governments
to eliminate the preferred status of debt for financial institutions and treat equity more favorably.
Roe and Tröge (2016a) and Roe and Tröge (2016b) argue that reversing the tax-advantaged status of bank debt would substan-
tially decrease the risk in the banking system, allowing for less stringent bank regulation. De Mooij and Keen (2016) find that favor-
able tax treatment of debt does lead banks to take on more leverage as does Schepens (2015). Panteghini, Parisi, and Pighetti (2012)
find that tax reforms in Italy to reduce the tax-advantaged status of bank-issued debt reduced leverage. Devereux, Johannesen, and
Vella (2015) have a similar finding, but also report that higher asset risk-taking occurred at the same time leverage fell. Bengui and
Bianchi (2014) and Begenau and Landvoigt (2016) examine formally the unintended consequences of regulation over the shadow
banking system with the latter estimating an optimal capital charge across the banking and shadow sectors.
Our analysis has some overlap with the literature just summarized. We assume that banks will take on too much leverage under
current capital regimes. By too much leverage, we mean that the chance of bank failure remains too high because of the external
costs imposed by that failure. But we assume in the Minneapolis Plan that the government will force banks to internalize this ex-
ternality through a higher capital charge. Thus, the problem is that activity previously conducted in the banking sector may move
to the shadow banking sector, which does not face the same capital regime. In response, the government should set a charge that
addresses this unequal playing field.
In that sense, our review of the literature has focused narrowly on analysis of taxing borrowing in the banking system or at least
not subsidizing borrowing in the tax code. There is a much broader and older literature on using taxes to discourage activity that
poses spillovers, such as pollution.40
There is also a separate and growing literature that examines the risk of the shadow banking system and seeks to limit and
manage it using alternatives to a leverage tax. Some of the literature focuses precisely on the potential for higher bank capital
40 See Barthold (1994) and Mankiw (2009).
27 FEDERAL RESERVE BANK OF MINNEAPOLIS | THE MINNEAPOLIS PLAN
requirements to move activity to the shadow sector.41 Ricks (2016) argues for the use of entry restrictions to limit the potential for
spillovers from the shadow banking system.42 Greenwood et al. (2016) argue that government should issue additional money-like
claims to crowd out the issuance of such short-term debt by shadow banks.43
3.3.2. General Methodology. Our approach, which we call the funding equivalence method, assumes that the new capital charge on
banks is optimal and internalizes the externality caused by leverage per Bianchi (2011). The new, higher capital charge changes the
overall cost of funds of the bank, driving it up. The government should want the overall cost of funds in the shadow system to be
the same as the new cost of funds in the banking system in the sense of having a level playing field. As such, we calculate the charge
on the shadow system cost of funds—in particular the costs of debt--so that it equals that of the formal banking system. Thus, the
shadow system also internalizes the externality of leverage.
We build on Bianchi (2011) by extending the analysis to allow for banks and shadow banks to fund themselves with equity, uninsured
debt and insured deposits. The basic intuition for this approach is as follows: The return on equity is greater than the return on debt, so
financial firms would prefer to finance themselves with debt. In this approach, the level of debt without regulation (i.e., a tax on bank
debt or a capital charge) is too high due to an externality.44 The government can counteract the externality by imposing a tax on debt or,
equivalently, imposing a minimum capital requirement for banks. Imposing a minimum capital requirement raises the costs of funds and
reduces the amount of debt issued by the bank. This reduces the size of bank balance sheets to a more “socially optimal” level.
Under this framework, one can achieve the same “socially optimal” level by imposing a tax on borrowing of shadow banks. That is,
given a minimum capital ratio, we can derive an equivalent tax rate for shadow debt borrowing. We take that approach in this section.
Section 4 contains the details of our calculations.
Finally, as a matter of administration, the revenues generated by the tax would not be earmarked for any specific purpose. That
is, they would be considered general revenues.
3.3.3 Key Decisions. Implementing this approach requires many decisions.
First, we use this framework to calculate the tax rate that select shadow banks will pay on all their borrowings. But we could
take an alternative approach. Some observers have noted that risk from shadow banks arises from their short-term borrowings.
Holders of the short-term liabilities of shadow banks can run, equivalent to runs on banks by depositors. This would suggest that
we only tax short-term borrowings of shadow banks. We decided to tax all borrowings for three reasons. First, consistent with an
influential framework used by central banks to monitor risks to financial stability, we view leverage as a key source of systemic
risk in addition to maturity transformation arising from borrowing short-term and holding longer-term assets.45 Second, we view
long-term borrowing as posing its own risk. As noted, we think imposing losses on long-term debt holders of financial firms during
periods of market stress can increase financial instability. Finally, by taxing all borrowings, we do not give up the imposition of an
additional fee on short-term borrowings.
Second, we must also make a decision about the application of this approach, specifically which firms will face the tax? To
answer this question, we look to the existing literature on shadow banks to determine which types of firms should face the charge.46
We follow the FSB’s policy framework for the oversight of shadow banks.47 The FSB instructs authorities to “cast a wide net” and
41 See Kashyap, Stein, and Hanson (2010) and Aiyar, Calomiris, and Wieladek (2014) for a discussion of this issue.42 See Ricks (2016).43 See Greenwood, Hanson, and Stein (2016).44 In the decentralized economy, the financial sector is “too big” in the sense that it issues too many loans to the nonfinancial sector (households) that are funded by borrowing on the world market. A tax on bank debt (or a costly capital requirement) raises the cost of bank loans, limiting the size of the financial sector. 45 See Adrian, Covitz, and Liang (2014).46 We consulted work by the Federal Reserve, the FSB, and the IMF. IMF Global Financial Stability Report, 2015; Adrian and Ashcraft (2012); Pozsar, Adrian, Ash-craft, and Boesky (2012); FSB Global Shadow Banking Monitoring Report, 2014; FSB Global Shadow Banking Monitoring Report, 2015.47 Strengthening Oversight and Regulation of Shadow Banking. Policy Framework for Strengthening Oversight and Regulation of Shadow Banking Entities. FSB. August 2013.
28 FEDERAL RESERVE BANK OF MINNEAPOLIS | THE MINNEAPOLIS PLAN
monitor all nonbank credit intermediation. The FSB also urges authorities to focus on activities and firms that increase systemic
risk. Within their framework, the FSB begins by identifying nonbanks that engage in financial intermediation activities. It narrows
the scope by focusing on firms that perform credit intermediation and have bank-like systemic risks. Thus, we choose to apply the
tax to the representative firms that are identified and monitored by the FSB as a part of its Global Shadow Bank Monitoring Report.
These entities are:
1. Funding corporations
2. Real estate investment trusts
3. Trust companies
4. Money market mutual funds
5. Finance companies
6. Structured finance vehicles
7. Broker/dealers
8. Investment funds that include hedge funds and mutual funds
Our approach does not put insurance firms into the group of shadow banks facing our proposed shadow bank tax. There are
strengths and weaknesses with this decision. Supporting it is the view that insurance firms do not engage in the maturity trans-
formation or reliance on short-term funding that typically generates systemic risk. That is, the business model of insurance firms
does not justify them paying the shadow bank tax. However, the FSOC has deemed three insurance firms as systemically important
institutions. And we know that insurance firms have the capability to engage in risky behavior, either in their core operations or
in the form of activities ancillary to the provision of core insurance activities (e.g., AIG’s financial products activity).48 The FSB’s
summary material does not point to insurance firms as typically shadow banks. But we view additional analysis on the systemic risk
posed by insurance firms as useful and important to determining if these firms should be subject to a shadow bank tax. Moreover,
under our proposal, the Treasury would have the ability to determine whether to certify that a given nonbank financial firm, such as
an insurance firm, was or was not systemically important.
Third, we must also decide if we want to target the tax to specific firms within these general groups. We think it makes sense to
focus on the largest firms because they seem to have the most potential to pose systemic risk in the future. We choose a $50 billion
asset threshold, which would include on-balance-sheet assets, off-balance-sheet assets, and assets under management. We choose
this level because it is the cutoff in Dodd-Frank for determining which banks are systemically important. We fully recognize that
choosing this threshold is arbitrary, may not ultimately prove to be the right level, and would benefit from feedback. Moreover,
choosing a $50 billion threshold adds complexity to our proposal because this threshold is not the same as the one used for our
capital regime for banks. We choose the lower threshold for shadow banks nonetheless because of the uncertainty in knowing which
shadow banks would pose systemic risk. The riskiness and threat to stability of shadow banks seems much less clear than it is for
banks. As a result, we would prefer to err on including more firms to face the shadow tax initially than too few firms. The agency
setting the tax should work with elected officials to raise the level if it develops evidence that the threshold applies to firms it should
not. In this same general sense, government agencies have adapted their application of rules over time to account for the fact that
smaller firms facing those rules may not pose the same systemic risk of larger firms. It is also worth repeating that the tax only ap-
plies to firms that borrow. Firms of any size can escape the tax by relying only on equity funding.
Fourth, we assume that assets held by firms in both sectors are equally risky. This is a simplifying assumption to facilitate the
calculation. It is difficult to determine the precise level of risk that assets in the two sectors pose. Thus, this seems like a reasonable
assumption, but also one worthy of additional study and critique.
48 Concerns about the systemic risk that insurance firms can pose can be found in Koijen and Yogo (2015, 2016).
29 FEDERAL RESERVE BANK OF MINNEAPOLIS | THE MINNEAPOLIS PLAN
Fifth, we make this calculation assuming that shadow banks are not funded with any equity. In one sense, this is an extreme
assumption. Many shadow banks are funded with very high levels of equity relative to commercial banks. Our plan does not give
these firms credit. Why? We want the tax to discourage shadow banks across the board from borrowing in the future to take on new
activities that banks drop. As such, we set the tax high right away, avoiding the need to try to play catch-up once shadow banks
have already leveraged up to bank levels. Here, too, we encourage feedback on the proposal. We also note an alternative approach
below that would more directly take account of the equity of shadow banks in the setting of the tax.
3.3.4 Key Result. Using our method, we estimate that the shadow surcharge should be 1.2 percent on the principal value of debt
issued by shadow banks if a capital requirement of 23.5 percent was set on large U.S. banks in Step 1. As noted, shadow banks
that continue to pose systemic risk would face a higher tax rate of 2.2 percent, which is the equivalent to the systemic risk charge
of 38 percent.
3.3.5 Alternatives/Sensitivity. We considered at least three alternatives to our current approach.
First, an alternative framing of a tax on leverage in the shadow sector starts by noting the current practice of subsidizing leverage
through the favorable tax treatment of debt. From this view, the first step is to eliminate this tax advantage before setting up a new
tax. Our proposal effectively has that result. We would still generate a positive tax rate for shadow banks under our methodology,
even if we assume the removal of banks’ and shadow banks’ tax preference for issuing debt. Put another way, our proposal has the
effect of removing the tax preference for issuing debt in the course of also equalizing funding costs between banks and shadow
banks. Specifically, eliminating the tax deductibility of debt accounts for 0.4 percentage point, or one-third, of the original 1.2
percent shadow bank tax. The remaining two-thirds of the tax serves to internalize the externality imposed by excessive borrowing.
Second, the tax rate could vary with the debt share of liabilities. Less debt would imply a lower tax rate. As equity increases from
our assumed value of zero, the tax rate required to equalize the cost of funding across sectors falls. Given our choice of returns, a
shadow firm with roughly 18 percent equity has the same cost of funds49 with a tax rate of 0 percent as one of our covered banks or
a shadow bank with no equity and a 1.2 percent tax on debt. Another alternative is a tax schedule that is an increasing function of a
shadow bank’s leverage to induce firms to fund themselves with enough equity. The tax on debt would be very low, perhaps zero,
for debt below 76.5 percent of liabilities. Above 76.5 percent, the tax on debt would be significantly above zero and perhaps even
increasing in leverage. This would induce firms to satisfy the 23.5 percent equity requirement by their own choice. We chose not to
pursue either of these approaches in the name of simplicity.
In a third and a completely different approach, capital requirements could be set for shadow banking firms equal to the levels we
propose for banks. In fact, we view this approach as attractive in concept as it is the most direct and does not require trying to relate
a tax charge to a capital charge. But we do not view this potentially first best option as available in practice. In particular, shadow
banks exist across many industries, activities and current regulatory regimes. It is not clear how practical it would be to set capital
requirements equal given this institutional structure. Bank supervisors faced significant challenges in determining how to set capital
levels for systemically important insurance firms. A tax would cut through this organizational and legal challenge. Our approach by
necessity requires the government to try to set the tax and capital regimes to be equal. This is clearly difficult to do and comes with
a potentially high degree of uncertainty. Nonetheless, it seems more practical than the alternatives.
49 The funding equivalence holds with 18 percent equity rather than 23.5 percent because shadow banks are not able to fund themselves with relatively low-cost insured deposits.
30 FEDERAL RESERVE BANK OF MINNEAPOLIS | THE MINNEAPOLIS PLAN
This section provides the technical details behind our calculations used to support and define our capital and leverage tax
recommendations.
Calculations Supporting Capital RecommendationsWe make two calculations to support the capital recommendations that we describe in more detail in this section. First, we calculate
the benefits of higher capital requirements. Second, we calculate the cost of higher capital requirements. We now provide a more
technical discussion of our analysis than in Section 3.
Calculating the benefits of higher capital requirements
We estimate the benefits of the Minneapolis Plan using the IMF database of past banking crises and NPL rates. To measure the
number of crises avoided by particular capital ratio levels in this database, we must convert NPLs to losses and then to equivalent
capital ratios. For a given capital ratio, the percentage of crises avoided can then be converted to an annualized bailout probability
as well as a 100-year bailout probability.
As noted above, we follow DDLRT to calculate losses as a share of estimated risk-weighted assets. We utilize their measure-
ments of peak NPLs for the crises in their database. NPL rates are converted to loss rates by multiplying by LGD. DDLRT adjust
these loss rates further by using an estimate of prior loss provisioning and an uncertainty buffer. Loss provisioning is measured as
a share of loans and is meant to capture how an average firm might prepare for expected losses. The uncertainty buffer is simply
used to account for some of the uncertainty in this calculation. The rates are then converted to a capital ratio by multiplying by
an estimate of the ratio of total assets to risk-weighted assets. This final step sets the ratio in terms of risk-weighted capital needs.
We operationalize the DDLRT NPL conversion using the following equation per the description above (except for LGD whose
derivations was already discussed, the figures below come from DDLRT).
Adjusted Losses/RWA = (NPL × LGD – provisions + buffer) × (RWA conversion)
where
LGD = Loss given default of 62.5%
provisions = Prior provisioning to be 1.5% of the loan base
buffer = A 1% “safety buffer” to account for parameter uncertainty
RWA conversion = A factor of 1.75
Inserting these values into the equation above, the final version of the DDLRT approach we use to convert NPLs into capital ratios
is then:
Implied Capital Ratio = Adjusted Losses/RWA = (NPL × 0.625 – 1.5 + 1.0) × (1.75)
We can now determine the number of crises avoided in the IMF database given a particular capital target. We further transform the
number avoided to an annual bailout probability by multiplying the percentage of crises avoided by the unconditional probability
SECTION 4
Technical Calculations Supporting the Capital and Leverage Tax Recommendations
31 FEDERAL RESERVE BANK OF MINNEAPOLIS | THE MINNEAPOLIS PLAN
of a crisis in the database. The unconditional probability of a crisis for OECD countries is approximately 3 percent.50 Finally, we
transform the annual bailout probabilities into 100-year bailout probabilities:
Annual Chance of a Bailout = [(1-% of crises avoided) × Probability of a crisis]
Probability of Bailout over the next 100 years = 1-(1 – Annual Chance of a Bailout)100
Calculating the costs of higher capital
We measure the cost of higher capital requirements in terms of lost GDP due to tighter lending conditions. This calculation requires
a number of steps. We trace the impact of higher capital requirements to lower bank return on equity (ROE) and then to higher loan
rates. Higher loan rates slow economic growth by restricting borrowing. As noted above, this approach closely follows the BIS.
In response to higher required capital levels, we assume that banks issue more equity and raise income by increasing their lend-
ing rates. To gauge the magnitudes of these changes, we proceed as follows:
• We first calculate the amount of equity that domestic covered banks will have to issue under a 23.5 percent CET1 capital stan-
dard by obtaining their current equity levels as of 4Q15 from regulatory reports (the Y-9C) and subtracting it from the mandated
minimum level we are analyzing.
• Next, we determine the cost of issuing additional equity by assuming that covered banks pass through half of the higher costs
of equity by increasing interest rates. At the same time, they suffer a decline in their ROE in order to make up the rest. The ad-
ditional cost is borne by the covered banks in the form of lower net income.
This step requires us to gather information on both the ROE and the cost of debt as firms will be replacing existing liabilities with
higher-cost equity as well as losing net income.
ROE
We obtain data on ROE from FactSet Data Systems. We calculate the median annual ROE for each covered bank in the
2010 to 2015 time period. We then calculate the asset weighted average to use as an approximation of covered bank ROE.
Cost of Debt
We obtain daily average credit spreads across all outstanding debt collected in the Moody’s KMV database for each year
from 2010 to 2015. We also obtain daily average 5 year CMT rates from the St. Louis Fed (FRED) database in the 2010 to
2015 time period as the base for determining an estimated yield. For each year we add the spread and rate averages together.
As we did with ROE, we calculate the median annual rate for each covered bank. We then calculate an asset weighted aver-
age to determine the estimated cost of debt for the industry.
Incremental Spread Formula
Using estimates of ROE and cost of debt, we next calculate the increase in loan spreads that will be passed through to borrowers.
We assume that the firms will seek to maintain their ROE but will be able to pass through only half of the increased cost. As a result,
the cost of equity is largely determined by ROE.
To maintain ROE, the firm must offset the additional equity cost with higher net income. For each percentage point increment
50 The IMF database reports 28 OECD crises over the period from 1970 to 2011. These crises represent 24 countries. Thus, we measure the probability as 28 crises divided by 1008 country-years.
32 FEDERAL RESERVE BANK OF MINNEAPOLIS | THE MINNEAPOLIS PLAN
of required equity, the firm must earn: (ROE × New Equity). At the same time, as they switch from equity to debt, they no longer
have to pay for as much borrowing, saving them: (r × New Equity). We use the following formula to estimate the increment to loan
spreads the banks will pass through as a share of loans:
Incremental Loan Spread = 0.50 × (ROE – r) × (Target – Current) × (RWA / Loans)
where
ROE = Estimated ROE for the Covered Banks
r = Estimated after-tax yield on Covered Bank debt
Target = Target CET1 Capital Ratio
Current = Current CET1 Capital Ratio
RWA = Covered bank risk weighted assets
Loans = Loan base to which we apply the incremental spread income
We can multiply this number by 10,000 to obtain basis points.
• To compare the cost of the current regulations to the Minneapolis Plan, we make separate incremental loan spread calculations.
The results from these calculations were reported in Table 4 above. We provide the details for two examples below.
1. For Step 1 of the Minneapolis plan, we perform the following calculation to find that the incremental spread equals 60 basis
points:
60 bps = 10,000 × 0.50 × {(8.58% – 1.78%) × (23.5% – 13%) × ($7.684 trillion / $4.578 trillion)}51
2. For the Current Regulations, we adjust the (Target – Current) quantity. In this case we consider the “Target” to be the 2007
regulatory requirement of 4 percent. Thus we measure the incremental spread of reducing capital from 13 percent to 4
percent. We keep all other values in the formula the same, as they are representative of the current cost of debt and equity
in the industry as well as updated regulatory requirements.
-51 bps = 10,000 × 0.50 × {(8.58% – 1.78%) × (4% – 13%) × ($7.684 trillion / $4.578 trillion)}
These estimated spread changes are used in the final step.52
• Finally, we calculate how much the incremental loan rates change GDP by using the FRB/US model. In particular, we adjust the
spread between the yields on corporate debt relative to 10-year Treasuries by the incremental loan spread calculated above.
We now discuss the GDP calculation in more detail. The costs of higher capital requirements were computed via simulation
using the FRB/US model.53 FRB/US is a large macroeconomic model developed for forecasting, simulating alternative scenarios,
and evaluating policy options. We used the publicly available version of the model posted in June 2016. This package includes all
of the model equations and coefficients as well as a database that includes historical data starting in 1968Q1 and a projection that
extends through 2100Q4. The first few years of the projection are designed to be roughly consistent with the Summary of Economic
Projections from the June 2016 Federal Open Market Committee Meeting. Beyond that, the projection converges to an illustrative,
but arbitrary steady-state path.54
51 The $7.684 trillion and $4.578 trillion numbers are aggregated Y-9C values for the targeted banks.52 To calculate the GDP effect, we feed a 51-basis-point reduction in spreads into the FRB/US model, which will cause an increase in the estimate of future GDP. The potential “improvement” in GDP is the number we present in Table 1.53 See the model at https://www.federalreserve.gov/econresdata/frbus/us-models-about.htm.54 FRB/US does not have an analytical steady state.
33 FEDERAL RESERVE BANK OF MINNEAPOLIS | THE MINNEAPOLIS PLAN
The FRB/US model does not have a banking sector. However, it does include a wide range of interest rates for both public and
private securities. This allows different interest rates to be used to determine desired levels of investment for different types of du-
rable goods (consumer durables, housing, and several categories of business investment). Given this structure, we assume that the
increase in loan rates resulting from the higher capital standards apply to commercial lending. The relevant interest rate for these
loans is the corporate bond rate. We implement the higher loan rates by increasing the spread between corporate bonds and 10-
year Treasuries. Two other interest rates that affect private sector spending decisions are the mortgage and auto loan rates. For the
simulations we ran, imposing the same increase in spreads on these rates results in transitory effects. In addition, the vast majority
of mortgages are securitized by the government-sponsored enterprises (GSEs), and there is a wide range of banks and credit unions
not covered by our plan that issue auto loans. Consequently, we decided to restrict our attention to increased corporate spreads.
The simulations start in 2050Q1, at which point the model is in its steady state. We assume the standard FRB/US VAR-based
expectations for forward-looking equations and that monetary policy follows an inertial version of the Taylor rule.55 The increased
bond spreads are imposed by choosing add factors on the equation for the corporate bond premium using automated procedures
that are included in the FRB/US package.
We run the simulations for 10 years and consider the percentage deviation of output from its baseline path. As mentioned earlier,
the FRB/US does not have an analytical steady state, and when faced with a permanent shock like the one we are imposing, the
model may or may not settle into a new steady state. We chose to stop our simulations after 10 years because output growth beyond
that point is within a fraction of a basis point from baseline for a 1-percentage-point increase in capital.
Because we consider the effects of a crisis and the costs of higher capital to be permanent, we can compare the two either annu-
ally or in present value. We assume a discount rate of 5 percent as in BCBS (2010b). They report a median permanent decrease in
GDP from a crisis of 7.5 percent. So the present value of the cost of a financial crisis is 158 percent of GDP.
Calculating the Leverage Tax. The leverage tax calculation takes the following form:
Let rE, rD, and rI be the return on equity, debt, and insured deposits. The cost of funds for a regulated bank allowing for a (binding)
capital ratio, γ, and insured deposit share, δ, is:
[E(1+ rE) + D(1+ rD) +I(1+ rI)]/A = [γA(1+rE)+(1-γ-δ)A(1+rD)+δA(1+rI)]/A
= γrE+(1-γ-δ)rD+δrI+1
The cost of funds for an unregulated financial institution, subject to the tax on debt, τ, is:56
1+ rD+τ.
Setting the two terms equal to each other allows us to solve for τ in terms of the returns, the capital ratio, and the deposit share:
τ = γ(rE- rD)-δ(rD- rI).
55 In particular, the monetary policy reaction function is
Rt = 0.85Rt-1+0.15(1.09+πt+0.5(πt – 2) + xt )
where Rt is the federal funds rate, πt is four-quarter core PCE inflation, and xt is the output gap. Using a non-inertial version of the rule yields a negligibly larger output effect. 56 Bianchi (2011) imposes the tax on the principal and interest paid on the debt. All debt is short term in his model. We choose to impose the tax on the principal alone to avoid any bias in favor of shorter-maturity debt that typically carries a lower interest rate.
34 FEDERAL RESERVE BANK OF MINNEAPOLIS | THE MINNEAPOLIS PLAN
ImplementationWe implement the methodology as follows:
Capital Target (γ) = 23.5 or 38%
Return on Equity (rE) = 8.58%
Return on Debt (after-tax) (rD) = 1.78%
Return on Insured Deposits (rI) = 0 or 1%
Insured Deposit Share of Assets (δ) = 21%
• We have established a capital target (γ) of 23.5 percent of risk-weighted assets.
• We assume that the return on equity and debt of nonbanks is the same as for banks. As reported in the previous section, the return
on equity for these firms is 8.58 percent. Their debt has an after-tax yield of 1.78 percent.
• To start, we assume the interest rate on insured deposits to be zero given the current stance of monetary policy.
• The firms subject to our capital charge have insured deposits equal to 21 percent (δ) of assets. Allowing for this reduction in the
cost of funds for regulated banks implies a tax on shadow bank debt of 1.2 percent.57
• Banks incur costs to maintain deposit accounts, such as FDIC assessments, which can be as high as 45 basis points, and other
costs associated with servicing depositors. So it should be safe to assume a value for rI greater than zero. With those and other
costs in mind, we consider rI = 1 percent. In this case, the equivalent tax on debt held by shadow banks would be about 1.4
percent. More generally, given the assumptions we have made about returns, a 1-percentage-point increase in the cost to
regulated banks of insured deposits results in a 0.15-percentage-point increase in the tax on shadow bank debt.
• Applying the equivalent of the systemic risk charge to shadow banks (i.e., setting the tax to approximate a 38 percent capital
requirement) adds roughly 100 basis points to the tax rate. So shadow firms would face a tax of 2.2 percent, assuming a zero
cost of insured deposits, or about 2.3 percent assuming a 1 percent cost of deposits.
57 We assume, for this calculation, that shadow banks fund themselves entirely with debt; thus, the debt of the sector equals the assets of the sector. Relaxing that assumption, that is, allowing for shadow bank equity, would reduce the tax rate required to equalize funding costs.
35 FEDERAL RESERVE BANK OF MINNEAPOLIS | THE MINNEAPOLIS PLAN
The banking and financial system should look substantially different after implementation of our proposal than it would have
looked otherwise. In particular, we envision a future where the financial system is much more stable and financial firms are not
TBTF. While any estimation of the future is inherently uncertain, we would expect the following to occur. In particular:
• The small number of the largest banks that exist today will control a much smaller share of total banking assets in the future.
These banks will have to break themselves up to become no longer systemically important firms as judged by the Treasury
Secretary. At the same time, smaller banks that will have a bigger gap in their capital relative to larger banks should pick up
market share. This will lead to a more-stable and less-concentrated banking sector.
• The largest banks will pose a much lower systemic risk to the economy. Most of these banks will become relatively smaller as
just noted. Moreover, the manner in which they have reorganized will make them less systemically risky. Banks will have to
receive the systemically not important designation to avoid the higher capital of Step 2, which encourages them to break them-
selves up in a manner that reduces systemic risk. Banks that fail to receive the designation of not being systemically important
will have to issue a substantially higher amount of equity, making their failure remote. Again, the banking system will become
more stable.
• Large but not systemically important banks will fund themselves with much higher levels of equity than they do today. This
means that large banks have a lower chance of failure and that their failure poses lower risks of spillovers given that all other
large firms will be exceptionally well-capitalized and thus can better absorb losses.
• Community banks will become more vibrant facing a more appropriate and risk-focused supervisory and regulatory regime.
This regime will not give up on preventing community bank failures, nor will it stop consolidation arising from pure market
forces, but it will reduce unnecessary costs.
• Shadow banks will be less systemically risky than they would be otherwise. The Treasury Secretary will have to review all
designated shadow banks with assets greater than $50 billion to determine if they are systemically important. All of these
shadow banks that are not systemically important will face a new shadow bank tax on borrowings that discourages them from
taking on leverage. Thus, these firms will be less systemically risky than they would be otherwise.
SECTION 5
The Banking and Financial System Post-Proposal Implementation
36 FEDERAL RESERVE BANK OF MINNEAPOLIS | THE MINNEAPOLIS PLAN
SECTION 6
Request for Comments on the Minneapolis Plan to End Too Big to Fail
The Federal Reserve Bank of Minneapolis has engaged throughout 2016 in a public process to determine the best ways to end the problem of too big to fail banks. We solicited feedback throughout the year, held town halls with the public and held four policy sym-
posiums, which brought together experts with a wide range of perspectives on the problem and on potential solutions. The symposiums were streamed live on the web to allow the public to learn alongside the Minneapolis Fed. Video recordings and all presented materials are available on our website at minneapolisfed.org. Input from the public and experts around the world have shaped our effort.
Today, November 16, we released our proposal to end TBTF: the Minneapolis Plan. And as a continuation of our effort to both inform and learn from the public and experts, we continue to seek input. Specifically, the Federal Reserve Bank of Minneapolis seeks comments on its proposal to end TBTF.
Commenters should provide feedback by January 17, 2017, sixty days after the issuance of the proposal. Comments should be submit-ted via www.minneapolisfed.org/MPLSplancomments. Specific comments will not be made public, but the Minneapolis Fed will publish an aggregated summary of the comments when a revised version of the proposal is released.
The Federal Reserve Bank of Minneapolis welcomes feedback on all aspects of the Minneapolis Plan. Commenters can also provide
feedback on the following specific questions:
(1) Benefit and Cost Analysis of Higher Minimum Equity Requirement
The Minneapolis Plan would increase the minimum equity requirement for banks with assets over $250 billion, reflecting an under-
lying analysis of the benefits and costs of higher capital.
(Q1) Are there improvements that the Federal Reserve Bank of Minneapolis could make to its calculation of the benefits of this
aspect of the proposal?
(Q2) Are there improvements that the Federal Reserve Bank of Minneapolis could make to its calculation of the costs of this
aspect of the proposal?
(Q3) Are there improvements that the Federal Reserve Bank of Minneapolis could make to its proposed minimum equity re-
quirement for large banks?
(2) Benefit and Cost Analysis of a “Systemic Risk Capital Charge”
The proposal would create a Systemic Risk Capital Charge for all firms that the Treasury Secretary fails to certify as no longer
systemically important.
(Q4) Are there improvements that the Federal Reserve Bank of Minneapolis could make to its calculation of the benefits of this
aspect of the proposal?
(Q5) Are there improvements that the Federal Reserve Bank of Minneapolis could make to its calculation of the costs of this
aspect of the proposal?
(Q6) Are there improvements that the Federal Reserve Bank of Minneapolis could make to its proposal calling on the Treasury
Secretary to certify that firms are no longer systemically important?
(Q7) Are there alternative frameworks the Federal Reserve Bank of Minneapolis could use in reducing systemic risk of large
financial firms?
37 FEDERAL RESERVE BANK OF MINNEAPOLIS | THE MINNEAPOLIS PLAN
(3) Setting a Shadow Bank TaxThe proposal would levy a tax on shadow banks.
(Q8) Are there improvements that the Federal Reserve Bank of Minneapolis could make to setting a tax on shadow banks within
the framework set forth in the proposal?
(Q9) Are there alternative frameworks the Federal Reserve Bank of Minneapolis could use in setting a tax on shadow banks?
What are they? How would a fee be calculated using these alternative frameworks? Why are they superior to the framework
used in the proposal?
(4) Right Sizing Community Bank Supervision and RegulationThe proposal would create a separate and more appropriate supervisory and regulatory regime for community banks.
(Q10) Are there specific features of such a regime that the current proposal should include but does not?
(Q11) Are there specific features of such a regime that the current proposal includes that it should not?
38 FEDERAL RESERVE BANK OF MINNEAPOLIS | THE MINNEAPOLIS PLAN
APPENDIX
Ending TBTF Initiative Process
Building upon the Federal Reserve Bank of Minneapolis’ expertise in the area of Too Big to Fail (TBTF), President Neel Kash-
kari used his first public speech in February 2016 at the Brookings Institution in Washington, D.C., to launch a year-long
initiative aimed at addressing excessive risk posed by TBTF financial institutions.58 In his announcement, Kashkari committed to
considering a broad range of policy solutions and putting forth a Minneapolis Plan by the end of the year for legislators, policymak-
ers, and the public to consider.
From the outset, Kashkari pledged that the Ending TBTF initiative would be open and accessible to all. The dual goal of this
transparent approach is to explore and analyze substantive solutions through the gathering of economists, policymakers, and other
issue-area experts in a series of policy symposiums, while also educating the public about TBTF issues through open public fo-
rums. In this spirit of open and public discourse, all symposiums and public events within the Ending TBTF initiative have been
live-streamed and archived on the Minneapolis Fed website.59 The public has also been encouraged to interact by engaging through
social media using the hashtag #EndingTBTF or submitting their input and ideas online.60
As the pillars of the initiative, the four policy symposiums were based on rigorous exploration and discourse, starting out with
broad topics in the early sessions and then later revisiting compelling ideas with sharper analysis. Below are summaries of the four
policy symposiums in the Ending TBTF initiative, descriptions of complementary events organized for public beneft, and periodic
updates from Kashkari that shared his real-time thinking and observations of key issues.
APRIL 4, 2016: FIRST ENDING TBTF POLICY SYMPOSIUM
Minneapolis, Minn.
The first symposium focused on two specific transformational proposals for ending TBTF—higher capital requirements and limits
on bank size—and featured a keynote address by a former Federal Reserve governor, who discussed the appropriate role of weigh-
ing both costs and benefits in financial regulation.61
Panel 1: Substantially increasing capital requirementsIn the first panel, Anat Admati62 proposed that banks substantially increase their equity to as much as 30 percent, a level comparable to
nonbanks. More equity means banks can absorb greater losses on their assets before they become insolvent. Here are her main points:
• The failure of systemically important banks generates significant harm to society that banks do not consider when they decide
to grow or take on risks. Higher capital requirements would reduce risk of harm.
• Large banks are very risky institutions—they are opaque and complex, making orderly resolution difficult. Passing a stress test
is no guarantee of even medium-term solvency. Society is better off trying to prevent their failure than trying to make their
failure “safe.”
58 Read the full speech at https://www.minneapolisfed.org/news-and-events/presidents-speeches/lessons-from-the-crisis-ending-too-big-to-fail.59 See the Minneapolis Fed Ending TBTF website at https://www.minneapolisfed.org/publications/special-studies/endingtbtf. 60 Public input and ideas were collected at https://www.minneapolisfed.org/publications/special-studies/endingtbtf/share-your-ideas. 61 See the first symposium’s agenda and materials at https://www.minneapolisfed.org/publications/special-studies/endingtbtf/symposiums/april-4-ending-too-big-to-fail-symposium-summary.62 George G.C. Parker Professor of Finance and Economics at the Graduate School of Business, Stanford University.
39 FEDERAL RESERVE BANK OF MINNEAPOLIS | THE MINNEAPOLIS PLAN
• Even under Dodd-Frank Act regulation, capital ratios continue to be tiny, on the order of 4 percent. Moreover, these capital figures
are misleading because they rely a great deal on complex accounting done by the banks. Leading up to the failure of Lehman Broth-
ers in 2008, banks that later failed had about the same, if not slightly higher, capital ratios than banks that did not fail.
• Moreover, regulatory capital requirements have been shown in many cases to be poorly designed. For example, sovereign
debt held by European banks was considered risk-free (and required no capital be held against it), but turned out to be
quite risky.
• Banks argue that they cannot operate with higher capital requirements, because it would be too costly and would reduce their
ability to provide loans. But compared with nonbank firms, banks have much less capital and are much more likely to make
regular payouts to shareholders. Both have risky, long-term, illiquid assets and can use retained earnings (or new shares) to
grow. But nonbanks typically have at least 30 percent equity funding (and often more) as a share of assets and often go long
periods of time without making payouts to shareholders. Banks, however, rarely have as much as 6 percent of assets funded by
equity and typically make payouts to shareholders unless they fail a stress test.
• Current plans to make banks more able to absorb losses would allow banks to issue debt that converts to equity and count that
debt as a buffer to absorb losses. That debt approach is largely untested, but experience with it so far suggests that it will not
work. Issuing more equity would be more straightforward and effective.
The views of the panel63 ranged from support for higher capital requirements to opposition:
• Supporters highlighted analysis suggesting that the benefits of increasing capital (to up to two times the current requirements)
exceed the costs. They also pointed out the simplicity of higher capital requirements compared with the current system, and
argued that the current approach is too complex and will not work in practice.
• Other panelists noted that it was difficult to determine how much capital banks should hold. They argued that measurement of the implied
government support that firms might get is needed to set capital requirements, tax rates or premiums to encourage banks to curtail risks.
• Still other panelists argued that current approaches will work. They noted that current capital stress tests are precisely about
ensuring that banks do not fail in a bad state of the world. Banks have a lot more capital now than in 2008, and the stress tests
have gotten harder since the first one in 2009. They also argued that the costs of capital were real and that higher capital would
lead to lower economic activity.
Panel 2: Altering the organizational structure of financial institutionsIn the second panel, Simon Johnson64 proposed that the size of banks, as measured by “total exposure” reported to the Federal
Reserve System, be capped at 2 percent of GDP, or about $350 billion. For institutions with exposures above this threshold, he
proposed imposing stringent capital requirements. He defended his 2 percent threshold by noting that:
• Lehman Brothers had assets in excess of $600 billion when it failed in September 2008, and Bear Stearns had assets of nearly
$400 billion when it was saved. In contrast, smaller firms, such as CIT Group (about $120 billion in total exposures) were al-
lowed to fail without causing damage to the broader financial system. If all banks were small enough, they could fail without
the need for bailouts or large costs for society.
• The size cap would impact the following 10 banks, listed here with total exposure in 2014: JP Morgan Chase ($3.7 trillion);
Bank of America ($2.8 trillion); Citigroup ($2.8 trillion); Wells Fargo ($2.2 trillion); Goldman Sachs ($1.5 trillion); Morgan
63 Deborah Lucas, Distinguished Professor of Finance at the Massachusetts Institute of Technology Sloan School of Management; Adam S. Posen, President of the Peterson Institute for International Economics; Til Schuermann, Partner, Finance & Risk and Public Policy Practices at Oliver Wyman, and former Senior Vice President of the Federal Reserve Bank of New York; Philip Swagel, Professor of International Economics at the University of Maryland’s School of Public Policy and Senior Fellow at the Milken Institute.64 Ronald A. Kurtz (1954) Professor of Entrepreneurship, Sloan School of Management, Massachusetts Institute of Technology.
40 FEDERAL RESERVE BANK OF MINNEAPOLIS | THE MINNEAPOLIS PLAN
Stanley ($1.3 trillion); US Bancorp ($539 billion); PNC ($460 billion); Bank of New York Mellon ($418 billion); and HSBC
North America ($417 billion). The framework for resolution of large, complex financial firms is clearer now than in 2008, but
there are still substantial residual risks associated with resolving these firms, especially regarding their global footprints.
• Measured in terms of shareholder equity divided by total exposure, bank capital is still quite low even after the post-crisis
regulatory changes. Firms could still fail in the event of a large adverse shock.
• Some risk-taking by large banks has been limited by the Volcker rule and other provisions of the Dodd-Frank Act, but the
performance of these provisions under stress remains untested.
• These regulations could be implemented under existing legislation.
• Stringent capital requirements for banks above the threshold would lead boards of directors and management to reorganize and
break up their firms.
• Large banks are a relatively recent phenomenon, and there is no evidence that their rapid growth over the past two decades has
enhanced growth of the U.S. economy. However, the size and willingness of large financial institutions to take on bigger risks
did contribute to the severity of the crisis in 2008.
Among the issues raised by the panelists65 and the audience were:
• Large nonfinancial firms, especially multinationals, have banking needs that may be best served by large banks.
• After controlling for risk-taking, analysis suggests significant scale economies in banking, especially for the largest banks.
A 2 percent size limit would forfeit these economies.
• A size cap would mean millions of Americans would need to change their banks. Retail customers seem to prefer big banks.
• Breaking up banks into smaller pieces would be difficult and could have unintended consequences, including loss of access for
less-profitable customers.
• Banks are prohibited from having a single large equity stakeholder who would have the incentive to provide adequate monitor-
ing. Eliminating this distortion is important, but a size cap would not address it.
• Past financial crises, such as the Great Depression, were not related to the size of banks.
• Part of the reason some banks got so big is that they acquired troubled smaller banks, including during the last financial crisis.
Keynote Lunch: The need to consider both costs and benefits while assessing bank regulations and in addressing sources of financial fragilityFormer Federal Reserve Governor Randall Kroszner66 delivered the keynote address over lunch. He discussed the importance of
conducting careful examinations that consider both costs and benefits of various bank regulations, while warning against allowing
“analysis paralysis” to prevent regulators from acting. Key points:
• Good policy regulation involves several steps: diagnosing the problem via theoretical and empirical analysis; considering both
costs and benefits before choosing an action from a set of reasonable alternatives; acting; reviewing the effects after a period of
time, say five years, while continuing to refine the options.
• As part of the review process, questions to ask include: Did we achieve our goals? Have there been any unintended consequences?
Again, data are needed to answer these questions. The Office of Financial Research is working to collect new data with this in mind.
65 Joseph P. Hughes, Professor of Economics at Rutgers University; Aaron Klein, Fellow and Policy Director, Economic Studies, Brookings Institution; Ross Levine, the Willis H. Booth Chair in Banking and Finance at the University of California, Berkeley’s Haas School of Business; Eugene Ludwig, Founder and CEO of Promontory Financial Group.66 Norman R. Bobins Professor of Economics, Booth School of Business, University of Chicago.
41 FEDERAL RESERVE BANK OF MINNEAPOLIS | THE MINNEAPOLIS PLAN
• Financial institutions exhibit three fragilities: leverage, liquidity and interconnectedness.
• Elected officials must provide guidance regarding how safe a financial system we want. There is a trade-off between safety and growth.
• We do not want to rely too much on any one particular form of regulation.
• Use historical and international comparisons to inform comparisons of costs and benefits.
• Kroszner also agreed that debt that converts to equity may not work in practice when a crisis develops.
APRIL 4, 2016: PUBLIC TOWN HALL
Minneapolis, Minn.
Immediately following the first policy symposium, a public Town Hall meeting on ending TBTF was hosted at the Minneapolis
Fed.67 Attendance was open and free to the public.
APRIL 18, 2016: PUBLIC UPDATE TO MINNESOTA CHAMBER OF COMMERCE
Minneapolis, Minn.
Kashkari shared a public update on the Ending TBTF initiative by summarizing key points that he took away from the April 4
symposium.68 He also identified some important questions for further consideration:
• Should we view proposals to address TBTF in isolation, or could we combine them?
• How do the costs and benefits of proposed solutions line up relative to the status quo?
• How much confidence do we have that the solutions will perform as expected in a crisis environment?
• Will markets think the proposal credibly puts creditors at risk of loss?
• Will the solutions merely push risk into unregulated areas of the financial markets?
• Will the solutions promote fairness between the regulatory burdens imposed upon large, medium and small banks?
• How likely are the solutions to remain effective over decades?
MAY 16, 2016: SECOND ENDING TBTF POLICY SYMPOSIUM
Minneapolis, Minn.
The second symposium focused on two additional transformational proposals for ending TBTF—taxing bank debt and the new
framework for resolving troubled institutions. The symposium also featured a keynote on the pros and cons of reinstituting the
Glass-Steagall Act.69
67 View video of the Town Hall hosted at the Minneapolis Fed at https://www.youtube.com/watch?v=oXGUHRW64zQ. 68 See the update to the Minnesota Chamber of Commerce at https://www.minneapolisfed.org/news-and-events/presidents-speeches/update-on-minneapolis-fed-ending-too-big-to-fail-initiative. 69 See the second symposium’s agenda and materials at https://www.minneapolisfed.org/publications/special-studies/endingtbtf/symposiums/may-16-ending-too-big-to-fail-symposium-ii.
42 FEDERAL RESERVE BANK OF MINNEAPOLIS | THE MINNEAPOLIS PLAN
Panel 1: Taxing leverage in the financial systemIn the first panel, John H. Cochrane70 proposed that banks finance themselves with equity and that taxing debt would be an effective
tool to achieve that goal.71 Here are his main points:
• Rather than bank assets, it is bank liabilities, particularly short-term debt, that are fragile and the source of potential runs. By
converting bank liabilities to mostly equity, worries about runs—and the need for current levels of very costly regulation on
bank assets and operations—would go away. This system would also eliminate the need for costly government bailouts.
• Unlike in the 1930s, floating-value accounts can be used for transactions: You can use your smartphone to buy a bottle of water
from a machine by selling shares in an S&P 500 index fund. As a result, liquidity no longer requires fixed-value accounts (like
checking accounts). Shares in 100-percent-equity-financed banks can serve as close substitutes for deposits.
• Current policies both subsidize debt (e.g., by making interest payments tax deductible) and regulate against its use (e.g., by
limiting how much debt banks can have). These policies work at cross purposes. To further discourage banks from issuing the
debt that is the underlying cause of instability, the government should at least stop subsidizing debt if not actually taxing it, with
higher rates for short-term debt than long-term debt. The government would then have less need to use regulations.
• This plan creates substantial benefits in eliminating banking crises and has little costs. Credit supply and economic activity
would not be adversely affected by the institutional change to 100 percent equity financing and the tax on debt. The new bank
equity held by households would be functionally equivalent to current deposits. Households that want a risk free security could
hold U.S. government debt.
Among the issues raised by the panelists72 and the audience were:
• The panelists agreed that leverage in the financial system, most prominently in the form of short-term debt financing of banks,
was a primary driver of government bailouts.
• There was general agreement that the tax code’s subsidy to debt financing—caused by a firm’s ability to deduct interest pay-
ments when calculating taxes—encouraged financial firms to take on leverage. They noted that debt financing is favored in the
tax code relative to equity financing, as firms cannot deduct payments to equity holders (e.g., dividends).
• Taxing leverage offers an advantage over other approaches because it can cover many types of financial firms that take on lever-
age and does not rely on government to require firms to change in very specific ways that may be excessively costly and difficult
to implement effectively.
• Some panelists noted a challenge in instituting a tax on leverage both because calculating how much “leverage” a firm takes on
could be difficult and because a single tax rate might end up taxing some firms too much while taxing other firms not enough.
They also noted that the public may be better off banning certain practices in the private sector or regulating them rather than
taxing them.
• Some panelists recommended taking a more public finance/industrial organization-based approach to financial regulation by
matching the form of regulation to the nature of the externality. Sometimes the optimal level of an externality is zero (e.g., lead
in gasoline). Sometimes it is better to regulate quantities, as in fisheries. Sometimes it doesn’t matter who produces the external-
ity, as with carbon, so the tax/fee should be universal. Sometimes the adverse effects are heterogeneous, so tax rates should be
firm-specific.
70 Senior Fellow at the Hoover Institution, Stanford University.71 See Cochrane’s proposal at https://www.minneapolisfed.org/~/media/files/publications/studies/endingtbtf/may-16-symposium-presentations/cochrane-bank-structure.pdf?la=en.72 Michael Hasenstab, Executive Vice President & Chief Investment Officer at Templeton Global Macro; Michael Keen, Deputy Director of the Fiscal Affairs Depart-ment, International Monetary Fund; Donald Marron, Institute Fellow and Director of Economic Policy Initiatives at the Urban Institute; Thomas Philippon, Professor of Finance at the NYU Stern School of Business.
43 FEDERAL RESERVE BANK OF MINNEAPOLIS | THE MINNEAPOLIS PLAN
• A panelist noted that countries outside the United States had already taken steps to eliminate the favorable treatment of bank
debt financing relative to bank equity financing following the crisis. Initial research suggests that this reform reduces leverage in
a material way. Panelists also noted that structuring the charge on leverage as a fee could allow the government more flexibility
in adjusting the charge as it learned from experience.
• A panelist noted that material changes in the current funding of large banks could lead to the reduction in valuable services pro-
vided by these firms, particularly if implemented over a short time frame. In particular, larger banks provide a range of services
to larger customers that smaller firms cannot; these banks also are key to keeping activity going in financial markets. From this
view point, fewer larger banks could potentially impede economic growth.
• A panelist noted that regulating assets is difficult, in part because there are at least two ways to measure them (generally accepted
accounting principles and international financial reporting standards).
• A member of the audience pointed out that a primary goal of reform should be a system that prevents the premature and inef-
ficient liquidation of valuable assets.
Several participants noted the positive historical relationship between financial development and economic growth and questioned
what effects high capital requirements would have on growth.
Panel 2: Exploring alternatives to the Dodd-Frank Act’s resolution frameworkIn the second panel, John Bovenzi73 provided an assessment of the efforts to reform the resolution process for troubled banks and
its role in ending TBTF.74 While he was optimistic about the progress made so far, he pointed out that there is still work to do. He
emphasized the following:
• There needs to be an improved commitment to ending TBTF. For 25 years after the failure of Continental Illinois, not much had
been done, but since the crisis lots of intellectual firepower has been devoted to it.
• Better legislative resolution regimes are helping. Titles I and II of Dodd-Frank have instigated significant advanced planning for
possible resolution of large banks. Complexity is being catalogued and in some cases reduced. “Not credible” findings for the
living wills of five of the eight systemically important financial institutions show the seriousness of the process.
• Better plans to implement resolution regimes are taking shape. The single point of entry (SPOE) resolution will keep operations
running during a potential resolution process. At the same time, the greater reliance on long-term debt in recent proposals (rather
than short-term debt) will make it easier to recapitalize a bank and avoid a taxpayer bailout.
• Automatic stays in the event of resolution will cut down on fire sales of assets.
• Finally, banks have significantly more capital and liquidity. Individual banks are less likely to fail, and contagion effects have
also been reduced. Stress testing shows that the largest banks would have more capital at the end of a stress event than the entire
banking system had in 2006.
He noted three important challenges going forward:
• The FDIC, the Federal Reserve and the banking industry have to continue to make progress to complete restructuring of the
industry before memories of the crisis fade. Current plans have yet to be implemented.
• The FDIC and the Federal Reserve need to be clearer and more transparent about how the new resolution regime will operate;
in particular, that losses will be imposed on creditors and how the lender-of-last-resort role will be implemented.
• Major structural and organizational changes are needed for large banks and the financial system.
73 Co-chair of the Bipartisan Policy Center’s Failure Resolution Task Force.74 See Bovenzi’s proposal at https://www.minneapolisfed.org/~/media/files/publications/studies/endingtbtf/may-16-symposium-presentations/john-bovenzi.pdf?la=en.
44 FEDERAL RESERVE BANK OF MINNEAPOLIS | THE MINNEAPOLIS PLAN
Among the issues raised by the panelists75 and the audience were:
• Most panelists agreed that resolution reform was generally moving in the right direction.
• Panelists agreed that major structural and organizational change for large banks is a key and observable measure of the success
of the current resolution approach. They generally agreed that forcing structural and organizational change through tools like
resolution planning and higher capital requirements is superior to mandates that banks fall below a certain size threshold.
• Panelists agreed that the pace of reform must pick up.
• One panelist disagreed and did not find the current reform efforts credible. This panelist argued that government would be too
concerned that imposing losses on creditors would exacerbate problems in the financial system to actually follow through on
plans to do so. He was skeptical about the usefulness of resolution planning. He argued that government should focus on making
it less likely that big banks get in trouble in the first place. He also argued that the U.S. economy needs large banks.
• Other panelists noted that even though they favored the general direction of the current resolution reform effort, they had con-
cerns about its implementation along many important dimensions, including the treatment of assets in other countries, the ability
of the government to act in a timely way (a comment made by almost all the panelists) and the potential that creditors will run
institutions when SPOE is actually implemented.
Keynote Lunch: Why I changed my mind on Glass-SteagallLuigi Zingales76 delivered the keynote address over lunch. He discussed how his opinion of Glass-Steagall switched from opposition
to support. Key points:
• At the time of its repeal, there was no strong argument to retain Glass-Steagall, and without a good reason to intervene, policy
should not interfere with markets.
• While the separation of investment and commercial banking embodied in Glass-Steagall was not the best way to avoid excessive
risk-taking in the financial sector, it was a good way.
• Tools such as the Volcker rule that seek to provide similar separation to Glass-Steagall are unlikely to be effective.
• Glass-Steagall was simple, and simple tools have fewer loopholes to take advantage of.
• The equity and options markets developed under Glass-Steagall are more competitive and transparent than the derivatives and
over-the-counter markets that have developed since repeal.
• Glass-Steagall may have provided resiliency to the financial system: The 1987 stock market crash did not affect the banking
sector, and the 1991 savings and loan crisis did not disrupt the equity market.
• The political power of banks grew after repeal. The 2005 consumer bankruptcy reform was supported by a more unified banking
sector which pushed to make it more difficult to dismiss credit card debt. This may have exacerbated the financial crisis because
households may have defaulted on their mortgages in order to continue servicing their credit card debts.
• The more concentrated the banking sector is, the more political power it wields. This may make it harder for new entrants (such
as Fintech startups) to erode that concentration.
75 Ben S. Bernanke, Distinguished Fellow in Residence, Economic Studies, Brookings Institution and former Chairman of the Board of Governors of the Federal Reserve System and the Federal Open Market Committee from February 2006 to January 2014; J. Christopher Flowers, Managing Director and CEO of J.C. Flowers & Co.; Richard J. Herring, Jacob Safra Professor of International Banking and Professor of Finance, Wharton School, University of Pennsylvania; David A. Skeel, S. Samuel Arsht Professor of Corporate Law, University of Pennsylvania Law School. 76 Robert C. McCormack Distinguished Service Professor of Entrepreneurship and Finance and Charles M. Harper Faculty Fellow, University of Chicago Booth School of Business.

45 FEDERAL RESERVE BANK OF MINNEAPOLIS | THE MINNEAPOLIS PLAN
MAY 16, 2016: PUBLIC EVENING DISCUSSION
Minneapolis, Minn.
Following the second policy symposium held at the Minneapolis Fed, an evening discussion was hosted by the Heller-Hurwicz
Economics Institute at the University of Minnesota and moderated by CNBC’s chief Washington correspondent, John Harwood.77
This event was also open and free to the public.
JUNE 20, 2016: THIRD ENDING TBTF POLICY SYMPOSIUM
Co-hosted with the Peterson Institute for International Economics (PIIE), Washington, D.C.
The Ending TBTF initiative continued by gathering experts and policymakers at its third in a series of policy symposiums and the
first with a co-host, PIIE in Washington, D.C.78 The third symposium took a deeper dive into the benefits and costs of higher bank
capital requirements. This gathering also had a session assessing the current status of the Ending TBTF initiative, including a key-
note from Minneapolis Fed President Neel Kashkari.
Panel 1: Frameworks to assess the benefits and costs of higher capital 79
The panelists raised a number of arguments with regard to assessing the benefits and costs of higher capital requirements. Their
range of views also suggested several lessons for any exercise in trying to review the benefits and costs of higher capital. Key points
from that session along both of those lines included but were not limited to the following:
• There are multiple ways of assessing the benefits and costs of higher capital requirements. Some methods rely largely on directly
computing benefits and costs from past crisis data. Other methods analyze data through a conceptual and analytical framework
(e.g., calculations based on the Modigliani-Miller theorem).
• Many methods to assess costs and benefits of higher capital estimate the benefits in terms of financial crises prevented. They
make that calculation based on data from past financial crises. Many methods view the costs of higher capital as the additional
costs that this requirement would impose on banks that face the new capital regime. Higher capital could be modeled as leading
to higher lending costs for borrowers, for example. Some methods of benefit and cost comparison translate these higher costs
for banks into general reductions in economic activity.
• Any assessment of benefits and costs of higher capital regimes is inherently uncertain. That result reflects, in part, the reliance
on data from past crises to conduct the calculations. There have been a number of financial crises, but the information from those
events remains limited in the context of the needs of standard statistical and economic analysis. Uncertainty also exists because
no one fully understands if and how banks would try to pass on the potentially higher costs of capital.
• Assumptions used in the frameworks to assess benefits and costs are very important. Analysts should make those assumptions as clear
as possible both to allow observers to know what those assumptions are and to determine how sensitive results are to the assumptions.
• Two of the panelists put forward estimates of capital requirements that they believe pass a benefit and cost test. One panelist
argued that capital should be between 12 percent and 14 percent. Another found that a capital ratio of between 15 percent and
23 percent would be sufficient to avoid most government bailouts of banks in advanced economies (both estimates concern so-
called risk-weighted asset capital standards).
77 View video of the evening discussion hosted by the Heller-Hurwicz Economics Institute at the University of Minnesota at http://cla.umn.edu/heller-hurwicz/news-events/news/ending-too-big-fail.78 For more information, visit the PIIE website at https://piie.com/events/symposium-ending-too-big-fail. A recorded archive of the event can be found at the site: https://archive.org/details/SymposiumOnEndingTooBigToFail_648.79 The panelists were William R. Cline, PIIE senior fellow; Giovanni Dell’Ariccia, deputy director of the International Monetary Fund’s Research Department; and Douglas Elliott, a partner in finance and risk and public policy practices at Oliver Wyman.
46 FEDERAL RESERVE BANK OF MINNEAPOLIS | THE MINNEAPOLIS PLAN
• Both panelists noted that their estimates were higher than the standard requirements coming out of international agreements on
minimum capital requirements. A third panelist emphasized the costs of these higher requirements more generally.
Panel 2: Status of efforts to end TBTF 79
Minneapolis Fed President Neel Kashkari opened with his remarks on the status of ending TBTF. Bertrand Badre, formerly group chief finan-
cial officer at Société Générale and Crédit Agricole, provided a private sector perspective. PIIE President Adam S. Posen assessed the global
TBTF regime and international regulatory efforts. The presenters offered mostly common themes with the occasional contrasting views.
• There was broad skepticism about some of the key pillars of the current reform effort to address TBTF. In general, the presenters
thought the system was too complex to work during a period of market stress.
• There was specific concern that the current reform effort required governments to impose losses on bond holders of large banks.
Some of the presenters argued that this policy, if implemented, could actually lead to more uncertainty and market stress. Thus,
they did not believe it would actually occur and prevent public bailouts.
• There was also concern that market forces themselves would not be sufficient to end TBTF. Market pressures may lead firms to
take on too much risk, for example. As such, government has to step in to try to fix the problem.
• Some presenters focused on the complexity of large banks as a key source of the problem. The firms are too complex to manage
and too complex to prevent fallout to the economy when they get in trouble.
• Some presenters noted that there is never enough capital to prevent a crisis, while others suggested that higher capital is a critical
way to limit TBTF.
• Presenters suggested that the cost of higher capital, if it takes the form of lower profits for banks, could be overstated. They
noted that precrisis levels of profit may have been unsustainable. As such, a fall from those levels may better reflect the true
returns of banks.
• Presenters agreed that more needed to be done to address TBTF, or at least agreed that the current system was not going to be
successful in that task.
• The presenters received several questions on the merits of reinstating the Glass-Steagall Act. Many of the presenters were skeptical
that such a step would effectively end TBTF. They argued that the evidence from the crisis does not suggest that Glass-Steagall
would have prevented the most important and negative outcomes of the most recent crisis. Many of the firms at the epicenter of the
crisis, for example, did not have the combination of investment and commercial banking that Glass-Steagall prevents.
SEPTEMBER 26, 2016: FOURTH ENDING TBTF POLICY SYMPOSIUM
Minneapolis, Minn.
The fourth and final symposium hosted by the Federal Reserve Bank of Minneapolis was held on September 26, 2016. Progressing
toward the goal of releasing a policy plan to end too big to fail (TBTF) by the end of the year, the symposium explored additional
challenges and solutions to the persistent problem of TBTF.
Two panel discussions were held, the first focusing on whether debt issued by banks—such as “bail in” bonds required under a
current Board of Governors proposal—can effectively recapitalize banks in the resolution process. The second panel discussed the
growth of the shadow banking industry in response to the asymmetrical regulatory framework of banks and nonbanks.
This fourth symposium also featured a keynote speech by Roger W. Ferguson, Jr., who shared views on financial regulation
based on both his current role as president and CEO of TIAA and his prior role as governor and vice chair of the Board of Governors
of the Federal Reserve System.
47 FEDERAL RESERVE BANK OF MINNEAPOLIS | THE MINNEAPOLIS PLAN
Panel 1: Converting debt to equity as a means to address TBTFThe panelists,80 coming from a wide range of backgrounds and perspectives, made key points, which include but are not limited to
the following:
• Bank equity is the best tool to absorb losses because shareholders absorb losses from insolvency.
• Panelists noted the challenge of converting debt to absorb losses from bank failure. In general, panelists noted that supervisors
have not done a good job of forcing banks to get new capital before they suffer deep losses, at which point it is difficult to re-
capitalize the bank without public funds.
• This general problem is present in the so-called total loss-absorbing capacity proposal, which counts on government taking
unpopular action at an ill-defined point. Thus, some panelists thought that TLAC has been vastly oversold as a solution to TBTF.
• An alternative view presented is that the provision of a resolution regime, combined with some debt to convert to equity, does
make it less likely that firm creditors get bailouts and thus does address TBTF.
• The political pressure against acting will be very large if the perception is such that action can lead to more instability.
• The panel discussion also suggested that requiring government to shut down banks when equity is still positive would be a move
to forcing more timely action.
Roger W. Ferguson, Jr., Keynote: Financial regulation from the viewpoint of the regulatedRoger W. Ferguson, Jr.,81 began his remarks by commending the work of the TBTF symposium series for its exploration of resil-
iency in the broader financial system. He went on to note that these discussions usually look at regulations from the view of the
regulator; but from his post-2008 experience after leaving the Federal Reserve System, Ferguson shared his current perspective of
leading TIAA, a regulated insurance institution.
• Ferguson analyzes regulations through a prism of an organization predominantly engaged in insurance. From this viewpoint,
he emphasizes the importance of exercising restraint in imposing bank-centric frameworks upon nonbanks. Rather, regulators
should recognize that insurance-centric firms have a different business model, structure, and role than banks.
• The primary policy goal is to ensure that there is a resilient financial system to stress. Financial resilience should be achieved
by having an ecosystem that is not monolithic, but has many different components that serve to maintain the “diversity of the
financial eco-system.”
o Of course, the system needs to be safe and sound. Additionally, it needs to minimize the creation and propagation of spillovers.
• To achieve the overarching goal of financial resilience, the TBTF problem must be addressed though a nuanced approach that
recognizes the differences in various institutions and does not treat them with a one-size-fits-all approach.
o Ferguson emphasized this as his primary point, noting that an approach that treats all firms in a monolithic fashion could
end up making the system less stable.
• Banks and nonbanks, like insurers, engage in fundamentally different businesses, with different business models, balance sheets,
and customer value propositions. These distinctions drive the rationale for having different regulatory frameworks applied to each.
80 Panelists included Emilios Avgouleas, Professor (Chair) of International Banking Law and Finance at the University of Edinburgh and a member of the stakeholder group of the European Banking Authority; Mark Flannery, Director and Chief Economist at the U.S. Securities and Exchange Commission and BankAmerica Eminent Scholar in Finance at the University of Florida; Stuart Plesser, Senior Director in S&P Global’s North American Financial Institutions Ratings Team; and Larry Wall, Research Center Executive Director of the Center for Financial Innovation and Stability at the Federal Reserve Bank of Atlanta.81 President and Chief Executive Officer of TIAA and former Vice Chairman of the Board of Governors of the Federal Reserve System.
48 FEDERAL RESERVE BANK OF MINNEAPOLIS | THE MINNEAPOLIS PLAN
o At its core, banking activity remains lending and maturity transformation—connecting savers to borrowers. In contrast,
insurers allow customers to reduce their exposure to risk.
Panel Two: The potential for risk to shift to the shadow banking sector in response to banking regulation and the appropriate regulation of shadow banksThe panelists82 discussed how modern firms are responding to asymmetry in regulatory frameworks. The current regulatory frame-
work is effective in an environment where banks and nonbanks (shadow banks) engage in a separate set of activities. Now, with
the lines of activity blurring and shadow banks engaging in a higher volume of activity that was once the domain of the traditional
banking sector, the differentiation between bank and shadow bank activity is less defined. This panel discussed this development
and potential government responses. Key points include, but are not limited to, the following:
• Whereas traditional banking is characterized by highly regulated institutions that receive extensive public support (e.g., deposit
insurance and lender of last resort), shadow banking is characterized by chains of transactions involving multiple intermediaries
that are lightly regulated.
• Heightened regulation leads activity to migrate from regulated banks toward shadow banking or other more lightly regulated
nonbank intermediaries. This potential for migration reduces the ability of regulation to correct underlying market failures and
safeguard financial stability.
• Instead of the current practice where regulation is imposed upon certain types of institutions, several panelists suggested that
financial regulation be activity-based.
• On the liability side, the issuance of debt by shadow firms, particularly short-term debt, presents concern by making these firms
vulnerable.
• On the asset side, the concern focuses on assets that would take losses in a fire sale, which are also the assets that are the hardest
to price and value.
• The flow of activity and potential risk from the banking to the nonbanking sector is a real threat. Intense regulation of banks
makes it more costly to engage in these activities in the banking context. So the activities move to the shadow sector, which does
not impose the same level of intense regulation. This leads to the types of liabilities and assets of concern being more present
and important in a growing shadow sector.
o For example, some panelists mentioned reports of loans moving from banks to the nonbanking sector, funding by debt.
• Panelists discussed options for government response to this threat of activity migration from the banking to nonbanking sector.
o One panelist called for a prohibition on the issuance of short-term debt by any financial firm that is not a bank.
o Another idea included crafting new regulations to address the migration phenomenon.
82 Panelists were Viral V. Acharya, C. V. Starr Professor of Economics at New York University Stern School of Business; Samuel Hanson, Associate Professor of Business Administration at Harvard Business School; and Morgan Ricks, Associate Professor of Law at Vanderbilt Law School.
49 FEDERAL RESERVE BANK OF MINNEAPOLIS | THE MINNEAPOLIS PLAN
Admati, Anat R., Peter M. DeMarzo, Martin F. Hellwig, and Paul Pfleiderer. 2013. Fallacies, Irrelevant Facts, and Myths in the Discussion of Capital Regulation: Why Bank Equity Is Not Socially Expensive.
Adrian, Tobias, and Adam B. Ashcraft. 2012. Shadow Banking: A Review of the Literature. Staff Report 580. Federal Reserve Bank of New York.
Adrian, Tobias, Daniel Covitz, and Nellie Liang. 2014. Financial Stability Monitoring. Staff Report 601. Federal Reserve Bank of New York.
Aiyar, Shekhar, Charles W. Calomiris, and Tomasz Wieladek. 2014. Does Macro-Prudential Regulation Leak? Evidence from a UK Policy Experiment. Journal of Money, Credit, and Banking, Supplement to 46 (1), 181-214.
Barthold, Thomas A. 1994. Issues in the Design of Environmental Excise Taxes. Journal of Economic Perspectives 8 (1), 133-55.
Bergenau, Juliane, and Tim Landvoigt. 2016. Financial Regulation in a Quantitative Model of the Modern Banking System. Working Paper. Harvard Business School.
Bengui, Julien, and Javier Bianchi. 2014. Capital Flow Management when CapitalControls Leak. International Monetary Fund.
Bianchi, Javier. 2011. Overborrowing and Systemic Externalities in the Business Cycle. American Economic Review 101 (7), 3400-26.
Calem, Paul, and Rafael Rob. 1999. The Impact of Capital-Based Regulation on Bank Risk Taking. Journal of Financial Intermediation 8, 317-52.
Cline, William R. 2015. Testing the Modigliani-Miller Theorem of Capital Structure Irrelevance for Banks. Working Paper 15-8. Peterson Institute for International Economics.
Dagher, Jihad, Giovanni Dell’Ariccia, Luc Laeven, Lev Ratnovski, and Hui Tong. 2016. Benefits and Costs of Bank Capital. IMF Staff Discussion Note.
De Mooij, Ruud A., and Michael Keen. 2016. Debt, Taxes, and Banks. Journal of Money, Credit, and Banking 48 (1), 5-33.
Devereux, Michael, Niels Johannsen, and John Vella. 2015. Can Taxes Tame the Banks? Evidence from the European Bank Levies. Research Paper 2015-5. Saïd Business School.
Greenwood, Robin, Samuel Gregory Hanson, and Jeremy C. Stein. 2016. The Federal Reserve’s Balance Sheet as a Financial-Stability Tool. Working Paper.
Johnston Ross, E. B., and Lynn Shibut. 2015. What Drives Loss Given Default? Evidence from Commercial Real Estate Loans at Failed Banks. Working Paper 2015-03. FDIC Center for Financial Research.
Kashyap, Anil, Jeremy C. Stein, and Samuel G. Hanson. 2010. An Analysis of the Impact of ‘Substantially Heightened’ Capital Requirements on Large Financial Institutions. Working paper.
OTHER REFERENCES
50 FEDERAL RESERVE BANK OF MINNEAPOLIS | THE MINNEAPOLIS PLAN
Koijen, Ralph, S. J., and Motohiro Yogo. 2015. The Cost of Financial Frictions for Life Insurers. American Economic Review 105 (1), 445-75.
Koijen, Ralph S. J., and Motohiro Yogo. 2016. Shadow Insurance. Econometrica 84 (3), 1265-87.
Laeven, Luc, and Fabián Valencia. 2012. Systemic Banking Crises Database: An Update. Working Paper. International Monetary Fund.
Mankiw, N. Gregory. 2009. Smart Taxes: An Open Invitation to Join the Pigou Club.” Eastern Economic Journal 35, 14-23.
Panteghini, Paolo, Maria Laura Parisi, and Francesca Pighetti. 2012. Italy’s ACE Tax and Its Effect on a Firm’s Leverage. Discussion Paper 2012-31. Economics E-Journal.
Peek, Joe, and Eric S. Rosengren. 1997. The International Transmission of Financial Shocks: The Case of Japan. American Economic Review 87 (4), 495-505.
Peek, Joe. and Eric S. Rosengren. 2000. Collateral Damage Effects of the Japanese Bank Crisis on Real Activity in the United States. American Economic Review 90 (1), 30-45.
Pozsar, Zoltan, Tobias Adrian, Adam Ashcraft, and Hayley Boesky. 2012. Shadow Banking. Staff Report 458. Federal Reserve Bank of New York.
Reinhart, Carmen M., and Kenneth S. Rogoff. 2008. Banking Crises: An Equal Opportunity Menace. Working Paper 14587. National Bureau of Economic Research.
Ricks, Morgan. 2016. The Money Problem: Rethinking Financial Regulation. University of Chicago Press.
Roe, Mark J., and Michael Tröge. 2016a. Degradation of the Financial System Due to the Structure of Corporate Taxation. Law Working Paper 317/2016. ECGI.
Roe, Mark J., and Michael Tröge. 2016b. Taxing Banks Properly: The Next Regulatory Frontier.
Schepens, Glenn. 2015. Taxes and Bank Capital Structure. Working Paper. National Bank of Belgium.
Schuermann, Til. 2004. What Do We Know about Loss Given Default? Unpublished. Federal Reserve Bank of New York.
Shibut, Lynn, and Ryan Singer. 2014. Loss Given Default for Commercial Loans at Failed Banks. Unpublished, Federal Deposit Insurance Corporation.
Tarullo, Daniel K. 2016. Next Steps in the Evolution of Stress Testing. Speech at the School of Management Leaders Forum. Yale University. Sept. 26.
FEDERAL RESERVE BANK OF MINNEAPOLIS
90 HENNEPIN AVENUE
MINNEAPOLIS, MINNESOTA 55401
www.minneapolisfed.org


![Federal HIT Strategic Plan Public Comment Period 3-24-2011_FINAL[1]](https://img.pdfslide.us/doc/110x75/577d29fe1a28ab4e1ea86b59/federal-hit-strategic-plan-public-comment-period-3-24-2011final1.jpg)

