Embed Size (px)
Citation preview

November 1, 2013
Bart Brashers, ENVIRONJared Heath Bowden, UNC
3SAQS WRF Modeling Recommendations
2
• Week long simulations for beginning of January and July
• Tests included:– ECMWF vs. NAM Initial and Boundary Conditions– USGS vs. NLCD land-use datasets– PX vs. NOAH land-surface model– TOPO option– Reduced vertical levels
Where We Left Off at the Last Meeting

3
Initial Conclusions from Last Meeting
• Our conclusions from model metrics (T,Q,WS,WD)– Keep NAM instead of ECMWF– NLCD with NOAH requires more development– TOPO option created larger negative wind speed bias– Do not reduce number of vertical levels, especially given
the desire to model temperature inversions– PX LSM/ACM2 vs. NOAH/YSU – found that PX crashed for
January; preliminary comparison for July indicated PX was also comparable to our BASE configuration

4
• PX LSM/ACM2 would run with 27 levels, crash consistently with 37 levels– wrfhelp and Jon Pleim consulted– Coding error caused crash instead of graceful stop
• Nudging with MESONET data (part of MADIS) caused some runs to crash (segmentation fault)– Could not find bad observation– Did not improve WRF performance noticeably
• New “snow” data from Polar WRF turned out to be only over ice, not over land– Good for them, but not for us
Where We Went: Several Blind Alleys

5
• Do not use objectively analyzed fields (metoa files created by OBSGRID.EXE) for any domains– NAM already analyzed at 12km (c.f. 36 & 12km
domains)– 4km domain has no analysis nudging, so uses metoa
file only for initial conditions, which should have no effect after spin-up
– Using metoa files produced far to much precipitation in previous ENVIRON work near Four Corners
• Use OBS nudging every hour – Was set to every 3 hours– Retain nudging coef’s used in ENVIRON Four Corners
WRF
Revised “Base Case”

6
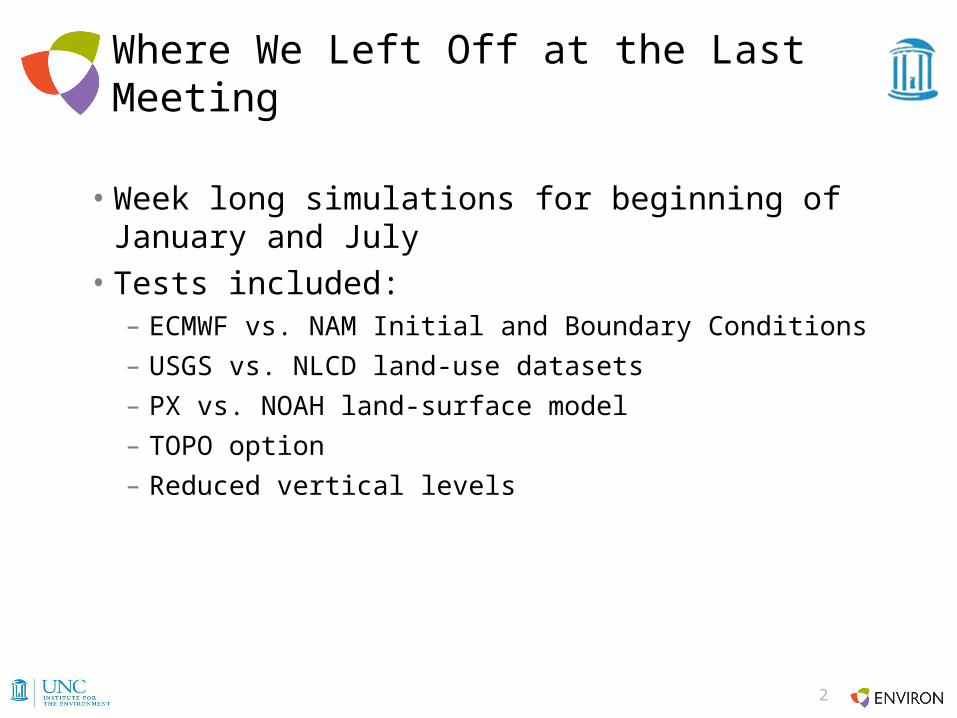
• PRISM is gridded observational data• Sophisticated interpolation techniques• 4km resolution, monthly total precip• PRISM data is interpolated to each WRF nested
grid• WRF output is simply summed
PRISM Precipitation Comparison

7
WRF Base Case vs. PRISM, January 2011
WRF PRISM

8
WRF Base Case vs. PRISM, July 2011
WRF PRISM

9
WRF Base Case vs. PRISM, January 2011
WRF PRISM
10
WRF Base Case vs. PRISM, July 2011
WRF PRISM

11
Preliminary Conclusion
Base Case precipitation performance is acceptable. Let’s look at the rest of the typical performance metrics (METSTAT).
12
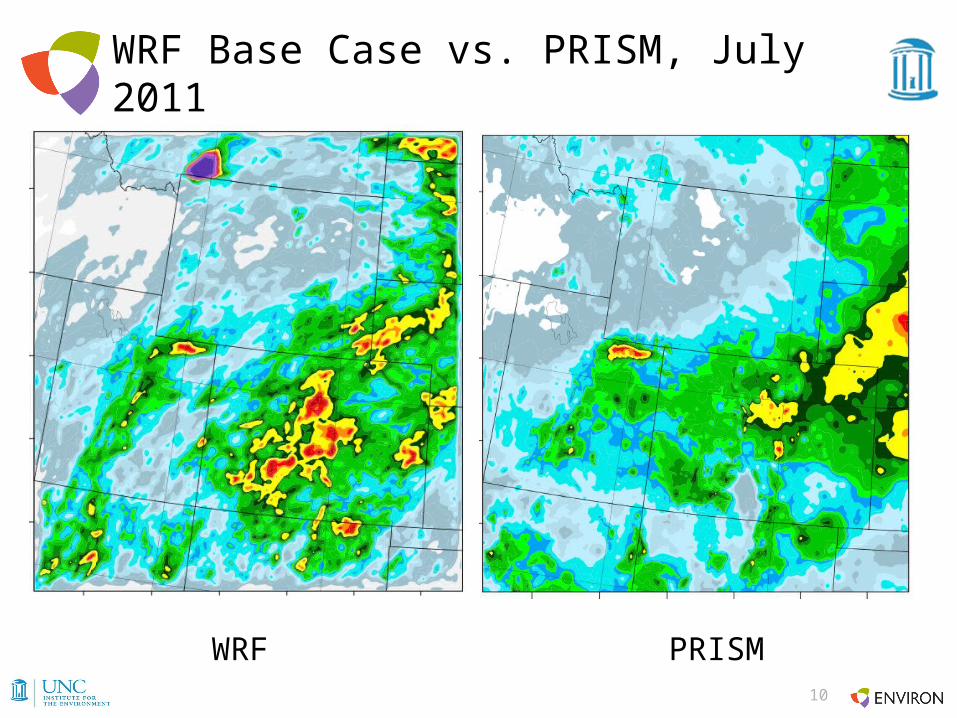
• Plots of model Bias vs. Error for each month
• Performance envelopes from survey of many MM5 and WRF runs
Introduction to Soccerplots
• How many months score a goal? GOOOOAAALLL!
ER
RO
R
BIAS

13
BASE
EPA

14
BASE
EPA

15
BASE
EPA

16
BASE
EPA

17
Preliminary Conclusion
We’re doing about as well as EPA’s WRF modeling, which they use for CMAQ. But can we do better with stronger nudging?

18
• New test case, following Kristi Gebhart/RoMANS II• Analysis (3D) nudging the same as Base case• OBS nudging on 4km domain stronger• Nudge Winds and Temperature, but not Humidity• Winds nudging coefficient = 1.2E-3• Temperature nudging coefficient = 6.0E-4• Radius of influence = 60km• Do not nudge to ACARS, SatWind, or Profiler data
Nudging Case

19

20

21
Preliminary Conclusion
Stronger nudging reduces model error. At least when you verify using the same data you used for nudging...

22
• MADIS data contains many “data streams”– ACARS Aircraft
No thanks– HDW Satellite winds
No thanks– MARITIME Ship reports Not
relevant for 4km– METAR ASOS, AWOS, more. Yes please!– RAOB Radiosondes Not
relevant for SFC– SAO Canadian stations Not
relevant for 4km– MESONET Smaller stationInteresting…
• Could we nudge with METAR & RAOB, and verify against MESONET data?
Verifying Against MESONET Data

23
4 WRF Runs vs. 3 Verification Sets

24
4 WRF Runs vs. 3 Verification Sets

25
4 WRF Runs vs. 3 Verification Sets

26
4 WRF Runs vs. 3 Verification Sets
27
Preliminary Conclusion
Stronger nudging did not change model performance, when using independent verification data (MESONET). Precip?

28
Base Case vs. Nudging Case, July 2011
Base Case Nudging CaseInches

29
New Case: No Temperature Nudging
Base Case No Temp Nudging

30
Preliminary Conclusion
OBS nudging too strongly produces too much precipitation, without changing performance vs. independent data.

31
• Taken from Base Case• 37 Vertical Levels• NOAH LSM• YSU PBL• RRTMG shortwave & longwave radiation• Thompson Moist Physics• KF Cumulus on 36 & 12km
– kfeta_trigger = 2– No shallow Cu (not tied to deep convection)
• Light OBS nudging of Winds, Temp, and Humidity
ENVIRON/UNC WRF Recommendations

Thanks for listening!
Questions? Discussion?
Bart [email protected]
Jared Heath Bowden [email protected]