Embed Size (px)
Citation preview

lable at ScienceDirect
Electrochimica Acta 319 (2019) 922e932
Contents lists avai
Electrochimica Acta
journal homepage: www.elsevier .com/locate/e lectacta
Novel sodium superionic conductor of the Na1þyTi2SiyP3-yO12 series forapplication as solid electrolyte
Adriana M. Nieto-Mu~noz a, *, Jairo F. Ortiz-Mosquera a, Ana C.M. Rodrigues b
a Programa de P�os-graduaç~ao em Ciencia e Engenharia de Materiais, Universidade Federal de S~ao Carlos, CP 676, 13565-905, S~ao Carlos, SP, Brazilb Departamento de Engenharia de Materiais, Universidade Federal de S~ao Carlos, CP 676, 13565-905, S~ao Carlos, SP, Brazil
a r t i c l e i n f o
Article history:Received 16 April 2019Received in revised form30 May 2019Accepted 9 July 2019Available online 10 July 2019
Keywords:Solid electrolyteGlass-ceramicSodium-ion conductorNASICON
* Corresponding author.E-mail address: [email protected] (A
https://doi.org/10.1016/j.electacta.2019.07.0320013-4686/© 2019 Elsevier Ltd. All rights reserved.
a b s t r a c t
In the search for new materials to be used as solid electrolytes, this paper discusses the substitution ofphosphorus with silicon in the NaTi2(PO4)3 NASICON (Na-Super Ionic Conductor) compound, giving riseto the Na1þyTi2SiyP3-yO12 series. In fact, the substitution of Pþ5 for Siþ4 enables the increase in the Naþ
charger carrier concentration. The solid electrolytes are synthetized by the glass-ceramic route, whichconsists in the controlled crystallization of a precursor glass subjected to specific heat treatment.Experimental results indicate that precursor glasses are successfully crystallized in compositions con-taining y� 1.2. X-ray diffraction patterns show the formation of NASICON phase in the Na1þyTi2SiyP3-yO12
glass-ceramics for y� 0.8. However, with further addition of silicon, the major crystalline phase obtainedis the Na(TiO)(PO4) phase. Surprisingly, the electrical characterization reveals that the y¼ 1.0 sample,whose main phase is the non-NASICON Na(TiO)(PO4), exhibits the lowest activation energy (0.31 eV) andthe highest ionic conductivity of 1.0� 10�4 S cm�1 at room temperature and 1.7� 10�2 S cm�1 at 300 �C.Rietveld refinement and electrical conductivity results suggest that the increased ionic conductivity inthe Na(TiO)(PO4) phase is due to the inclusion of some Siþ4 ions in its structure, thus forming a new andhighly Na(TiO)((Si)PO4) conductive phase.
© 2019 Elsevier Ltd. All rights reserved.
1. Introduction
Environmental problems and the depletion of natural resourcesare among the main reasons for increasing interest in the search fornew, alternative, cheap, eco-friendly energy sources [1e3]. Over thepast decade, lithium ion batteries (LIBs) have become the marketleader for energy storage in portable devices due to the highlyattractive combination of lithium-ion properties, such as: a) thevery negative redox potential, and hence, high voltage of lithium-based cells, b) low atomic weight, which allows for devices ofhigh volumetric energy density, and c) small ionic radius, enablingits rapid diffusion into solids, which is a significant advantage in thedevelopment of all solid-state devices. However, the use of lithiumin stationary energy storage devices is unfeasible, given the highextraction costs and the limited accessibility to this element, whosedeposits are frequently located in environmentally protected areas[3e5]. In this context, several studies in recent years have reportedthat alkali metal sodium-based batteries constitute an excellent
.M. Nieto-Mu~noz).
alternative for energy storage. Because sodium is a widely availablechemical element, its production and extraction are inexpensive.Moreover, the toxicity of sodium is low, and its electrochemicalredox potential is similar to that of lithium. These characteristicsmake this element a promising option for the development offuture energy storage devices [5e8].
The two most readily available types of sodium ion batteries onthe market today are ZEBRA and Na/S [9]. However, despite theiruse in electric cars and other devices, they present problems suchas flammability and corrosivity, which, combined with high oper-ating temperatures, cause degradation of the cell components. Oneof the most feasible ways to solve these problems is to optimize thesolid electrolyte properties, thereby lowering the working tem-perature of sodium batteries [3,10e12]. Many solid materials areknown to be sodium conductors. One of the most promising andinteresting solid materials are those belonging to the NASICON (Na-Sodium Super Ionic Conductor) family. The high ionic conductivityexhibited by these materials (between 10�4 and 10�2 S cm�1 atroom temperature [9,13,14]), as well as their ready acceptance ofdifferent ions in their structure, leading to solid solutions withenhanced ionic conductivity, has generated great interest in their
A.M. Nieto-Mu~noz et al. / Electrochimica Acta 319 (2019) 922e932 923
use as solid electrolytes in sodium-ion batteries. The molecularformula of these materials is AxM2(XO4)3, where A is usually amonovalent cation (Naþ, Liþ, Kþ), M is a tetravalent cation such usTiþ4, Geþ4, or Snþ4, and X may be Pþ5 or Siþ4 [9,15e17]. The NASI-CON structure can be described as an arrangement of MO6 octa-hedra linked by corners to XO4 tetrahedra that produce a three-dimensional M2(XO4)3 arrangement with channels through whichA ions can move very easily, leading to very high ionic conductiv-ities in the case of some specific compositions with low activationenergy [6,18,19]. The wide range of compositional variations of theNASICON family allows for partial or total replacement of the A, Mor Siþ4/Pþ5 ions, making them interesting materials for in-vestigations about the influence of different elements in their ionicconductivity [9,20].
The various NASICON materials described in the literatureinclude the NaTi2(PO4)3 (NTP) compound and related solid solu-tions. Few descriptions are available of the substitution of P5þ withSi4þ in this system. In fact, Tsuji et al. [21] synthesized materials ofthis system by solid state reaction, substituting phosphorus ionswith silicon ions to form the Na1þyTi2SiyP3-yO12 (NTSP) series. Theauthors made substitutions of y¼ 0.0, 1.0 and 1.5. However, theyonly succeeded in obtaining a single phase NASICON type com-pound in the sample without silicon (NTP). In addition, these au-thors reported that X-ray diffraction (XRD) patterns of their NTSPmaterials with y¼ 1.0 and 1.5 revealed, together with the NASICONcrystalline phase, the presence of TiO2 and SiO2. Kishioka et al. [22],in turn, synthesized glass-ceramics from parent glasses with3Na2O$67TiO2$30P2O5 and 3Na2O$72TiO2$25P2O5 compositionsand a content of 5mol % of SiO2. The precursor glasses were crys-tallized in a single-step heat treatment of 30 h at temperaturesvarying from 800 to 1000 �C. XRD patterns revealed the formationof the NASICON phase in both compositions after the heat treat-ments. Kishioka et al. also suggested the formation of a solid so-lution with the inclusion of silicon ion (Siþ4) in the NTP system.These authors also found peaks of secondary phases such as TiO2,TiP2O7, and (TiO)2P2O7. Tsuji et al. and Kishioka et al. obtained theNASICON phase but provided no data on the ionic conductivity ofthese interesting materials.
In our search for possible candidates for solid electrolytes thatare conductive by sodium ions, we synthesized and optimized theNaTi2(PO4)3 (NTP) NASICON system via the glass-ceramic route.Many authors have shown that one of the advantages of the glass-ceramic route over classical methods of ceramic processing is that itreduces the final porosity and allows for microstructural control bysuitable thermal treatments, which can contribute for improvingthe ionic conductivity of the material [14,20,23]. On the other hand,it is known that the inclusion of aliovalent ions of lower valencesthan those ions who forms the NASICON skeleton structure, i. e, inour case, P5þ and Ti4þ ions, can enhance its conductivity, becausethe introduction of those ions generates an excess of negativecharge that must be compensated by increasing the number ofsodium ions, which means an increase in the concentration ofcharge carriers, and thus, in the ionic conductivity. In this context,to improve the ionic conductivity of the NTP material, silica wasadded to substitute Pþ5 ions with Siþ4 ions, thus forming theNa1þyTi2SiyP3-yO12 (NTSP) series. In this work, precursor glasses ofNa1þyTi2SiyP3-yO12 (0.0� y� 3.0) compositionwere obtained in thecompositional range of y¼ 0.0 to 3.0 and characterized by thermalanalysis. Glass-ceramics were obtained by single thermal treatmentat their respective crystallization temperature. XRD and Rietveldrefinement revealed that the NASICON phase was obtained asmajor phase in the glass-ceramics up to the y¼ 0.8 composition.However, the Na(TiO)(PO4) crystalline compound was observed asmajor phase in compositions with higher silicon contents, y¼ 1.0and 1.2. Impedance spectroscopy results indicate that the ionic
conductivity of the samples containing NASICON phase increasedby up to four orders of magnitude in response to the addition ofsilicon when compared with the original silicon-free NTP system.Surprisingly, in this work, the highest ionic conductivity was ach-ieved by the NTSP10 (y¼ 1.0) sample, in which the non-NASICONNa(TiO)(PO4) crystalline compound was the major crystallinephase. Lastly, the glass-ceramics microstructures revealed byscanning electron microscopy (SEM) are also discussed in light oftheir different silicon contents.
2. Experimental methods
2.1. Synthesis of precursor glasses
The parent glasses of NTSP glass-ceramics were obtained inbatches of 20 g by the conventional melt quenching method. Thismethod consists of melting the precursor raw materials and thencooling the resulting liquid. To increase the cooling rate, the liquidwas splat-cooled, i.e., pressed between two metal plates, resultingin a vitreous material. Stoichiometric amounts of sodium carbonate(Na2CO3, Vetec 99.9%), titanium dioxide (TiO2, Aldrich> 99.9%),dihydroxy ammonium phosphate ((NH4)2HPO4, Aldrich> 98%) andsilica dioxide (SiO2, Zetasil2> 99%) were used as starting materials.The powders were homogenized in a rotary ball mill with aluminaballs for 12 h, after which they were placed in a platinum crucibleand heated for 6 h to temperatures ranging from 400 to 700 �C toremove volatile compounds (CO2, NH3, H2O) from the Na2CO3 and(NH4)2HPO4 raw materials. The mixture was then heated to tem-peratures of 1400e1500 �C for 30min. The different precursorglasses were annealed at a temperature below their glass transitiontemperature (Tg) (thermal characterization given below), i.e., Tg -40 �C, for 2 h to relieve possible thermal stresses.
2.2. Glass characterization, crystallization of precursor glasses, andglass-ceramics characterization
The characteristic temperatures of precursor glasses, such asglass transition temperature (Tg) and crystallization temperature(Tx), were determined by differential scanning calorimetry (DSC)using platinum crucibles in an air atmosphere and applying aheating rate of 10 �C/min in a temperature range of 30e1000 �C.
To obtain NTSP glass-ceramics, small pieces of each precursorglass were subjected to single-step heat treatments carried out atthe onset of the DSC crystallization peak (Table 1) for 30min. In asingle-step heat treatment, the nuclei generated during the glasssynthesis, or more precisely, during the cooling of the liquid glass,grow to the size of crystals. These heat treatments were performedin a tubular electric furnace with temperature control and stabilityof ±1 �C.
The amorphous nature of the glass samples and the crystallinephases of the NTSP glass-ceramics were respectively confirmed anddetermined by XRD, using a Rigaku Ultima IV X-ray diffractometerwith Cu Ka radiation, operating in the 2q range of 10�e80� with anintegration time of 0.6 s and a scan step size of 0.02�. In some cases,the XRD procedure was performed with a 0.02� step size and 0.1 sintegration time to allow for refinement of the crystal structures.The crystalline phases were identified using the CrystallographicaSearch-Match software [24], and the Rietveld analysis was per-formed using Topas-Academic version 6 [25] with crystallographicinformation framework (CIF) files from the Inorganic CrystalStructure Database (ICSD) [26].
For the electrical conductivity measurements, the glass-ceramicsamples were sanded to ensure flat parallel surfaces. Gold elec-trodes were then sputtered on both surfaces. Electrical measure-ments were taken by impedance spectroscopy at temperatures of

A.M. Nieto-Mu~noz et al. / Electrochimica Acta 319 (2019) 922e932924
50e300 �C, in the frequency range of 1MHz to 0.01 Hz, using aNovocontrol Alpha Analyzer e a high-performance frequencyanalyzer, coupled to a Novotherm furnace whose temperature isadjustable with a precision of ±0.1 �C. The WinFit software wasused for data acquisition.
The glass-ceramic microstructures were examined on the frac-ture surfaces of sample using a scanning electronmicroscope (SEM)equipped with an EDS (energy dispersive spectroscopy) detectorwith a beam voltage of 10e25 kV.
Fig. 1. (a) DSC thermograms of NTSP (Na1þyTi2SiyP3-yO12) precursor glasses obtained ata heating rate of 10 �C.min�1 and (b) evolution of glass transition temperature (Tg) andcrystallization temperature (Tx) as a function of silicon content (y). The lines in thefigure are drawn to guide the eyes. Error bars are smaller than the data symbols. (Forinterpretation of the references to colour in this figure legend, the reader is referred tothe Web version of this article.)
3. Results and discussion
3.1. Differential scanning calorimetry
Table 1 summarizes the nominal composition and the charac-teristic temperatures (Tg and Tx) of the NTSP parent glasses, whileFig. 1-a shows the DSC thermograms of some of the precursorglasses. Thermograms in Fig. 1-a show the presence of an endo-thermic event, corresponding to the glass transition temperature,followed by an exothermic peak which corresponds to the glasscrystallization. The crystallization temperature (Tx) was taken asthe onset of the crystallization peak. It is worth noting that theintensity of the crystallization peak decreases with increasing y,becomes very low for sample with y¼ 2.5 (NTSP25), while in they¼ 3.0 (NTSP30) sample, this peak is barely visible.
The thermograms in Fig. 1-a also show a small peak in theendothermic direction after the crystallization peak. All the parentglasses of the NTSP system showed this small peak around 850 �C,which cannot be ascribed to the final melting temperature thatvaried around 1400e1500 �C, according to our experimentalmelting conditions. During our heat-treatments experiments, itwas found that vitreous samples heated close to 850 �C werebonded to the crucible. This may be attributed to the onset ofmelting of the crystalline phase. In fact, similar endothermic peakswere observed in thermograms of both Li2O$SiO2 e CaO$SiO2 [27]and Na2O$2CaO$3SiO2 glasses [28]. The authors explained that thebeginning of this endothermic peak corresponds to the solidustemperature of the phase diagram, in which the first liquid of themelting appears.
A silica-free NTP glass could not be obtained, probably becauseof the high percentage of titanium oxide (TiO2), which is not aglass-former (see Table 1). Therefore, the characteristic glass tran-sition (Tg) and crystallization (Tx) temperatures could not bedetermined, since the melted material devitrified during its coolingprocess. However, conductivity measurements and structuralcharacterization of the crystallized NTP samples were taken to
Table 1Nominal composition (mol %) and characteristic temperatures of Na1þyTi2SiyP3-yO3 (NTSP)measured at the onset of the crystallization peak.
Sample name y Na2O TiO2
(mol %)
NTP (without Si) 0.0 12.5 50.0NTSP04 0.4 15.9 45.5NTSP06 0.6 17.4 43.5NTSP08 0.8 18.8 41.7NTSP10 1.0 20.0 40.0NTSP12 1.2 21.2 38.5NTSP14 1.4 22.2 37.0NTSP16 1.6 23.2 35.7NTSP18 1.8 24.1 34.5NTSP20 2.0 25.0 33.3NTSP25 2.5 26.9 30.8NTSP30 3.0 28.6 28.6
a Did not form glass: devitrified during cooling.
underpin the discussion about the effects of adding silicon to NTSPglass-ceramics.
Fig. 1-b shows the influence of silica content on the character-istic temperatures of NTSP glasses. As can be seen, the glass tran-sition temperature (Tg) decreased as Pþ5 were partially replaced bySiþ4 cations. It should be noted that the addition of silicon, in turn,was accompanied by the inclusion of sodium ions in the NTSPsystem (see Table 1). In this regard, the decrease in Tg values may be
precursor glasses. Tg¼ glass transition temperature, Tx¼ crystallization temperature
SiO2 P2O5 Tg (�C) (±2 �C) Tx (�C) (±2 �C)
e 37.5 –a –a
9.1 29.5 694 72913.0 26.1 681 72716.7 22.9 677 72920.0 20.0 635 75823.1 17.3 605 73325.9 14.8 579 66028.6 12.5 557 64431.0 10.3 552 65433.3 8.3 559 70038.5 3.8 556 e
42.9 e 542 e

A.M. Nieto-Mu~noz et al. / Electrochimica Acta 319 (2019) 922e932 925
attributed to an increase in the number of non-bridging oxygenatoms in the glass structure resulting from the introduction of theNa2O modifier.
No noticeable change in crystallization temperature (Tx) wasvisible in the first three compositions. However, the Tx of theNTSP08 sample increased, followed by a constant decrease up toy¼ 1.6, which showed a minimum value of Tx. The behavior of Txaround y¼ 1.0 will be explained by the emergence of differentcrystalline phases in these glass-ceramics, as will be discussed insection 3.2.
3.2. X-ray diffraction (XRD)
Fig. 2 shows the XRD patterns of the glass samples of compo-sitions y¼ 0.6 (NTSP06), y¼ 1.2 (NTSP12) and y¼ 3.0 (NTSP30)obtained after the melting process. Results similar to those depic-ted in Fig. 2 were obtained for all the other parent glasses. Theformation of a characteristic amorphous halo is evidenced in therange of 15� < 2q< 40�, which shifts to higher angles in response toincreased silicon content. Note the absence of diffraction peaks thatwould indicate the formation of crystalline phases. This confirmsthat all the NTSP compositions under investigation were success-fully vitrified.
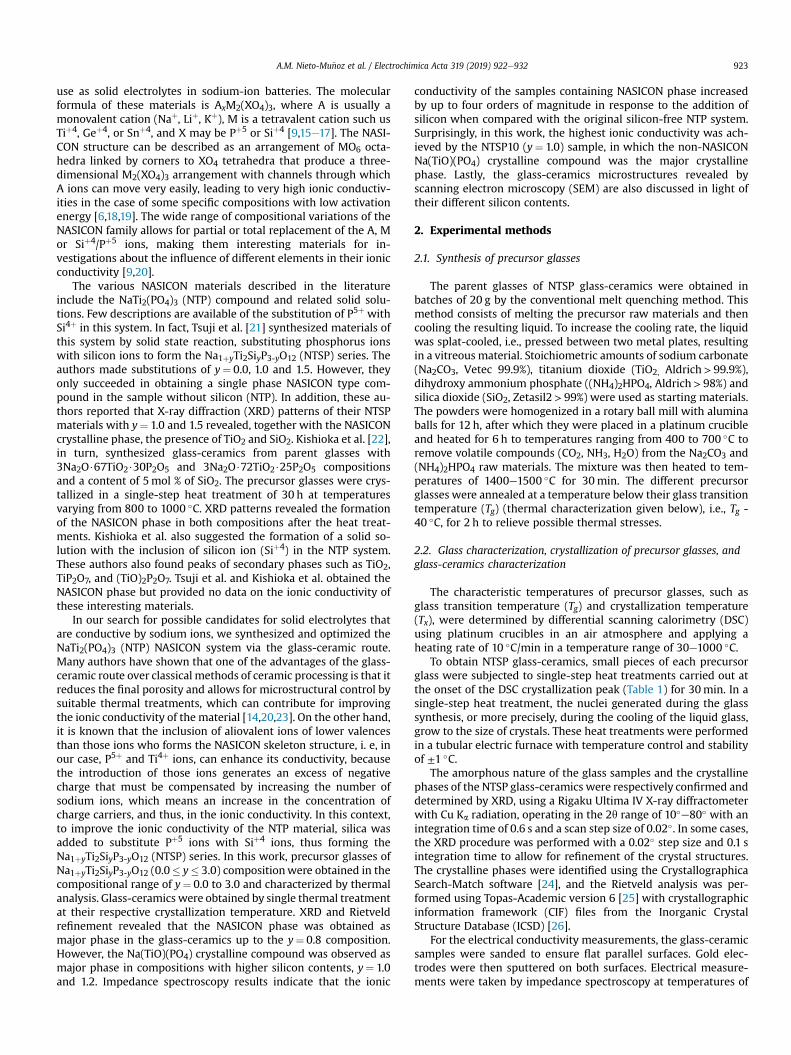
Fig. 3-a shows the XRD patterns of glass-ceramics obtained bythe crystallization of precursor glasses heat treated at theirrespective Tx (see Table 1) for 30min. These patterns indicate thatthe heat treatments applied to the glass compositions containingy� 0.8 led to the formation of the NASICON crystalline phase (ICSD1530649) as the major phase. However, the pattern of the NTSP06sample also reveal some traces of crystalline phases such asNa4(TiO)(PO4)2 (ICSD 74566) and TiO2 (ICSD 9009086) which areindicative of a limit of the NASICON solid solution. This also sug-gests that the precursor glasses of composition y� 0.6 are non-stoichiometric, i.e., there are no crystals with identical composi-tion to that of the parent glass. The NTSP08 sample shows peaks ofthe same crystalline phases as the NTSP06 sample, plus a smallamount of Na(TiO)(PO4) (ICSD 1535856) phase. An amorphous haloaround 2q¼ 25� in compositions containing y> 1.4 is present,indicating that a residual glassy phase still remains. This suggeststhat the heat treatments applied to those compositions did notcrystallize the material completely. On the other hand, the absenceof crystallization peak in DSC thermograms (Fig. 1-a) of parent
Fig. 2. XRD patterns for NTSP06 (y¼ 0.6), NTSP12 (y¼ 1.2) and NTSP30 (y¼ 3.0)precursor glasses of the Na1þyTi2SiyP3-yO12 system.
glasses with higher silicon content (y¼ 2.5 and 3.0) indicate thatthose glasses cannot crystallize under heat treatment conditions.
Since the content of Na(TiO)(PO4) phase gains greater impor-tance as the silica content (y) increases, with significant effects onthe total ionic conductivity, as discussed later in the 3.4 section, itwas necessary to quantify the main phases in the NTSP compoundsby the Rietveld refinement method. The results of percentages ofcrystalline phases are depicted in Fig. 4-a.
From Fig. 4-a, it is evident that the amount of NASICON phase inthe NTSP system decreases with the addition of silicon, dropping to5.5% and 2.4% in the y¼ 1.0 and 1.2 samples, respectively. Thus, theNa(TiO)(PO4) (NTPO) compound becomes the major crystallinephase in the NTSP10 and NTSP12 compositions. The developmentof this new phase can be corroborated by the sudden rise in crys-tallization temperature, as illustrated in Fig. 1-b for compositiony¼ 1.0, since a different Tx would be required for the formation ofthis non-NASICON phase.
The NTPO compound belongs to the titanyl phosphate family:M(TiO)(PO4), where M¼ K, Na, Rb, Tl, Ag or NH4 [29]. The crystal-line structure of these materials is very similar to the NASICONstructure, since it is also composed of TiO6 octahedra and PO4
tetrahedra that share corners. However, one of the differences withthe NASICON structure is the asymmetry exhibited by TiO6 octa-hedra in the M(TiO)(PO4) family. As Tordjman et al. [30] demon-strated, the distances between titanium and oxygen differ withinthe TiO6 octahedron, i.e., some are shorter than others, causing adistortion in the direction of the c axis of the unit cell. According tosome authors, the nonlinear optical properties and one-dimensional ionic conductivity exhibited by these materials arepartly due to this distortion [31,32].
For further discussion about the glass-ceramic microstructure(section 3.3), it should be noted that the diffractograms of NTSPglass-ceramics (Fig. 3-a) show no peaks associated with crystallineSiO2, or with any compound containing silica. The only exception isthe NTSP10 composition, since the Rietveld analysis (Fig. 3-b)showed a very small peak attributed to SiO2.
Fig. 4-b shows the evolution of the lattice parameters in theNASICON structure as the amount of silicon in the precursor ma-terial increases. In view of the evident increase in both parametersa and c (Table 2), the data obtained confirm the inclusion of siliconin place of phosphorus in the NASICON crystalline structure up toy¼ 0.8. This increase in the lattice parameters, which in turn causesthe cell expansion of the NASICON structure, can be explained bythe larger size of the Siþ4 ions (0.26 Å) compared to the ionic radiusof Pþ5 phosphorus (0.17Å) [33]. These results are in good agree-ment with those of similar studies in which phosphorus wasreplaced by silicon in some NASICON materials of different chem-ical compositions. In fact, Shimadzu et al. [34], who synthesizedNASICON ceramics with the molecular formula Na1þxZr2SixP3-xO12by solid-state reaction, reported that the inclusion of silicon in-creases the lattice parameters and the unit cell volume due to theformation of larger [SiO4]�4 tetrahedra as compared to [PO4]�3
tetrahedra. Yadav et al. [35] also reported an increase in the unit cellvolume as a consequence of Si4þ/P5þ substitution, for samples ofthe same composition as those studied by Shimadzu et al. butproduced by the sol-gel method.
The shrinkage of unit cells in glass-ceramics samples withcompositions of y� 1.0 (Fig. 4-b) is attributed to the formation ofNa(TiO)(PO4) crystalline phase. In this context, the added siliconions appear to preferentially substitute phosphorus ions in theNTPO structure but not in the NASICON structure. The results of theRietveld analysis (not shown in this paper) indicate that theNASICON phase was absent from compositions with y> 1.4.
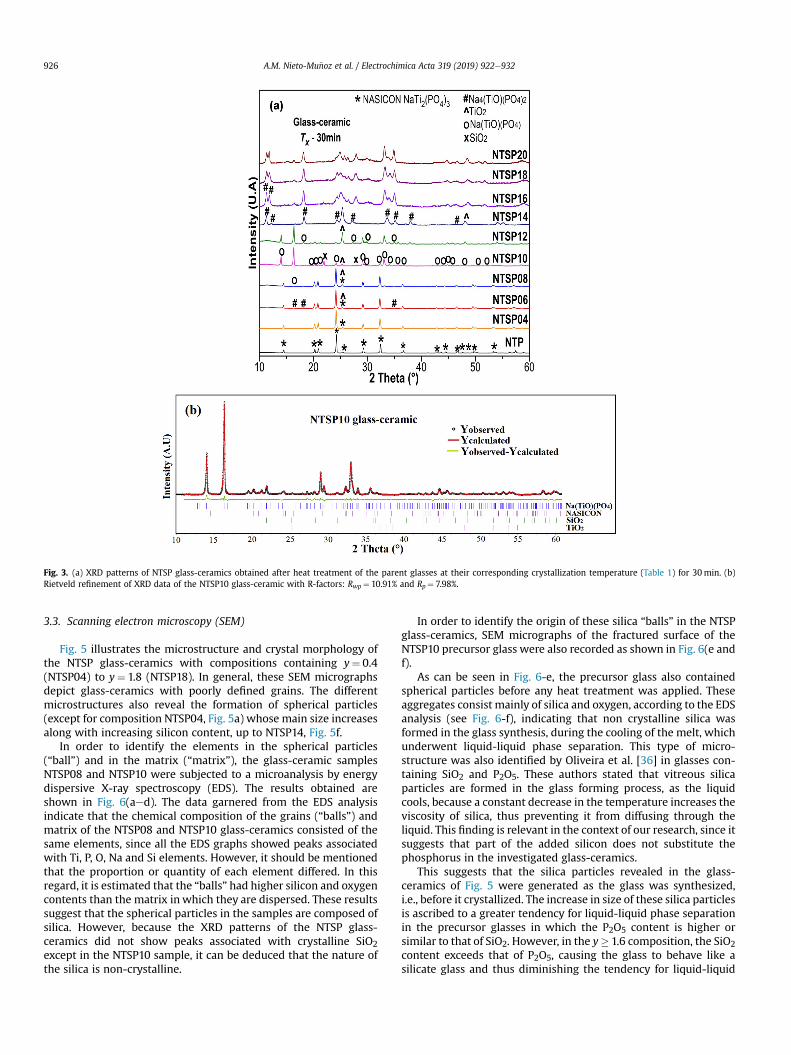
Fig. 3. (a) XRD patterns of NTSP glass-ceramics obtained after heat treatment of the parent glasses at their corresponding crystallization temperature (Table 1) for 30min. (b)Rietveld refinement of XRD data of the NTSP10 glass-ceramic with R-factors: Rwp¼ 10.91% and Rp¼ 7.98%.
A.M. Nieto-Mu~noz et al. / Electrochimica Acta 319 (2019) 922e932926
3.3. Scanning electron microscopy (SEM)
Fig. 5 illustrates the microstructure and crystal morphology ofthe NTSP glass-ceramics with compositions containing y¼ 0.4(NTSP04) to y¼ 1.8 (NTSP18). In general, these SEM micrographsdepict glass-ceramics with poorly defined grains. The differentmicrostructures also reveal the formation of spherical particles(except for composition NTSP04, Fig. 5a) whose main size increasesalong with increasing silicon content, up to NTSP14, Fig. 5f.
In order to identify the elements in the spherical particles(“ball”) and in the matrix (“matrix”), the glass-ceramic samplesNTSP08 and NTSP10 were subjected to a microanalysis by energydispersive X-ray spectroscopy (EDS). The results obtained areshown in Fig. 6(aed). The data garnered from the EDS analysisindicate that the chemical composition of the grains (“balls”) andmatrix of the NTSP08 and NTSP10 glass-ceramics consisted of thesame elements, since all the EDS graphs showed peaks associatedwith Ti, P, O, Na and Si elements. However, it should be mentionedthat the proportion or quantity of each element differed. In thisregard, it is estimated that the “balls” had higher silicon and oxygencontents than the matrix in which they are dispersed. These resultssuggest that the spherical particles in the samples are composed ofsilica. However, because the XRD patterns of the NTSP glass-ceramics did not show peaks associated with crystalline SiO2except in the NTSP10 sample, it can be deduced that the nature ofthe silica is non-crystalline.
In order to identify the origin of these silica “balls” in the NTSPglass-ceramics, SEM micrographs of the fractured surface of theNTSP10 precursor glass were also recorded as shown in Fig. 6(e andf).
As can be seen in Fig. 6-e, the precursor glass also containedspherical particles before any heat treatment was applied. Theseaggregates consist mainly of silica and oxygen, according to the EDSanalysis (see Fig. 6-f), indicating that non crystalline silica wasformed in the glass synthesis, during the cooling of the melt, whichunderwent liquid-liquid phase separation. This type of micro-structure was also identified by Oliveira et al. [36] in glasses con-taining SiO2 and P2O5. These authors stated that vitreous silicaparticles are formed in the glass forming process, as the liquidcools, because a constant decrease in the temperature increases theviscosity of silica, thus preventing it from diffusing through theliquid. This finding is relevant in the context of our research, since itsuggests that part of the added silicon does not substitute thephosphorus in the investigated glass-ceramics.
This suggests that the silica particles revealed in the glass-ceramics of Fig. 5 were generated as the glass was synthesized,i.e., before it crystallized. The increase in size of these silica particlesis ascribed to a greater tendency for liquid-liquid phase separationin the precursor glasses in which the P2O5 content is higher orsimilar to that of SiO2. However, in the y� 1.6 composition, the SiO2content exceeds that of P2O5, causing the glass to behave like asilicate glass and thus diminishing the tendency for liquid-liquid

Fig. 4. (a) Quantity (weight percent, %) of crystalline phases, and (b) evolution of thelattice parameters of the Na1þ yTi2SiyP3-yO12 NASICON structure as a function of siliconcontent (y). The line between symbols is a guide for the eye. Uncertainty values aresmaller than the symbol size. (For interpretation of the references to colour in thisfigure legend, the reader is referred to the Web version of this article.)
Table 2Lattice parameters of the NASICON structure and R-factors (Rwp and Rp) from Riet-veld analysis of NTSP glass-ceramics obtained by heat treatment at corresponding Tx(see Table 1) for 30min.
Sample a (Å) c (Å) V (Å3) Rwp (%) Rp (%)
NTP (without Si) 8.49 21.80 1360 21.20 15.76NTSP04 8.51 21.87 1372 14.30 10.12NTSP06 8.52 21.86 1374 9.08 6.34NTSP08 8.53 21.88 1380 10.64 7.92NTSP10 8.49 21.81 1362 10.91 7.97NTSP12 8.50 21.78 1362 10.31 8.06
A.M. Nieto-Mu~noz et al. / Electrochimica Acta 319 (2019) 922e932 927
phase separation.
3.4. Complex impedance spectroscopy and ionic conductivity
Fig. 7-a shows complex impedance plots, i.e., the so-calledNyquist diagram, of different NTSP glass-ceramics recorded at50 �C. Only results of compositions y¼ 0.4 (NTSP04) to 1.2 (NTSP12)are presented since the heat treatments performed on the samples
with higher silica content (y> 1.4) did not lead to their completecrystallization, as indicated by the XRD patterns in Fig. 3-a. For thisreason, these samples were not subjected to electricalcharacterization.
The Nyquist diagram of NTSP glass-ceramics (Fig. 7-a) showstwo different responses. The first is a semicircle formed in the re-gion of high and medium frequencies, which is associated with theintrinsic material response. The second phenomenon is the slopedline in the low-frequency region, which represents the blocking ofions at the electrode-sample interface. This straight line is charac-teristic of ionic conductive materials. As can be seen in the compleximpedance plots, the grain and grain boundary response could notbe identified because of the presence of a single semicircle. On theother hand, the total resistivity of the samples can be read at theintersection of the semicircle with the real axis in the low-frequency region. Also, increasing the amount of silicon in theNTSP system causes a decrease in the total resistivity of composi-tions up to y¼ 1.0 (NTSP10). However, the (NTSP12) compositionclearly showed an increase in the resistivity value. All the Nyquistplots recorded in the 50e300 �C temperature range showed asimilar format. The real (Z0) and imaginary (Z00) parts of impedancewere divided by the geometric factor (L/A, L being the samplethickness, and A the area in contact with the gold electrodes). Thus,sample resistivity ðrTOTALÞ is read at the low frequency intersectionof the semi-circle to the x axis. The total ionic conductivities(ðsTOTALÞ of the NTSP glass-ceramics were thus calculated byapplying sTOTAL ¼ 1=rTOTAL. The total ionic conductivities were thenplotted (Fig. 7-b) according to an Arrhenius equation:
sTOTAL ¼ soexpð� Ea=kBTÞ (1)
where Ea is the activation energy for ionic conduction, sois the pre-exponential factor, and T and kB are the absolute temperature andBoltzmann constant, respectively.
The activation energy (Ea), the logarithm of the pre-exponentialfactor (log s0), and the total conductivity at 300 �C, (s300�C) weredetermined from the linear regression of data in Fig. 7-b and shownin Table 3.
As can be seen in Fig. 7-c, the inclusion of silicon leads to aconsiderable decrease in the activation energy when compared tothat of the glass-ceramic produced without silicon (y¼ 0.0 or NTP).In addition, the values of the logarithm of the pre-exponential termof the Arrhenius equation presented in Table 3, except for the NTPsample, are in good agreement with those reported in the literaturefor lithium and sodium-conductive NASICON glass-ceramics whichrange from 0.2 to 2.0 [14,15]. Thus, the increase in the total ionicconductivity by up to five orders of magnitude is attributed to thedecrease in the activation energy.
Since the NASICON phase is the major crystalline phase in thesamples whose compositions contain up to y¼ 0.8, the increase intotal conductivity in this range of y is attributed not only to theincrease in the sodium ion concentration but also to the expansionof the NASICON unit cell in response to the introduction of largerSi4þ cations than P5þ cations, as discussed in Section 3.2 (see Fig. 4-b). This increase in volume presumably enables sodium ions tomove more easily in the NASICON crystal structure, which is re-flected in the decrease in activation energy.
On the other hand, the high ionic conductivity of NTSP10 andNTSP12 samples was unexpected, in view of the formation ofNa(TiO)(PO4) phase as the major crystalline phase instead of theNASICON phase. As can be seen in Fig. 7-c and Table 3, the ionicconductivity of the NTSP10 glass-ceramic was one order ofmagnitude higher than that of the samples whose major crystallinephase was NASICON.
The Na(TiO)PO4 crystalline phase present in the NTSP10 and

Fig. 5. Microstructures of the fracture surfaces of Na1þyTi2SiyP3-yO12 (NTSP) glass-ceramics obtained by heat treatment at corresponding Tx (see Table 1) for 30min: (a) NTSP04, (b)NTSP06, (c) NTSP08, (d) NTSP10, (e) NTSP12, (f) NTSP14, (g) NTSP16 and (h) NTSP18.
A.M. Nieto-Mu~noz et al. / Electrochimica Acta 319 (2019) 922e932928
NTSP12 glass-ceramics is homologous to the K(TiO)PO4 (KTP)phase, which present high Kþ ionic conductivity [32,38]. It is worthmentioning that, although the structure of KTP materials iscomposed of TiO6 octahedra and PO4 tetrahedra, which makes itsimilar to the NASICON structure, its ionic conductivity is aniso-tropic, probably due to an asymmetry of the TiO6 octahedra, and itis therefore considered quasi-one-dimensional along the c-axis,remaining in the order of 10�6 to 10�8 S cm�1 at room temperature[32,38].
Some fewworks in the literature concerning the investigation ofthe potassium-sodium substitution in the KTP structure, giving riseto the formation of the K1-xNax(TiO)(PO4) system (KNTP) reportedthe resulting ionic conductivity [29,37,38]. For instance, Loiaconoet al. [37] and Glumov et al. [38], have shown that the total con-ductivity of the KTP system decreases in response to the inclusionof sodium. The aforementioned authors agree that substitutingpotassium for sodium ions causes the KTP unit cell to shrink
because the ionic radius of sodium (1.16 Å) is smaller than that of Kþ
(1.51Å) [33,39]. According to Glumov et al., the decrease in volumepresumably hinders the movement of charge carrier ions, therebyincreasing the activation energy of 0.34 eV of pure KTP to 0.48 eV ofKNTP with sodium. The theoretical results of other authors such asDahaouid et al. [29] also coincide with those of Glumov et al., in thissense that NaTiO(PO4) phase is less conductive than KTP. In thisregard, and based on the results depicted in Table 3 and Fig. 7-c, thelow activation energy (0.31 eV) and high ionic conductivity of theNTSP10 sample at 300 �C (1.7� 10�2 S cm�1) and at room temper-ature (1.0� 10�4 S cm�1) are not consistent with the results ob-tained by Liacono et al. and Glumov et al. A possible explanation forthe high ionic conductivity of the NTSP10 glass-ceramic is thatsome of the added silica entered the structure to replace phos-phorus ions, thus forming a new Na(TiO)((P,Si)O4) conductivephase, thereby favoring the mobility of Naþ charge carriers andthus resulting in the decrease in activation energy. The NTSP12

Fig. 6. Chemical composition according to EDS analysis for (a, b) “matrix” and (c, d) “ball” found in NTSP08 and NTSP10 glass-ceramics, respectively. (e) SEMmicrograph of fracturedsurface and (f) EDS analysis for a “ball” of the NTSP10 precursor glass sample.
A.M. Nieto-Mu~noz et al. / Electrochimica Acta 319 (2019) 922e932 929
sample showed lower ionic conductivity than the NTSP10 sample,since the percentage of NTPO phase with silicon ions in place ofphosphorus ions, which is presumably responsible for the highionic conductivity, dropped from 88% (y¼ 1.0) to 57% (y¼ 1.2), ac-cording to the Rietveld analysis.
3.5. Synthesis, structure and ionic conductivity of NaTiO(PO4)(NTPO) glass-ceramics
To check the hypothesis that silicon substitutes phosphorus inthe NaTiO(PO4) structure (as mentioned in Section 3.4), we syn-thesized the NaTiO(PO4) (NTPO) compound (without silicon, seeTable 4) also via the glass-ceramic route, using the same chemicalsand procedure as those described in the experimental section,subsection 2.1, and then, measured its ionic conductivity. The pre-cursor glass was melted at 1250 �C for 15min. Table 4 describes theTg and Tx temperatures of the NTPO vitreous material obtained bydifferential scanning calorimetry.
NTPO glass-ceramic was obtained from the heat treatment ofthe precursor glass at the crystallization temperature Tx¼ 724 �C,for 30min. The crystalline material was characterized by X-raydiffraction and then analyzed by Rietveld refinement (Fig. 8-a) forthe identification and quantification of the crystalline phasesformed after the heat treatment of parent glass.
The X-ray diffraction pattern of the NTPO glass-ceramic mate-rial, without silicon, revealed the formation of the NaTiO(PO4)
crystalline phase; some spikes of the NASICON NaTi2(PO4)3 asspurious phase were also observed. However, the calculated per-centage of the NaTiO(PO4) crystalline phase is higher (87.8%) thanthat of the NaTi2(PO4)3 phase (12.2%) according to the Rietveldrefinement analysis. It is interesting to note that the percentages ofNaTiO(PO)4 and NASICON-NaTi2(PO4)3 are very similar to thosepresent at the NTSP10 glass-ceramics (see Fig. 4-a).
According toTable 5, the refinement results show that the latticeparameters of the non-NASICON NaTiO(PO4) cell are smaller in theNTPO sample than in the NTSP10 sample (with silicon), thus indi-cating a possible substitution of Siþ4/Pþ5 at the phosphorus posi-tions within the NaTiO(PO4) structure. In fact, Siþ4 (0.26 Å) exhibitsa higher ionic radius than the phosphorus ion Pþ5 (0.17Å). It isworth mentioning that the occupancy factor of Si4þ ions could notbe resolved by Rietveld refinement, since Siþ4 and Pþ5 have verysimilar scattering factors.
The electrical characterization of the NTPO glass-ceramicallowed to determine the ionic conductivity values in differenttemperatures and thus, the construction of the Arrhenius graph asshown in Fig. 8-b. The values of the activation energy (Ea), totalionic conductivity at room temperature (sRT) and 300 �C (s300�C)and the pre-exponential factor (log s0) (Table 6) were estimatedfrom the linear regression of the data in Fig. 8-b.
Table 6 shows that the NTPO sample exhibits an activation en-ergy of 0.40 eV which is higher than the value presented by theNTSP10 sample (0.31 eV). Consequently, the ionic conductivity of
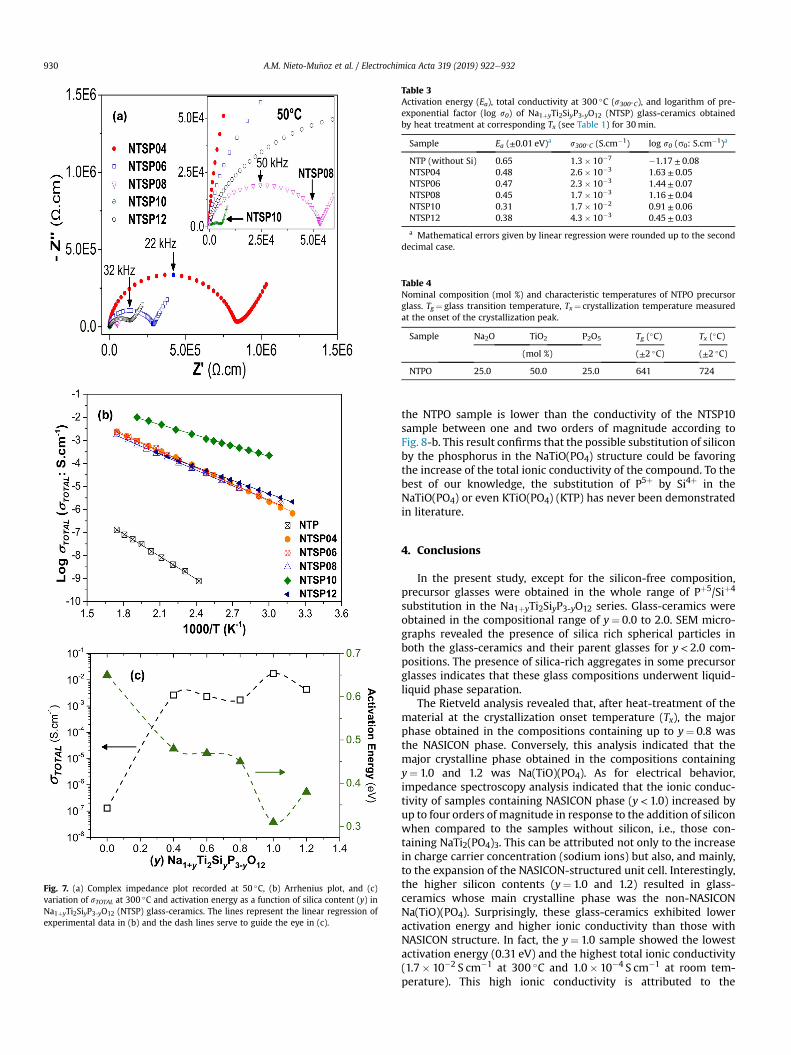
Fig. 7. (a) Complex impedance plot recorded at 50 �C, (b) Arrhenius plot, and (c)variation of sTOTAL at 300 �C and activation energy as a function of silica content (y) inNa1þyTi2SiyP3-yO12 (NTSP) glass-ceramics. The lines represent the linear regression ofexperimental data in (b) and the dash lines serve to guide the eye in (c).
Table 3Activation energy (Ea), total conductivity at 300 �C (s300�C), and logarithm of pre-exponential factor (log s0) of Na1þyTi2SiyP3-yO12 (NTSP) glass-ceramics obtainedby heat treatment at corresponding Tx (see Table 1) for 30min.
Sample Ea (±0.01 eV)a s300�C (S.cm�1) log s0 (s0: S.cm�1)a
NTP (without Si) 0.65 1.3� 10�7 �1.17± 0.08NTSP04 0.48 2.6� 10�3 1.63± 0.05NTSP06 0.47 2.3� 10�3 1.44± 0.07NTSP08 0.45 1.7� 10�3 1.16± 0.04NTSP10 0.31 1.7� 10�2 0.91± 0.06NTSP12 0.38 4.3� 10�3 0.45± 0.03
a Mathematical errors given by linear regression were rounded up to the seconddecimal case.
Table 4Nominal composition (mol %) and characteristic temperatures of NTPO precursorglass. Tg¼ glass transition temperature, Tx¼ crystallization temperature measuredat the onset of the crystallization peak.
Sample Na2O TiO2 P2O5 Tg (�C) Tx (�C)
(mol %) (±2 �C) (±2 �C)
NTPO 25.0 50.0 25.0 641 724
A.M. Nieto-Mu~noz et al. / Electrochimica Acta 319 (2019) 922e932930
the NTPO sample is lower than the conductivity of the NTSP10sample between one and two orders of magnitude according toFig. 8-b. This result confirms that the possible substitution of siliconby the phosphorus in the NaTiO(PO4) structure could be favoringthe increase of the total ionic conductivity of the compound. To thebest of our knowledge, the substitution of P5þ by Si4þ in theNaTiO(PO4) or even KTiO(PO4) (KTP) has never been demonstratedin literature.
4. Conclusions
In the present study, except for the silicon-free composition,precursor glasses were obtained in the whole range of Pþ5/Siþ4
substitution in the Na1þyTi2SiyP3-yO12 series. Glass-ceramics wereobtained in the compositional range of y¼ 0.0 to 2.0. SEM micro-graphs revealed the presence of silica rich spherical particles inboth the glass-ceramics and their parent glasses for y< 2.0 com-positions. The presence of silica-rich aggregates in some precursorglasses indicates that these glass compositions underwent liquid-liquid phase separation.
The Rietveld analysis revealed that, after heat-treatment of thematerial at the crystallization onset temperature (Tx), the majorphase obtained in the compositions containing up to y¼ 0.8 wasthe NASICON phase. Conversely, this analysis indicated that themajor crystalline phase obtained in the compositions containingy¼ 1.0 and 1.2 was Na(TiO)(PO4). As for electrical behavior,impedance spectroscopy analysis indicated that the ionic conduc-tivity of samples containing NASICON phase (y< 1.0) increased byup to four orders of magnitude in response to the addition of siliconwhen compared to the samples without silicon, i.e., those con-taining NaTi2(PO4)3. This can be attributed not only to the increasein charge carrier concentration (sodium ions) but also, and mainly,to the expansion of the NASICON-structured unit cell. Interestingly,the higher silicon contents (y¼ 1.0 and 1.2) resulted in glass-ceramics whose main crystalline phase was the non-NASICONNa(TiO)(PO4). Surprisingly, these glass-ceramics exhibited loweractivation energy and higher ionic conductivity than those withNASICON structure. In fact, the y¼ 1.0 sample showed the lowestactivation energy (0.31 eV) and the highest total ionic conductivity(1.7� 10�2 S cm�1 at 300 �C and 1.0� 10�4 S cm�1 at room tem-perature). This high ionic conductivity is attributed to the

Fig. 8. (a) Rietveld refinement of XRD data of NTPO glass-ceramic and (b) Arrhenius plot of NTSP10 and NTPO samples after heat treatment of their respective precursor glass. TheR-factors in the Rietveld analysis were: Rwp¼ 13.70% and Rp¼ 10.18%. The lines in (b) represent the linear regression of experimental data.
Table 5Lattice parameters of the non-NASICON NaTiO(PO4) structure and R-factors (Rwp andRp) from Rietveld analysis of NTPO and NTSP10 glass-ceramics.
Sample a (Å) b (Å) c (Å) V (Å3) Rwp (%) Rp (%)
NTPO 8.74 9.10 10.51 837 13.70 10.18NTSP10 8.75 9.11 10.54 840 10.91 7.97
Table 6Activation energy (Ea), total conductivity at room temperature (sRT), total conduc-tivity at 300 �C (s300�C), and logarithm of pre-exponential factor (log s0) of NTPOglass-ceramic obtained by heat treatment at Tx (see Table 4) for 30min.
Sample Ea sRT s300�C log s0
(±0.01eV)a (S.cm�1) (S.cm�1) (s0: S.cm�1)a
NTPO 0.40 2.2� 10�6 4.2� 10�3 1.15± 0.11
a Mathematical errors given by linear regression were rounded up to the seconddecimal case.
A.M. Nieto-Mu~noz et al. / Electrochimica Acta 319 (2019) 922e932 931
substitution of phosphorus ions with silicon ions in theNa(TiO)(PO4) crystalline phase. This assumption is based on thelattice parameters and electrical characterization of the silicon-freeNa(TiO)PO4 compound, which indicated that its ionic conductivityis lower than that of the NTSP10 sample (y¼ 1.0). In conclusion, wecan state that we have developed a new sodium conductive glass-ceramic whose conductivity makes it suitable for application assolid electrolyte.
Acknowledgements
The authors gratefully acknowledge the financial support of theBrazilian research funding agencies FAPESP (Fundaç~ao de Amparo �aPesquisa do Estado de S~ao Paulo, Process No. 2013e07793, via theCEPID program), CNPq (Conselho Nacional de DesenvolvimentoCientífico e Tecnol�ogico, under Process No.168682/2017-6 for JFOMand Process No. 141220/2016-3 for AMNM), and CAPES (Coor-denaç~ao de Aperfeiçoamento de Pessoal de Nível Superior), Brazil,finance code 001. We are also deeply indebted to C. O. Paiva-Santosfor his useful suggestions and help with the Rietveld method.
References
[1] H. Su, S. Jaffer, H. Yu, Transition metal oxides for sodium-ion batteries, EnergyStor. Mater. 5 (2016) 116e131, https://doi.org/10.1016/j.ensm.2016.06.005.
[2] B.L. Ellis, L.F. Nazar, Sodium and sodium-ion energy storage batteries, Curr.Opin. Solid State Mater. Sci. 16 (2012) 168e177, https://doi.org/10.1016/j.cossms.2012.04.002.
[3] M.I. Jamesh, A.S. Prakash, Advancement of technology towards developing Na-ion batteries, J. Power Sources 378 (2018) 268e300, https://doi.org/10.1016/j.jpowsour.2017.12.053.
[4] K.B. Hueso, M. Armand, T. Rojo, High temperature sodium batteries: status,challenges and future trends, Energy Environ. Sci. 6 (2013) 734e749, https://doi.org/10.1039/c3ee24086j.
[5] Y. Wang, R. Chen, T. Chen, H. Lv, G. Zhu, L. Ma, C. Wang, Z. Jin, J. Liu, Emergingnon-lithium ion batteries, Energy Stor. Mater. 4 (2016) 103e129, https://doi.org/10.1016/j.ensm.2016.04.001.
[6] Y. Fang, J. Zhang, L. Xiao, X. Ai, Y. Cao, H. Yang, Phosphate framework electrodematerials for sodium ion batteries, Adv. Sci. 4 (2017), https://doi.org/10.1002/advs.201600392.
[7] H. Kang, Y. Liu, K. Cao, Y. Zhao, L. Jiao, Y. Wang, H. Yuan, Update on anodematerials for Na-ion batteries, J. Mater. Chem. A. 3 (2015) 17899e17913,https://doi.org/10.1039/C5TA03181H.

A.M. Nieto-Mu~noz et al. / Electrochimica Acta 319 (2019) 922e932932
[8] H. Bradtmüller, A.M. Nieto-Mu~noz, J.F. Ortiz-Mosquera, A.C.M. Rodrigues,H. Eckert, Glass-to-crystal transition in the NASICON glass-ceramic systemNa1þxAlxM2�x(PO4)3 (M¼Ge, Ti), J. Non-Cryst. Solids 489 (2018) 91e101,https://doi.org/10.1016/j.jnoncrysol.2017.10.057.
[9] M. Guin, F. Tietz, Survey of the transport properties of sodium superionicconductor materials for use in sodium batteries, J. Power Sources 273 (2015)1056e1064, https://doi.org/10.1016/j.jpowsour.2014.09.137.
[10] J. Thomas, in: PeterG. Bruce (Ed.), Solid State Electrochemistry, vol. XVI,Cambridge University Press, Cambridge, 1995, p. 344, https://doi.org/10.1002/adma.19960080417. ISBN 0-521-40007-4, Adv. Mater. 8 (1996) 360e360.
[11] R.M. Dell, Batteries: fifty years of materials development, Solid State Ion. 134(2000) 139e158, https://doi.org/10.1016/S0167-2738(00)00722-0.
[12] F. Lal�ere, J.B. Leriche, M. Courty, S. Boulineau, V. Viallet, C. Masquelier,V. Seznec, An all-solid state NASICON sodium battery operating at 200�C,J. Power Sources 247 (2014) 975e980, https://doi.org/10.1016/j.jpowsour.2013.09.051.
[13] W. Zhou, Y. Li, S. Xin, J.B. Goodenough, Rechargeable sodium all-solid-statebattery, ACS Cent. Sci. 3 (2017) 52e57, https://doi.org/10.1021/acscentsci.6b00321.
[14] J.L. Narv�aez-Semanate, A.C.M. Rodrigues, Microstructure and ionic conduc-tivity of Li1þxAlxTi2-x(PO4)3 NASICON glass-ceramics, Solid State Ion. 181(2010) 1197e1204, https://doi.org/10.1016/j.ssi.2010.05.010.
[15] J.F. Ortiz-Mosquera, A.M. Nieto-Mu~noz, A.C.M. Rodrigues, Precursor glassstability, microstructure and ionic conductivity of glass-ceramics from theNa1þxAlxGe2ex(PO4)3 NASICON series, J. Non-Cryst. Solids 513 (2019) 36e43,https://doi.org/10.1016/j.jnoncrysol.2019.03.008.
[16] N. Anantharamulu, K.K. Rao, G. Rambabu, B.V. Kumar, V. Radha, M. Vithal,A Wide-Ranging Review on Nasicon Type Materials, 2011, pp. 2821e2837,https://doi.org/10.1007/s10853-011-5302-5.
[17] Z. Jian, Y.S. Hu, X. Ji, W. Chen, NASICON-structured materials for energystorage, Adv. Mater. 29 (2017), https://doi.org/10.1002/adma.201601925.
[18] B.E. Francisco, C.R. Stoldt, J.-C. M'Peko, Lithium-ion trapping from localstructural distortions in NASICON electrolytes, Chem. Mater. (2014)4741e4749, https://doi.org/10.1021/cm5013872.
[19] M. Barr�e, M.P. Crosnier-Lopez, F. Le Berre, E. Suard, J.L. Fourquet, Synthesis andstructural study of a new NASICON-type solid solution: Li1-xLax/3Zr2(PO4)3,J. Solid State Chem. 180 (2007) 1011e1019, https://doi.org/10.1016/j.jssc.2006.12.032.
[20] R.B. Nuernberg, A.C.M. Rodrigues, A new NASICON lithium ion-conductingglass-ceramic of the Li1þxCrx(GeyTi1�y)2�x(PO4)3 system, Solid State Ion. 301(2017) 1e9, https://doi.org/10.1016/j.ssi.2017.01.004.
[21] A. Tsuji, H. Takahashi, T. Oi, Preparation of ion exchangers in the hydrogenform from M1þxTi2P3-xSixO12(M ¼ Li, Na) crystals and glass-ceramics and theircharacterization, J. Mater. Chem. 13 (2003) 542e549, https://doi.org/10.1039/b207611j.
[22] A. Kishioka, Y. Miyazawa, K. Itatani, F.S. Howell, M. Kinoshita, Preparation andproperties of phosphate glasses and glass-ceramics containing large amountsof titanium (IV), J. Ceram. Soc. Jpn. 102 (1994) 155e159, https://doi.org/10.2109/jcersj.102.155.
[23] J. Fu, Superionic conductivity of glass-ceramics in the system Li 2 O- Al 2 O 3-TiO 2 -P 2 O 5, Solid State Ion. 96 (1997) 195e200, https://doi.org/10.1016/S0167-2738(97)00018-0.
[24] Oxford Cryosystems, Crystallographica search-match, J. Appl. Crystallogr. 32
(1999) 379e380, https://doi.org/10.1107/s0021889899004124.[25] A.A. Coelho, J. Evans, I. Evans, A. Kern, S. Parsons, The TOPAS symbolic
computation system, Powder Diffr. 26 (2011) S22eS25, https://doi.org/10.1154/1.3661087.
[26] A. Belsky, M. Hellenbrandt, V.L. Karen, P. Luksch, New developments in theInorganic Crystal Structure Database (ICSD): accessibility in support of ma-terials research and design, Acta Crystallogr. Sect. B Struct. Sci. 58 (2002)364e369, https://doi.org/10.1107/S0108768102006948.
[27] V.M. Fokin, R.M.C.V. Reis, A.S. Abyzov, C.R. Chinaglia, E.D. Zanotto, Non-stoichiometric crystallization of lithium metasilicateecalcium metasilicateglasses. Part 1 d crystal nucleation and growth rates, J. Non-Cryst. Solids 362(2013) 56e64, https://doi.org/10.1016/j.jnoncrysol.2012.11.020.
[28] L.S. Gallo, T. De Marchi Mosca, B.H. Teider, I. Polyakova, A.C.M. Rodrigues,E.D. Zanotto, V.M. Fokin, Effects of lithium oxide on the crystallization kineticsof Na2O$2CaO$3SiO2 glass, J. Non-Cryst. Solids 408 (2015) 102e114, https://doi.org/10.1016/j.jnoncrysol.2014.10.018.
[29] S. Dahaoui, N.K. Hansen, J. Protas, H.-G. Krane, K. Fischer, G. Marnier, Electricproperties of KTiOPO4 and NaTiOPO4 from temperature-dependent X-raydiffraction, J. Appl. Crystallogr. 32 (1999) 1e10, https://doi.org/10.1107/S002188989800497X.
[30] P.I. Tordjman, E. Masse, J.C. Guitel, Structure cristalline du monophosphateKTiPO5, Z. Krist. 139 (1974) 103e115, https://doi.org/10.1524/zkri.1974.139.1-2.103.
[31] B.-C. Choi, B.K. Moon, H.-J. Seo, J.-H. Park, C.-S. Kim, Impedance spectroscopyof KTiOPO4 single crystal in the temperature range -100 to 100�C, Appl. Phys.Mater. Sci. Process 78 (2004) 745e748, https://doi.org/10.1007/s00339-002-2026-z.
[32] P.A. Morris, A. Ferretti, J.D. Bierlein, G.M. Loiacono, Reduction of the ionicconductivity of flux grown KTiOPO 4 crystals, J. Cryst. Growth 109 (1991)367e375, https://doi.org/10.1016/0022-0248(91)90205-J.
[33] R.D. Shannon, Revised effective ionic radii and systematic studies of inter-atomic distances in halides and chalcogenides, Acta Crystallogr. A 32 (1976)751e767, https://doi.org/10.1107/S0567739476001551.
[34] K. Shimazu, Y. Yamamoto, Y. Saito, O. Nakamura, Electrical conductivity andTi4þ ion substitution range in NASICON system, Solid State Ion. 79 (1995)106e110, https://doi.org/10.1016/0167-2738(95)00038-8.
[35] P. Yadav, M.C. Bhatnagar, Preparation, structure and conductivity of Snmodified NASICON material, J. Electroceram. 30 (2013) 145e151, https://doi.org/10.1007/s10832-012-9776-6.
[36] J.M. Oliveira, R.N. Correia, M.H.V. Fernandes, formation of convoluted silicaprecipitates during amorphous phase separation in the Ca3(PO4)2-SiO2-MgOsystem, J. Am. Ceram. Soc. 83 (2004) 1296e1298, https://doi.org/10.1111/j.1151-2916.2000.tb01374.x.
[37] G.M. Loiacono, D.N. Loiacono, R.A. Stolzenberger, Growth and properties ofcrystals in the system KTiOPO4-NaTiOPO4, J. Cryst. Growth 144 (1994)223e228, https://doi.org/10.1016/0022-0248(94)90460-X.
[38] O.V. Glumov, V.A. Bodnar, N.A. Mel’nikova, V.E. Yakobson, I.V. Murin, Electricalconductivity of potassium titanyl phosphate KTiOPO4 pure crystals and thosedoped with Naþ, Rbþ, and Fe ions, Russ. J. Electrochem. 53 (2017) 846e851,https://doi.org/10.1134/S1023193517080055.
[39] G.M. Loiacono, R.A. Stolzenberger, D.N. Loiacono, Modified KTiOPO4 crystalsfor noncritical phase matching applications, Appl. Phys. Lett. 64 (1994) 16e18,https://doi.org/10.1063/1.111959.