Embed Size (px)
Citation preview
Novel Mass Spectrometric Analysis Methods for Anabolic
Androgenic Steroids in Sports Drug Testing
by
Antti Leinonen
Department of Pharmaceutical Chemistry
Faculty of Pharmacy
University of Helsinki
Finland
Academic dissertation
To be presented with the permission of the Faculty of Pharmacy of the University of
Helsinki for public criticism in the Auditorium of the Finnish Sports Federation
(SLU-talo, Radiokatu 20) on May 12th, 2006, at 12 o’clock noon
Helsinki 2006

2
Supervised by:
Professor Risto Kostiainen
Department of Pharmaceutical Chemistry
Faculty of Pharmacy
University of Helsinki
Finland
Reviewed by:
Professor Kimmo Himberg
National Bureau of Investigation
Crime Laboratory
Finland
Professor Mario Thevis
Institute of Biochemistry
German Sports University Cologne
Germany
Opponent:
Dr. Paula Vanninen
VERIFIN, Finnish Institute for Verification of the Chemical Weapons Convention
University of Helsinki
Finland
© Antti Leinonen 2006
ISBN 952-10-3106-9 (hardback)
ISSN 1795-7079
ISBN 952-10-3107-7 (PDF)
http://ethesis.helsinki.fi
Helsinki University Printing House
Helsinki 2006

3
CONTENTS
LIST OF ORIGINAL PUBLICATIONS………………………………………… 5
ABBREVIATIONS…………………...………………………………………....… 6
ABSTRACT…………………………………………………………………...…… 8
1. INTRODUCTION…………………………………………………………….... 10
2. REVIEW OF THE LITERATURE……………………………………..…….. 12
2.1. Anabolic androgenic steroids……………………………………….….… 12
2.1.1. Mechanism of action and clinical use……………………….……... 12
2.1.2. Abuse of steroids……………………………………………….….. 12
2.1.3. Chemical structure…………………………………………………. 14
2.1.4. Metabolism………………………………………………………… 17
2.2. Detection of anabolic androgenic steroids in human urinein doping control………………………………………………………….. 18
2.2.1. History of testing………………………………………………….... 18
2.2.2. Strategy of testing………………………………….………………. 18
2.2.3. Analytical methods………………………………….……………… 20
3. AIMS OF THE STUDY………………………………………………………… 26
4. MATERIALS AND METHODS………………………………………………. 27
4.1. Steroids and reagents…………………………………………………….. 27
4.2. Instrumentation…………………………………………………………… 27
4.3. Comparison of GC/LRMS and GC/HRMS methods (I)……………….. 29
4.4. In-vial two-phase LPME method with in-fiber silylation forsample preparation in GC/MS analysis (II)……………….………..…… 29
4.5. Comparison of LC/MS/MS methods based on differentionization techniques (III)………………………………………………... 30
4.6. LC/ESI-MS/MS method for screening of unconjugatedanabolic androgenic steroids (IV)………………………………………… 31
4.7. Chemometric resolution of full scan mass spectral data intocomponents (V)………………………………………………………….… 31
4
5. RESULTS AND DISCUSSION………………………………………………... 32
5.1. Comparison of GC/LRMS and GC/HRMS methods (I)……………….. 32
5.2. In-vial two-phase LPME utilizing in-fiber silylation forsample preparation in GC/MS analysis (II)………………………….…. 37
5.3. Suitability of LC/MS/MS for analysis of anabolic androgenicsteroids (III)……………………………………………………………….. 40
5.4. LC/ESI-MS/MS method for routine screening of unconjugatedanabolic androgenic steroids (IV)………………………………………… 44
5.5. Chemometric resolution of full scan GC/MS data into components….. 48
6. SUMMARY AND CONCLUSIONS……………………………….………….. 53
ACKNOWLEDGEMENTS…………………………………………………..…… 56
REFERENCES……………………………………………………………………. 57

5
LIST OF ORIGINAL PUBLICATIONS
This doctoral thesis is based on the following five articles, hereafter referred to by their
Roman numerals (I-V):
I Kokkonen J., Leinonen A., Tuominen J., Seppälä T. Comparison of sensitivity
between gas chromatography – low-resolution mass spectrometry and gas
chromatography – high-resolution mass spectrometry for determining
metandienone metabolites in urine. J. Chromatogr. B 734 (1999) 179-189.
II Leinonen A., Vuorensola K., Lepola L.-M., Kuuranne T., Kotiaho T., Ketola
R.A., Kostiainen R. Liquid-phase microextraction for sample preparation in
analysis of unconjugated anabolic steroids in urine. Anal. Chim. Acta 559 (2006)
166-172.
III Leinonen A., Kuuranne T., Kostiainen R. Liquid chromatography/mass
spectrometry in anabolic steroid analysis – optimization and comparison of three
ionization techniques: electrospray ionization, atmospheric pressure chemical
ionization and atmospheric pressure photoionization. J. Mass Spectrom. 37 (2002)
693-698.
IV Leinonen A., Kuuranne T., Kotiaho T., Kostiainen R. Screening of free 17-alkyl-
substituted anabolic steroids in human urine by liquid chromatography –
electrospray ionization tandem mass spectrometry. Steroids 69 (2004) 101-109.
V Karjalainen E.J., Leinonen A., Karjalainen U.P. Automated deconvolution
uncovers hidden peaks in GC-MS. In: Advances in mass spectrometry, Volume
14. Karjalainen E.J., Hesso A.E., Jalonen J.E., Karjalainen U.P. (Eds.), Elsevier,
Amsterdam, The Netherlands (1998) 595-609.
6
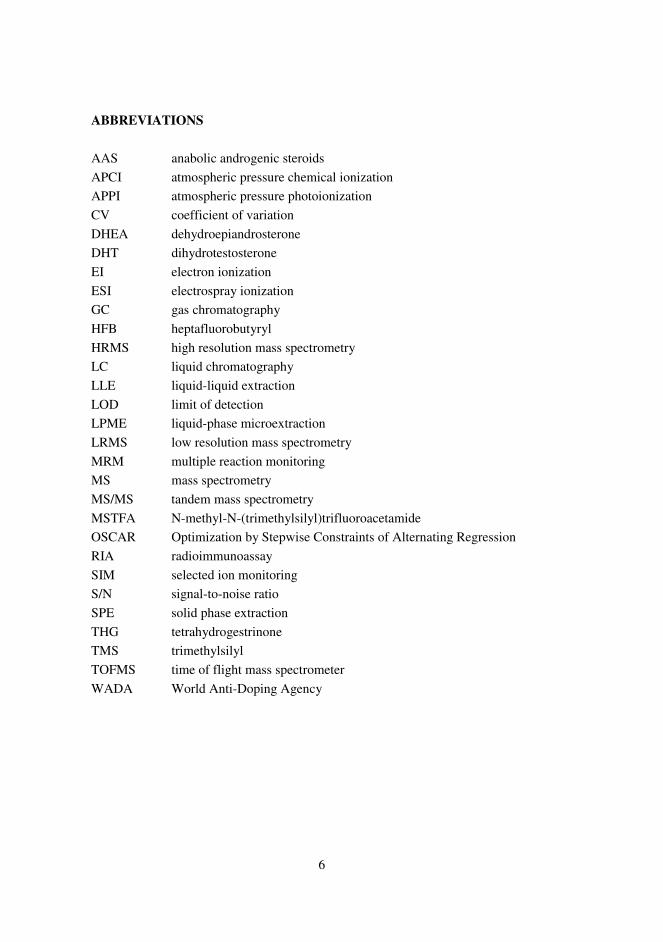
ABBREVIATIONS
AAS anabolic androgenic steroids
APCI atmospheric pressure chemical ionization
APPI atmospheric pressure photoionization
CV coefficient of variation
DHEA dehydroepiandrosterone
DHT dihydrotestosterone
EI electron ionization
ESI electrospray ionization
GC gas chromatography
HFB heptafluorobutyryl
HRMS high resolution mass spectrometry
LC liquid chromatography
LLE liquid-liquid extraction
LOD limit of detection
LPME liquid-phase microextraction
LRMS low resolution mass spectrometry
MRM multiple reaction monitoring
MS mass spectrometry
MS/MS tandem mass spectrometry
MSTFA N-methyl-N-(trimethylsilyl)trifluoroacetamide
OSCAR Optimization by Stepwise Constraints of Alternating Regression
RIA radioimmunoassay
SIM selected ion monitoring
S/N signal-to-noise ratio
SPE solid phase extraction
THG tetrahydrogestrinone
TMS trimethylsilyl
TOFMS time of flight mass spectrometer
WADA World Anti-Doping Agency

7
Abbreviations of the steroids in the study:
6CDM 6β-hydroxy-4-chlorodehydromethyltestosterone
DNZm ethisterone
FLXm 9α-fluoro-17α-methyl-androst-4-ene-3α,6β,11β,17β-tetrol
FMBm 2-hydroxymethyl-17α-methyl-androsta-1,4-diene-11α,17β-diol-3-one
6MDN 6β-hydroxymethandienone
17MDN 17-epimethandienone
MDNm1 17α-methyl-5β-androstan-3α,17β-diol
MDNm2 17β-methyl-5β-androst-1-ene-3α,17α-diol
MTS methyltestosterone
OXD oxandrolone
17OXD 17-epioxandrolone
3STZ 3’-hydroxystanozolol

8
ABSTRACT
The feasibility of different modern analytical techniques for the mass spectrometric
detection of anabolic androgenic steroids (AAS) in human urine related to sports drug
testing was examined. Gas chromatography (GC) combined with low (LRMS) and high
resolution mass spectrometry (HRMS), liquid-phase microextration (LPME), liquid
chromatography/mass spectrometry (LC/MS) with electrospray ionization (ESI),
atmospheric pressure chemical ionization (APCI) and atmospheric pressure
photoionization (APPI), and chemometric processing of mass spectral data were applied
to the analysis of steroids.
A comparative study of the sensitivity and specificity between GC/LRMS and
GC/HRMS methods in screening of urinary AAS was carried out with four different
metabolites of methandienone. Urine samples were treated with a standard sample
preparation procedure used in AAS analytics. Measurements were done in selected ion
monitoring (SIM) mode with HRMS using a mass resolution of 5000. Detection limits for
different metabolites measured using HRMS varied between 0.2-0.5 ng/ml, whereas with
LRMS they were clearly higher (0.5-5 ng/ml). However, also with HRMS, the biological
background hampered the detection of certain metabolites.
The feasibility of in-vial two-phase LPME was studied for the sample preparation of
AAS in urine. Metabolites of fluoxymesterone, 4-chlorodehydromethyltestosterone,
stanozolol and danazol were used as test compounds. Factors affecting the extraction
process were first examined with a standard LPME method using LC/MS detection.
Secondly, a novel LPME method utilizing in-fiber silylation was developed for GC/MS
analysis of a danazol metabolite. LPME proved to be a straightforward and simple
sample preparation method, but was suitable only for hydrophobic steroids. The LPME
method with in-fiber derivatization for GC/MS analysis exhibited high sensitivity,
reproducibility and linearity, enabling simultaneous filtration, extraction, enrichment and
derivatization of the analyte from urine without any other steps in sample pretreatment.
The applicability of LC/MS to the detection of the free anabolic steroid fraction in urine
was examined. Positive ion ESI-, APCI- and APPI- tandem mass spectrometric (MS/MS)
methods were developed, optimized and compared with respect to specificity and
detection limit. Oxandrolone and metabolites of stanozolol and 4-chlorodehydro-
methyltestosterone were used as test compounds. All methods exhibited high sensitivity
and specificity and proved to be good candidates for routine screening of AAS. LC/ESI-
MS/MS showed the best applicability and enabled detection of steroids at 0.4-3.1 ng/ml

9
in urine. Based on the initial optimization studies, a positive ion LC/ESI-MS/MS method
was developed for routine screening of free steroid fraction. Sample preparation
involved one-step liquid extraction and liquid chromatographic separation was achieved
on a reversed-phase column. Measurements were done in the multiple reaction
monitoring (MRM) mode. The method enabled fast, selective and precise measurement
of nine 17-alkyl-substituted AAS and their metabolites in urine with detection limits of
0.1–2 ng/ml. The method showed good linearity up to 250 ng/ml.
The potential of chemometrics to enhance interpretation of complex MS data was studied
and demonstrated with urine samples prepared for standard GC/MS screening of AAS.
Acquired full scan spectral data (m/z 40-700) were processed by the OSCAR
(Optimization by Stepwise Constraints of Alternating Regression) method. The
deconvolution process was able to dig out from a GC-MS run more than the double
number of components as compared with the number of visible chromatographic peaks.
Severely overlapping components, as well as components thoroughly hidden in the
chromatographic background could be isolated successfully.
The study proved that GC/HRMS, LC/MS/MS and LPME are useful and efficient tools in
the detection of AAS in urine. Superiority of different techniques is, however,
compound-dependent and different techniques complement each other. Chemometric
processing of full scan mass spectral data is a potential and useful way to separate
components in a complex biological sample such as urine, and improves sensitivity and
reliability of the measurements.

10
1. INTRODUCTION
Enhancement of athletic performance through foreign substances or artificial means is
forbidden in human sports. Global fight against doping in sports is supervised by the
World Anti-Doping Agency (WADA) which maintains the World Anti-Doping Code
including the prohibited list defining the substances and methods prohibited in sports. In
practice, drug abuse is controlled by way of testing of athletes. Urine or blood samples
are collected from athletes, either prior to or during contests. Test samples are analyzed
for banned substances in analytical laboratories accredited by WADA.
The analytical work in doping control laboratories differs in many ways from that of
other laboratories. Huge numbers of different substances are measured from a complex
matrix. Concentrations of analytes vary largely, often being very low. Occasionally, a
multitude of samples has to be analyzed within a short time. Last but not least, methods
and test results have to be completely valid and reliable as a case may lead to a hearing
and a false positive result will be fateful for the athlete’s career. The analytics is divided
into screening procedures and methods of confirmatory analysis. The aim of screening is
to reveal suspicious samples for further analysis. In confirmation, samples are analyzed
with methods that provide unequivocal identification of the substances. Urine is the
principal sample matrix and most analyses are qualitative in nature. Because of the large
array of target compounds, many different analytical methods are used. Multi-analyte
methods are favored in order to keep the number of separate procedures acceptable. Most
methods are based on chromatography combined with mass spectrometry (MS).
Analytical procedures have to be constantly improved and updated in order to keep pace
with trends in substance abuse and to fulfill increasing quality requirements.
Anabolic androgenic steroids (AAS) are a group of natural and synthetic compounds that
are chemically similar to and mimic the actions of endogenous testosterone. In addition to
their medical use AAS have been misused for the past 50 years by a wide variety of
athletics with the hope of improving their training, endurance and performance. The use
of AAS in sports has been banned since the mid-70s but they are still the most misused
class of drugs in sports. Steroid abuse has also become more and more prevalent outside
sports.
Detection of AAS is demanding due to the presence of numerous different steroids, their
extensive metabolism and their low concentration in urine. A capillary gas
chromatograph coupled to a benchtop quadrupole mass spectrometer (GC/MS) has been
the backbone of testing of AAS for the last decades. Although the set-up allows fairly

11
successful large scale screening, more efficient instrumental techniques such as high
resolution mass spectrometry (HRMS), tandem mass spectrometry (MS/MS) and liquid
chromatography/mass spectrometry (LC/MS) are also needed to enhance selectivity and
sensitivity of the measurements. In addition to instrumental techniques, new sample
pretreatment methods and modern computerized data processing might be useful tools for
the analysis of AAS. Selection of any analytical procedure should be made carefully to
restrain analytics from becoming more complicated and to prevent gratuitous increase of
workload and costs.
In this work, the applicability of different modern analytical methods was investigated in
respect of MS detection of AAS in urine. The aim was to improve the prevalent
analytics and to learn the strengths and restrictions of different analytical approaches in
order to find reasonable strategies for effective testing of AAS. The work is divided in
three sections: GC/MS methods, LC/MS methods and chemometric processing of MS
data. Regarding GC/MS, a comparative study of the sensitivity and specificity between
low-resolution and high-resolution MS detection was carried out (I). Furthermore,
suitability of liquid-phase microextraction (LPME) for sample preparation of AAS was
investigated and a novel LPME method with in-fiber derivatization was developed for
GC/MS analysis (II). The applicability of LC/MS for the detection of AAS was studied
by comparing three methods involving different ionization techniques: electrospray
ionization (ESI), atmospheric pressure chemical ionization (APCI) and atmospheric
pressure photoionization (APPI) (III), and by developing a routine screening procedure
for free AAS (IV). Potential of chemometrics to enhance interpretation of complex MS
data was demonstrated with urine samples prepared for screening of AAS, analyzed by
GC/MS in the scan mode and data evaluated using a deconvolution method (V).

12
2. REVIEW OF THE LITERATURE
2.1. Anabolic androgenic steroids
2.1.1. Mechanism of action and clinical use
AAS are synthetic derivatives of testosterone. Testosterone is the primary natural male
hormone and is responsible for the androgenic and anabolic effects observed during male
adolescence and adulthood. Testosterone is synthesized in the Leydig cells of the testes in
man, but is also present in women, in whom it is synthesized in the ovaries and adrenal
glands [1-3].
The fundamental physiological action of testosterone takes place through binding of the
hormone to cytoplasmic receptors, thus promoting gene transcription and the protein
translation [1-4]. The main sites of anabolic action are skeletal muscle, bone muscle
tissue and haematopoiesis. In addition, some of the anabolic effects are mediated also
indirectly: AAS are antagonists of endogenous glucocorticoids and inhibit protein
catabolic processes. In addition, they can stimulate formation of growth hormone and
insulin-like growth factor-1 [1-5].
AAS therapy has many clinical indications [2-5]. For a long time AAS have been used
for the treatment of male hypogonadism. Other therapies currently in use include
contraception and treatment of chronic wasting diseases such as chronic obstructive
pulmonary disease and HIV infection. AAS have been used to promote muscle deposition
after burns, surgery and radiation therapy. They have also been tried in treatments of
osteoporosis, hepatic diseases, wound healing, anemia and some psychiatric disorders.
AAS can be administered orally, intramuscularly, nasally, buccally and transdermally
[1,3,5].
2.1.2. Abuse of steroids
AAS have been supplemented for decades by athletes. The abuse is not limited to
professional and competing athletes and a large population of recreational athletes and
non-athletes are abusing AAS as well. Incidence of the abuse has been studied intensively
among competing and non-competing athletes. Results of different surveys vary greatly,
and the frequency depends on type of sports, gender and age. In all, estimates of
incidence vary from less than one percent up to over ten percent [1,3,6-8]. According to
WADA’s laboratory statistics 2004, about 0.7% of nearly 170,000 urine samples

13
analyzed were positive for anabolic agents, with testosterone, nandrolone, stanozolol and
methandienone representing almost 86% of all findings [9].
Recent reviews conclude that AAS, especially when used as supratherapeutical doses and
combined with strength training, have an anabolic effect in healthy men [1-3,7,8,10-12].
The mechanism of action is still partly unclear but is postulated to be mainly mediated
indirectly. High doses of AAS may also increase the number of androgen receptors in
cells [5]. A part of action might be psychological since abusers claim to feel more
energetic and thus train harder [5,8].
Abuse of AAS differs markedly from the clinical use [1,3,5,7,8,11]. Drugs come
frequently from the black market and some are intended only for veterinary use. Total
dosages used are often supratherapeutical. Drugs are taken in “cycles” of 1-3 months with
complete abstinence from medication in between, in an attempt to minimize side-effects.
More than one steroid is used simultaneously as a “stack” to avoid tolerance. The dosing
is initially low, then gradually increased and towards the end of the cycle tapered down to
avoid withdrawal symptoms. Most of the AAS abusers use concurrently other drugs to
prevent undesirable effects of AAS.
Adverse effects of AAS are commonly associated with AAS abuse and particularly with
long-term use of supratherapeutical doses. AAS may result in reduced fertility and
gynecomastia in males and masculinization in females and children. Other adverse effects
include e.g. cardiovascular disorders, hepatic dysfunctions, liver tumours, oedema,
tendon injuries and psychiatric disorders [1-6,13,14].

14
2.1.3. Chemical structure
Chemically synthesized AAS are structurally related to the native testosterone molecule
(Figure 1). They were designed to enhance the protein anabolic effect of testosterone
while reducing the unwanted androgenic effect, and to improve the pharmacological
properties of the molecule. AAS can roughly be divided into three groups: I) analogs
produced via esterification of the 17β-hydroxyl group, II) analogs that have been
alkylated at the 17α position and III) analogs where A, B or C rings are modified
[2,5,15]. Often a compound belongs in several of these groups.
Figure 1. Chemical structure of testosterone (Androst-4-en-17β-ol-3-one).
Esterification of the 17β-hydroxyl group with carboxylic acids enables intramuscular
administration of the drug [2,5,15]. The most common 17β-esters are derivatives of the
parent testosterone (e.g. testosterone cypionate, propionate, enanthate, undecanoate).
Alkylation at the 17α position protects steroid against first pass metabolism and enables
its oral use [2,5,15]. Most of the 17-alkylated AAS are methyl derivatives but also
ethylated and ethinylated derivatives exist. The great majority of AAS has structural
modifications in either A, B or C rings [2,5,15]. These steroids are often available for oral
use. It is clear that the most common modifications are introduction of a double bond
between C-1 and C-2 and reduction of the double bond between C-4 and C-5. Other
modifications include e.g. attachment of a methyl group at C-1, attachment of a methyl or
an oxymethyl group at C-2 or its replacement with oxygen, attachment of pyrazole or
another cyclic structure to the A ring through C-2 and C-3, attachment of chlorine or a
hydroxyl group at C-4 and attachment of a methyl group at C-7. Nandrolone, the most
common testosterone analogue, has the structure of testosterone but lacks the angular
methyl group C-19 between the A- and B-rings.
O
OH
H
A B
C D1
2
34
17
7
65
89
10
1112
13
1415
16
18
19
αβ
O
OH
H
A B
C D1
2
34
17
7
65
89
10
1112
13
1415
16
18
19
αβ

15
In addition to the primary synthetic AAS, there are many steroids that are marketed in
some countries freely as “dietary supplements” or “prohormones” [6,5,15].
Dehydroepiandrosterone (DHEA) and 4-androstenedione are endogenous steroids. Other
substances chemically related to them include e.g. 5-androstendione, 4-androstendiol, 5-
androstendiol, 19-norandrost-4-enedione, 19-norandrost-5-enediol and 19-norandrost-4-
enediol. Most of these steroids do not have any known clinical indications [6,5,15].
A new trend in AAS abuse is “design steroids” which are not commercially available and
intended to be undetectable in testing [16-18]. The first one discovered was norbolethone.
Two other steroids tetrahydrogestrinone (THG) and “madol” (DMT; 17α-methyl-5α-
androst-2-ene-17β-ol) have also been found. As with many “prohormones” their
effectiveness and toxicity is unclear. Figure 2 shows examples of structurally different
AAS.

16
Figure 2. Examples of different anabolic steroids.
O
OH
CH3
CH3
Bolasterone
O
OH
Boldenone
O
OH
CH3
Cl4-Chlorodehydro-methyltestosterone
O
OH
ClClostebol
O
OH
H
CH3
Drostanolone
OH
CH
NO
Danazol
OH
C2H5
Ethylestrenol
O
OH
CH3OH
F
Fluoxymesterone
O
OH
CH3OH
HC
O
Formebolone
OH
H
NO
N
CH3
Furazabol
OH
O
CH
GestrinoneO
OH
H
CH3
Mestanolone
O
OH
H
CH3
Mesterolone
O
OH
CH3
Methandienone
OH
OH
CH3
Methandriol
O
OH
H
CH3
Methenolone
O
OH
CH3
Methyltestosterone
O
OH
Nandrolone
O
OH
C2H5
Norethandrolone
O
O
OH
H
CH3
Oxandrolone
O
OH
CH3
OHOxymesterone
O
OH
H
CH
OH CH3
Oxymetholone
OH
H
CH3
NHN
Stanozolol
O
OH
H
CH3
Stenbolone
OH
O
C2H5
OH
O
Tetrahydrogestrinone TrenboloneTestosterone propionate
O
O COCH2CH3
O
OH
CH3
CH3
Bolasterone
O
OH
Boldenone
O
OH
CH3
Cl4-Chlorodehydro-methyltestosterone
O
OH
ClClostebol
O
OH
H
CH3
Drostanolone
OH
CH
NO
Danazol
OH
C2H5
Ethylestrenol
O
OH
CH3OH
F
Fluoxymesterone
O
OH
CH3OH
HC
O
Formebolone
OH
H
NO
N
CH3
Furazabol
OH
O
CH
GestrinoneO
OH
H
CH3
Mestanolone
O
OH
H
CH3
Mesterolone
O
OH
CH3
Methandienone
OH
OH
CH3
Methandriol
O
OH
H
CH3
Methenolone
O
OH
CH3
Methyltestosterone
O
OH
Nandrolone
O
OH
C2H5
Norethandrolone
O
O
OH
H
CH3
Oxandrolone
O
OH
CH3
OHOxymesterone
O
OH
H
CH
OH CH3
Oxymetholone
OH
H
CH3
NHN
Stanozolol
O
OH
H
CH3
Stenbolone
OH
O
C2H5
OH
O
Tetrahydrogestrinone TrenboloneTestosterone propionate
O
O COCH2CH3

17
2.1.4. Metabolism
The metabolism of AAS is extensive and follows that of testosterone and other steroids
[19]. The pathways include oxidation, reduction, hydroxylation and epimerization (phase
I reactions), and conjugation reactions forming glucuronide and sulphate conjugates
(phase II reactions). The metabolites are excreted in the urine and feces. Metabolism of
AAS has been comprehensively reviewed by many authors [15,20-22].
The most prominent targets for phase I metabolism are the A-, B- and D-rings. As with
testosterone, the double bond between C-4 and C-5 is reduced yielding 5α- and 5β-
isomers [20-22]. The extent of different isomers produced depends on the steroid. AAS
having the 1,4-diene structure (e.g. methandienone) do not give rise to 5α-isomers. In
general, the 1,4-diene structure renders the A-ring somewhat resistant to metabolic
reduction, the 1-ene group being particularly stable [15,20,21]. The keto group at C-3 is
also easily reduced, predominantly yielding the 3α-hydroxyl isomer [21,22]. Depending
on substituents in the A-ring, other A-ring metabolites can also be formed.
The most common metabolic change in the B-ring is 6β-hydroxylation that occurs for
many steroids having the 1,4-diene structure. Also other steroids whose metabolism in
the A-ring is hampered (e.g. fluoxymesterone) are subject to 6β-hydroxylation [20-22].
In the D-ring, the oxygen at C-17 is very sensitive to oxidoreductive reactions. Many
17β-hydroxysteroids are oxidized to 17-ketosteroids. The 17α-alkyl group, however,
prevents this reaction [15,20,21]. Oxidation of the 17β-hydroxyl group is reversible and
the extent of the equilibration depends on the other metabolic reactions. Enzymatic
conversion to 17α-hydroxy is not common and occurs only for a few steroids [21]. AAS
can also be metabolized through hydroxylation at C-16, yielding 16α- and 16β-isomers
[15,21]. For stanozolol, the 16β-hydroxy isomer is one of the main metabolites [20].
Most of the phase I metabolites are further metabolized by phase II reactions.
Conjugation with uridinediphosphate glucuronic acid and phosphoadenosine
phosphosulphate yields glucuronides and sulphates, respectively [21,22]. In man,
glucuronidation seems to be more important than sulphatation [21,22]. Conjugation
occurs mainly at the A- or D-ring. 3α-hydroxysteroids are mainly conjugated with
glucuronic acid and 3β-hydroxysteroids with sulphate [21]. 17β-hydroxysteroids can be
conjugated with both glucuronic acid and sulphate. In the case of stanozolol, N-
glucuronidation may also occur [15,22]. Glucuronidation of the 17β-hydroxy group of
17α-methyl steroids is uncommon because of sterical hindrance. 17-methyl steroids are
18
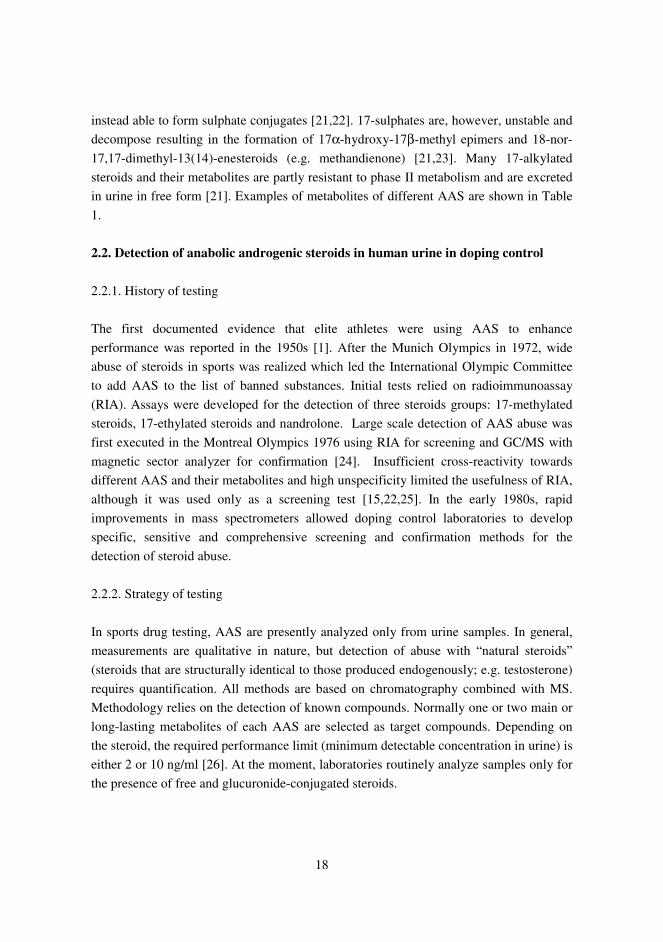
instead able to form sulphate conjugates [21,22]. 17-sulphates are, however, unstable and
decompose resulting in the formation of 17α-hydroxy-17β-methyl epimers and 18-nor-
17,17-dimethyl-13(14)-enesteroids (e.g. methandienone) [21,23]. Many 17-alkylated
steroids and their metabolites are partly resistant to phase II metabolism and are excreted
in urine in free form [21]. Examples of metabolites of different AAS are shown in Table
1.
2.2. Detection of anabolic androgenic steroids in human urine in doping control
2.2.1. History of testing
The first documented evidence that elite athletes were using AAS to enhance
performance was reported in the 1950s [1]. After the Munich Olympics in 1972, wide
abuse of steroids in sports was realized which led the International Olympic Committee
to add AAS to the list of banned substances. Initial tests relied on radioimmunoassay
(RIA). Assays were developed for the detection of three steroids groups: 17-methylated
steroids, 17-ethylated steroids and nandrolone. Large scale detection of AAS abuse was
first executed in the Montreal Olympics 1976 using RIA for screening and GC/MS with
magnetic sector analyzer for confirmation [24]. Insufficient cross-reactivity towards
different AAS and their metabolites and high unspecificity limited the usefulness of RIA,
although it was used only as a screening test [15,22,25]. In the early 1980s, rapid
improvements in mass spectrometers allowed doping control laboratories to develop
specific, sensitive and comprehensive screening and confirmation methods for the
detection of steroid abuse.
2.2.2. Strategy of testing
In sports drug testing, AAS are presently analyzed only from urine samples. In general,
measurements are qualitative in nature, but detection of abuse with “natural steroids”
(steroids that are structurally identical to those produced endogenously; e.g. testosterone)
requires quantification. All methods are based on chromatography combined with MS.
Methodology relies on the detection of known compounds. Normally one or two main or
long-lasting metabolites of each AAS are selected as target compounds. Depending on
the steroid, the required performance limit (minimum detectable concentration in urine) is
either 2 or 10 ng/ml [26]. At the moment, laboratories routinely analyze samples only for
the presence of free and glucuronide-conjugated steroids.

19
Table 1. Examples of metabolites of different AAS.
Parent steroid Metabolite______________________________________________________________________________________Bolasterone 7α,17α-dimethyl-5β-androstan-3α,17β-diol (C)
Boldenone parent (C), 5β-androst-1-ene-17β-ol-3-one (C)
Calusterone 7β,17α-dimethyl-5α-androstan-3α,17β-diol (C)
4-Chlorodehydromethyltestosterone 6β-hydroxy-4-chlorodehydromethyltestosterone (F)
Clostebol 4-chloro-androst-4-en-3α-ol-17-one (C)
Danazol Ethisterone (F,C)
Drostanolone 2α-methyl-5α-androstan-3α-ol-17-one (C)
Ethylestrenol 17α-ethyl-5β-estran-3α,17β-diol (C)
Fluoxymesterone 9α-fluoro-17α-methyl-androst-4-ene-
-3α,6β,11β,17β-tetrol (F)
Formebolone 2-hydroxymethyl-17α-methyl-androsta-
-1,4-diene-11α,17β-diol-3-one (F)
Furazabol parent (C), 16β-hydroxyfurazabol (C)
Gestrinone parent (C)
Mestanolone 17α-methyl-5α-androstan-3α,17β-diol (C)
Mesterolone 1α-methyl-5α-androstan-3α-ol-17-one (C)
Methandienone 6β-hydroxymethandienone (F), 17-epimethandienone (F),
17α-methyl-5β-androstan-3α,17β-diol (C)
17β-methyl-5β-androst-1-ene-3α,17α-diol (C)
Methenolone parent (C), 1-methylene-5α-androstan-3α-ol-17-one (C)
Methandriol 17α-methyl-5β-androstan-3α,17β-diol (C)
Methyltestosterone 17α-methyl-5α-androstan-3α,17β-diol (C)
17α-methyl-5β-androstan-3α,17β-diol (C)
Mibolerone 7α,17α-dimethyl-5β-estran-3α,17β-diol (C)
Nandrolone 5α-estran-3α-ol-17-one (C), 5β-estran-3α-ol-17-one (C)
Norclostebol 4-chloro-estr-4-ene-3α-ol-17-one (C)
Norethandrolone 17α-ethyl-5β-estran-3α,17β-diol (C)
Oxandrolone parent (F), 17-epioxandrolone (F)
Oxymesterone parent (C)
Oxymetholone 17α-methyl-5α-androstan-3α,17β-diol (C)
Quinbolone 5β-androst-1-ene-17β-ol-3-one (C)
Stanozolol 3’-hydroxystanozolol (F,C), 16β-hydroxystanozolol (C)
Stenbolone 2α-methyl-5α-androst-1-ene-3α-ol-17-one (C)
Tetrahydrogestrinone (THG) parent (C)
Trenbolone 17-epitrenbolone (C)______________________________________________________________________________________
F=excreted in urine in free form; C=excreted as glucuronide

20
The analytics of AAS as well as of other banned substances is divided into two
categories, i.e. screening procedures and methods of confirmatory analysis [15,25,27].
The aim of screening is to reveal suspicious samples for further analysis. An ideal
screening method should be simple, fast, selective, sensitive and not prone to waste the
sample unnecessarily. Because of the large number of banned substances, multi-analyte
screening methods are favored in order to keep the number of separate procedures at the
minimum.
All presumptive positive samples found by screening are confirmed by reanalyzing them
concomitantly with a drug-free sample and with appropriate reference samples using
highly specific and sensitive analytical methods. Drugs are verified by their
chromatographic retention times and mass spectral properties compared to reference
compounds [15,25,27]. Measurements in confirmation are recommended to be performed
in full scan mode but confirmation of low concentrations is permissible using monitoring
of selected ions. Criteria of identification are strictly specified in order to harmonize the
practice and to ensure defensible results [28].
2.2.3. Analytical methods
GC/MS
The basic method to detect AAS was developed by Donike et al. [29,30]. Analyses were
performed on a bench-top quadrupole MS (electron ionization a.k.a EI, monitoring of
positive ions) coupled with capillary GC. Steroids were cleaned up on a XAD-2 solid
phase material, followed by hydrolysis of conjugated metabolites using β-glucuronidase
enzyme and liquid-liquid extraction (LLE) with diethyl ether at alkaline pH. Prior to
GC/MS in selected ion monitoring mode (SIM), steroids were derivatized with a mixture
of N-methyl-N-(trimethylsilyl)trifluoroacetamide (MSTFA), trimethyliodosilane and an
antioxidant to convert steroid hydroxyl and keto groups to their unique trimethylsilyl
(TMS) ethers and enol ethers [31,32]. Steroids excreted unconjugated in urine (free
steroids) were analyzed separately by extracting urine samples directly or after XAD-2
clean-up with diethyl ether at basic pH, followed by selective derivatization resulting in
the formation of O-TMS derivatives, and in the case of stanozolol, the N-
heptafluorobutyryl (HFB) -O-TMS derivative [25,27,30,32]. Modifications from the
original method include e.g. solid phase extraction (SPE) with C18 cartridges, LLE with
tertbutyl methyl ether and combination of sample pretreatment and analysis of free and
conjugated steroids [25,27,33-36]. The latest variation includes direct hydrolysis of urine,
followed by LLE and derivatization using deuterated androsterone glucuronide and

21
etiocholanolone for quality assurance [37]. A typical GC/MS-SIM run takes 20-30 min
and incorporates 10-15 time-programmed acquisition groups of 15-20 ions. Depending
on the steroid, limits of detection (LOD) between 2-30 ng/ml can be achieved [15,38,39].
Negative and positive ion chemical ionization has been applied for HFB,
pentafluoropropionyl, methoxy-TMS or TMS derivatives of many AAS metabolites but
without significant enhancement in sensitivity [40-42]. Since sufficient LOD are not
achieved for all steroids with the basic method, laboratories have been obliged to search
complementary analytical methods to screen and confirm steroids.
GC/HRMS
LOD of AAS can be improved through more selective detection techniques, such as
GC/HRMS-SIM [43-46]. In the applications magnetic sector mass spectrometers have
been operated at moderate resolution (3000-6000) which dramatically increases
selectivity of detection. Mueller et al. have demonstrated how fully co-eluted TMS
derivatives of norandrosterone (m/z 420.215) and the vitamin E metabolite (m/z 420.288)
can be separated using GC/HRMS with resolution of 6000 [46]. HRMS has enabled
routine screening of many AAS at urinary concentrations lower than 2 ng/ml. Combined
with extensive sample clean-up procedures, such as immunoaffinity chromatography and
LC fractionation, the technique has proved to be very useful in analyzing and
identification of long-lasting metabolites of stanozolol and methandienone; out of 116
positive cases found in testing of 6700 samples, 75 were detected solely by GC/HRMS
[44]. Fewer studies exist in which the efficiency of GC/HRMS and GC/LRMS for the
detection of structurally different AAS has directly been compared with each other.
GC/MS/MS
Enhancement in sensitivity and selectivity have also been obtained using MS/MS by
monitoring selected product ions formed in collision-induced dissociation of a precursor
ion [47-50]. Most steroids could be analyzed at concentrations lower than the required
performance limits of 2 and 10 ng/ml. Improvement in LOD for norandrosterone was, for
instance, 100-fold over SIM on a quadrupole mass filter [48]. Along with a better
selectivity the overall analysis time could outstandingly be shortened. Marcos et al. have
described a GC/MS/MS method in which over 40 different AAS or their metabolites
could be analyzed within 8 minutes [50]. MS/MS measurements of AAS have been
mostly carried out with quadrupole ion trap instruments [47-50]. In addition to screening
purposes, ion trap MS has been used in confirmatory analysis in both MS/MS and
MS/MS/MS mode [48,49]. Buiarelli et al. have confirmed metabolites of
methandienone, methyltestosterone, nandrolone and stanozolol in urine at levels below 2

22
ng/ml using a GC/hybrid MS/MS system including a magnetic sector HRMS and a time
of flight mass spectrometer (TOFMS) [51].
LC/MS based methods
LC/MS, especially LC/MS/MS, has been applied to the detection and confirmation of
AAS and their metabolites in human urine. Particle beam ionization was used to
determine 28 different AAS and their metabolites in hydrolyzed urine extracts [52].
Hydrolyzed metabolites of stanozolol and methandienone have been identified in human
urine by APCI-MS/MS [53,54]. Gestrinone, THG and their metabolites have been
detected by ESI-MS/MS, the LOD for THG being less than 0.5 ng/ml [17,55,56].
Recently, a novel screening of unknown AAS in urine was presented based on ESI-
MS/MS utilizing precursor ion scans of product ions generated by common steroid nuclei
[57]. The recently introduced APPI has proved to be a potential ionization method for a
diverse number of analytes including steroids, but has hitherto not been employed for the
detection of AAS in human urine [58,59]. Nielen et al. have successfully used accurate
mass LC/ESI-TOFMS in screening and identification of AAS in illegal cocktails [60].
Preliminary studies indicate that the approach is equally suitable for screening of trace
levels of AAS metabolites in human urine [61]. LC/MS has also allowed direct
measurement of steroid conjugates in urine. Intact glucuronide and sulphate conjugates of
testosterone and epitestosterone have been quantified using ESI-MS/MS [62,63]. An ESI
method for simultaneous measurement of 12 different AAS glucuronides in urine (LOD
2-250 ng/ml) has also been introduced [64]. In conclusion, LC/MS has potential in AAS
analytics and overcomes many of the problems associated with GC methods, i.e.
derivatization steps, adsorption of steroids, and their thermal decomposition during
analysis. However, no comparative studies exist concerning the suitability of different
ionization techniques for the detection of AAS in human urine and for a systematic
development of a multi-analyte screening method for sports drug testing.
Improved sample preparation
Lower detection limits and better selectivity could also be achieved with improved
sample clean-up strategies in order to eliminate interferences due to the urine matrix. This
approach is generally used especially in confirmatory analysis since the procedures are
often not universal but rather compound- or group-specific. Immunoaffinity
chromatography has been utilized to clean up urine samples for GC/LRMS and HRMS
analysis of metabolites of stanozolol and nandrolone [45,65,66]. LC fractionation has
been employed as an additional sample purification step in GC/HRMS analysis of
methandienone metabolites and GC/MS/MS and GC/MS analysis of metabolites of
stanozolol, nandrolone, methyltestosterone and methandienone, allowing the acquisition

23
of full scan spectra even at 2 ng/ml [45,67,68]. LLE with n-pentane and SPE with amino
columns have been reported to clearly improve the quality of chromatographic signals
and mass spectra in GC/MS analysis of non-polar steroids [69,70]. Recently, LPME has
been applied in the LC/ESI-MS/MS analysis of intact steroid glucuronides in urine and
shown the best selectivity and cleanest ion chromatograms compared with SPE and LLE
[64]. In LPME analytes from an aqueous sample are first extracted into an organic
solvent in the pores of a porous hollow polypropylene fiber and subsequently into the
acceptor phase inside the lumen of the fiber [71,72]. The acceptor phase can be organic
(two-phase LPME) or aqueous (three-phase LPME). Basically, LPME offers many
advantages over traditional extraction methods. The degree of pre-concentration is
normally high, sample clean-up is efficient and the number of separate stages in sample
preparation is minimal [71,72]. Until now, LPME has not been applied to sample
preparation of unconjugated AAS in urine.
Chemometric resolution of mass spectral data
GC/MS and LC/MS are used in the full scan mode to identify and confirm known and
unknown compounds. Acquired spectra are often “contaminated” with extraneous mass
spectral peaks arising from co-eluting substances and chromatographic background. The
uncertainty in the origin of mass spectral peaks leads to a loss of confidence in the
reliability of making identifications, especially for trace components in complex
mixtures. The quality of mass spectra can be improved by classical means, e.g. selective
sample pretreatment, careful optimization of chromatographic separation and manual
subtraction of background spectrum or spectrum of disturbing substance from the
spectrum of the target compound. Unfortunately, these attempts might often be
unsatisfactory.
The quality of extracted mass spectra can substantially be improved by means of
chemometrics – a branch of chemistry that uses mathematical and statistical methods to
interpret complex chemical measurements [73]. The data acquired can be resolved into
spectra and elution profiles of single components by multivariate techniques even though
the chromatographic separation of compounds is not complete. Several different
mathematical and statistical methods have been proposed [73-80]. In most approaches
chromatographic/mass spectrometric data set is considered as a two-dimensional matrix
from which the number of components, the spectrum and the elution profile of each
component are resolved. In addition to the numerous published methods, also commercial
programs exist, e.g. MS Resolver and Xtricator (Pattern Recognition Systems, Bergen,
Norway) and Automated Mass Spectral Deconvolution and Identification System –
AMDIS (National Institute of Standards and Technology, Gaithersburg, MD, USA).

24
All introduced resolution methods are basically universal and can be used for any two-
way data regardless of the hyphenated instrument utilized. The functionality of different
methods may, however, vary and depend on the case (e.g. complexity of sample matrix,
degree of overlapping of peaks, spectral dissimilarities and concentration differences
between components) [75,81,82]. Among the applications, steroids have been identified
from different sample matrices [76,83,84]. In spite of their usefulness, deconvolution
methods are endowed with some problems and limitations. Chromatographic overlapping
of peaks can be so severe and complex that the components cannot be separated.
Conversion of original measurement data to a proper format for calculations is not
necessarily easy. Moreover, precise evaluation of the reliability and quality of the results
and possible error propagation of the calculations is a problem in many algorithms [75].
Application of the methods is often cumbersome in practice. A great deal of human
intervention is needed to define settings before and during the resolution procedure [75].
In many methods, selection of “the best fit” has also been entrusted to the operator with a
consequent reduction in the objectivity of the process.
Detection of abuse of “natural steroids”
Detection of doping with steroids that are structurally identical to those produced in the
body (e.g. testosterone, DHEA, dihydrotestosterone a.k.a. DHT, 4-androstenedione) is a
special case and a challenging task in sports drug testing, since their origin (endogenous
or exogenous) is difficult to prove.
Abuse of these steroids has been detected indirectly by measuring changes in absolute
and relative concentrations of different endogenous steroids (steroid profile) in urine
[15,85-87]. The basic test successfully used for detection of testosterone administration is
based on the determination of the ratio to its 17α-epimer, epitestosterone [88]. At present,
the cut-off level for testosterone to epitestosterone ratio is 4:1 [86]. In a similar manner,
administration of DHT can be detected using DHT to epitestosterone ratio or the ratio of
DHT metabolite, 5α-androstan-3α,17β-diol to its 5β-isomer [89]. Quantification can be
carried out with the same GC/MS methods that are used for qualitative analysis of other
AAS. All indirect tests rely on statistical population-based reference values and further
individual investigations are often needed to exclude the possibility of an abnormal
physiological or pathological condition [15,87,90].
Doping with testosterone and many other natural steroids can be confirmed directly by
means of gas chromatography/combustion/carbon isotope ratio mass spectrometry [91-
95]. The approach is based on the fact that chemically manufactured and endogenously

25
produced steroids have small differences in their carbon isotope (13C/12C) ratio.
Chemically manufactured steroids are synthesized from certain plant sterols that have
low 13C content, while the 13C content of human body is higher and reflects the diet. In
the assay, the 13C/12C ratio is determined from possibly administered steroids or their
metabolites (e.g. androsterone, etiocholanolone, 5α-androstan-3α,17β-diol, 5β-
androstan-3α,17β-diol) and compared with the 13C/12C ratio of other endogenous steroids
that are not affected by the administrated steroid (e.g. pregnandiol, 11-
ketoetiocholanolone). The results will be reported as consistent with steroid
administration provided that the 13C/12C value measured for the metabolite differs by 3
delta units or more from that of the endogenous reference steroid [85].

26
3. AIMS OF THE STUDY
The primary aim of the work was to investigate the applicability and exploitability of
different modern analytical techniques and methods for the mass spectrometric detection
of AAS in human urine in order to enhance the prevalent analytics and to find reasonable
strategies for effective sports drug testing.
Specifically, the aims of the research were
• to study the influence of detection and extraction methods on GC/MS analysis of
urinary AAS by performing a comparative study of the sensitivity and specificity
between GC/LRMS and GC/HRMS methods and by studying the applicability of in-
vial two-phase LPME for the sample preparation of AAS (I, II)
• to investigate the applicability of LC/MS for the detection of urinary AAS by
developing and testing of three LC/MS methods employing different ionization
techniques (ESI, APCI and APPI) for the purpose of introducing a routine screening
method for the free anabolic steroid fraction (III, IV)
• to study and demonstrate the potential of chemometrics to resolve complex analytical
data obtained from the full scan GC/MS analysis of urine samples prepared for
analysis of anabolic steroids (V)
27
4. MATERIALS AND METHODS
The major experimental features of the study are briefly described in this section. The
detailed descriptions can be found in the original publications I-V.
4.1. Steroids and reagents
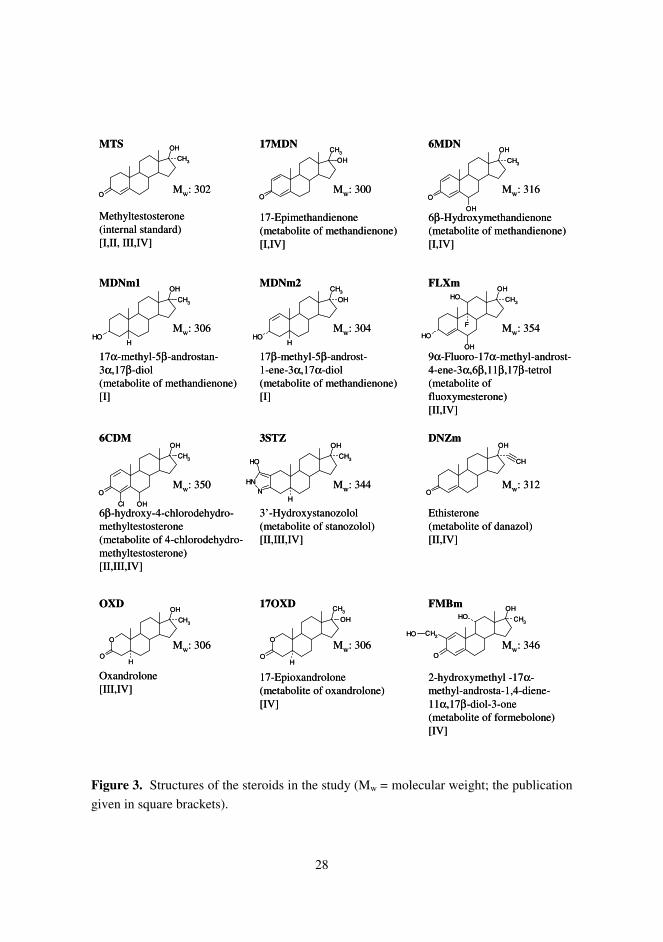
The steroids used in the study are presented in Figure 3; the selected analytes represent
structurally different 17-alkylated AAS with different polarities. The steroids were
purchased from National Analytical Reference Laboratory (NARL, Pymble, Australia)
and Steraloids (Newport, RI, USA) or were synthesized and donated by Laboratory for
Doping Analysis, German Sports University Cologne, Institute of Biochemistry. All
reagents and solvents were either of HPLC or analytical grade.
4.2. Instrumentation
GC/MS and LC/MS instrumentation is presented in Table 2. GC separations were carried
out on an Agilent HP-1 fused silica capillary column (16 m x 0.2 mm i.d., film thickness
of 0.11 μm) using helium as carrier gas. The LC column was a LiChroCART Purospher
PR C-18e, 125 x 3 mm (5 μm) column (Merck, Darmstadt, Germany) equipped with a 4
mm x 4 mm pre-column of the same stationary phase.
28
Figure 3. Structures of the steroids in the study (Mw = molecular weight; the publication
given in square brackets).
O
OH
CH3
Methyltestosterone(internal standard)[I,II, III,IV]
O
O
OH
H
CH3
Oxandrolone[III,IV]
O
CH3
OH
17-Epimethandienone(metabolite of methandienone)[I,IV]
OH
OH
CH3
H
17α-methyl-5β-androstan-3α,17β-diol(metabolite of methandienone)[I]
OH
CH3
OH
H
17β-methyl-5β-androst-1-ene-3α,17α-diol(metabolite of methandienone)[I]
O
OH
CH3
OH
6β-Hydroxymethandienone(metabolite of methandienone)[I,IV]
OH
OH
CH3OH
F
OH
9α-Fluoro-17α-methyl-androst-4-ene-3α,6β,11β,17β-tetrol(metabolite offluoxymesterone)[II,IV]
O
OH
CH3
Cl OH
6β-hydroxy-4-chlorodehydro-methyltestosterone(metabolite of 4-chlorodehydro-methyltestosterone)[II,III,IV]
OH
H
CH3
NHN
OH
3’-Hydroxystanozolol(metabolite of stanozolol)[II,III,IV]
OH
CH
O
Ethisterone(metabolite of danazol)[II,IV]
O
O
CH3
H
OH
17-Epioxandrolone(metabolite of oxandrolone)[IV]
O
OH
CH3OH
CH2OH
2-hydroxymethyl -17α-methyl-androsta-1,4-diene-11α,17β-diol-3-one(metabolite of formebolone)[IV]
MTS 17MDN 6MDN
MDNm1 MDNm2 FLXm
6CDM 3STZ DNZm
OXD 17OXD FMBm
Mw: 302
Mw: 354
Mw: 316
Mw: 346
Mw: 350
Mw: 306 Mw: 306
Mw: 344 Mw: 312
Mw: 300
Mw: 304Mw: 306
O
OH
CH3
Methyltestosterone(internal standard)[I,II, III,IV]
O
O
OH
H
CH3
Oxandrolone[III,IV]
O
CH3
OH
17-Epimethandienone(metabolite of methandienone)[I,IV]
OH
OH
CH3
H
17α-methyl-5β-androstan-3α,17β-diol(metabolite of methandienone)[I]
OH
CH3
OH
H
17β-methyl-5β-androst-1-ene-3α,17α-diol(metabolite of methandienone)[I]
O
OH
CH3
OH
6β-Hydroxymethandienone(metabolite of methandienone)[I,IV]
OH
OH
CH3OH
F
OH
9α-Fluoro-17α-methyl-androst-4-ene-3α,6β,11β,17β-tetrol(metabolite offluoxymesterone)[II,IV]
O
OH
CH3
Cl OH
6β-hydroxy-4-chlorodehydro-methyltestosterone(metabolite of 4-chlorodehydro-methyltestosterone)[II,III,IV]
OH
H
CH3
NHN
OH
3’-Hydroxystanozolol(metabolite of stanozolol)[II,III,IV]
OH
CH
O
Ethisterone(metabolite of danazol)[II,IV]
O
O
CH3
H
OH
17-Epioxandrolone(metabolite of oxandrolone)[IV]
O
OH
CH3OH
CH2OH
2-hydroxymethyl -17α-methyl-androsta-1,4-diene-11α,17β-diol-3-one(metabolite of formebolone)[IV]
MTS 17MDN 6MDN
MDNm1 MDNm2 FLXm
6CDM 3STZ DNZm
OXD 17OXD FMBm
Mw: 302
Mw: 354
Mw: 316
Mw: 346
Mw: 350
Mw: 306 Mw: 306
Mw: 344 Mw: 312
Mw: 300
Mw: 304Mw: 306

29
Table 2. Instrumentation used in the experimental work.
Chromatographs Mass spectrometers
HP 5890 Series II gas chromatograph
(Hewlett-Packard, Palo Alto, CA, USA) [I]
JEOL SX 102 double focusing mass
spectrometer (JEOL, Tokyo, Japan) [I]
HP 5890E gas chromatograph
(Hewlett-Packard, Palo Alto, CA, USA) [I, V]
HP 5972A quadrupole mass spectrometer
(Hewlett-Packard, Palo Alto, CA, USA) [I, V]
Agilent 6890 gas chromatograph
(Agilent Technologies, Palo Alto, CA, USA)
[II]
Agilent 5973N quadrupole mass spectrometer
(Agilent Technologies, Palo Alto, CA, USA)
[II]
Perkin-Elmer Series 200 liquid chromatograph
(Perkin-Elmer, Norwalk, CT, USA) [II, III]
Perkin-Elmer Sciex API 300 triple quadrupole
mass spectrometer (Perkin-Elmer Sciex,
Concord, ON, Canada) [II, III]
HP 1100 liquid chromatograph (Hewlett-
Packard, Waldbronn, Germany) [III, IV]
Perkin-Elmer Sciex API 3000 triple quadrupole
mass spectrometer (Perkin-Elmer Sciex,
Concord, ON, Canada) [IV]
4.3. Comparison of GC/LRMS and GC/HRMS methods (I)
Comparison of GC/LRMS and GC/HRMS was carried out with four metabolites of
methandienone (MDNm1, MDNm2, 6MDN and 17MDN) using MTS as internal
standard. Urine samples (2.5 ml) were pretreated according to a standard procedure used
in screening of AAS in urine, consisting of SPE in C18 cartridges, hydrolysis with β-
glucuronidase, LLE with diethyl ether at basic pH, and trimethylsilylation [20]. The
analytes (0.2 – 10 ng/ml) were spiked in pooled drug-free urine after extraction. Blank
urine samples and spiked samples were analyzed with both methods. EI was used for
ionization and two ions per each metabolite were monitored using SIM. The HRMS
instrument was operated at a resolution of 5000 and the LRMS instrument at unit
resolution. Except for mass resolution, the run conditions were identical in both methods.
The methods were compared with respect to specificity and detection limit.
4.4. In-vial two-phase LPME method with in-fiber silylation for sample preparationin GC/MS analysis (II)
Four metabolites of different AAS were used as test compounds (6CDM, DNZm, FLXm
and 3STZ) and MTS as internal standard. The LPME set-up was based on the procedure

30
of Rasmussen et al. [72]. The influence of different parameters on the LPME process,
including the nature of organic solvent, extraction time, salting-out, mixing and
temperature, was first investigated using LC/MS detection with samples spiked in
artificial urine. Based on the optimization studies, a novel LPME method utilizing
simultaneous in-fiber silylation was developed for direct GC/MS of steroids in urine.
Urine samples (2 ml) were hydrolyzed enzymatically and then buffered at basic pH. A 6-
cm piece of porous hollow polypropylene fiber (600 μm i.d., 800 μm o.d., pore size 0.2
μm) was preconditioned with dihexyl ether, filled with the silylation reagent and
introduced into the sample solution. After a 30-min incubation at 45°C, a portion of the
silylation reagent was injected directly into GC/MS. GC/MS was operated in the EI mode
using SIM of three ions for the analyte. The method was validated with respect to LOD,
linearity, extraction recovery, specificity, precision and accuracy using samples prepared
in drug-free urine. The method was finally compared with a conventional sample
preparation procedure comprising enzymatic hydrolysis, LLE and a separate silylation
step [37].
4.5. Comparison of LC/MS/MS methods based on different ionization techniques(III)
Three different AAS (6CDM, OXD and 3STZ ) were used as test compounds and MTS
as internal standard. Positive ion ESI- APCI- and APPI-MS/MS methods were developed
and optimized regarding eluent composition, ion source parameters and fragmentation
using direct inlet injection. MS was operated in either scan or product ion scan mode.
Solvent systems were based on 50:50 (v/v) methanol-water, containing none, 0.1 or
0.01% (v/v) acetic acid either with or without 5 mM ammonium acetate. In ESI
experiments, the orifice and spray needle voltages were optimized. APCI optimization
included testing of the discharge needle current, the orifice potential and the probe
temperature. The APPI system was optimized with respect to the orifice voltage, the
probe temperature and the dopant type and its flow rate. In the MS/MS studies, nitrogen
was used as collision gas. Collision offset voltages were optimized in order to find two
appropriate product ions per each compound for multiple reaction monitoring (MRM).
LC separations were carried out on a reverse phase column with a water/methanol –based
gradient selected on the basis of the solvent composition optimization described above.
Each optimized LC/MS/MS method was evaluated with respect to specificity and LOD
by analyzing drug-free urine samples and standards prepared in extracted pooled drug-
free urine (0.7 – 77 ng/ml). The methods were also tested with authentic forensic urine

31
samples, known to contain the substances in question. Sample pretreatment comprised
LLE of urine (5 ml) with diethyl ether at basic pH [20].
4.6. LC/ESI-MS/MS method for screening of unconjugated anabolic androgenicsteroids (IV)
Based on the comparison of different LC/MS/MS methods described in the preceding
chapter, a qualitative LC-ESI/MS/MS method for routine screening of the free steroid
fraction was developed and evaluated. 6CDM, DNZm, FLXm, FMBm, 6MDN, 17MDN,
OXD, 17OXD and 3STZ were used as target compounds and MTS as internal standard.
Compounds were ionized in the positive ion mode and detected by MRM of two product
ions for each analyte. Selection of product ions and precursor ions and optimization of
collision offset voltages was performed by flow injection studies collecting full scan mass
spectra.
In the final method, urine samples (2.5 ml) were extracted in the same way as described
in chapter 4.5. Chromatographic separation was achieved on a reversed-phase column
with methanol-water gradient containing 5 mmol/l ammonium acetate and 0.01 % (v/v)
acetic acid. The method was validated with respect to LOD, linearity, extraction
recovery, specificity, precision and accuracy using samples prepared in drug-free urine.
The method was finally tested with authentic forensic urine samples containing
metabolites of danazol, fluoxymesterone and methandienone.
4.7. Chemometric resolution of the full scan mass spectral data into components (V)
The study was carried out with drug-free urine samples collected from twenty
individuals. Samples (2.5 ml) were pretreated according to a standard sample procedure
used in screening of AAS in urine, consisting of SPE in C18 cartridges, hydrolysis with
β-glucuronidase, LLE with diethyl ether at basic pH, and trimethylsilylation [20,30].
Samples were analyzed using GC/MS. The mass spectrometer was operated in the EI
mode and full scan spectral data were acquired over a range of m/z 40-700. The data
were analyzed using MATLAB (The MathWorks Inc., Natick, MA, USA) programs. The
binary data files from the instrument were converted into the matrix format using a
customized conversion routine written in MATLAB. The deconvolution method used
was OSCAR (Optimization by Stepwise Constraints of Alternating Regression)
developed by E.J. Karjalainen and U.P. Karjalainen [74]. The ability of the deconvolution
process to find components and extract “pure” mass spectra from complex
chromatograms and the reproducibility of the results was tested and demonstrated.

32
5. RESULTS AND DISCUSSION
The salient results obtained in the study are briefly described and discussed in this
section. More details can be found in the original publications I-V.
5.1. Comparison of GC/LRMS and GC/HRMS methods (I)
The following ions (m/z) were selected for the HRMS method: 435.3115 and 360.2848
for MDNm1, 358.2692 and 216.1909 for MDNm2, 532.3224 and 517.2990 for 6MDN,
and 444.2880 and 339.2144 for 17MDN. The ions were chosen on the basis of their mass
and intensity, taking into account that in HRMS-SIM with electric field switching, the
mass range analyzed is favorably narrow to attain the best sensitivity. In the LRMS
method the above ions were monitored as integer masses.
Selectivity and detection power of the methods were evaluated with blank urine samples
and spiked samples (0.2, 0.5, 1, 5 and 10 ng/ml). The standards were prepared in
extracted and pooled drug-free urine (seven males) to exclude the effect of sample
pretreatment. The signal-to-noise ratios (S/N) of different metabolites at different
concentrations were calculated and results were compared with S/N values calculated
from blank urines. Criterion for detection limit was three times the S/N value of the
blank. The results are presented in Tables 3 to 6.
In the detection of MDNm1, the HRMS method proved to be better than the LRMS
method (Table 3). In both methods, blank urine yielded an interfering peak that disturbed
the detection. When monitoring the ion m/z 435, the above defined criterion for detection
limit was met with spike 0.5 ng/ml using HRMS and with spike 5 ng/ml using LRMS.
With the ion m/z 360 the detection limit using HRMS was 10-fold higher. This does,
however, not restrict the use of the method for screening purposes since one specific ion
per target compound is sufficient.
The advantage of the HRMS method was best seen in analyzing MDNm2 (Table 4 and
Figure 4). By monitoring ion m/z 358 the biological background was extremely low with
no interfering peaks and a concentration of 0.2 ng/ml could be detected. With LRMS, the
biological background hampered the analysis and the detection limit criterion was
fulfilled with spike 5 ng/ml. With the ion m/z 216 an intensive peak from the urine matrix
coeluted with the analyte in both methods. Analysis of MDNm2 in monitoring of
methandienone abuse is important, since the metabolite is excreted in urine for long after

33
stopping the administration of the drug [45]. The minimum detection limit 2 ng/ml set by
WADA was easily achieved with the HRMS method.
In the analysis of 6MDN, coeluting substances from the urine matrix were observed with
both methods. In spite of this, the metabolite could be detected from the spike 0.2 ng/ml
using HRMS and from the spike 0.5 ng/ml using LRMS by monitoring ion m/z 517
(Table 5). Detectability of the metabolite by using ion m/z 517 was clearly better than
with ion m/z 432. This is due to the fact that in the MS spectrum m/z 517 is ten times
more intensive ion than ion m/z 432.
Also in the analysis of 17MDN in both methods blank urine contained an interfering
compound that eluted close to the expected retention time of the metabolite. However,
with HRMS, monitoring for ion m/z 444, the metabolite could be distinguished from the
background in the analysis of the spike 0.2 ng/ml (Table 6). With LRMS, the detection
criterion was met with the spike 5 ng/ml. The results obtained by using signal m/z 339
were 5 ng/ml in both methods.
The experiments proved that the HRMS method is clearly more efficient than the LRMS
method for the detection of methandienone metabolites in urine. The improved detection
was due to the reduction of biological background. Due to the better selectivity, the
interpretation of data was much easier compared with the LRMS method. However, also
with the HRMS method the biological background slightly hampered the analysis of
some metabolites. This could probably be depressed by increasing resolution, which
would on the other hand decrease signal intensity. Interference of the urine matrix may
also be reduced by changing the ions used for SIM. Selection of the resolution of 5000
was based on previous studies [43-46]. The advantage of HRMS over LRMS in AAS
analysis has previously been demonstrated for MDMm2, norandrosterone, 3STZ and 4β-
hydroxystanozolol [44,45]. In this study it was observed that at least for the metabolites
of methandienone the improvement in detection depends on the steroid in question and
the ions selected for monitoring. Even with the HRMS method, comprehensive sample
clean-up procedures might be needed especially in confirmatory analysis because of the
presence of overlapping peaks originating from the complex urine matrix.

34
Table 3. S/N values for MDNm1 spiked in urine at different concentrations and
measured using two specific ions by GC/HRMS-SIM and GC/LRMS-SIM.
HRMS LRMS
Concentrationof spiked
metabolite(ng/ml)
S/N
m/z 435.3115
Mean (CV%)
S/N
m/z 360.2848
Mean (CV%)
S/N
m/z 435
Mean (CV%)
S/N
m/z 360
Mean (CV%)
0 19 (23) 32 (17) 9 (11) ND0.2 51 (7) 33 (3) 12 (5) ND
0.5 57 (9) 41 (7) 14 (7) ND
1 70 (4) 51 (2) 16 (6) ND
5 208 (1) 116 (5) 35 (4) 3 (6)
10 371 (3) 194 (2) 51 (4) 5 (4)
S/N values are expressed as mean value and coefficient of variation (CV) of four repeated injections.
(ND = no peak separable from the background noise was detected)
Table 4. S/N values for MDNm2 spiked in urine at different concentrations and
measured using two specific ions by GC/HRMS-SIM and GC/LRMS-SIM.
HRMS LRMS
Concentrationof spiked
metabolite(ng/ml)
S/N
m/z 358.2692
Mean (CV%)
S/N
m/z 216.1909
Mean (CV%)
S/N
m/z 358
Mean (CV%)
S/N
m/z 216
Mean (CV%)
0 ND 97 (4) 3 (15) 10 (10)0.2 3 (9) 96 (16) 4 (10) 12 (8)
0.5 5 (13) 143 (15) 5 (6) 13 (8)
1 8 (15) 154 (10) 7 (5) 16 (6)
5 22 (14) 320 (9) 21 (2) 26 (4)
10 44 (9) 590 (2) 32 (3) 38 (3)
S/N values are expressed as mean value and coefficient of variation (CV) of four repeated injections.
(ND = no peak separable from the background noise was detected)

35
Table 5. S/N values for 6MDN spiked in urine at different concentrations and measured
using two specific ions by GC/HRMS-SIM and GC/LRMS-SIM.
HRMS LRMS
Concentrationof spiked
metabolite(ng/ml)
S/N
m/z 517.2990
Mean (CV%)
S/N
m/z 532.3224
Mean (CV%)
S/N
m/z 517
Mean (CV%)
S/N
m/z 532
Mean (CV%)
0 ND ND 2 (12) ND0.2 16 (9) ND 5 (6) ND
0.5 27 (9) ND 14 (4) ND
1 48 (3) ND 29 (5) 3 (7)
5 251 (2) 18 (3) 167 (4) 6 (9)
10 473 (7) 31 (10) 268 (3) 10 (5)
S/N values are expressed as mean value and coefficient of variation (CV) of four repeated injections.
(ND = no peak separable from the background noise was detected)
Table 6. S/N values for 17MDN spiked in urine at different concentrations and measured
using two specific ions by GC/HRMS-SIM and GC/LRMS-SIM.
HRMS LRMS
Concentrationof spiked
metabolite(ng/ml)
S/N
m/z 444.2880
Mean (CV%)
S/N
m/z 339.2144
Mean (CV%)
S/N
m/z 444
Mean (CV%)
S/N
m/z 339
Mean (CV%)
0 3 (6) 5 (28) 2 (10) 2 (10)0.2 9 (15) 17 (6) 3 (11) 3 (10)
0.5 13 (13) 22 (9) 3 (3) 4 (6)
1 15 (10) 36 (6) 5 (6) 7 (4)
5 56 (1) 181 (1) 28 (5) 35 (3)
10 98 (6) 284 (5) 45 (2) 62 (2)
S/N values are expressed as mean value and coefficient of variation (CV) of four repeated injections.

36
Figure 4. HRMS (m/z 358.2692 ) and LRMS (m/z 358) ion chromatograms obtained
from blank urine and urine samples spiked with 0.2, 1 and 5 ng/ml of MDNm2. The peak
corresponding MDNm2 is marked as “A” in the chromatograms of spike 5 ng/ml.
100012001400160018002000220024002600
9 9,5 10 10,5 11
1 ng/ml
0
4000
8000
12000
16000
20000
8 8,5 9 9,5 10
0.2 ng/ml
0
4000
8000
12000
16000
8 8,5 9 9,5 10
1 ng/ml
1000
1200
1400
1600
1800
2000
2200
9 9,5 10 10,5 11
0.2 ng/ml
0
4000
8000
12000
16000
20000
24000
8 8,5 9 9,5 10
Blank urine
1000
2000
3000
4000
5000
9 9,5 10 10,5 11
Time (min)
Inte
nsi
ty
5 ng/mlA
0
10000
20000
30000
40000
50000
8 8,5 9 9,5 10
Time (min)
Inte
nsi
ty
5 ng/mlA
GC/LRMS-SIM GC/HRMS-SIM
800
1000
1200
1400
1600
1800
2000
9 9,5 10 10,5 11
Blank urine

37
5.2. In-vial two-phase LPME utilizing in-fiber silylation for sample preparation inGC/MS analysis (II)
Evaluation of factors affecting the LPME process
Suitability of LPME for sample preparation in steroid analysis was investigated. The
influence of extraction conditions, including the nature of organic solvent, extraction
time, mixing, salting-out and temperature, on the LPME process was investigated with
steroids spiked in artificial urine at 250 ng/ml as triplicates. Dihexyl ether, 1-octanol and
pentyl acetate were tested as acceptor phases. The extraction recoveries varied widely
between different solvents and compounds. 6CDM and DNZm were extracted clearly
better than 3STZ, whereas FLXm was not extracted at all. With 1-octanol, the extraction
recoveries for DNZm, 6CDM and 3STZ were 49.7%, 40.0% and 5.7%, respectively.
With dihexyl ether only DNZm (37.1%) and 6CDM (1.7%) were extracted, as was the
case with pentyl acetate (22.6% for DNZm and 10.4% for 6CDM). Better extractability
of 6CDM and DNZm over 3STZ and FLXm is for the most part due to their greater
molecular hydrophobicity. In all, extraction recoveries were lower than expected, which
at least partly is due to the strong adsorption of steroids onto the polypropylene fiber [96].
Mixing was another factor that greatly affected the extraction yields. In this study, in-vial
magnetic stirring, in-vial bubbling with air, ultrasonication and lateral shaking were
tested. The best results were obtained with in-vial magnetic stirring at 1250 rpm. The
effects of extraction time (15, 30, 45, 60 and 90 min) and temperature (room temperature,
35°C and 45°C) were studied for 6CDM and DNZm using 1-octanol as the acceptor
phase. Extraction recoveries were relatively constant between 30 and 90 min extraction
times for both analytes, and increasing of temperature did not improve extraction yields.
Heating should, in principle, have had a positive effect on extraction yields since it
increases the solubility and diffusion of analytes in the fiber. On the other hand, solubility
of analytes in aqueous media also increases with heating [97,98]. Salting-out by adding
solid sodium chloride (10, 20 and 30%, w/v) to the aqueous phase did not enhance
extraction yields but rather decreased them. This may be due to a disturbed diffusion of
analytes as a result of an increased viscosity of the donor phase [99]. In the optimized
conditions (45-min LPME at room temperature into 1-octanol), the pre-concentration
factors (acceptor/donor concentration ratio) for DNZm and 6CDM were 82.7 and 72.6,
respectively.
Development of the LPME method utilizing in-fiber silylation
Taking advantage of the optimization experiments described above, a novel two-phase
LPME with in-fiber derivatization was developed for direct GC/MS analysis of steroids

38
in urine. DNZm was used as the test substance since it gave the best results in the
optimization study. A mixture of MSTFA, ammonium iodide and dithioerythritol was
used for silylation because the reagent is directly injectable to GC and converts
ketosteroids into their unique TMS enol ether derivatives having excellent GC and MS
properties [20,31]. It was observed that pure silylation reagent as such could be used for
the extraction and derivatization of the analytes. Nonetheless, the fiber was always
preconditioned with dihexyl ether to function as a protective layer between the aqueous
phase and the moisture-sensitive silylation reagent; 1-octanol was not used for this
purpose because it can react with the silylation reagent. LPME was carried out at 45 ˚C
since an elevated temperature is required for the rapid derivatization of steroids [31].
Extraction time was shortened to 30 min to minimize leakage of the acceptor solvent
from the fiber. The extraction process led to a successful silylation of the analyte and the
internal standard.
Performance of the method was evaluated by estimating LOD, linearity, specificity,
precision and accuracy. Standards (10, 25, 50, 100 and 200 ng/ml) were spiked in pooled
drug-free urine. The method exhibited good linearity over the calibration range of 10-200
ng/ml. Calibration was repeatable between days, coefficient of variation (CV) of the
slope of the curves being 6.8% (n=8). The mean correlation coefficient (r2) of the curves
was 0.989. LOD for DNZm, with the criterion of a signal-to-noise ratio of 3, was 2
ng/ml, as estimated from calibration standards using ion chromatogram of m/z 456.
Precision and accuracy of the method were studied at a concentration level of 100 ng/ml
(Table 7). Both intra- and inter-day precision coefficients of variation were excellent and
the measured concentrations were close to the target value. The pre-concentration factor
for DNZm was only 7.4 but it does not limit the applicability of the method. The low
value might be due to the restricted solubility of DNZm in derivatization reagent, to the
reaction of the reagent with water or to the entry of analyte into the fiber. Selectivity of
the assay was evaluated by analyzing blank urine samples collected from eight
volunteers, including both males and females. Biological background was low and no
interfering peaks were observed at the retention times of DNZm and MTS.
Representative chromatograms obtained from the analysis of blank urine and a spiked
urine sample are presented in Figure 5. The method was also compared with a
conventional LLE-based sample pretreatment procedure comprising enzymatic
hydrolysis, diethyl ether extraction and a separate silylation step. Urine samples spiked
with 100 ng/ml of DNZm were prepared and analyzed by using both methods on separate
days. Both methods turned out to give identical quantitative results (Table 7).

39
Table 7. Intra- and inter-day precision and accuracy of GC/MS determination of DNZm
in urine utilizing LPME with in-fiber silylation and conventional LLE.
LPME LLE
Intra-day Inter-day Inter-day
Added (ng/ml) 100.0 100.0 100.0
Mean (ng/ml) 96.2 101.0 93.8
S.D. (ng/ml) 2.6 8.0 4.1
CV (%) 2.7 7.9 4.4
Bias (%) -3.8 1.0 -6.2
n 12 8 7
LPME was carried out at 45˚C for 30 min into silylation reagent. The LLE procedure consisted of
extraction with diethyl ether using salting-out followed by separate derivatization with silylation reagent at
60˚C for 15 min.
Figure 5. SIM chromatograms for DNZm obtained from the GC/MS analysis of blank
urine and spiked urine 10 ng/ml after 30-min LPME into silylation reagent at 45°C.
Blank urine
0
100
200
300
13.1 13.6 14.1 14.6
Time (min)
Inte
nsi
ty
Spiked urine 10 ng/ml
0
500
1000
1500
13.1 13.6 14.1 14.6
Time (min)
Inte
nsi
ty
m/z 456m/z 456

40
The applicability of two-phase LPME for the sample preparation of AAS in urine was
studied and a novel LPME method utilizing in-fiber silylation was developed. LPME
offered a very simple, inexpensive and effective way to prepare samples for steroid
analysis but was suitable only for the most hydrophobic compounds. LPME with in-fiber
silylation allowed a very precise, sensitive and selective GC/MS analysis of DNZm in
urine, enabling simultaneous filtration, extraction, enrichment and derivatization of the
analyte without any other steps in sample pretreatment. Compared with the conventional
LLE clean-up procedure, LPME was remarkably more straightforward and faster, also
eliminating the risk of sample contamination. Furthermore, the volume of organic solvent
needed was 100 times smaller than in LLE. The technique can be applied to confirmatory
analysis of selected AAS, for instance.
5.3. Suitability of LC/MS/MS for analysis of anabolic androgenic steroids (III)
Applicability of LC/MS/MS for the detection of AAS was investigated by developing and
comparing methods that utilize different ionization techniques, namely ESI, APCI and
APPI.
Optimization of ESI
In tests of eluent composition, presence of ammonium acetate proved to be essential for
ionization, whereas addition of acetic acid had no effect on the results. An eluent
containing 5 mM ammonium acetate and 0.01% (v/v) acetic acid in methanol-water was
selected for the final method. Spray needle voltage was optimized to 5.0 kV. The
intensity of ions was proportional to the magnitude of the voltage, probably due to the
electrolytic oxidation reactions at the tip of the sprayer generating an excess of protons
from aqueous ammonium [100]. Optimization of orifice voltage resulted in the best
response at 15-30 V, and 20 V was chosen as the optimum. Table 8 shows the mass
spectra (m/z 250-400) of the compounds as obtained under optimized conditions.
Depending on the steroid, abundant [M + NH4]+, [M + H]+ ions and ions indicating loss
of water were observed. The signal intensity ratio [M + H]+/[M + NH4]+ was dependent
on proton affinity so that high proton affinity favored the formation of protonated
molecule; 3STZ having the highest and OXD the lowest proton affinity [101]. Protonated
molecules were chosen as precursor ions for MS/MS studies. Two most abundant product
ions per each analyte, excluding dehydrated fragments, were selected for MRM. The

41
following precursor ion → product ion combinations were chosen: m/z 307 → 121, 229
for OXD, m/z 351 → 147, 209 for 6CDM and m/z 345 → 97, 121 for 3STZ. The
corresponding optimized collision offset voltages were 25, 15 and 65 V.
Table 8. Positive ion ESI, APCI and APPI spectra of OXD, 6CDM and 3STZ: m/z
(relative abundance, %).
Steroid [M + NH4]+ [M + H]+ [M + H – H2O]+ [M + H – 2H2O]+ [M + H – 3H2O]+
OXD 324 (44) 307 (100) 289 (38) 271 (7)
6CDM 368 (14) 351 (100) 333 (23) 315 (13)ESI
3STZ 345 (100)
OXD 324 (100) 307 (58) 289 (81) 271 (10)
6CDM 368 (24) 351 (16) 333 (45) 315 (100) 297 (32)
AP
CI
3STZ 345 (100)
OXD 307 (5) 289 (100) 271 (33) 253 (18)
6CDM 351 (2) 333 (9) 315 (100) 297 (35)
AP
PI
3STZ 345 (100)
Mass spectra were collected in the scan range m/z 250-450. Five spectra were accumulated with a scan
speed of 5 s.
Optimization of APCI
Ionization of the compounds took place in every eluent composition tested. In the
absence of ammonium acetate, the protonated molecule was observed for all compounds.
In the presence of ammonium acetate, OXD and 6CDM formed both [M + H]+ and [M +
NH4]+. Addition of acetic acid did not affect the ionization and its abundance. The eluent
containing ammonium acetate, the same as in ESI, gave the best response. As in ESI, an
orifice potential of 20 V was selected for each substance. Adjustment of the discharge
needle current value between 2-5 µA had no effect on ion abundance and 3.0 µA was
chosen for the final method. Probe temperature was optimized over the range 300-450ºC.
The highest abundance for ammoniated OXD and 6CDM was achieved at 300ºC and for
protonated 3STZ at 450ºC. The compromised selection of temperature was 400ºC. The

42
mass spectra of the steroids obtained after optimization are shown in Table 8. Formation
of ammonium adducts was significantly higher in APCI than in ESI. This is due to the
electrolytic oxidation reactions in ESI and efficient formation of ammonium ions in
APCI. The thermal energy available in APCI gave rise to intensive dehydration and
fragmentation. In MS/MS, the protonated molecule was chosen as precursor ion for
3STZ, and the ammoniated molecule for OXD and 6CDM. The same product ions as in
ESI were chosen for MRM. Collision offset voltages were the same as in ESI, except that
5 V higher values had to be used for ammoniated precursors.
Optimization of APPI
Ionization of the compounds occurred with every eluent system tested. Addition of
ammonium acetate or acetic acid had no significant effect on the formation and the
intensity of ions and the same eluent as in ESI and APCI was chosen for the final method.
Orifice voltage and probe temperature were the same as in APCI. Both toluene and
acetone were tested as dopants. The presence of dopant was essential for ionization, but
its flow rate within a range of 5-25 µl/min did not affect the results. Toluene with a flow
rate of 20 µl/min was chosen as the optimum, yielding an approximately 20-50% higher
sensitivity than acetone. The mass spectra of the steroids are presented in Table 8. OXD
and 6CDM exhibited very intensive dehydration and fragmentation which can be derived
from the construction of the ion source in which ions are extensively colliding with
neutral molecules. In contrast to APCI, no ammonium adducts were found. Ionization of
3STZ was similar with ESI and APCI. The data indicated that the main ionization process
in the analytical conditions used was proton transfer reaction after photoionization of the
dopant and that charge exchange reaction did not occur [58]. In MS/MS studies the
protonated molecule was used as precursor ion for 3STZ, whereas dehydrated ions were
selected for both OXD and 6CDM because of negligible formation of protonated
molecules. MRM of 3STZ was performed as with ESI and APCI. For OXD, the precursor
ion → product ion combination m/z 289 → 121, 229 was used with a collision offset
voltage of 30 V. For 6CDM, the corresponding parameters were m/z 315 → 95, 171 and
35 V.
Comparison of ESI-, APCI- and APPI-LC/MS/MS methods
LC runs were performed at flow rate of 0.5 ml/min with methanol-water gradient
including 5 mM ammonium acetate and 0.01% acetic acid, in which the proportion of
methanol was increased from 45 to 90% (v/v) within 15 min. In each method, the
analytes were properly separated during chromatography, yielding symmetrical peaks on
a flat baseline. Detection limits were estimated by analyzing standards with
concentrations of 0.7 to 77 ng/ml prepared as triplicates in drug-free urine after

43
extraction. All steroids could be detected in urinary concentrations below 7 ng/ml using
any of the three methods (Table 9). The ESI method proved to be the most sensitive,
LOD varying from 0.4-3.1 ng/ml depending on the steroid. Specificity of the method,
evaluated with drug-free urines of four male and female volunteers, was excellent,
biological background being low, with no interfering peaks (Figure 6). Authentic doping
test samples, earlier confirmed positive for OXD, 6CDM and 3STZ by GC/MS, all gave
positive results when analyzed by the ESI method. APCI and APPI methods also
exhibited good specificity without matrix interference. Detection limits of both methods
were, however, somewhat higher than those in ESI (Table 9). Sensitivity of the APCI and
APPI methods may also be sufficient for routine analysis but may require changing of
precursor or product ions used or a modification in sample pretreatment. All three
methods proved to be good candidates for routine multianalyte screening of free AAS
metabolites in urine. The use of LC-MS/MS for steroid analysis provides several
advantages over current GC-based methods. As the technique allows direct detection of
steroid metabolites, there is no need for derivatization step, which reduces analysis time,
eliminates predictable sources of error and decreases the use of hazardous and expensive
reagents. Furthermore, it enables analysis of thermally labile compounds.
Table 9. LOD (ng/ml) obtained using different LC-MS/MS methods.
Steroid ESI APCI APPI
OXD 3.1 0.5 2.4
6CDM 0.4 2.8 6.3
3STZ 2.1 6.2 6.2
Steroids were spiked in pooled drug-free urine after extraction. LOD (S/N >3) were calculated from
merged product ion chromatorgrams and results are expressed as the mean of three replicates.

44
Figure 6. Merged MRM ion chromatograms obtained from LC/ESI-MS/MS analysis of
(A) spiked urine sample containing OXD, 6CDM and 3STZ (3.1, 3.5 and 3.4 ng/ml,
respectively) and (B) blank urine.
5.4. LC/ESI-MS/MS method for routine screening of unconjugated anabolicandrogenic steroids (IV)
In the developed method, the LC run conditions, as well as ion source parameters were
set according to the optimization study presented in the previous chapter. In order to
select precursor ions for MRM, full-scan mass spectra of each steroid were measured.
Either [M + H]+ or [M + NH4]+ was the dominating ion in the mass spectrum, the
intensity ratio [M + H]+/ [M + NH4]+ depending on the proton affinity (PA) of the steroid
as shown earlier. Depending on the steroid, [M + H]+ or [M + NH4]+ was chosen as the
precursor ion. Product ion spectra were measured with different collision offset voltages
to optimize fragmentation for MRM. Fragmentation of all compounds was efficient
producing several specific ions. Two abundant and specific product ions, excluding
dehydrated fragments, were selected per each analyte. The optimum collision offset
voltage for each analyte varied between 15-60 V. Optimized MRM parameters are listed
in Table 10.
In order to evaluate linearity, to estimate LOD and to calibrate the method, spiked
standards at concentrations of 0, 0.5, 1, 5, 10, 50, 100, 250, 500 and 1000 ng/ml were
prepared in pooled drug-free urine. The method was linear up to 250 ng/ml for all
analytes, except up to 100 ng/ml for 17MDN. The narrow dynamic range can be
0
100
200
8 10 12 140
100
200
8 10 12 14
6CDM
OXD
3STZInte
nsity
Time (min)
A B
Time (min)
m/z 351 —> 147,209m/z 307 —> 121,229m/z 345 —> 97,121
0
100
200
8 10 12 140
100
200
8 10 12 14
6CDM
OXD
3STZInte
nsity
Time (min)
A B
Time (min)
m/z 351 —> 147,209m/z 307 —> 121,229m/z 345 —> 97,121
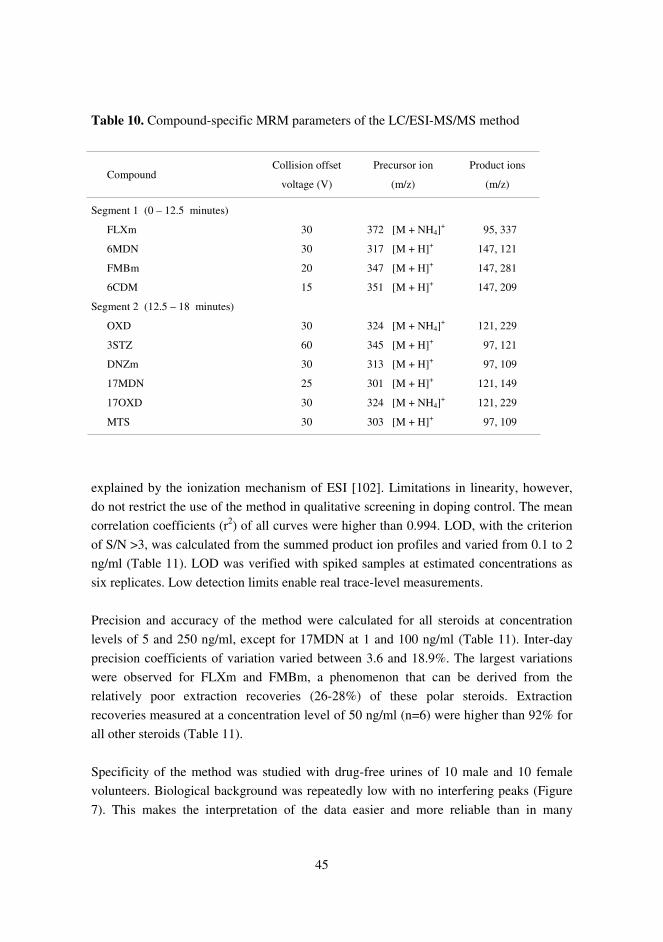
45
Table 10. Compound-specific MRM parameters of the LC/ESI-MS/MS method
CompoundCollision offset
voltage (V)
Precursor ion
(m/z)
Product ions
(m/z)
Segment 1 (0 – 12.5 minutes)
FLXm 30 372 [M + NH4]+ 95, 337
6MDN 30 317 [M + H]+ 147, 121
FMBm 20 347 [M + H]+ 147, 281
6CDM 15 351 [M + H]+ 147, 209
Segment 2 (12.5 – 18 minutes)
OXD 30 324 [M + NH4]+ 121, 229
3STZ 60 345 [M + H]+ 97, 121
DNZm 30 313 [M + H]+ 97, 109
17MDN 25 301 [M + H]+ 121, 149
17OXD 30 324 [M + NH4]+ 121, 229
MTS 30 303 [M + H]+ 97, 109
explained by the ionization mechanism of ESI [102]. Limitations in linearity, however,
do not restrict the use of the method in qualitative screening in doping control. The mean
correlation coefficients (r2) of all curves were higher than 0.994. LOD, with the criterion
of S/N >3, was calculated from the summed product ion profiles and varied from 0.1 to 2
ng/ml (Table 11). LOD was verified with spiked samples at estimated concentrations as
six replicates. Low detection limits enable real trace-level measurements.
Precision and accuracy of the method were calculated for all steroids at concentration
levels of 5 and 250 ng/ml, except for 17MDN at 1 and 100 ng/ml (Table 11). Inter-day
precision coefficients of variation varied between 3.6 and 18.9%. The largest variations
were observed for FLXm and FMBm, a phenomenon that can be derived from the
relatively poor extraction recoveries (26-28%) of these polar steroids. Extraction
recoveries measured at a concentration level of 50 ng/ml (n=6) were higher than 92% for
all other steroids (Table 11).
Specificity of the method was studied with drug-free urines of 10 male and 10 female
volunteers. Biological background was repeatedly low with no interfering peaks (Figure
7). This makes the interpretation of the data easier and more reliable than in many

46
Table 11. Validation data for the LC/ESI-MS/MS method.
Compound LOD
(ng/ml)
Extraction recovery
(%)
Added
(ng/ml)
Precision
CV (%)
Accuracy
Bias (%)
FLXm 1.8 28 5
250
18.9
13.0
16.8
3.5
6MDN 0.5 92 5
250
5.8
8.3
2.2
-3.7
FMBm 0.4 26 5
250
18.9
14.6
12.0
-3.4
6CDM 0.4 100 5
250
3.9
4.8
4.7
-7.3
OXD 0.6 98 5
250
10.0
6.2
2.7
-2.2
3STZ 2.0 103 5
250
12.9
12.3
14.7
1.1
DNZm 0.5 97 5
250
8.9
3.6
4.1
-6.9
17MDN 0.1 96 1
100
18.3
8.8
-9.1
1.0
17OXD 0.5 98 5
250
7.7
6.9
5.1
-4.5
Extraction recoveries were determined at 50 ng/ml with 6 replicates. Precision and accuracy were
calculated from spiked urine samples at two different concentration levels on 5 separate days. LOD (S/N
>3) were calculated from the summed product ion with 6 replicates.
GC/MS methods, in which disturbing peaks often occur in the extracted ion profiles of
the analytes [34,41]. The method was finally tested with authentic positive urine
samples. Three samples which had previously been found to contain metabolites of
fluoxymesterone, methandienone and danazol in GC/MS analysis all yielded positive
results when screened by LC/ESI-MS/MS.
The separation of the substances is presented in Figure 7. The steroids were identified
based on their retention times using compound-specific summed product ion profiles. All
compounds were eluted between 4.5 and 15.8 min giving symmetrical peaks. Although

47
several analytes were completely or partly overlapping, their unique MS/MS properties
allowed distinguishing between them. Although it is well known that the separation
power of LC is significantly weaker than that of GC, it was fully compensated by the
excellent selectivity of MS/MS detection in this application.
Figure 7. LC/ESI-MS/MS analysis of free AAS in urine. Overlaid summed product ion
chromatograms (x-axis: time in minutes; y-axis: absolute abundance) obtained from
blank urine (bold line) and from 5 ng/ml spiked sample (thin line). MRM parameters are
listed in Table 10. MTS at 50 ng/ml was used as internal standard.
The developed positive ion LC/ESI-MS/MS method enabled the measurement of nine 17-
alkyl-substituted AAS and their unconjugated metabolites in human urine at the low
nanogram per milliliter level. With simple and fast sample preparation, low limits of
detection, high degree of selectivity and precision, the method is a potential alternative
for GC/MS based procedures in routine multi-analyte screening of unconjugated AAS in
human urine. The method avoids some problems associated with GC/MS analysis of
steroids such as OXD and stanozolol which exhibit thermal instability and sensitivity
towards active sites of the column [36,87].
6MDN
0,0E+00
1,5E+04
8,5 10,5 12,5
FLXm
0,0E+00
2,0E+03
2 4 6
FMBm
0,0E+00
5,0E+03
8,5 10,5 12,5
6CDM
0,0E+00
3,0E+03
8,5 10,5 12,5
OXD 17OXD
0,0E+00
8,0E+03
12,5 14,5 16,5
3STZ
0,0E+00
1,5E+03
12,5 14,5 16,5
DNZm
0,0E+00
2,0E+04
12,5 14,5 16,5
17MDN
0,0E+00
5,0E+04
12,5 14,5 16,5
MTS
0,0E+00
4,0E+05
12,5 14,5 16,5
4.549.61 9.67
11.56 13.47 15.57 14.35
14.55 15.57 15.76

48
5.5. Chemometric analysis of the full scan mass spectral data obtained in the
analysis of anabolic steroids
Potential of chemometrics to enhance interpretation of complex analytical data was
studied and demonstrated with urine samples prepared for standard GC/MS analysis of
AAS. Acquired full scan spectral data (m/z 40-700) containing 2500 scans per run was
processed by the OSCAR algorithm [74]. For calculations, all m/z-values were rounded
to integers because of data storage limitations. The data of each run was processed in
segments containing typically 50-200 scans and the results were combined afterwards.
The OSCAR algorithm used is a refinement of the alternating regression (AR) and
automates the deconvolution process [80,83]. Mass spectral data constitute a large
observation matrix which is a product of two smaller matrices: the pure elution curves
and spectra of compounds present in the sample. In addition, the observation matrix
always contains some measurement noise. The algorithm starts by using random numbers
as an initial guess for the spectra to determine the corresponding concentration profiles
from the observation matrix using regression. After the application of certain constraints,
the elution curves are used together with the observation matrix to estimate better spectra.
The spectra are then constrained and used to calculate more precise elution profiles, et
cetera. Results obtained after 10-20 iteration cycles are used for further calculations to
obtain the most optimum solution. The deconvolution method is highly automated and
the only input that the program needs from the operator is the measured data and the
maximum number of components expected. The program reports directly the optimized
solution and estimates confidence ranges around the spectra and the elution curves as
indicators of quality [74].
The functionality of OSCAR was tested with large number of authentic urine samples.
The purpose was to resolve the acquired GC/MS data into components, not to identify
chemical structure of single components. The decovolution method was able to clean up
mass spectra of individual components. The deconvolution process also enabled isolation
of components having a severe overlap or being thoroughly hidden under the
chromatographic baseline. The most prominent feature in all measurements was the
background which represented approximately 75 percent from overall ionization. The
background mainly consists of the reagents and the column bleed and is truly a mixture
of several chemical entities. The deconvolution resolves the background as a single
component, since its concentration does not change much over time.

49
The ability of the deconvolution to separate closely spaced compounds is shown in
Figures 8-10. The resolved elution curves show that two components were extensively
overlapping and the tops of the peaks were separated only by a single scan (Figure 8).
The majority of the intensity was located in the background component. In the original
total ion chromatogram, only one symmetric peak was observed and the spectrum taken
at the top of the peak is sum of the spectra of two components and the background
(Figure 9). Actually, detection that the peak contains more than one component is
difficult visually since overlapping is so severe. In spite of only the single scan difference
in the retention times, the OSCAR deconvolution method was able to resolve mass
spectra of the compounds and the background (Figure 10). The analysis was repeated for
20 individual samples having different concentrations and similar results were found in
all experiments, which indicates the robustness of the solution and makes numerical
artifacts unlikely.
Figure 8. Resolution of a GC peak into components by the deconvolution method. The
original total ion chromatogram, the resolved background and the elution profiles of the
resolved peaks.
0 5 10 15 20 25 30 35 40Scan number
2.5
2.0
1.5
1.0
0.5
0
x 106
Total abundance curve
The backgroundcomponent
Component 1.
Component 2.
0 5 10 15 20 25 30 35 40Scan number
2.5
2.0
1.5
1.0
0.5
0
x 106
Total abundance curve
The backgroundcomponent
Component 1.
Component 2.

50
Figure 9. The unresolved spectrum taken at the top of the original GC peak shown in
Figure 8 (x-axis: m/z; y-axis: relative abundance).
Figure 10. Resolution of a GC peak into components by the deconvolution method.
Resolved spectra of background and two components (x-axis: m/z; y-axis: relative
abundance). The spectra correspond to the elution curves shown in Figure 8.
0 100 200 300 400 500 600 700 800
Component 2.
Component 1.
Background
0 100 200 300 400 500 600 700 800
Component 2.
Component 1.
Background
0 100 200 300 400 500 600 700 8000 100 200 300 400 500 600 700 800

51
The algorithm was able to isolate peaks even though they were hidden under the
chromatographic baseline. Figure 11 shows an example of a sample in which OSCAR
resolved six overlapping peaks of which four peaks are not visible to the plain eye. It was
impossible to detect all substances and resolve their spectra by means of conventional
mass spectrometric data handling.
Figure 11. Resolution of a section of thirty scans into components by the deconvolution
method. The original total ion chromatogram, the resolved background and the elution
profiles of the resolved peaks (1-6).
To demonstrate the potential of the deconvolution to dig out components from a complex
sample matrix and to test its reproducibility, the complete GC/MS data of 2500 scans
obtained in the analysis of urine samples of three different persons were interpreted both
manually and by using OSCAR. The number of chromatographic peaks seen visually in
each chromatogram was roughly 120. The number of identical components retrieved by
OSCAR was 279, which is more than twice the number of visible peaks. The identical
spectra found for temporally corresponding GC peaks in the samples of different
individuals indicated that the components are real, not numerical artifacts.
0 5 10 15 20 25 30Scan number
12
10
8
6
4
0
x 106
21
2
3 4
5 6
Total abundance curve
Background
0 5 10 15 20 25 30Scan number
12
10
8
6
4
0
x 106
21
2
3 4
5 6
Total abundance curve
Background
52
The functionality of the OSCAR algorithm to resolve complex analytical data was tested
with urine samples prepared for steroid screening and analyzed by GC/MS in the scan
mode. In all, the algorithm proved to function as expected and GC/MS runs were steadily
resolved into components with a high degree of automation. The study successfully
demonstrated the potential of deconvolution method as a useful tool in mass spectral data
handling. The ability to separate the background component and to resolve overlaying
compounds results in lower detection limits and improvement in the reliability of
analytical results. In many cases it is not possible to optimize chromatographic separation
between all compounds in the sample – the deconvolution is an alternative and useful
way to separate components present in the sample. A fundamental advantage of many
chemometric methods is the fact that unanticipated compounds (e.g. “design steroids”)
can be found in addition to the compounds previously known. The technique would be of
great help for in confirmation and identification of AAS and other prohibited substances.

53
6. SUMMARY AND CONCLUSIONS
Applicability and effectiveness of different modern analytical techniques and methods
related to mass spectrometry were examined for the detection of AAS in sports drug
testing in order to improve existing procedures and to find better strategies for
comprehensive drug testing.
GC/HRMS-SIM at the resolution of 5000 proved to be a clearly more efficient technique
than the corresponding LRMS method for the detection of methandienone metabolites in
urine. With HRMS the detection limits were considerably better than with LRMS,
enabling detection of steroids at the low 0.2-0.5 ng/ml level. The improved detection was
due to the enhanced selectivity which resulted in the reduction of biological background.
Because of the reduced background, interpretation of acquired data was easier. Also with
HRMS the complex biological background may, however, hamper the analysis of some
metabolites. GC/HRMS-SIM is suitable for both screening and confirmation of AAS in
urine. Along with lower detection limits, steroid abuse can be detected for a longer time
ending of drug intake. Benefit of the technique is compound-dependent and detection of
trace concentration especially in confirmatory analysis might require careful optimization
of resolution, selection of ions for SIM and use of comprehensive sample clean-up.
Two-phase LPME enabled a very simple and effective way to prepare urine samples for
analysis, being most suitable for hydrophobic steroids. The LPME method with in-fiber
derivatization allowed precise and selective GC/MS analysis of ethisterone and enabled
simultaneous filtration, extraction, enrichment and derivatization of the analyte from
urine matrix without any other steps in sample preparation. The estimated LOD 2 ng/ml
allows detection of trace levels of the steroid. Compared with the conventional LLE,
LPME was remarkably more straightforward and faster. The method is very suitable for
confirmatory analysis of selected AAS since all materials are disposable and all stages of
sample preparation are performed simultaneously without any transformation of liquid,
evaporation of solvent, reconstitution of sample residue, which collectively diminish risk
of errors, contamination and carry-over.
LC/MS/MS methods based on three ionization techniques, ESI, APCI and APPI, were
developed and their applicability for detection of the free AAS steroid fraction in urine
was studied. The degree of protonation, formation of adducts and dehydration varied
greatly from one ionization technique to another, the ionization finally depending on the
proton affinity of the steroid. All methods proved to be good candidates for routine
screening of AAS and all studied steroids could be detected at concentrations below 7

54
ng/ml. ESI, however, showed the best applicability and allowed detection of steroids at
concentrations of 0.4-3.1 ng/ml. By using LC/MS, steroids could be analyzed in intact
form, which simplified the sample preparation and speeded up the analysis. In addition,
LC/MS enabled detection of thermally labile steroids. Taking advantage of the preceding
experiments, a positive ion LC/ESI-MS/MS method was developed for routine screening
of free steroid fraction. Nine 17-alkyl-substituted AAS or their metabolites could be
selectively detected in urine with detection limits of 0.1-2 ng/ml. With fast analysis, low
limits of detection, high selectivity, precision and accuracy, the developed method
provides advantages over the present GC/MS-based methods and has great potential for
routine screening.
The potential of chemometric methods to find components and extract “pure” spectra
from complex chromatograms was demonstrated using the OSCAR algorithm. The
deconvolution was able to separate overlapping peaks, dig out components hidden under
the chromatographic baseline and remove background, which improves detection of
compounds and reliability of the results. In spite of the high resolution power of columns
in modern chromatography, it is hardly possible to separate all compounds present in a
complex biological matrix such as urine. The deconvolution is a useful way to separate
components in the sample. The approach opens new vistas for analysts and provides
efficient solutions for complex and challenging chemical problems for instance in sports
drug testing. Along with the improved availability of different programs and their
increasing user-friendliness, application of deconvolution methods in everyday analytical
measurements will increase. Application of the methods in confirmatory analysis,
however, presumes comprehensive testing and comparison of different algorithms and
setting of strict indicators for reliability of resolution results.
The study showed that GC/HRMS, LC/MS/MS, LPME and chemometrics are very useful
analytical tools to improve detection of AAS in sports drug testing. Regarding laboratory
analytics, sports drug testing as a whole is a very complex and challenging task. In order
to manage ever-tightening quality requirements, growing number of test samples and
prohibited substances to be monitored, continuous comprehensive testing and evaluation
of new and alternative analytical techniques and methods is crucial. In any case, all
analytical procedures used in doping control should be carefully selected to be able to
find the most reasonable strategies for effective testing. In the future, as a next step, it
would be logical to carefully evaluate the feasibility of LC/HRMS with continuous
accurate mass detection in combination with chemometric data handling in the analysis of
AAS and other substances. At least in theory, the approach has great capabilities “almost

55
for an all-in-one method” probably enabling detection of wide range of known and
unknown compounds rapidly and with high specificity and sensitivity.

56
ACKNOWLEDGEMENTS
This work was carried out at the Doping Control Laboratory of United Laboratories Ltd.;
at the Department of Pharmaceutical Chemistry, University of Helsinki; and at VTT
Technical Research Centre of Finland. Financial support was provided by Tekes –
Finnish Funding Agency for Technology and Innovation, Kliinisen Kemian
Tutkimussäätiö, and the Finnish Antidoping Agency FINADA.
I am most grateful to Prof. Risto Kostiainen, the supervisor of this work, for guiding me
and encouraging me to manage through this project.
I wish to express my gratitude to all co-authors for their contribution to the work. Special
thanks go to Dr. Tiia Kuuranne, Drs. Ulla and Erkki Karjalainen and Prof. Tapio Kotiaho
for their great help, advice and close companionship. I am furthermore grateful to Mrs.
Teija Moisander for her excellent and skilful technical assistance.
Prof. Kimmo Himberg and Prof. Mario Thevis are acknowledged for their careful review
and valuable comments, and Dr. Ilkka Helander for revising the language of the
manuscript and most of the articles.
Special thanks are due to my friend and colleague Dr. Kimmo Kuoppasalmi for his
never-failing support and who actually pushed me to start this project at my later age. I
also warmly thank Medical Counselor Juhani Aho for providing the facilities for work in
the fascinating field of doping analytics.
I wish to thank especially Eija, Leena, Maare, Tuula and Virpi, and also all other
colleagues at the Doping Control Laboratory and other departments of United
Laboratories Ltd. for creating a friendly atmosphere in which it has been pleasant to
work. I am also grateful to the whole staff of the Department of Pharmaceutical
Chemistry for warmly accepting me into their “family” when I was writing this
manuscript in Viikki.
I am very grateful to all my friends for their help in keeping my thoughts, in many ways,
at least partly out from doping matters outside the laboratory. Sincere thanks are also to
my parents and parents-in-law for their support.
Finally, I extend my warmest thank to my dear wife Anne and our children Hannu and
Tiina for their great patience and support during this long-lasting project.

57
REFERENCES
[1] Kam P.C.A., Yarrow M. Anabolic steroid abuse: physiological and anaesthetic considerations.Anaesthesia 60 (2005) 685-692.
[2] Basaria S., Wahlström J.T., Dobs A.S. Anabolic-androgenic steroid therapy in the treatment ofchronic diseases. J. Clin. Endocrinol. Metab. 86 (2001) 5108-5117.
[3] Evans N.A. Current concepts in anabolic-androgenic steroids. Am. J. Sports Med. 32 (2004) 534-542.
[4] Creutzberg E.C., Schols A.M.W. J. Anabolic steroids. Curr. Opin. Clin. Nutr. Metab. Care 2 (1999)243-253.
[5] Kuhn C.M. Anabolic steroids. Recent Prog. Horm. Res. 57 (2002) 411-434.
[6] Bahrke M.S., Yesalis C.E. Abuse of anabolic androgenic steroids and related substances in sportand exercise. Curr. Opin. Pharm. 4 (2004) 614-620.
[7] Yesalis C.E., Bahrke M.S. Anabolic-androgenic steroids - Current issues. Sports Med. 19 (1995)326-340.
[8] Lukas S.E. Current perspectives on anabolic-androgenic steroid abuse. TiPS 14 (1993) 61-68.
[9] World Anti-Doping Agency. 2004 Adverse analytical findings reported by accredited laboratories.Available at: http://www.wada-ama.org (accessed November 2005).
[10] Herbst K.L., Bhasin S. Testosterone action on skeletal muscle. Curr. Opin. Clin. Nutr. Metab. Care7 (2004) 271-277.
[11] Wu F.C.W. Endocrine aspects of anabolic steroids. Clin. Chem. 43 (1997) 1289-1292.
[12] Celotti F., Cesi P.N. Anabolic steroids: A review of their effects on the muscles, of their possiblemechanisms of action and of their use in athletics. J. Steroid Biochem. Molec. Biol. 43 (1992) 469-477.
[13] Maravelias C., Dona A., Stefanidou M., Spiliopoulou C. Adverse effects of anabolic steroids inathletes – a constant threat. Toxicol. Lett. 158 (2005) 167-175.
[14] Lamb D.R. Anabolic steroids in athletics: how well do they work and how dangerous are they?Am. J. Sports Med. 12 (1984) 31-38.
[15] Kicman A.T., Gower D.B. Anabolic steroids in sport: biochemical, clinical and analyticalperspectives. Ann. Clin. Biochem. 40 (2003) 321-356.
[16] Catlin D.H., Ahrens B.D., Kucherova Y. Detection of norbolethone, an anabolic steroid nevermarketed, in athletes' urine. Rapid Commun. Mass Spectrom. 16 (2002) 1273-1275.
[17] Catlin D.H., Sekera M.H., Ahrens B.D., Starcevic B., Chang Y.-C., Hatton C.K.Tetrahydrogestrinone: discovery, synthesis, and detection in urine. Rapid Commun. MassSpectrom. 18 (2004) 1245-1249.
[18] Sekera M.H., Ahrens B.D., Chang Y.-C., Starcevic B., Georgakopoulos C., Catlin D.H. Anotherdesigner steroid: discovery, synthesis, and detection of 'madol' in urine. Rapid Commun. MassSpectrom. 19 (2005) 781-784.

58
[19] Gower D.B. Metabolism of androgens. In: Steroid Analysis, Makin H.L.J., Gower D.B., Kirk D.N.(Eds.) Blackie Academic & Professional, Chapman & Hall, Glasgow (1995) 269-272.
[20] Schänzer W., Donike M. Metabolism of anabolic steroids in man: synthesis and use of referencesubstances for identification of anabolic steroids metabolites. Anal. Chim. Acta 275 (1993) 23-48.
[21] Schänzer W. Metabolism of anabolic androgenic steroids. Clin. Chem. 42 (1996) 1001-1020.
[22] Gower D.B, Houghton E., Kicman A.T. Anabolic steroids: metabolism, doping and detection inequestrian and human sports. In: Steroid Analysis. Makin H.L.J., Gower D.B., Kirk D.N. (Eds.)Blackie Academic & Professional, Chapman & Hall, Glasgow (1995) 468-526.
[23] Schänzer W., Opfermann G., Donike M. 17-epimerization of 17α-methyl anabolic steroids inhumans: metabolism and synthesis of 17α-hydroxy-17β-methyl steroids. Steroids 57 (1992) 537-549.
[24] de Merode A. Doping tests at the Olympic Games in 1976. J. Sports Med. Phys. Fitness 19 (1979)91-96.
[25] Sample R.H.B., Baezinger J. Gas chromatography/mass spectrometry screening for anabolicsteroids. In: Analytical aspects of drug testing. Deutch D.G. (Ed.) John Wiley & Sons Inc., London(1989) 247-272.
[26] World Anti-Doping Agency. Minimum required performance limits for detection of prohibitedsubstances. WADA Technical Document - TD2004MRPL version 1.0. Available at:http://www.wada-ama.org (accessed November 2005).
[27] Hatton C.K., Catlin D.H. Detection of androgenic anabolic steroids in urine. Clin. Lab. Med. 7(1987) 655-668.
[28] World Anti-Doping Agency. Identification criteria for qualitative assays incorporatingchromatography and mass spectrometry. WADA Technical Document - TD2003IDCR version 1.2.Available at: http://www.wada-ama.org (accessed November 2005).
[29] Donike M., Zimmermann J., Bärwald K.-R., Schänzer W., Christ V., Klostermann K., OpfermannG. Routinebestimmung von anabolika im harn. Dtsch. Z. Sportmed. 35 (1984) 14-23.
[30] Donike M., Geyer H., Gotzmann A., Kraft M., Mandel F., Nolteernsting E., Opfermann G.,Sigmund G., Schänzer W., Zimmermann J. Dope analysis. In: Official Proceedings - InternationalAthletic Foundation World Symposium on Doping in Sport, Florence, 10-12 May 1987. Bellotti P.,Benzi G., Ljungqvist A. (Eds.) International Athletic Foundation, Italy (1988) 53-70.
[31] Donike M., Zimmermann J. Zur darstellung von trimethylsilyl-, triethylsilyl- und tert.-butyldimethylsilyl-enoläthern von ketosteroiden für gas-chromatographische undmassenspectrometrische untersuchungen. J. Chromatogr. 202 (1980) 483-486.
[32] Segura J. Ventura R., Jurado C. Derivatization procedures for gas chromatographic-massspectrometric determination of xenobiotics in biological samples, with special attention to drugs ofabuse and doping agents. J. Chromatogr. B 713 (1998) 61-90.
[33] Chung B., Choo H.-Y.P., Kim T., Eom K., Kwon O., Suh J., Yang J., Park J. Analysis of anabolicsteroids using GC/MS with selected ion monitoring. J. Anal. Toxicol. 14 (1990) 91-95.
[34] Catlin D.H., Kammerer R.C., Hatton C.K., Sekera M.H., Merdink J.L. Analytical chemistry at thegames of the XXIIIrd Olympiad in Los Angeles, 1984. Clin. Chem. 33 (1987) 319-327.

59
[35] Chan S.C., Torok-Both G.A., Billay D.M., Przybylski P.S., Gradeen C.Y., Pap K.M., Petruzelka J.Drug analysis at the 1988 Olympic Winter Games in Calgary. Clin. Chem. 37 (1991) 1289-1296.
[36] Massé R., Ayotte C., Dugal R. Studies on anabolic steroids. I. Integrated methodological approachto the gas chromatographic-mass spectrometric analysis of anabolic steroid metabolites in urine. J.Chromatogr. 489 (1989) 23-50.
[37] Geyer H., Schänzer W., Mareck-Engelke U., Nolteernsting E., Opfermann G. Screening procedurefor anabolic steroids – The control of the hydrolysis with deuterated androsterone glucuronide andstudies with direct hydrolysis. In: Recent Advances in Doping Analysis (5): Proceedings of theManfred Donike Workshop, 15th Cologne Workshop on Dope Analysis, 23rd to 28th February1997. Schänzer W., Geyer H., Gotzmann A., Mareck-Engelke U. (Eds.) Verlag Sport and BuchStrauß, Köln (1998) 99-101.
[38] Trout G.J., Kazlauskas R. Sports drug testing - an analyst's perspective. Chem. Soc. Rev. 33 (2004)1-13.
[39] Bowers L.D. Analytical advances in detection of performance-enhancing compounds. Clin. Chem.43 (1997) 1299-1304.
[40] de Boer D., de Jong E.G., Maes R.A.A. Mass spectrometric characterization of differentnorandrosterone derivatives by low-cost mass spectrometric detectors using electron ionization andchemical ionization. Rapid Commun. Mass Spectrom. 4 (1990) 181-185.
[41] Choi M.H., Chung B.C., Lee W., Lee U.C., Kim Y. Determination of anabolic steroids by gaschromatography/negative-ion chemical ionization mass spectrometry and gaschromatography/negative-ion chemical ionization tandem mass spectrometry withheptafluorobutyric anhydride derivatization. Rapid Commun. Mass Spectrom. 13 (1999) 376-380.
[42] Choi M.H., Chung B.C., Kim M., Choi J., Kim Y. Determination of four anabolic steroidmetabolites by gas chromatography/mass spectrometry with negative ion chemical ionization andtandem mass spectrometry. Rapid Commun. Mass Spectrom. 12 (1998) 1749-1755.
[43] Horning S., Donike M. High resolution GC/MS. In: Recent Advances in Doping Analysis:Proceedings of the 11th Cologne Workshop on Dope Analysis, 7th to 12th March 1993. DonikeM., Geyer H., Gotzmann A., Mareck-Engelke U., Rauth S. (Eds.) Verlag Sport and Buch Strauß,Köln (1994) 155-161.
[44] Horning S., Schänzer W. Steroid screening using GC/HRMS. In: Recent Advances in DopingAnalysis (4): Proceedings of the Manfred Donike Workshop, 14th Cologne Workshop on DopeAnalysis, 17th to 22nd March 1996. Schänzer W., Geyer H., Gotzmann A., Marech-Engelke U.(Eds.) Verlag Sport and Buch Strauß, Köln (1997) 261-270.
[45] Schänzer W., Delahaut P., Geyer H., Machnik M., Horning S. Long-term detection andidentification of metandienone and stanozolol abuse in athletes by gas chromatography-high-resolution mass spectrometry. Chromatogr. B 687 (1996) 93-108.
[46] Mueller R.K., Grosse J., Lang R., Thieme D. Chromatographic techniques - the basis of dopingcontrol. J. Chromatogr. B. 674 (1995) 1-11.
[47] Bowers L.D., Borts D.J. Evaluation of selected-ion storage ion-trap mass spectrometry fordetecting urinary anabolic agents. Clin. Chem. 43 (1997) 1033-1039.
[48] Bowers L.D., Borts D.J. Separation and confirmation of anabolic steroids with quadrupole ion traptandem mass spectrometry. J. Chromatogr. B 687 (1996) 69-78.

60
[49] Mu oz-Guerra J., Carreras D., Soriano C., Rodrígues C., Rodrígues A.F. Use of ion trap gaschromatography-tandem mass spectrometry for detection and confirmation of anabolic substancesat trace levels in doping analysis. J. Chromatogr. B 704 (1997) 129-141.
[50] Marcos J., Pascual J.A., de la Torre X., Segura J. Fast screening of anabolic steroids and otherbanned doping substances in human urine by gas chromatography/tandem mass spectrometry. J.Mass Spectrom. 37 (2002) 1059-1073.
[51] Buiarelli F., Cartoni G.P., Amendola L., Botrè F. Screening and confirmation analysis of anabolicagents in human urine by gas chromatography - hybrid mass spectrometry (high resolution - timeof flight). Anal. Chim. Acta 447 (2001) 75-88.
[52] Barrón D., Barbosa J., Pascual J.A., Segura J. Direct determination of anabolic steroids in humanurine by on-line solid-phase extraction/liquid chromatography/mass spectrometry. J. MassSpectrom. 31 (1996) 309-319.
[53] Mück W.M., Henion J.D. High-performance liquid chromatography/tandem mass spectrometry: Itsuse for the identification of stanozolol and its major metabolites in human and equine urine.Biomed. Environ. Mass Spectrom. 19 (1990) 37-51.
[54] Edlund P.O., Bowers L., Henion J. Determination of methandrostenolone and its metabolites inequine plasma and urine by coupled-column liquid chromatography with ultraviolet detection andconfirmation by tandem mass spectrometry. J. Chromatogr. 487 (1989) 341-356.
[55] Kim Y., Lee Y., Kim M., Yim Y.-H., Lee W. Determination of the metabolites of gestrinone inhuman urine by high performance liquid chromatography, liquid chromatography/massspectrometry and gas chromatography/mass spectrometry. Rapid Commun. Mass Spectrom. 14(2000) 1717-1726.
[56] Lévesque J.-F., Templeton E., Trimble L.; Berthelette C., Chauret N. Discovery, biosynthesis, andstructure elucidation of metabolites of a doping agent and a direct analogue, tetrahydrogestrinoneand gestrinone, using human hepatocytes. Anal. Chem. 77 (2005) 3164-3172.
[57] Thevis M., Geyer H., Mareck U., Schänzer W. Screening for unknown synthetic steroids in humanurine by liquid chromatography-tandem mass spectrometry. J. Mass Spectrom. 40 (2005) 955-962.
[58] Robb D.B., Covey T.R., Bruins A.P. Atmospheric pressure photoionization: an ionization methodfor liquid chromatography-mass spectrometry. Anal. Chem. 72 (2000) 3653-3659.
[59] Cai Y., Kingery D., McConnell O., Bach II A.C. Advantages of atmospheric pressurephotoionization mass spectrometry in support of drug discovery. Rapid Commun. Mass Spectrom.19 (2005) 1717-1724.
[60] Nielen M.W.F., Vissers J.P.C., Fuchs R.E.M., van Velde J.W., Lommen A. Screening for anabolicsteroids and related compounds in illegal cocktails by liquid chromatography/time-of-flight massspectrometry and liquid chromatography/quadrupole time-of-flight tandem mass spectrometry withaccurate mass measurement. Rapid Commun. Mass Spectrom. 15 (2001) 1577-1585.
[61] Borges C., Slawson M., Taccogno J., Crouch D., Hughes J., Wuest B. Detection and confirmationof anabolic steroids and metabolites in urine using routine accurate API-TOF LC/MS. ManfredDonike Workshop, 23rd Cologne Workshop on Dope Analysis, 27th February to 4th March 2005.Abstracts.
[62] Bowers L.D., Sanaullah. Direct measurement of steroid sulfate and glucuronide conjugates withhigh-performance liquid chromatography-mass spectrometry. J. Chromatogr. B 687 (1996) 61-68.

61
[63] Bean K.A., Henion J.D. Direct determination of anabolic steroid conjugates in human urine bycombined high-performance liquid chromatography and tandem mass spectrometry. J. Chromatogr.B 690 (1997) 65-75.
[64] Kuuranne T., Kotiaho T., Pedersen-Bjergaard S., Rasmussen K.E., Leinonen A., Westwood S.,Kostiainen R. Feasibility of a liquid-phase microextraction sample clean-up and liquidchromatographic/mass spectrometric screening method for selected anabolic steroid glucuronidesin biological samples. J. Mass Spectrom. 38 (2003) 16-26.
[65] Machnik M., Delahaut P., Horning S., Schänzer W. Purification of anabolic steroids byimmunoaffinity chromatography (IAC). In: Recent Advances in Doping Analysis (4): Proceedingsof the Manfred Donike Workshop, 14th Cologne Workshop on Dope Analysis, 14th to 22nd March1996. Schänzer W., Geyer H., Gotzmann A., Mareck-Engelke U. (Eds.) Verlag Sport and BuchStrauß, Köln (1997) 261-270.
[66] van Ginkel L.A. Immunoaffinity chromatography, its applicability and limitations in multi-residueanalysis of anabolizing and doping agents. J. Chromatogr. 564 (1991) 363-384.
[67] Gotzmann A., Geyer H., Schänzer W. HPLC clean-up for urine samples with disturbingbackground for confirmation of 17β-methyl-5β-androst-1-ene-3α,17α-diol (epimetenediol). In:Recent Advances in Doping Analysis (4): Proceedings of the Manfred Donike Workshop, 14thCologne Workshop on Dope Analysis, 14th to 22nd March 1996. Schänzer W., Geyer H.,Gotzmann A., Mareck-Engelke U. (Eds.) Verlag Sport and Buch Strauß, Köln (1997) 239-245.
[68] Marcos J., de la Torre X., Gonzalez J.C., Segura J., Pascual J.A. Liquid chromatography clean-upmethod to improve identification of anabolic agents in human urine by gas chromatography-massspectrometry. Anal. Chim. Acta 522 (2004) 79-88.
[69] Geyer H., Mareck-Engelke U., Schänzer W., Donike M. Simple purification of urine samples forimproved detection of anabolic and endogenous steroids. In: Recent Advances in Doping Analysis:Proceedings of the 11th Cologne Workshop on Dope Analysis, 7th to 12th March 1993. DonikeM., Geyer H., Gotzmann A., Mareck-Engelke U., Rauth S. (Eds.) Verlag Sport and Buch Strauß,Köln (1994) 97-103.
[70] Leinonen A., Savonen L., Kuoppasalmi K. Improved purification of anabolic steroids for GC/MSanalysis. In: Recent Advances in Doping Analysis: Proceedings of the 11th Cologne Workshop onDope Analysis, 7th to 12th March 1993. Donike M., Geyer H., Gotzmann A., Mareck-Engelke U.,Rauth S. (Eds.) Verlag Sport and Buch Strauß, Köln (1994) 25-31.
[71] Rasmussen K.E., Pedersen-Bjergaard S. Developments in hollow fibre-based, liquid-phasemicroextraction. Trends Anal. Chem. 23 (2004) 1-10.
[72] Rasmussen K.E., Pedersen-Bjergaard S., Krogh M., Ugland H.G., Grønhaug T. Development of asimple in-vial liquid-phase microextraction device for drug analysis compatible with capillary gaschromatography, capillary electrophoresis and high-performance liquid chromatography. J.Chromatogr. A 873 (2000) 3-11.
[73] Lavine BK. Chemometrics. Anal. Chem. 72 (2000) 91R-97R.
[74] Karjalainen E.J., Karjalainen U.P. Data handling in science and technology - volume 17. Dataanalysis for hyphenated techniques. Vandeginste B.G.M, Rutan S.C. (Advisory eds.) ElsevierScience B.V., Amsterdam (1996).
[75] Liang Y, Kvalheim OM. Resolution of two-way-data: theoretical background and practicalproblem-solving. Fresenius J. Anal. Chem. 370 (2001) 694-704.

62
[76] Pool W.G., de Leeuw J.W., van de Graaf B. Automated extraction of pure mass spectra from gaschromatographic/mass spectrometric data. J. Mass. Spectrom. 32 (1997) 438-443.
[77] Colby B.N. Spectral deconvolution for overlapping GC/MS components. J. Am. Soc. MassSpectrom. 3 (1992) 558-562.
[78] Stein S.E. An integrated method for spectrum extraction and compound identification from gaschromatography/mass spectrometry data. J. Am. Soc. Mass Spectrom. 10 (1999) 770-781.
[79] Shen H., Grun B., Kvalheim O.M., Eide I. Automated curve resolution applied to data from multi-detection instruments. Anal. Chim. Acta 446 (2001) 313-328.
[80] Karjalainen E.J., Karjalainen U.P. Component reconstruction in the primary space of spectra andconcentrations. Alternating regression and related direct methods. Anal. Chim. Acta 250 (1991)169-179.
[81] van Zomeren P.V., Darwinkel H., Coenegracht P.M.J., de Jong G.J. Comparison of several curveresolution methods for drug impurity profiling using high-performance liquid chromatography withdiode array detection. Anal. Chim. Acta 487 (2003) 155-170.
[82] Guo F.-Q., Liang Y.-Z., Xu C.-J., Huang L.-F. Determination of the volatile chemical constituentsof Notoptergium incium by gas chromatography-mass spectrometry and iterative or non-iterativechemometric resolution methods. J. Chromatogr. A 1016 (2003) 99-110.
[83] Karjalainen E.J., Karjalainen U.P. Mathematical chromatography in GC/MS - finding the puremass spectra. Clinical Chemistry Research Foundation Library Vol.1. Tenhunen R. (Ed.) UnitedLaboratories, Helsinki (1984).
[84] Finck Y., Aydin N., Pellaton C., Gorin G., Gülacar F. Combination of gas chromatography-massspectrometry and mass spectral deconvolution for structural elucidation of an unusual C29-steroiddetected in complex sedimentary matrix. J. Chromatogr. A 1049 (2004) 227-231.
[85] World Anti-Doping Agency. Reporting and evaluation guidance for testosterone, epitestosterone,T/E ratio and other endogenous steroids. WADA Technical Document - TD2004EAAS version 1.0.Available at: http://www.wada-ama.org (accessed November 2005).
[86] World Anti-Doping Agency. The 2005 prohibited list. Available at: http://www.wada-ama.org(accessed November 2005).
[87] Ayotte C., Gourdeault D., Charlebois A. Testing of natural and synthetic anabolic steroids inhuman urine. J. Chromatogr. B 687 (1996) 3-25.
[88] Donike M., Bärwald K.-R., Klostermann K., Schänzer W., Zimmermann J. Nachweis vonexogenem testosteron - The detection of exogenous testosterone. In: Sport: Leistung undGesundheit, Kongreßbd. Dtsch. Sportärztekongress 1982 Köln. Heck H., Hollmann W., Leisen H.,Rost R. (Eds.) Leistung und gesundheit Köln Deutsche Ärtze-Verlag (1983) 292-300.
[89] Kicman A.T., Coutts S.B., Walker C.J., Cowan D.A. Proposed confirmatory procedure fordetecting 5 alpha-dihydrotestosterone doping in male athletes. Clin. Chem. 41 (1995) 1617-1627.
[90] Catlin D.H., Hatton C.K., Starcevic S.H. Issues in detecting abuse of xenobiotic anabolic steroidsand testosterone by analysis of athletes’ urine. Clin. Chem. 43 (1997) 1280-1288.
[91] Becchi M., Aguilera R., Farizon Y., Flament M.M., Casabianca H., James P. Gaschromatography/combustion/isotope-ratio mass spectrometry analysis of urinary steroids to detect

63
misuse of testosterone in sport. Rapid Commun. Mass Spectrom. 8 (1994) 304-308.
[92] Aguilera R., Becchi M., Casabianca H., Hatton C.K., Catlin D.H., Starcevic B., Pope H.G. Jr.Improved method of detection of testosterone abuse by gas chromatography/combustion/isotoperatio mass spectrometry analysis of urinary steroids. J. Mass Spectrom. 31 (1996) 169-176.
[93] Shackleton C.H.L., Phillips A., Chang T., Li Y. Confirming testosterone administration by isotoperatio mass spectrometric analysis of urinary androstanediols. Steroids 62 (1997) 379-387.
[94] Trout G.J., Rogerson J.H., Cawley A.T., Alma C.W. Developments in sports drug testing. Aust. J.Chem. 56 (2003) 175-180.
[95] Horning S., Geyer H., Machnik M., Schänzer W., Hilkert A., Oeßelmann J. Detection of exogenoustestosterone by 13C/12C analysis. In: Recent Advances in Doping Analysis (4): Proceedings of theManfred Donike Workshop, 14th Cologne Workshop on Dope Analysis, 17th to 22nd March 1996.Schänzer W., Geyer H., Gotzmann A., Mareck-Engelke U. (Eds.) Verlag Sport and Buch Strauß,Köln (1997) 275-283.
[96] Chan S., Waite T.D., Schäfer A.I., Fane A.G. Adsorption of the endocrine-active compoundestrone on microfiltration hollow fiber memranes. Environ. Sci. Technol. 37 (2003) 3158-3163.
[97] Kuosmanen K., Lehmusjärvi M., Hyötyläinen T., Jussila M., Riekkola M.-L. Factors affectingmicroporous membrane liquid-liquid extraction. J. Sep. Sci. 26 (2003) 893-902.
[98] Guo X., Mitra S. On-line membrane extraction liquid chromatography for monitoring semi-volatileorganics in aqueous matrices. J. Chromatogr. A 904 (2000) 189-196.
[99] Audunsson G. Aqueous/aqueous extraction by means of a liquid membrane for sample cleanup andpreconcentration of amines in a flow system. Anal. Chem. 58 (1986) 2714-2723.
[100] van Berkel G.J., Zhou F., Aronson J.T. Changes in bulk solution pH caused by the inherentcontrolled-current electrolytic process of an electrospray ion source. Int. J. Mass Spectrom. Ion.Proc. 162 (1997) 55-67.
[101] National Institute of Standards and Technology. NIST chemistry webbook - NIST standardreference database number 69, July 2001 release. Available at:http://www.webbook.nist.gov/chemistry/ (accessed July 2002).
[102] Kostiainen R., Bruins A.P. Effect of multiple sprayers on the dynamic range and flow ratelimitations in electrospray and ionspray mass spectrometry. Rapid Commun. Mass Spectrom. 8(1994) 549-558.