Embed Size (px)
Citation preview
Novel High Temperature and Radiation Resistant Infrared Glasses
and Optical Fibers for Sensing in Advanced Small Modular Reactors
Reactor ConceptsResearch Development and Demonstration (RCRD&D)
John BallatoClemson University
Brian Robinson, Federal POCDavid Holcomb, Technical POC
Project No. 13-4804
Final Report: Novel High Temperature and Radiation Resistant Infrared Glasses and Optical Fibers for Sensing in Advanced Small Modular Reactors (DE-NE0000727)
1. Overview
1.1 Abstract One binary and three series of ternary non-oxide pure sulfide glasses compositions
were investigated with the goal of synthesizing new glasses that exhibit high glass transition (Tg) and crystallization (Tc) temperatures, infrared transparency, and reliable glass formability. The binary glass series consisted of Ges2 and La2S3 and the three glass series in the x(nBaS + mLa2S3) + (1-2x)GeS2 ternary system have BaS:La2S3 modifier ratios of 1:1, 1:2, and 2:1 with . With these glasses, new insights were realized as to how ionic glasses form and how glass modifiers affect both structure and glass formability. All synthesized compositions were characterized by Infrared (IR) and Raman spectroscopies and differential thermal analysis (DTA) to better understand the fundamental structure, optical, and thermal characteristics of the glasses.
After a range of these glasses were synthesized, optimal compositions were formed
into glass disks and subjected to gamma irradiation. Glass disks were characterized both before and after irradiation by microscope imaging, measuring the refractive index, density, and UV-VIS-IR transmission spectra. The final total dose the samples were subjected to was ~2.5 MGy. Ternary samples showed a less than 0.4% change in density and refractive index and minimal change in transmission window. The glasses also resisted cracking as seen in microscope images. Overall, many glass compositions were developed that possess operating temperatures above 500 °C, where conventional chalcogenide glasses such as As2S3 and have Tgs from ~200-300 °C, and these glasses have a greater than Tc – Tg values larger than 100 °C and this shows that these glasses have good thermal stability of Tg such that they can be fabricated into optical fibers and as such can be considered candidates for high temperature infrared fiber optics. Initial fiber fabrication efforts showed that selected glasses could be drawn but larger samples would be needed for further development and optimization.
1.2 Research Motivation
Advanced Small Modular Reactor (AdvSMR) development is being considered as an
“energy-bridge” to providing the US with a sustainable, economically viable, and carbon-neutral energy supply. Future AdvSMR deployment requires new sensing and monitoring instrumentation, control, and human-machine interface (ICHMI) architectures that accommodate the extreme temperatures, pressures, corrosive environments, and
radiation fluxes of these new systems. Optical fiber-based sensing approaches have been identified by the DoE as suitable for measuring key AdvSMR process parameters. However, high temperature and radiation flux deployment of current silica-based optical fiber is limited by the fiber jacket properties and susceptibility of dopants to radiation-induced darkening. Overcoming the current optical fiber limitations would enable in-vessel optical access and optical-based ICHMI systems.
Non-oxide glasses conventionally employed for IR fiber-based sensors are resistant to radiation-induced darkening, but their relatively weak chemical bonding limits their working temperature range and thermal stability. This research focused on a family of non-oxide glass compositions that were built upon ionic bonding schemes. Due to their very different bonding, ionic non-oxide compounds can have significantly different properties than their covalent analogues including high melting points and significant radiation hardness.
2. Selection of the Glasses
Due to their widely different chemical bonding, ionic non-oxide glass
compositions possess dramatically different properties than their covalent analogues, including melting points of the ionic chalcogenides that they are formed from that can be in excess of 3,000°C and hence they can have very high glass transition temperatures (Tgs). Further, their ionic character gives rise to high electronic binding energies which can foster radiation hardness. Specifically, rare-earth chalcogenides, such as La2S3, and alkaline earth chalcogenides, such as BaS, have melting points of ~ 2,000°C and are strongly glass forming with other refractory sulfides, such as Ga2S3, which produce refractory, fully ionic, and IR transparent glasses.
This project has explored some of the more promising of these less studied, but none-the-less important ionically-bonded non-oxide glasses that possess high thermal stability and radiation hardness. We have developed compositions based upon chemical structure models that develop charge compensated networks, such as mixing high melting point divalent chalcogenides with a high melting point trivalent chalcogenides to produce an overall in situ tetrahedral network (ITN) that lends itself to increased glass formation. The composition MS + G’2S3, where M is a divalent metal, such as Ba, and G’ is a trivalent metal, such as La2S3 would be typical of this compositional model. Specific examples could be BaS + La2S3 + GeS2.
3. Synthesis of glasses in the xBaS + yLa2S3 + (1-x-y)GeS2 glass system
The handling of sulfide materials necessitates high purity nitrogen and argon
glovebox environments where the O2 and H2O levels are consistently below 5 ppm. As high purity germanium sulfide is expensive and not widely available, it was synthesized in the lab. Sixty-gram batches of stoichiometric amounts of germanium and sulfur
powders (germanium and sulfur from Arcos Organics 99.999 % pure) were sealed in a silica ampoule under vacuum.
The prepared ampoule containing the Ge and S powders was placed into a metal
chamber wrapped in nichrome wire to secure the chamber lid. The secured chamber was placed inside a tube furnace angled at 5 degrees above horizontal and connected to a motor to rotate the chamber at 10 rpm throughout the synthesis. The furnace was heated at 1 °C/min to 900 °C and held for 8 hours. After melting, the furnace was allowed to cool to room temperature naturally. The sample was removed from the ampoule and subsequently ball milled in a glovebox to a micron sized powder for use as a batch material.
In order to synthesize binary and ternary glasses, 5 gram batches of lab-synthesized
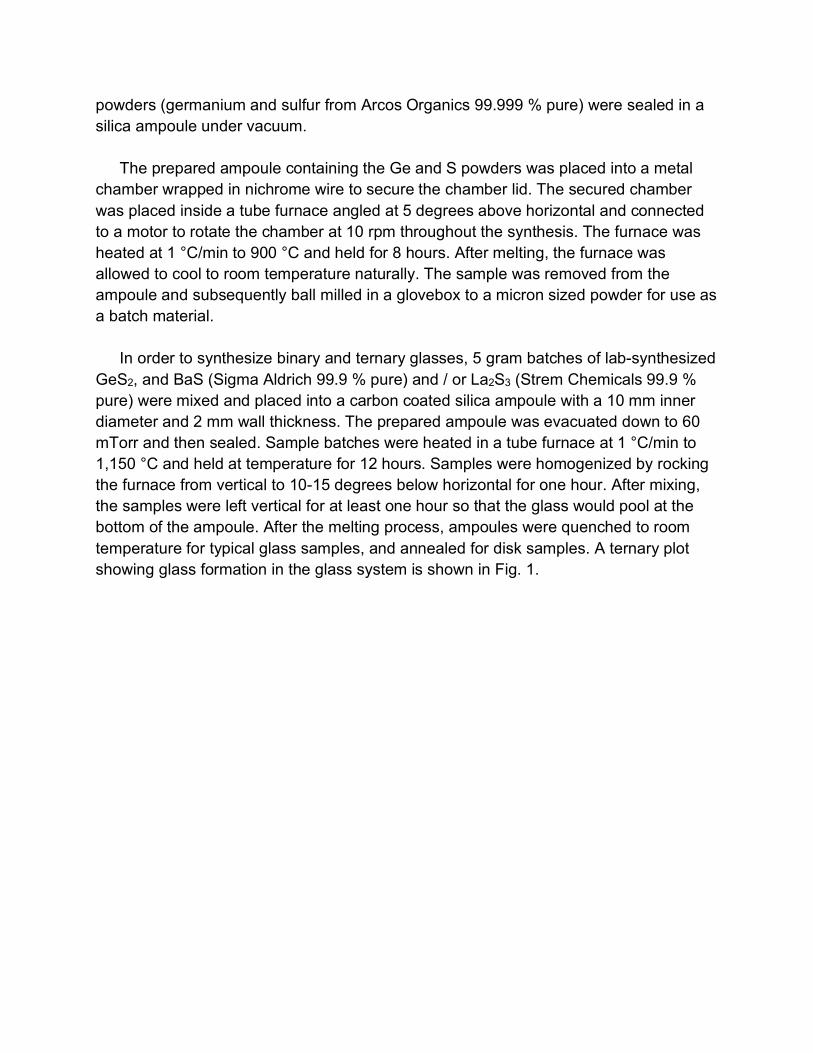
GeS2, and BaS (Sigma Aldrich 99.9 % pure) and / or La2S3 (Strem Chemicals 99.9 % pure) were mixed and placed into a carbon coated silica ampoule with a 10 mm inner diameter and 2 mm wall thickness. The prepared ampoule was evacuated down to 60 mTorr and then sealed. Sample batches were heated in a tube furnace at 1 °C/min to 1,150 °C and held at temperature for 12 hours. Samples were homogenized by rocking the furnace from vertical to 10-15 degrees below horizontal for one hour. After mixing, the samples were left vertical for at least one hour so that the glass would pool at the bottom of the ampoule. After the melting process, ampoules were quenched to room temperature for typical glass samples, and annealed for disk samples. A ternary plot showing glass formation in the glass system is shown in Fig. 1.
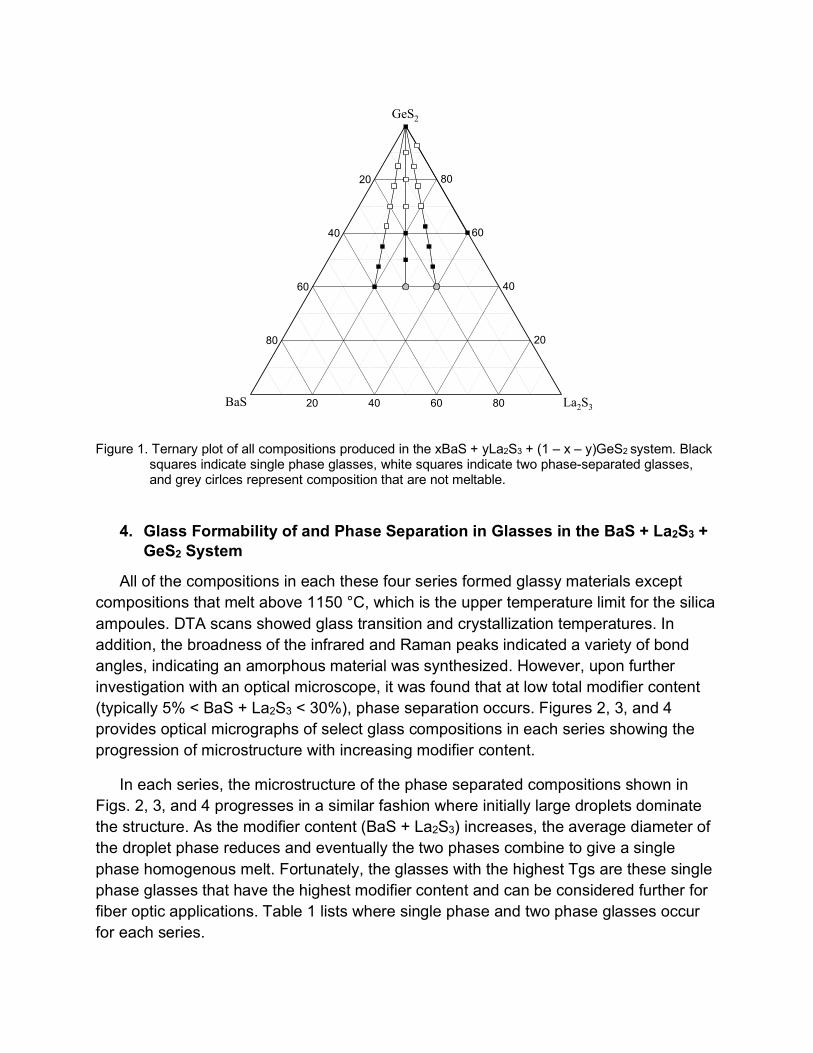
Figure 1. Ternary plot of all compositions produced in the xBaS + yLa2S3 + (1 – x – y)GeS2 system. Black
squares indicate single phase glasses, white squares indicate two phase-separated glasses, and grey cirlces represent composition that are not meltable.
4. Glass Formability of and Phase Separation in Glasses in the BaS + La2S3 + GeS2 System
All of the compositions in each these four series formed glassy materials except compositions that melt above 1150 °C, which is the upper temperature limit for the silica ampoules. DTA scans showed glass transition and crystallization temperatures. In addition, the broadness of the infrared and Raman peaks indicated a variety of bond angles, indicating an amorphous material was synthesized. However, upon further investigation with an optical microscope, it was found that at low total modifier content (typically 5% < BaS + La2S3 < 30%), phase separation occurs. Figures 2, 3, and 4 provides optical micrographs of select glass compositions in each series showing the progression of microstructure with increasing modifier content.
In each series, the microstructure of the phase separated compositions shown in Figs. 2, 3, and 4 progresses in a similar fashion where initially large droplets dominate the structure. As the modifier content (BaS + La2S3) increases, the average diameter of the droplet phase reduces and eventually the two phases combine to give a single phase homogenous melt. Fortunately, the glasses with the highest Tgs are these single phase glasses that have the highest modifier content and can be considered further for fiber optic applications. Table 1 lists where single phase and two phase glasses occur for each series.
20 40 60 80
20
40
60
8020
40
60
80
GeS2
La2S3BaS
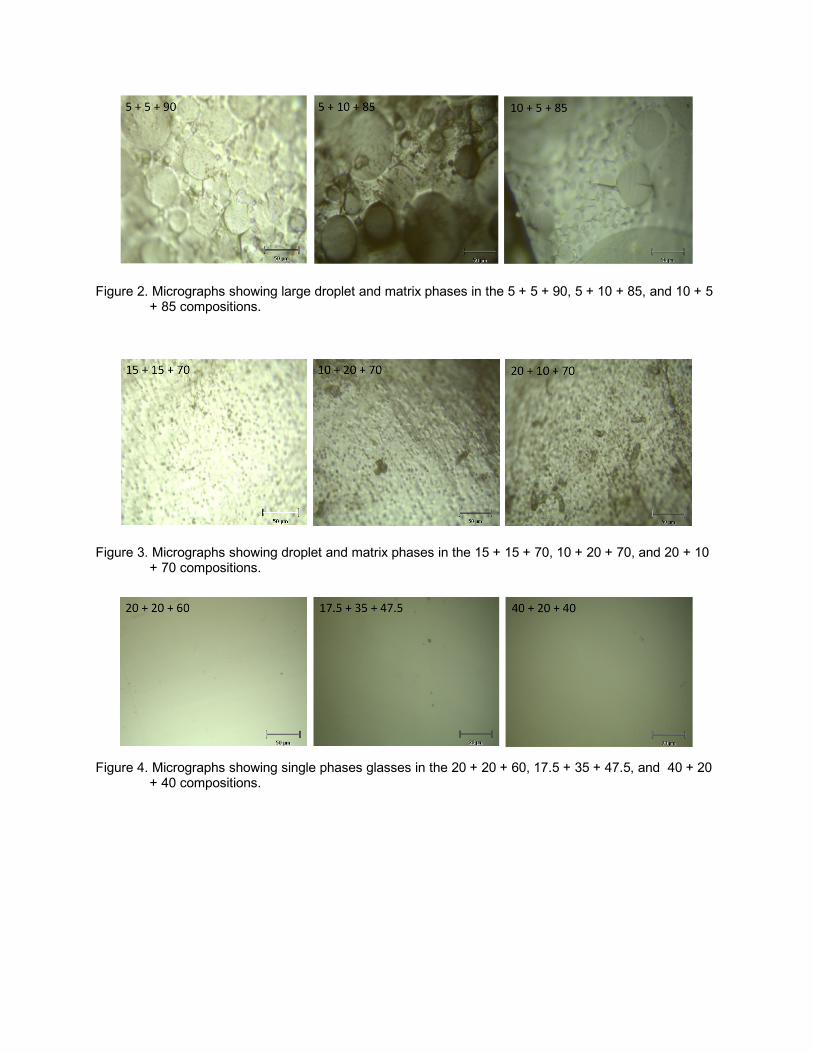
Figure 2. Micrographs showing large droplet and matrix phases in the 5 + 5 + 90, 5 + 10 + 85, and 10 + 5 + 85 compositions.
Figure 3. Micrographs showing droplet and matrix phases in the 15 + 15 + 70, 10 + 20 + 70, and 20 + 10
+ 70 compositions.
Figure 4. Micrographs showing single phases glasses in the 20 + 20 + 60, 17.5 + 35 + 47.5, and 40 + 20
+ 40 compositions.
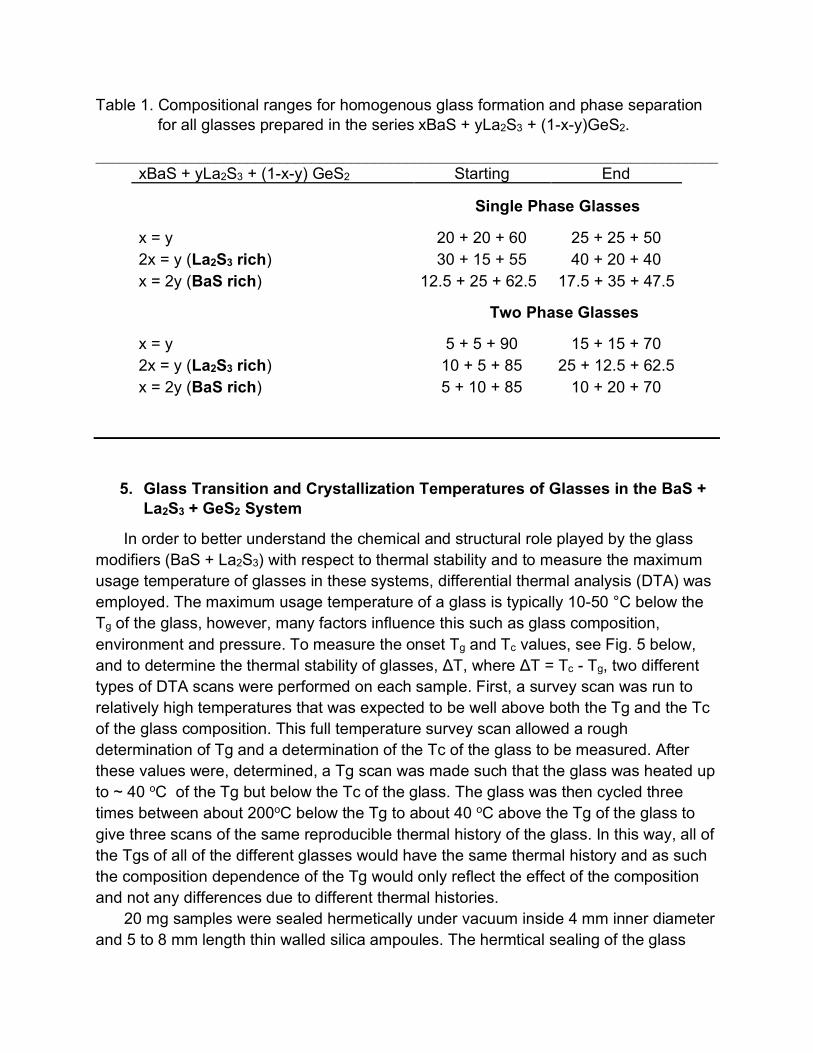
Table 1. Compositional ranges for homogenous glass formation and phase separation for all glasses prepared in the series xBaS + yLa2S3 + (1-x-y)GeS2.
______________________________________________________________________________ xBaS + yLa2S3 + (1-x-y) GeS2 Starting End
Single Phase Glasses
x = y 20 + 20 + 60 25 + 25 + 50 2x = y (La2S3 rich) 30 + 15 + 55 40 + 20 + 40 x = 2y (BaS rich) 12.5 + 25 + 62.5 17.5 + 35 + 47.5
Two Phase Glasses
x = y 5 + 5 + 90 15 + 15 + 70 2x = y (La2S3 rich) 10 + 5 + 85 25 + 12.5 + 62.5 x = 2y (BaS rich) 5 + 10 + 85 10 + 20 + 70
5. Glass Transition and Crystallization Temperatures of Glasses in the BaS + La2S3 + GeS2 System
In order to better understand the chemical and structural role played by the glass modifiers (BaS + La2S3) with respect to thermal stability and to measure the maximum usage temperature of glasses in these systems, differential thermal analysis (DTA) was employed. The maximum usage temperature of a glass is typically 10-50 °C below the Tg of the glass, however, many factors influence this such as glass composition, environment and pressure. To measure the onset Tg and Tc values, see Fig. 5 below, and to determine the thermal stability of glasses, ΔT, where ΔT = Tc - Tg, two different types of DTA scans were performed on each sample. First, a survey scan was run to relatively high temperatures that was expected to be well above both the Tg and the Tc of the glass composition. This full temperature survey scan allowed a rough determination of Tg and a determination of the Tc of the glass to be measured. After these values were, determined, a Tg scan was made such that the glass was heated up to ~ 40 oC of the Tg but below the Tc of the glass. The glass was then cycled three times between about 200oC below the Tg to about 40 oC above the Tg of the glass to give three scans of the same reproducible thermal history of the glass. In this way, all of the Tgs of all of the different glasses would have the same thermal history and as such the composition dependence of the Tg would only reflect the effect of the composition and not any differences due to different thermal histories.
20 mg samples were sealed hermetically under vacuum inside 4 mm inner diameter and 5 to 8 mm length thin walled silica ampoules. The hermtical sealing of the glass
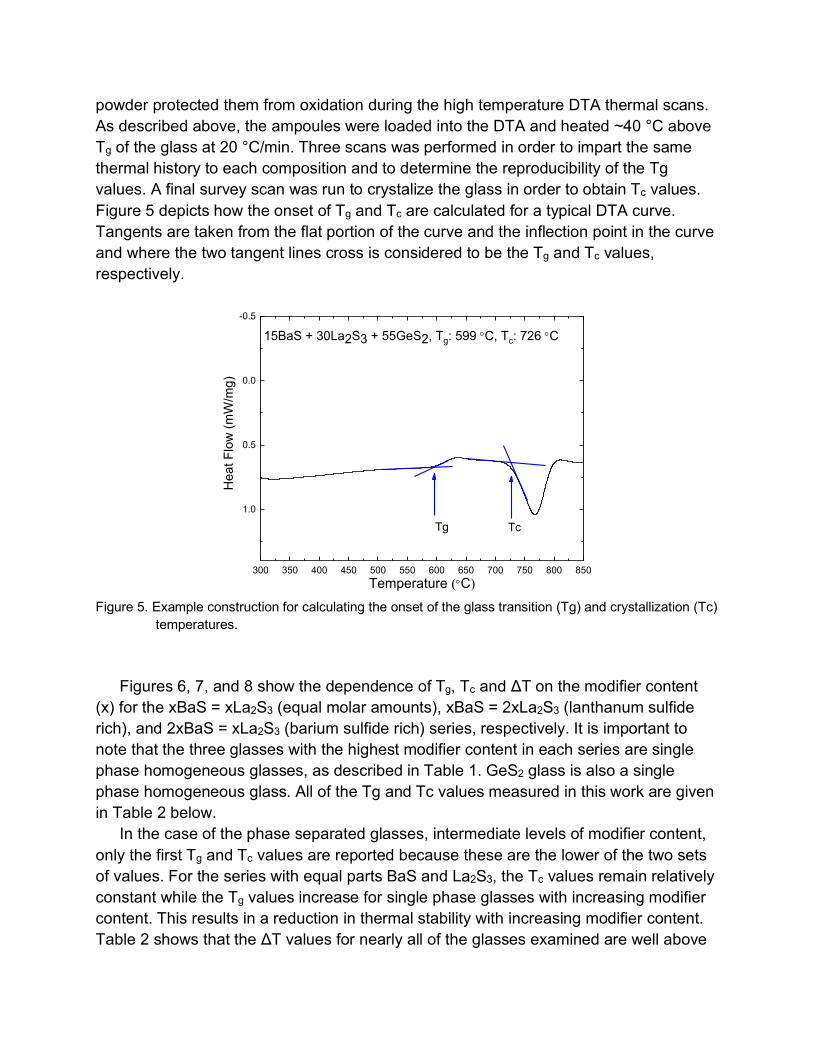
powder protected them from oxidation during the high temperature DTA thermal scans. As described above, the ampoules were loaded into the DTA and heated ~40 °C above Tg of the glass at 20 °C/min. Three scans was performed in order to impart the same thermal history to each composition and to determine the reproducibility of the Tg values. A final survey scan was run to crystalize the glass in order to obtain Tc values. Figure 5 depicts how the onset of Tg and Tc are calculated for a typical DTA curve. Tangents are taken from the flat portion of the curve and the inflection point in the curve and where the two tangent lines cross is considered to be the Tg and Tc values, respectively.
Figure 5. Example construction for calculating the onset of the glass transition (Tg) and crystallization (Tc)
temperatures.
Figures 6, 7, and 8 show the dependence of Tg, Tc and ΔT on the modifier content (x) for the xBaS = xLa2S3 (equal molar amounts), xBaS = 2xLa2S3 (lanthanum sulfide rich), and 2xBaS = xLa2S3 (barium sulfide rich) series, respectively. It is important to note that the three glasses with the highest modifier content in each series are single phase homogeneous glasses, as described in Table 1. GeS2 glass is also a single phase homogeneous glass. All of the Tg and Tc values measured in this work are given in Table 2 below.
In the case of the phase separated glasses, intermediate levels of modifier content, only the first Tg and Tc values are reported because these are the lower of the two sets of values. For the series with equal parts BaS and La2S3, the Tc values remain relatively constant while the Tg values increase for single phase glasses with increasing modifier content. This results in a reduction in thermal stability with increasing modifier content. Table 2 shows that the ΔT values for nearly all of the glasses examined are well above
300 350 400 450 500 550 600 650 700 750 800 850
1.0
0.5
0.0
-0.5
Hea
t Flo
w (m
W/m
g)
Temperature (°C)
15BaS + 30La2S3 + 55GeS2, Tg: 599 °C, Tc: 726 °C
Tg Tc
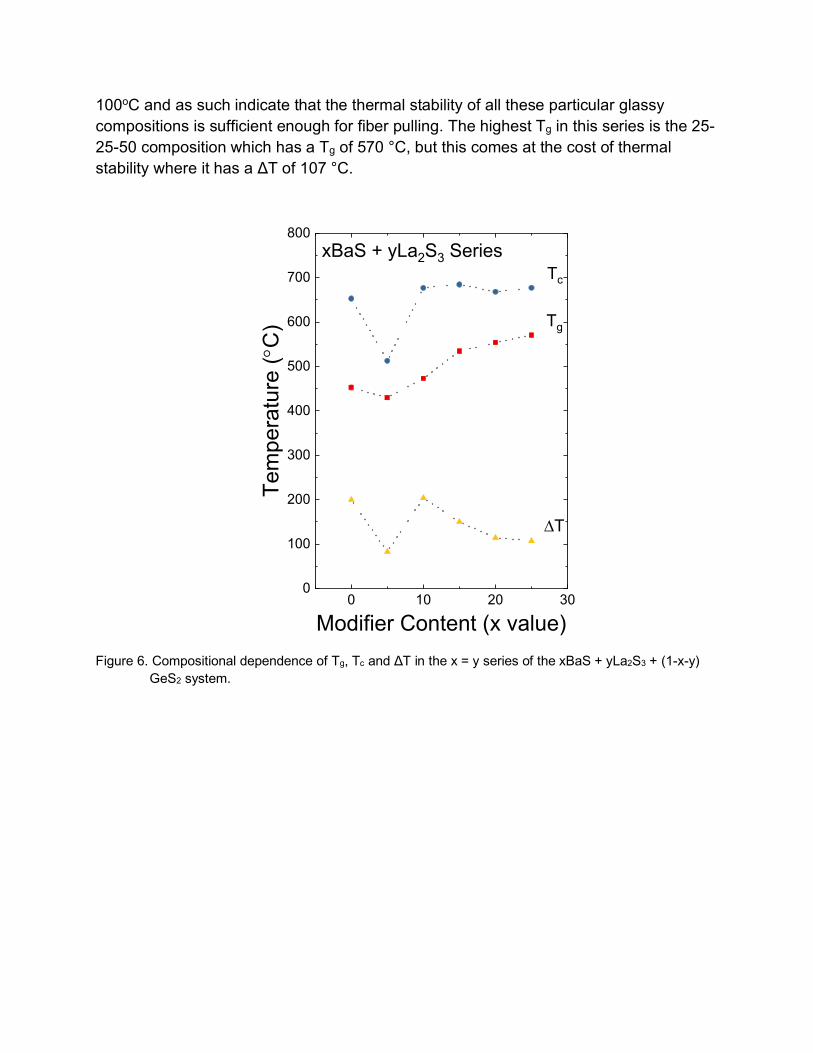
100oC and as such indicate that the thermal stability of all these particular glassy compositions is sufficient enough for fiber pulling. The highest Tg in this series is the 25-25-50 composition which has a Tg of 570 °C, but this comes at the cost of thermal stability where it has a ΔT of 107 °C.
Figure 6. Compositional dependence of Tg, Tc and ΔT in the x = y series of the xBaS + yLa2S3 + (1-x-y)
GeS2 system.
0 10 20 300
100
200
300
400
500
600
700
800
DT
Tg
Tem
pera
ture
(°C
)
Modifier Content (x value)
xBaS + yLa2S3 SeriesTc
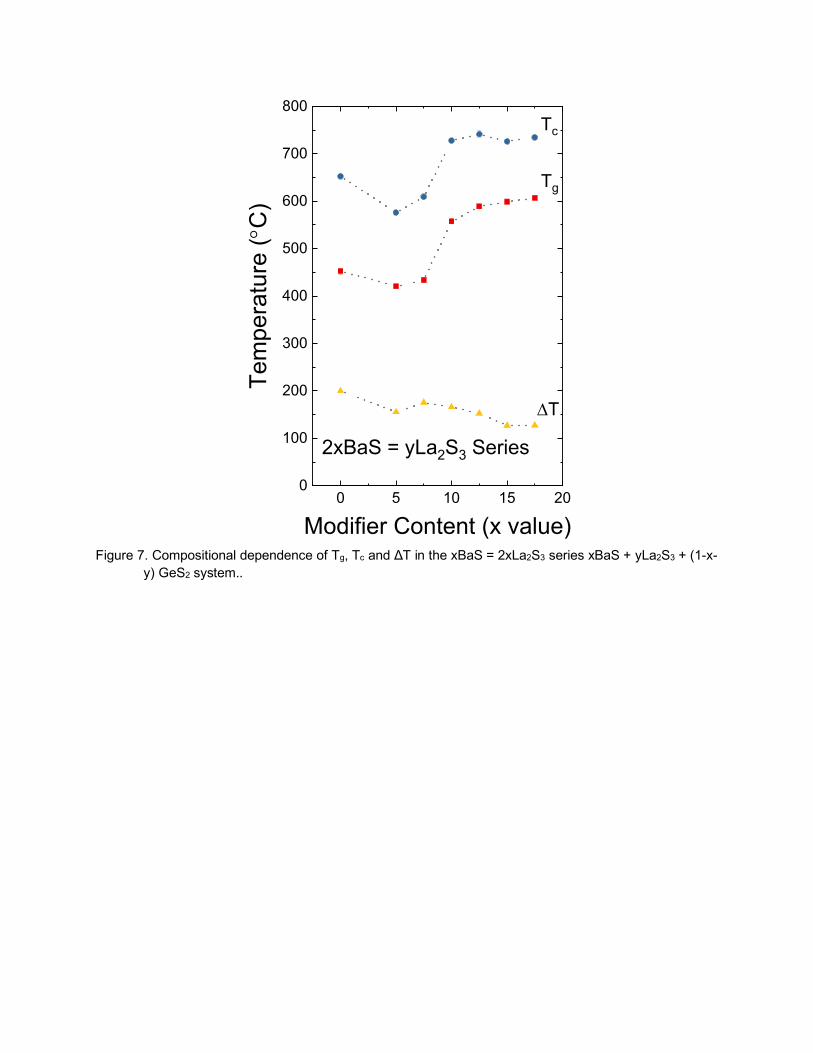
Figure 7. Compositional dependence of Tg, Tc and ΔT in the xBaS = 2xLa2S3 series xBaS + yLa2S3 + (1-x-
y) GeS2 system..
0 5 10 15 200
100
200
300
400
500
600
700
800
2xBaS = yLa2S3 Series
Tem
pera
ture
(°C
)
Modifier Content (x value)
Tc
Tg
DT
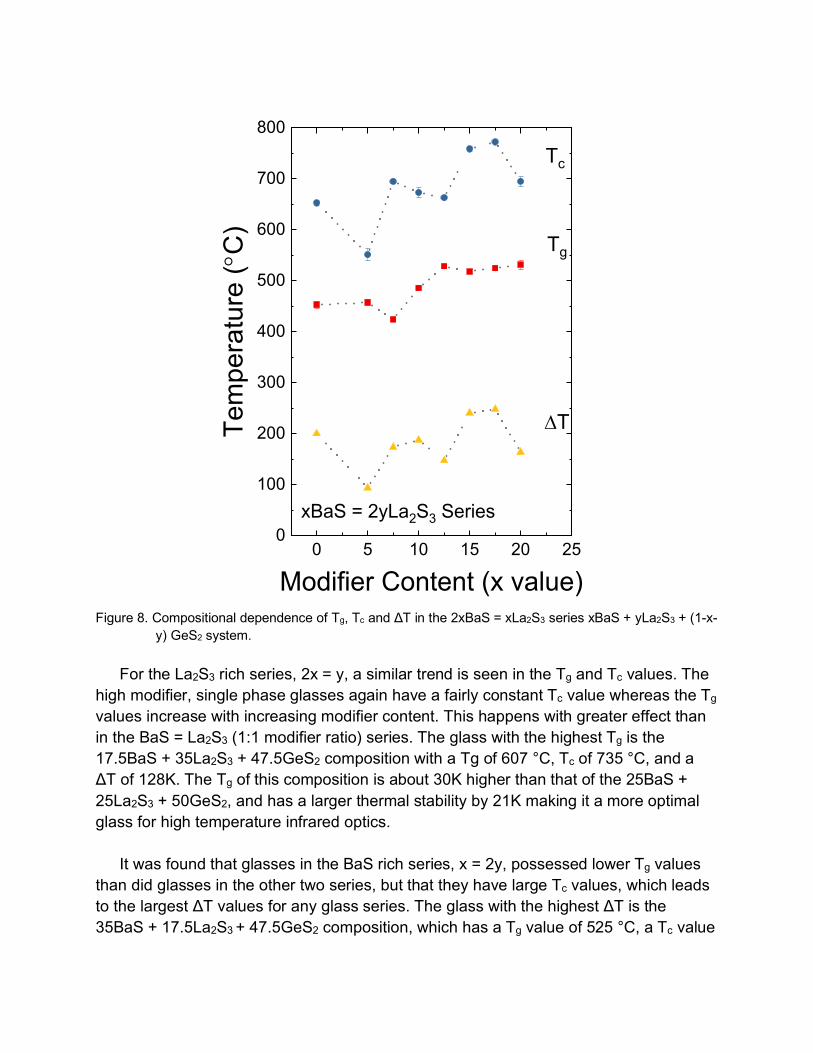
Figure 8. Compositional dependence of Tg, Tc and ΔT in the 2xBaS = xLa2S3 series xBaS + yLa2S3 + (1-x-
y) GeS2 system.
For the La2S3 rich series, 2x = y, a similar trend is seen in the Tg and Tc values. The high modifier, single phase glasses again have a fairly constant Tc value whereas the Tg values increase with increasing modifier content. This happens with greater effect than in the BaS = La2S3 (1:1 modifier ratio) series. The glass with the highest Tg is the 17.5BaS + 35La2S3 + 47.5GeS2 composition with a Tg of 607 °C, Tc of 735 °C, and a ΔT of 128K. The Tg of this composition is about 30K higher than that of the 25BaS + 25La2S3 + 50GeS2, and has a larger thermal stability by 21K making it a more optimal glass for high temperature infrared optics.
It was found that glasses in the BaS rich series, x = 2y, possessed lower Tg values
than did glasses in the other two series, but that they have large Tc values, which leads to the largest ΔT values for any glass series. The glass with the highest ΔT is the 35BaS + 17.5La2S3 + 47.5GeS2 composition, which has a Tg value of 525 °C, a Tc value
0 5 10 15 20 250
100
200
300
400
500
600
700
800
xBaS = 2yLa2S3 Series
Tem
pera
ture
(°C
)
Modifier Content (x value)
Tc
Tg
DT
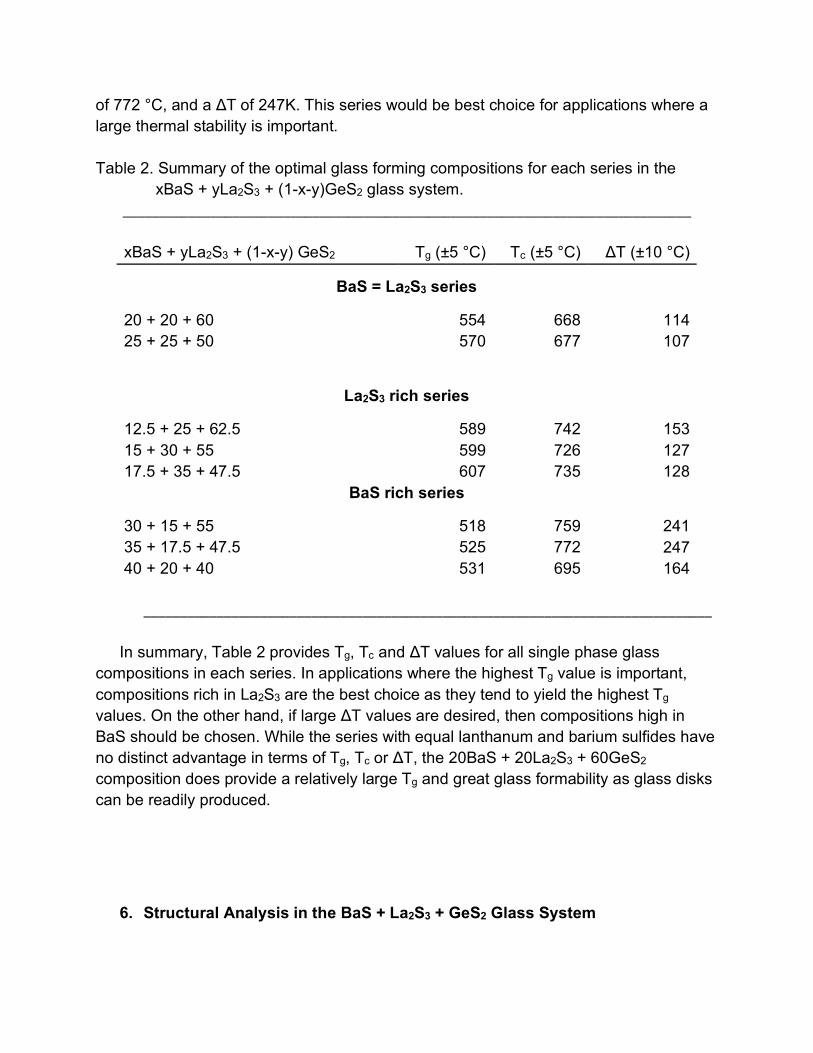
of 772 °C, and a ΔT of 247K. This series would be best choice for applications where a large thermal stability is important.
Table 2. Summary of the optimal glass forming compositions for each series in the
xBaS + yLa2S3 + (1-x-y)GeS2 glass system. ______________________________________________________________________________ xBaS + yLa2S3 + (1-x-y) GeS2
Tg (±5 °C)
Tc (±5 °C)
ΔT (±10 °C)
BaS = La2S3 series
20 + 20 + 60 554 668 114 25 + 25 + 50 570 677 107
La2S3 rich series
12.5 + 25 + 62.5 589 742 153 15 + 30 + 55 599 726 127 17.5 + 35 + 47.5 607 735 128
BaS rich series
30 + 15 + 55 518 759 241 35 + 17.5 + 47.5 525 772 247 40 + 20 + 40 531 695 164
______________________________________________________________________________
In summary, Table 2 provides Tg, Tc and ΔT values for all single phase glass
compositions in each series. In applications where the highest Tg value is important, compositions rich in La2S3 are the best choice as they tend to yield the highest Tg values. On the other hand, if large ΔT values are desired, then compositions high in BaS should be chosen. While the series with equal lanthanum and barium sulfides have no distinct advantage in terms of Tg, Tc or ΔT, the 20BaS + 20La2S3 + 60GeS2 composition does provide a relatively large Tg and great glass formability as glass disks can be readily produced.
6. Structural Analysis in the BaS + La2S3 + GeS2 Glass System
6.1 Raman Spectroscopy
Raman spectroscopy was utilized in order to obtain a better understanding of the local structure of the glass network. Typical structures found in GeS2 glass networks are shown in Fig. 9. Figures 10, 11, and 12 give the Raman spectra for all glasses synthesized in the BaS = La2S3, 2xBaS = La2S3 and xBaS = 2xLa2S3 series, respectively.A ten 10-second sample spectra were collected with a 5x objective at 100% power using a 488 nm laser on a Renishaw inVia Raman spectrometer. Spectra were also taken of low modifier content phase separated glasses with a high magnification 20x and 50x objective to determine the Raman spectra of the individual phase separated regions. Representative comparison spectra of the matrix and droplet phases (see Fig. 13) are given in Fig. 13. All of the Raman spectra of all the different glasses in all of the three different series glasses in this ternary system have a similar Raman spectra envelop. This arises from the common GeS4 tetrahedron that is the main building block of the network structure of all of these different glasses. All of the spectra were normalized such that the highest intensity band has the same intensity for each composition in each spectra set.
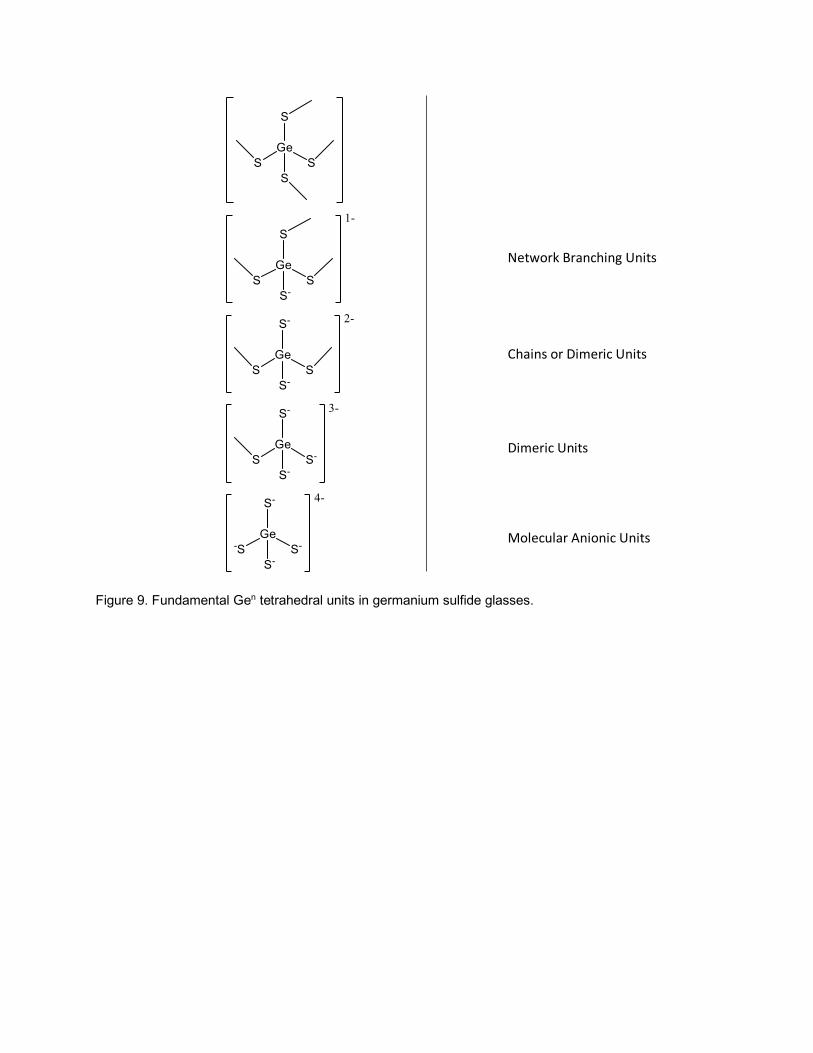
Figure 9. Fundamental Gen tetrahedral units in germanium sulfide glasses.
Network Branching Units
Chains or Dimeric Units
Dimeric Units
Molecular Anionic Units
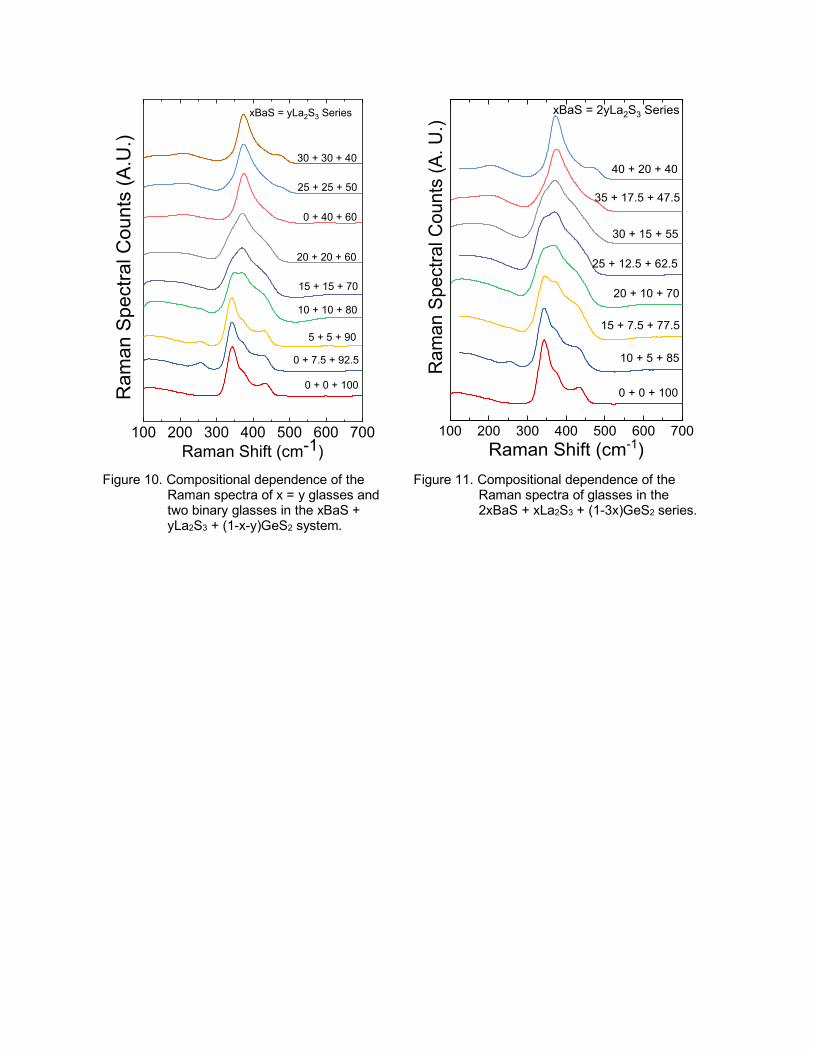
Figure 10. Compositional dependence of the
Raman spectra of x = y glasses and two binary glasses in the xBaS + yLa2S3 + (1-x-y)GeS2 system.
Figure 11. Compositional dependence of the Raman spectra of glasses in the 2xBaS + xLa2S3 + (1-3x)GeS2 series.
100 200 300 400 500 600 700
10 + 10 + 80
Ram
an S
pect
ral C
ount
s (A
.U.)
Raman Shift (cm-1)
30 + 30 + 40
25 + 25 + 50
0 + 40 + 60
20 + 20 + 60
15 + 15 + 70
5 + 5 + 90
0 + 7.5 + 92.5
0 + 0 + 100
xBaS = yLa2S3 Series
100 200 300 400 500 600 700
xBaS = 2yLa2S3 Series
40 + 20 + 40
0 + 0 + 100
Ram
an S
pect
ral C
ount
s (A
. U.)
Raman Shift (cm-1)
15 + 7.5 + 77.5
10 + 5 + 85
20 + 10 + 70
25 + 12.5 + 62.5
30 + 15 + 55
35 + 17.5 + 47.5
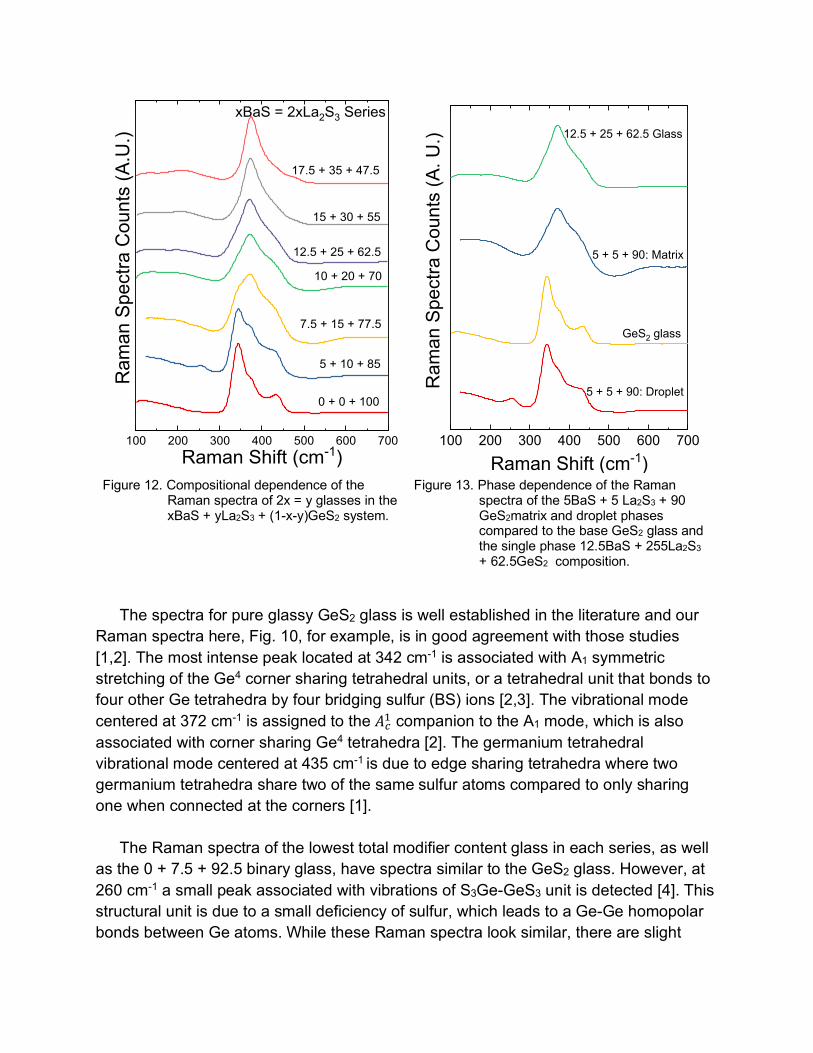
Figure 12. Compositional dependence of the
Raman spectra of 2x = y glasses in the xBaS + yLa2S3 + (1-x-y)GeS2 system.
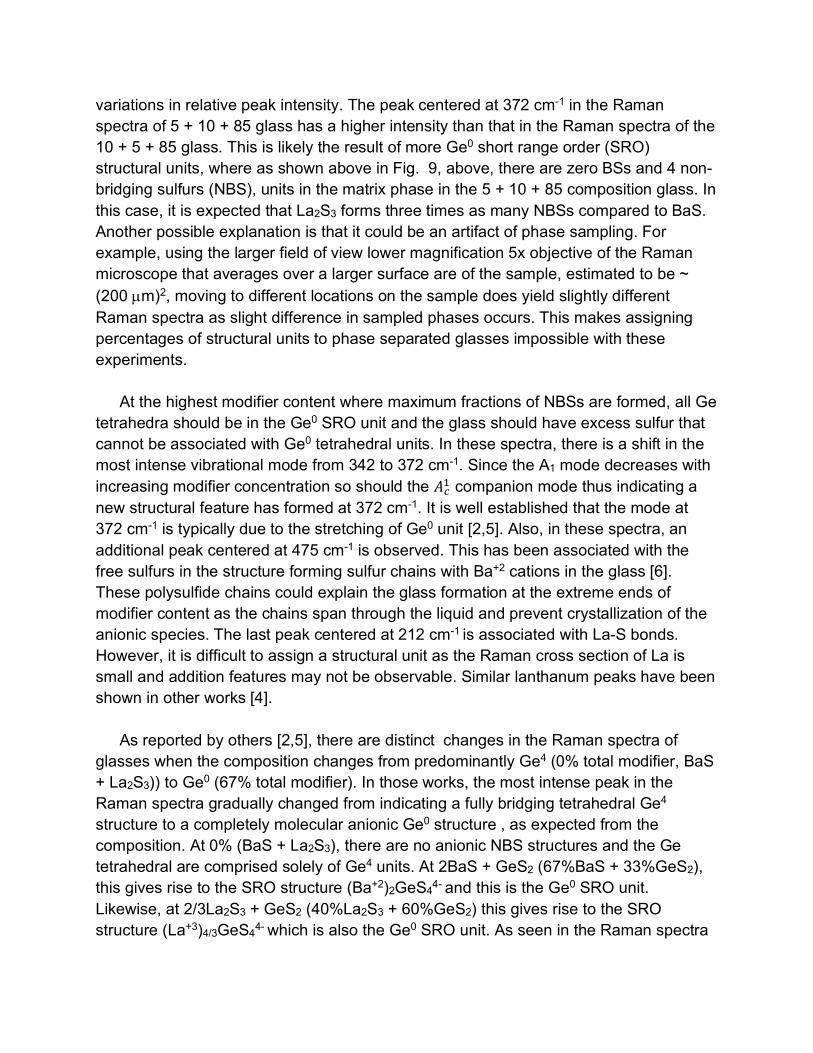
Figure 13. Phase dependence of the Raman spectra of the 5BaS + 5 La2S3 + 90 GeS2matrix and droplet phases compared to the base GeS2 glass and the single phase 12.5BaS + 255La2S3 + 62.5GeS2 composition.
The spectra for pure glassy GeS2 glass is well established in the literature and our
Raman spectra here, Fig. 10, for example, is in good agreement with those studies [1,2]. The most intense peak located at 342 cm-1 is associated with A1 symmetric stretching of the Ge4 corner sharing tetrahedral units, or a tetrahedral unit that bonds to four other Ge tetrahedra by four bridging sulfur (BS) ions [2,3]. The vibrational mode centered at 372 cm-1 is assigned to the 𝐴"# companion to the A1 mode, which is also associated with corner sharing Ge4 tetrahedra [2]. The germanium tetrahedral vibrational mode centered at 435 cm-1 is due to edge sharing tetrahedra where two germanium tetrahedra share two of the same sulfur atoms compared to only sharing one when connected at the corners [1].
The Raman spectra of the lowest total modifier content glass in each series, as well
as the 0 + 7.5 + 92.5 binary glass, have spectra similar to the GeS2 glass. However, at 260 cm-1 a small peak associated with vibrations of S3Ge-GeS3 unit is detected [4]. This structural unit is due to a small deficiency of sulfur, which leads to a Ge-Ge homopolar bonds between Ge atoms. While these Raman spectra look similar, there are slight
100 200 300 400 500 600 700
xBaS = 2xLa2S3 Series
0 + 0 + 100
Ram
an S
pect
ra C
ount
s (A
.U.)
Raman Shift (cm-1)
5 + 10 + 85
7.5 + 15 + 77.5
10 + 20 + 70
12.5 + 25 + 62.5
15 + 30 + 55
17.5 + 35 + 47.5
100 200 300 400 500 600 700
5 + 5 + 90: Matrix
Ram
an S
pect
ra C
ount
s (A
. U.)
Raman Shift (cm-1)
5 + 5 + 90: Droplet
GeS2 glass
12.5 + 25 + 62.5 Glass
variations in relative peak intensity. The peak centered at 372 cm-1 in the Raman spectra of 5 + 10 + 85 glass has a higher intensity than that in the Raman spectra of the 10 + 5 + 85 glass. This is likely the result of more Ge0 short range order (SRO) structural units, where as shown above in Fig. 9, above, there are zero BSs and 4 non-bridging sulfurs (NBS), units in the matrix phase in the 5 + 10 + 85 composition glass. In this case, it is expected that La2S3 forms three times as many NBSs compared to BaS. Another possible explanation is that it could be an artifact of phase sampling. For example, using the larger field of view lower magnification 5x objective of the Raman microscope that averages over a larger surface are of the sample, estimated to be ~ (200 µm)2, moving to different locations on the sample does yield slightly different Raman spectra as slight difference in sampled phases occurs. This makes assigning percentages of structural units to phase separated glasses impossible with these experiments.
At the highest modifier content where maximum fractions of NBSs are formed, all Ge
tetrahedra should be in the Ge0 SRO unit and the glass should have excess sulfur that cannot be associated with Ge0 tetrahedral units. In these spectra, there is a shift in the most intense vibrational mode from 342 to 372 cm-1. Since the A1 mode decreases with increasing modifier concentration so should the 𝐴"# companion mode thus indicating a new structural feature has formed at 372 cm-1. It is well established that the mode at 372 cm-1 is typically due to the stretching of Ge0 unit [2,5]. Also, in these spectra, an additional peak centered at 475 cm-1 is observed. This has been associated with the free sulfurs in the structure forming sulfur chains with Ba+2 cations in the glass [6]. These polysulfide chains could explain the glass formation at the extreme ends of modifier content as the chains span through the liquid and prevent crystallization of the anionic species. The last peak centered at 212 cm-1 is associated with La-S bonds. However, it is difficult to assign a structural unit as the Raman cross section of La is small and addition features may not be observable. Similar lanthanum peaks have been shown in other works [4].
As reported by others [2,5], there are distinct changes in the Raman spectra of
glasses when the composition changes from predominantly Ge4 (0% total modifier, BaS + La2S3)) to Ge0 (67% total modifier). In those works, the most intense peak in the Raman spectra gradually changed from indicating a fully bridging tetrahedral Ge4 structure to a completely molecular anionic Ge0 structure , as expected from the composition. At 0% (BaS + La2S3), there are no anionic NBS structures and the Ge tetrahedral are comprised solely of Ge4 units. At 2BaS + GeS2 (67%BaS + 33%GeS2), this gives rise to the SRO structure (Ba+2)2GeS44- and this is the Ge0 SRO unit. Likewise, at 2/3La2S3 + GeS2 (40%La2S3 + 60%GeS2) this gives rise to the SRO structure (La+3)4/3GeS44- which is also the Ge0 SRO unit. As seen in the Raman spectra
for each of these series, the glasses do not exhibit a majority of Ge3 Ge2 or Ge1 units, and, rather it appears to be a proportional mix of the two end spectra. We hypothesize that, because these glasses phase separate out a modifier rich phase, the germanium tetrahedral units in the matrix phase are converted into Ge0 units, while the droplet phase consist predominantly of Ge4 units. This behavior can be explained as each one mole% addition of BaS and La2S3 adds eight additional moles of NBS to the glass network where each barium cation adds two and each lanthanum cation adds three NBS. This gives rise to the rapid shift from fully bridging Ge4 tetrahedral units to the molecular anionic Ge0 units in the matrix phase for phase separated glasses. At high modifier contents, the phases combine forming predominantly Ge0 units with a small fraction of Ge1 units that vibrate at around 400 cm-1. This hypothesis is supported as Raman spectra from each phase were collected with the much smaller field of view 20x and 50x objective for phase separated samples and the comparison between the two phases in the 5 + 5 + 90 composition are shown in Fig 13. The droplet phase spectrum is consistent with the GeS2 spectra, while the matrix phase is more consistent with more heavily modified glass of Ge0 strucrure. This behavior is consistent across all phase separated compositions.
Typically, as a glass becomes more depolymerized the Tg decreases. However, an increase in the Tg is observed here. This suggests that an ionic bonding scheme centered perhaps on the GeS44- molecular anion or barium polysulfide chains may be bridging the heavily modified glassy materials together.
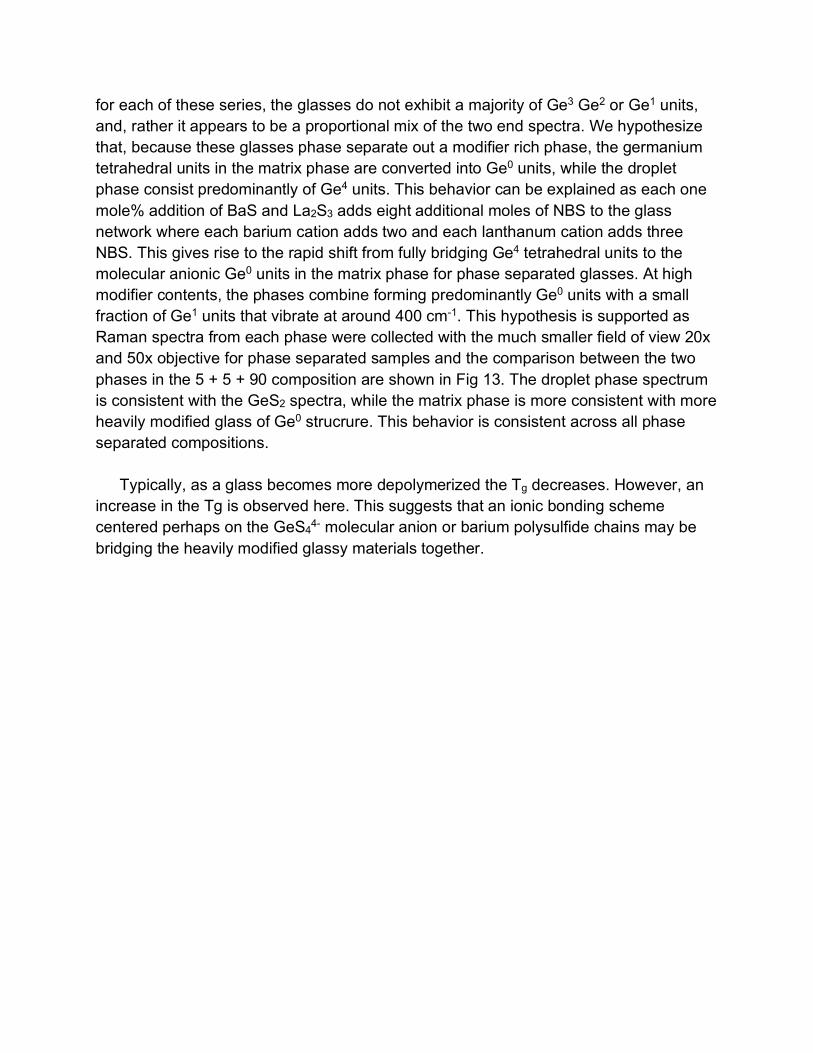
Figure 14. Compositional dependence of the IR spectra of x = y glasses and two binary glasses in the xBaS + yLa2S3 + (1-x-y)GeS2 system.
Figure 15. Compositional dependence of the IRspectra of glasses in the 2xBaS + xLa2S3 + (1-3x)GeS2 series.
6.2 Infrared Spectroscopy a. Dilute concentration for Structural Studies
Infrared spectra of the glass are shown in Figs. 14, 15 and 16 for xBaS = xLa2S3,
2xBaS = xLa2S3 and xBaS = 2xLa2S3 series, respectively. Sample pellets were produced by milling together 7.5 mg glass and 200 mg CsI and pressing the resultant powder into a pellet die. The linewidth of the peaks suggests that all compositions are in the glassy state as glasses have a larger distribution of bond angles compared to crystals giving rise to significantly broader peaks for glassy compared to polycrystalline samples. The IR spectra average mm distances of the pressed pellet samples and as a result the identifitication of different phase separated covalent Ge4 regions from the more ionic Ge0 phases is not possible. As both phases are present in the CsI pellet, their absorbances are combined and are roughly proportional to the concentration of the phase in the pellet as their molar absorptivities are likely to be similar.
100 200 300 400 500 600 700 800 9001000
0 + 7.5 + 92.5
5 + 5 + 90
10 + 10 + 80
15 + 15 + 70
0 + 40 + 60
20 + 20 + 60
Abso
rban
ce (a
.u.)
Wavenumber (cm-1)
0 + 0 + 100
25 + 25 + 50
xBaS = yLa2S3 Series
100 200 300 400 500 600 700 800 9001000
2xBaS = xLa2S3 Series
0 + 0 + 100
Abso
rban
ce (a
.u.)
Wavenumber (cm-1)
30 + 15 + 55
40 + 20 + 40
35 + 17.5 + 47.5
25 + 12.5 + 62.5
20 + 10 + 70
15 + 7.5 + 77.5
10 + 5 + 85
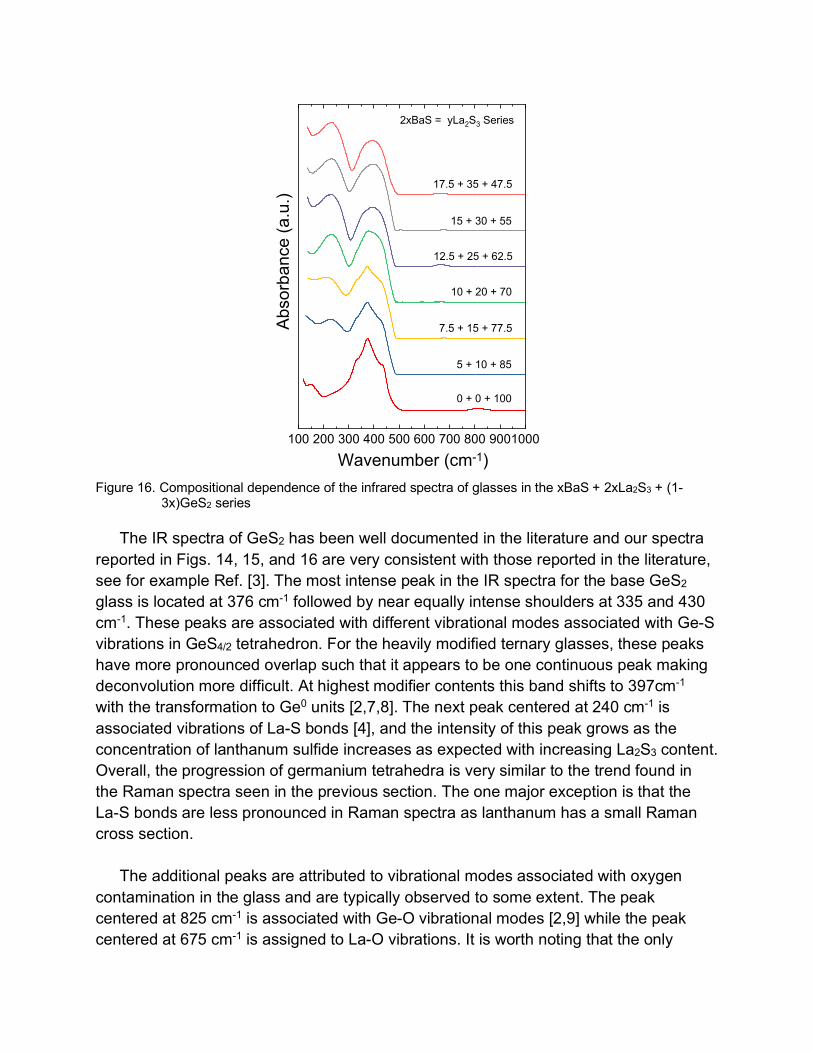
Figure 16. Compositional dependence of the infrared spectra of glasses in the xBaS + 2xLa2S3 + (1-
3x)GeS2 series The IR spectra of GeS2 has been well documented in the literature and our spectra
reported in Figs. 14, 15, and 16 are very consistent with those reported in the literature, see for example Ref. [3]. The most intense peak in the IR spectra for the base GeS2 glass is located at 376 cm-1 followed by near equally intense shoulders at 335 and 430 cm-1. These peaks are associated with different vibrational modes associated with Ge-S vibrations in GeS4/2 tetrahedron. For the heavily modified ternary glasses, these peaks have more pronounced overlap such that it appears to be one continuous peak making deconvolution more difficult. At highest modifier contents this band shifts to 397cm-1 with the transformation to Ge0 units [2,7,8]. The next peak centered at 240 cm-1 is associated vibrations of La-S bonds [4], and the intensity of this peak grows as the concentration of lanthanum sulfide increases as expected with increasing La2S3 content. Overall, the progression of germanium tetrahedra is very similar to the trend found in the Raman spectra seen in the previous section. The one major exception is that the La-S bonds are less pronounced in Raman spectra as lanthanum has a small Raman cross section.
The additional peaks are attributed to vibrational modes associated with oxygen
contamination in the glass and are typically observed to some extent. The peak centered at 825 cm-1 is associated with Ge-O vibrational modes [2,9] while the peak centered at 675 cm-1 is assigned to La-O vibrations. It is worth noting that the only
100 200 300 400 500 600 700 800 9001000
0 + 0 + 100
Abso
rban
ce (a
.u.)
Wavenumber (cm-1)
17.5 + 35 + 47.5
15 + 30 + 55
12.5 + 25 + 62.5
10 + 20 + 70
7.5 + 15 + 77.5
5 + 10 + 85
2xBaS = yLa2S3 Series
sample to contain the 825 cm-1 peak is the pure germanium sulfide glass. The other samples do not contain this peak but may instead exhibit the peak at 675 cm-1 associated with La-O vibrations. This suggests that lanthanum has a higher affinity for oxygen than germanium does in this system. Lastly, no spectral features past ~125 cm-1 can be resolved as the cesium iodide vibrates at that wavenumber eliminating transmission through the composite sample.
The most intense peak in the low modifier compositions is centered at 343 cm-1. This
peak is associated with the symmetric stretching, A1, vibrational mode of Ge4 tetrahedra where each germanium tetrahedron is connect to four other germanium tetrahedra at the corners. The second most intense peak in low modified glasses is located at 370 cm-1. This peak is due to vibrations of 𝐴"# companion mode to the A1 Ge4 stretching. The last peak seen in these spectra is located at 435 cm-1. This peak is due to edge sharing tetrahedron where two tetrahedra share two of the same sulfur ions, instead of sharing one like corner sharing tetrahedra. With increasing modifier concentration the peak at 343 cm-1 begins to decrease in intensity and with the must its companion mode at 370 cm-1. However, despite the concentration of Ge4 units decreasing with increasing modifier concentration, the peak at 370 cm-1 is growing. This is due to an increasing number of Ge0 units being formed by modifier additions, which overlaps with the 𝐴"# companion mode of the Ge4 tetrahedral stretching. The main difference between the three series’ spectra is the fact that the intensity Ge0 peak in the xBaS = 2xLa2S3 compositions grows quicker than that of the BaS = La2S3, and 2xBaS = xLa2S3 series. This can be explained as lanthanum sulfide adds 3 times more non-bridging sulfurs than barium sulfide does. This means Ge0 unit formation is much slower in those two series resulting in lower intensity at 370 cm-1 when comparing analogues.
b. Thick polished disc studies for transmission range measurements
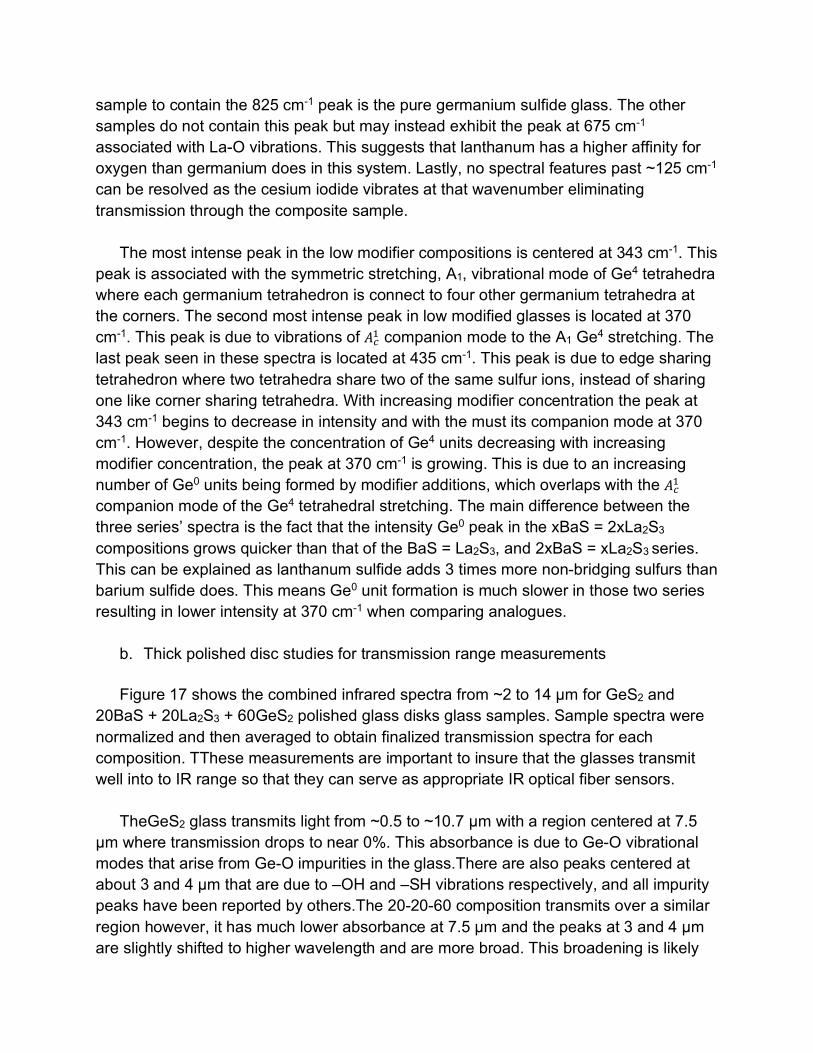
Figure 17 shows the combined infrared spectra from ~2 to 14 µm for GeS2 and
20BaS + 20La2S3 + 60GeS2 polished glass disks glass samples. Sample spectra were normalized and then averaged to obtain finalized transmission spectra for each composition. TThese measurements are important to insure that the glasses transmit well into to IR range so that they can serve as appropriate IR optical fiber sensors.
TheGeS2 glass transmits light from ~0.5 to ~10.7 µm with a region centered at 7.5 µm where transmission drops to near 0%. This absorbance is due to Ge-O vibrational modes that arise from Ge-O impurities in the glass.There are also peaks centered at about 3 and 4 µm that are due to –OH and –SH vibrations respectively, and all impurity peaks have been reported by others.The 20-20-60 composition transmits over a similar region however, it has much lower absorbance at 7.5 µm and the peaks at 3 and 4 µm are slightly shifted to higher wavelength and are more broad. This broadening is likely
spectral broadening due to multiple cations present forming a variety of X-OH bonds, where X = Ba, La, and Ge, slightly altering vibration wavelength. The long wavelength cutoff for these samples are at 10.7 µm for the GeS2 samples and 10.2 µm for the 20-20-60 samples. This is due to a combination of the materials strong Ge-S and to a lesser extent Ge-O vibrations. In ternary samples La-S vibrations also absorb heavily in this region.
Figure 17. Infrared absorption spectra through ~ 2mm thick polish lenses of base GeS2 and modified
20BaS + 20La2S3 + 60GeS2 glasses. IR transmission extends down to ~ 10 µm and shows that these glasses would be appropriate for use as IR transmission fiber optics.
The ternary 20-20-60 glass exhibits at least 50% of their maximum transmission
from about 0.5 to about 9 μm with a slight interruption from –OH bonds between 2.8-3.5 μm. The GeS2 glass exhibits more impurity absorptions than the ternary glasses. The GeS2 glass transmits from about 0.6 to about 7.2 μm with impurity bands in the region from 3.8- to 4.1 um also due to -OH vibrations and from 7.2-9.7 μm with an interruption from 7.2-8 μm due to Ge-O vibrations. Lastly, that the most intense absorber transitions
0 2 4 6 8 10 12
0
2
4
6
8
Ab
sorb
ance
l (µm)
GeS2
20BaS + 20La2S3 + 60 GeS2
from Ge-O vibrations in the germanium sulfide glasses to –OH vibrations in the 20-20-60 compositions.
As with many sulfide glasses, there exists some trace amount of water and oxygen contamination. With purification technique such as sulfur distillation and sulfurization of batch materials by passing H2S gas over them, the purity of these glasses could be improved.58,59 While these techniques were not available for this study, the improved purity would allow for better transmission across the infrared light spectrum and open up new opportunities in the chemical sensing field for these materials. If all contaminates could be removed from the samples the transmission window would span from approximately 0.5 to 10.5 µm.
Even with these contaminates in the glasses many different chemical species can be detected in the infrared spectrum, and by removing them even more can be detected. Some of the important chemical species that can be detected with these materials are vibrations associated with methane, sulfur dioxide and ammonia from 1300-1700 cm-1 and carbon monoxide and carbon dioxide from 2,100-2,400 cm-1. Many of these chemical species could be especially important for combustion reactions, but can be found in many other processes as well.
While the finger print region of the infrared spectrum, from 1400-600 wavenumbers, will typically be blocked by the intense sulfur bonds in sulfides glasses, there is still a large region of the infrared spectrum that can be utilized for chemical sensing. Many important chemical species are found in the region 4000-1400 cm-1 such as carbon, nitrogen, and hydrogen species. This is a tradeoff as many telluride and selenide compositions can detect chemicals in the molecular fingerprint region, but they cannot operate at elevated temperature. Luckily, most chemical species have multiple characteristic vibrational modes that occur at different locations in the infrared spectrum. In contrast to selenides and tellurides, oxides have significantly higher glass transition, crystallization and melting temperatures. With this comes a reduction in infrared transmission. Pure silica has one of the highest Tgs for traditional glasses at 1200 °C, but only transmits to about 4 μm depending on impurities. While changing glass formers and modifiers can influence these two properties, typically infrared transparency can only be extended to approximately 7 μm as shown in 60 TeO2 – xBi2O3 – (30−x)B2O3 – 10ZnO glasses.60 Again, with these strong IR transmitting oxides they have Tgs below 400 °C for compositions tested exhibiting the strong trade off of these two characteristics.
7. Glass Disk and Rod Formability Many attempts were made to produce sample disks for irradiation and glass rods for
fiber pulling. A series of experiments changing ampoule coating, crucible melting, and processing parameters was conducted in the hopes of defining a process for the consistent formation of glass disks and rods. The most successful approach to disk formation was changing the processing parameters. The annealing temperature, dwell time, and ramp down rate were varied in a series of experiments to come up with the ideal processing parameters of melting at 1150 °C for 12 hours then air quenching for 10-20 seconds followed with annealing at 555 °C for 45 mins and ramping down to room temperature at 0.6 °C/min. With dedication, glass disks made of GeS2 and 20BaS – 20La2S3 – 60GeS2 could be formed with relative ease. This was not the case with preform rods. As glass disks were cut from small rods with length of 3-5 cm, less thermal stresses would form. As more material was added to form a larger rod preform, length greater than 10 cm, the thermal stress on the preform rod was great enough to cause fracture. . Forming fiber preforms was the most difficult portion of this project and further work on utilizing a variety of containment and coatings would promote the formation of preforms.
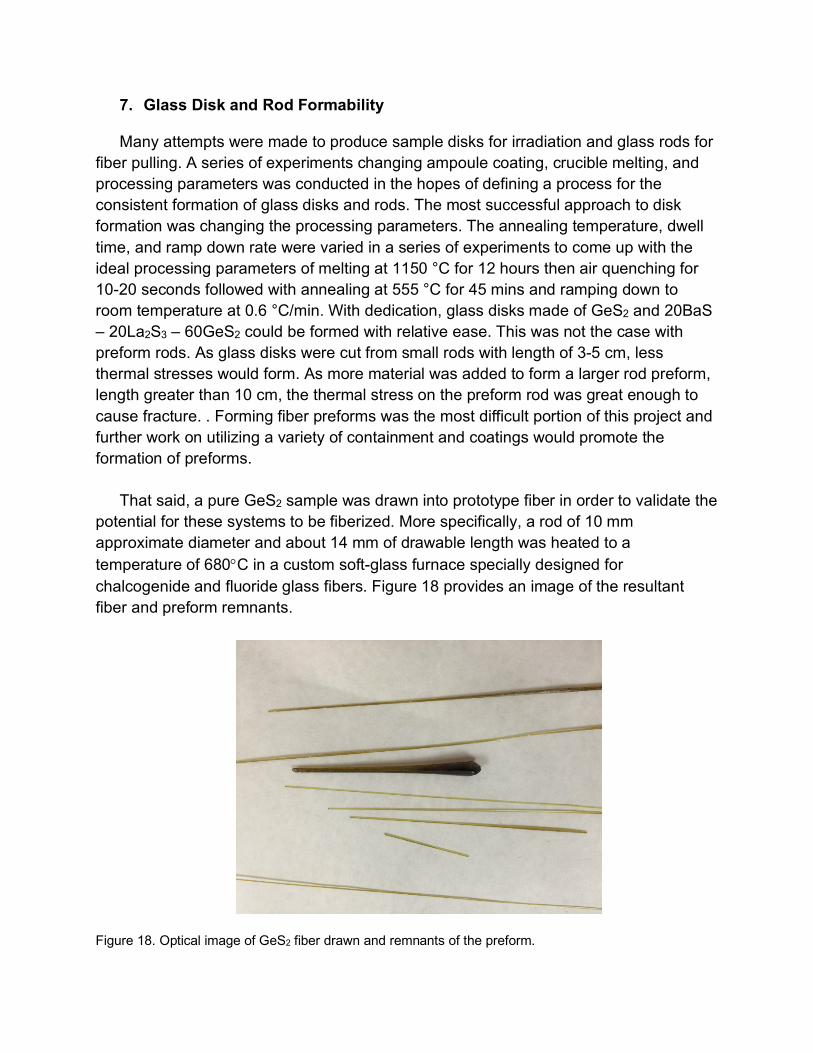
That said, a pure GeS2 sample was drawn into prototype fiber in order to validate the
potential for these systems to be fiberized. More specifically, a rod of 10 mm approximate diameter and about 14 mm of drawable length was heated to a temperature of 680°C in a custom soft-glass furnace specially designed for chalcogenide and fluoride glass fibers. Figure 18 provides an image of the resultant fiber and preform remnants.
Figure 18. Optical image of GeS2 fiber drawn and remnants of the preform.
While fiber was drawn, the small preform size was insufficient to yield longer lengths
of higher quality fiber. However, the pure GeS2 did draw into fiber and represents a validation of the fiberization capability of these refractory chalcogenide glasses.
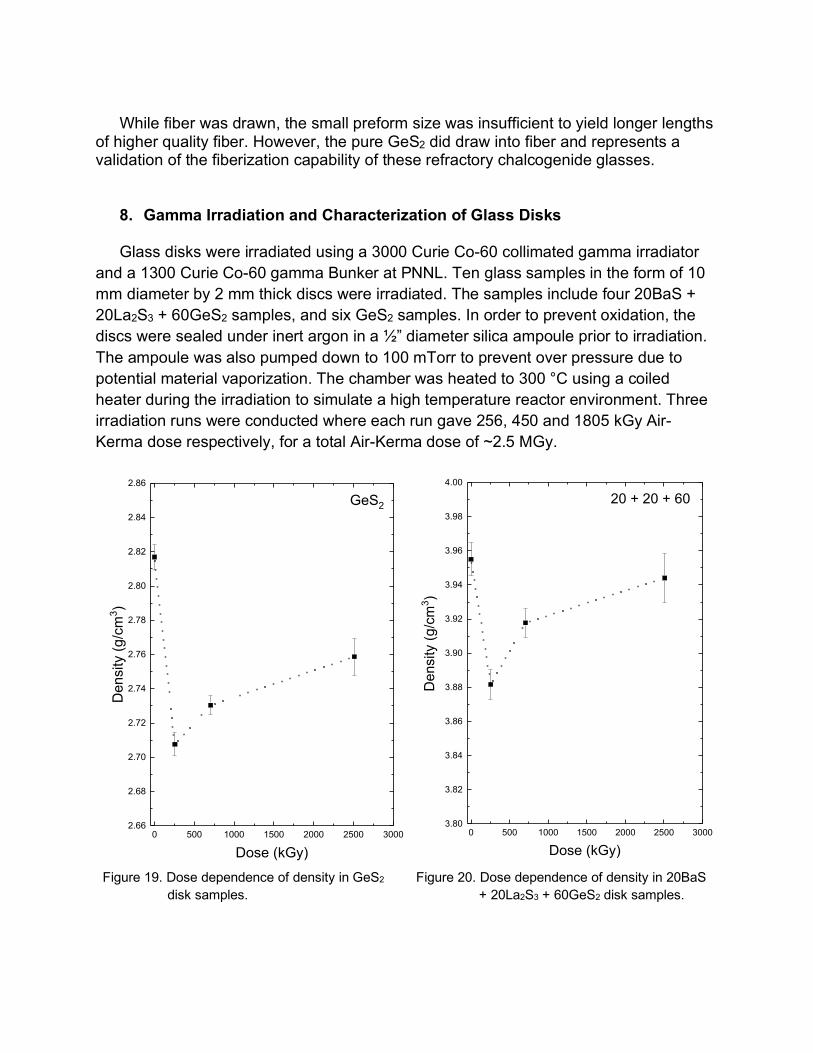
8. Gamma Irradiation and Characterization of Glass Disks
Glass disks were irradiated using a 3000 Curie Co-60 collimated gamma irradiator and a 1300 Curie Co-60 gamma Bunker at PNNL. Ten glass samples in the form of 10 mm diameter by 2 mm thick discs were irradiated. The samples include four 20BaS + 20La2S3 + 60GeS2 samples, and six GeS2 samples. In order to prevent oxidation, the discs were sealed under inert argon in a ½” diameter silica ampoule prior to irradiation. The ampoule was also pumped down to 100 mTorr to prevent over pressure due to potential material vaporization. The chamber was heated to 300 °C using a coiled heater during the irradiation to simulate a high temperature reactor environment. Three irradiation runs were conducted where each run gave 256, 450 and 1805 kGy Air-Kerma dose respectively, for a total Air-Kerma dose of ~2.5 MGy.
Figure 19. Dose dependence of density in GeS2
disk samples. Figure 20. Dose dependence of density in 20BaS
+ 20La2S3 + 60GeS2 disk samples.
0 500 1000 1500 2000 2500 30002.66
2.68
2.70
2.72
2.74
2.76
2.78
2.80
2.82
2.84
2.86
Den
sity
(g/c
m3 )
Dose (kGy)
GeS2
0 500 1000 1500 2000 2500 30003.80
3.82
3.84
3.86
3.88
3.90
3.92
3.94
3.96
3.98
4.00
20 + 20 + 60
Den
sity
(g/c
m3 )
Dose (kGy)
Figures 19 and 20 show the dose dependence of density for GeS2 and 20BaS + 20 La2S3 + 60GeS2 samples, respectively. For each composition, the average density is reported at each dosage. Both sample sets show similar trends where there is a slight decrease in density at the lowest dosage, followed by a slow, steady increase thereafter. The ternary samples showed less density change than the GeS2 samples, which may suggest they are more radiation hard than the base GeS2 glass samples. The density never reaches the initial value for either sets of samples with the received dosages, but with increasing dosage, there is a minimal change in density, which shows promise and suggest these samples can withstand MGy doses of radiation.
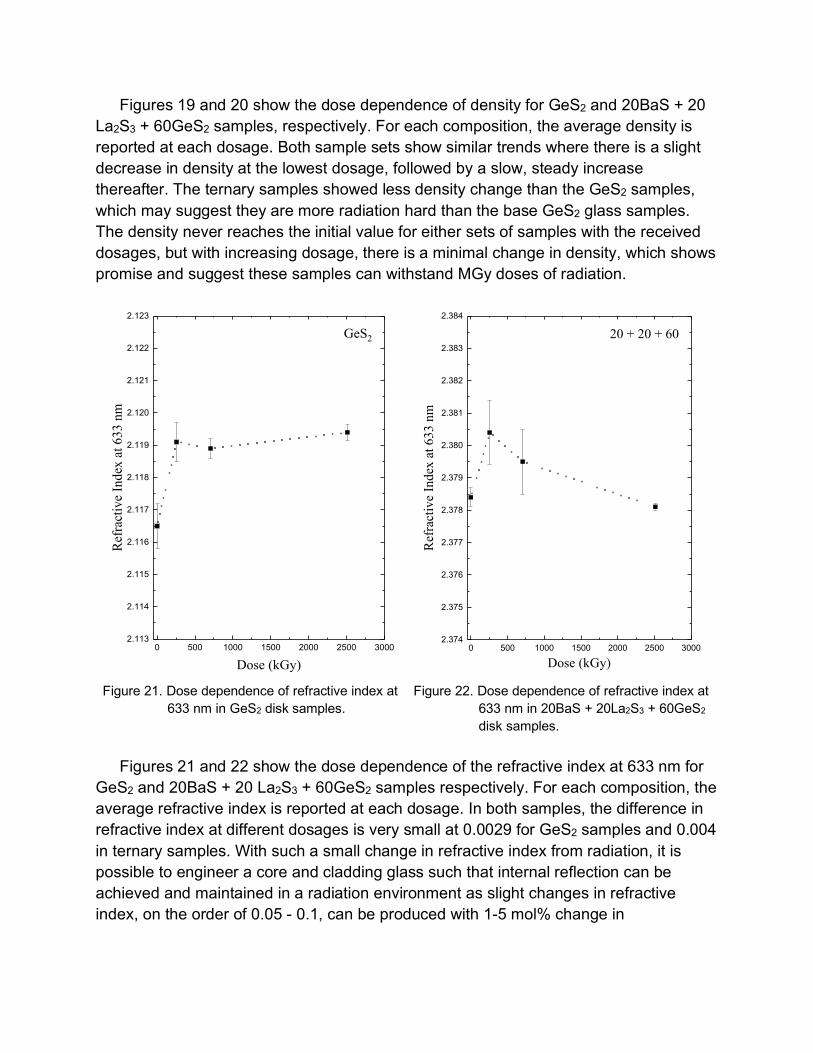
Figure 21. Dose dependence of refractive index at
633 nm in GeS2 disk samples. Figure 22. Dose dependence of refractive index at
633 nm in 20BaS + 20La2S3 + 60GeS2 disk samples.
Figures 21 and 22 show the dose dependence of the refractive index at 633 nm for
GeS2 and 20BaS + 20 La2S3 + 60GeS2 samples respectively. For each composition, the average refractive index is reported at each dosage. In both samples, the difference in refractive index at different dosages is very small at 0.0029 for GeS2 samples and 0.004 in ternary samples. With such a small change in refractive index from radiation, it is possible to engineer a core and cladding glass such that internal reflection can be achieved and maintained in a radiation environment as slight changes in refractive index, on the order of 0.05 - 0.1, can be produced with 1-5 mol% change in
0 500 1000 1500 2000 2500 30002.113
2.114
2.115
2.116
2.117
2.118
2.119
2.120
2.121
2.122
2.123
GeS2
Refr
activ
e In
dex
at 6
33 n
m
Dose (kGy)0 500 1000 1500 2000 2500 3000
2.374
2.375
2.376
2.377
2.378
2.379
2.380
2.381
2.382
2.383
2.384
Ref
ract
ive
Inde
x at
633
nm
Dose (kGy)
20 + 20 + 60
composition. This change due to chemistry is much larger than the change arising from irradiation.
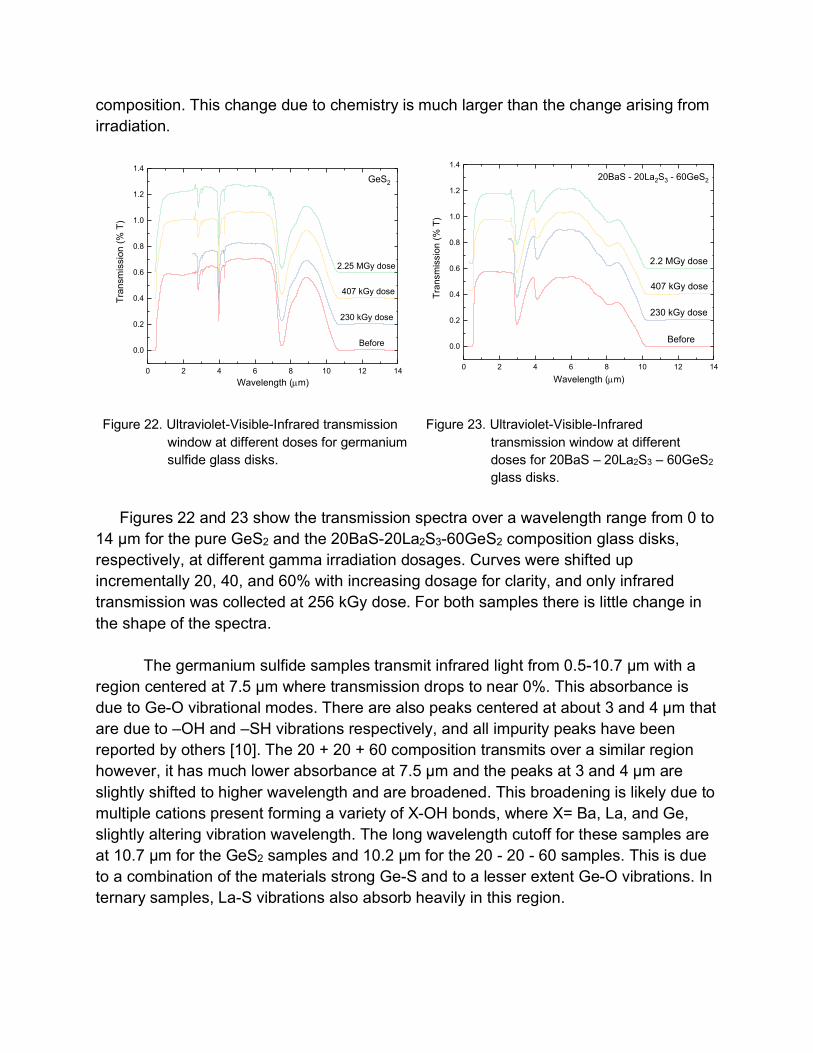
Figure 22. Ultraviolet-Visible-Infrared transmission window at different doses for germanium sulfide glass disks.
Figure 23. Ultraviolet-Visible-Infrared transmission window at different doses for 20BaS – 20La2S3 – 60GeS2 glass disks.
Figures 22 and 23 show the transmission spectra over a wavelength range from 0 to
14 µm for the pure GeS2 and the 20BaS-20La2S3-60GeS2 composition glass disks, respectively, at different gamma irradiation dosages. Curves were shifted up incrementally 20, 40, and 60% with increasing dosage for clarity, and only infrared transmission was collected at 256 kGy dose. For both samples there is little change in the shape of the spectra.
The germanium sulfide samples transmit infrared light from 0.5-10.7 µm with a region centered at 7.5 µm where transmission drops to near 0%. This absorbance is due to Ge-O vibrational modes. There are also peaks centered at about 3 and 4 µm that are due to –OH and –SH vibrations respectively, and all impurity peaks have been reported by others [10]. The 20 + 20 + 60 composition transmits over a similar region however, it has much lower absorbance at 7.5 µm and the peaks at 3 and 4 µm are slightly shifted to higher wavelength and are broadened. This broadening is likely due to multiple cations present forming a variety of X-OH bonds, where X= Ba, La, and Ge, slightly altering vibration wavelength. The long wavelength cutoff for these samples are at 10.7 µm for the GeS2 samples and 10.2 µm for the 20 - 20 - 60 samples. This is due to a combination of the materials strong Ge-S and to a lesser extent Ge-O vibrations. In ternary samples, La-S vibrations also absorb heavily in this region.
0 2 4 6 8 10 12 14
0.0
0.2
0.4
0.6
0.8
1.0
1.2
1.4
2.25 MGy dose
407 kGy dose
Tran
smis
sion
(% T
)
Wavelength (µm)
GeS2
Before
230 kGy dose
0 2 4 6 8 10 12 14
0.0
0.2
0.4
0.6
0.8
1.0
1.2
1.4
2.2 MGy dose
230 kGy dose
407 kGy dose
20BaS - 20La2S3 - 60GeS2
Tran
smis
sion
(% T
)
Wavelength (µm)
Before
As a result, the ternary BaS + La2S3 + GeS2 glasses transmit from ~0.5 to ~9 μm. The glasses prepared here were not highly purified as is the case with many non-oxide glasses and as a result, our glasses exhibit modest IR absorption in the spectra region of 2.8-3.5 μm arising from contaminating –OH estimated. Using a typical molar extinction coefficient of ~ 50 l/mole-cm and a glass sample thickness of 0.2cm, we estimated the –OH contamination to be in the range of about 100 to 1,000 ppm. Finally, the most intense contamination absorption bands are at about 10 μm and arise from Ge-O vibrations in the glass. A similar estimation based upon the IR absorption suggests that the ºGe-O-Geº contamination in the glass is in the range of about 1,000 ppm. These contaminations can be removed by purifying the glass using known methods and as such should not present a huge barrier to these glasses being used as IR fiber optics.
As with many sulfide glasses, there exists trace water and oxygen contamination.
With purification techniques such as sulfur distillation and sulfurization of batch materials by passing H2S gas over them, the purity of these glasses could be improved [11,12]. Many studies have shown that this purification eliminates a significant portion of contaminates, but some oxygen contamination may persist when melting in SiO2 ampoules that do not have a robust enough coating to prevent contact of the melt and silica. While these techniques were not available for this project, the improved purity would allow for better transmission across the infrared light spectrum and open up new opportunities in the chemical sensing field for these materials. If all contaminants could be removed from the samples the transmission window would span from approximately 0.5 to 10.5 µm.
Even with these contaminants in the glasses many different chemical species can
be detected in the infrared spectrum, and by eliminating them even more species can be detected. Some of the important chemical species that can be detected with these materials are vibrations associated with water and hydrogen fluoride from 2.4 to 2.8 μm, carbon monoxide and carbon dioxide from 4.2 to 4.4 μm, and methane from 7.3–8.1 μm. Many of these chemical species are contaminants, corrosion by-products, or reaction by-products that can potentially exist in the AdvSMR headspaces [17]. Furthermore, gamma radiation up to an accumulated dose of 2.5 MGy at a temperature of 300 °C didn’t affect the transmission spectra of these glasses. This further establishes the potential of using these materials in AdvSMR applications.
9. Summary
In summary, a judicious set of ionic non-oxide glasses in the xBaS + yLa2S3 + (1-x-y)GeS2 system were selected and studied under this program. The optimal composition along with the GeS2 base glass were synthesized and characterized at elevated
temperature under high radiation flux. The ternary glass demonstrated a glass transition temperature higher than 500oC, over 100oC thermal stability, a broad 0.5 to 10.5 um transmission window and radiation hardness up to 2.5MGy gamma irradiation at a temperature of 300oC. Challenges arose in available material purification technique for completely eliminating absorptions from the –OH bonds. Also long preform rods for pulling fibers were difficult to produce without cracking. Future studies are suggested to focus on overcoming barriers in preform rods formation and drawing optical fibers using optimized compositions. Radiation studies may be performed at higher radiation doses and temperatures with a planned improved gamma source at the PNNL, allowing 6000 Curie (1.7 Mrad/hour) vs. 1300 Curie (380 Krad/hour) in the current study. Publications and Presentations resulting from this program 1. Josh Roth, Steve Martin, John Ballato, Hong Amy Qiao, and Norm C. Anheier, “High
Temperature Infrared Glasses for Optical Sensing in Advanced Reactors,” 9th International Topical Meeting on Nuclear Plant Instrumentation, Control, and Human Machine Interface Technologies (NPIC&HMIT 2015)
2. J. Roth and S. W. Martin, “High Temperature Infrared Transmitting Glasses for Remote Sensing in Advanced Small Modular Reactors (AdvSMR),” Glass and Optical Materials Division of the American Ceramic Society Annual Meeting, Miami, FL (2015).
3. J. Roth and S. W. Martin, “Structural Investigation of High Temperature Infrared Transmitting Glasses,” Glass and Optical Materials Division of the American Ceramic Society Annual Meeting, Madison WI (2016).
4. J. Roth and S. W. Martin, “Gamma Irradiation of Ionic Sulfide Glasses for Infrared Transmitting Fibers,” Glass and Optical Materials Division of the American Ceramic Society Annual Meeting, Waikoloa HI (2017).
5. J. Roth and S. W. Martin, “IR Optical Fibers for Remote Sensing in AdvSMR,” All Iowa Glass Conference, Ames, IA (2014).
6. J. Roth and S. W. Martin, “High Temperature Infrared Transmitting Glasses for Remote Sensing in Advanced Small Modular Reactors (AdvSMR),” All Iowa Glass Conference, Cedar Rapids, IA (2015).
7. J. Roth and S. W. Martin, “Structural Investigation of High Temperature Infrared Transmitting Glasses,” All Iowa Glass Conference, Ames, IA (2016).
8. J. Roth and S. W. Martin, “Gamma Irradiation of Ionic Sulfide Glasses for Radiation Resistant Infrared Transmitting Fibers,” All Iowa Glass Conference, Cedar Rapids, IA (2017).
Papers in Progress
9. Josh Roth, Steve W. Martin, Hong Amy Qiao, Norm Anheier, Mark Murphy, Jacob Peterson, “Structural Analysis and Glass Formability Studies in the xBaS + yLa2S3 + (1-x-y)GeS2 Glass System,”
10. Josh Roth, Steve W. Martin, Hong Amy Qiao, Norm Anheier, Mark Murphy, Jacob Peterson, “Gamma Irradiation of Novel Sulfide Based Glasses at Elevated Temperature.”
References
1 Černošek, Z., Černošková, E. & Beneš, L. Raman scattering in GeS2 glass and its crystalline polymorphs compared. Journal of Molecular Structure 435, 193-198 (1997).
2 Bischoff, C., Schuller, K., Dunlap, N. & Martin, S. W. IR, Raman, and NMR Studies of the Short-Range Structures of 0.5Na2S + 0.5[xGeS2 + (1–x)PS5/2] Mixed Glass-Former Glasses. The Journal of Physical Chemistry B 118, 1943-1953 (2014).
3 Kamitsos, E. I. et al. Structure and Optical Conductivity of Silver Thiogermanate Glasses. Journal of Solid State Chemistry 112, 255-261 (1994).
4 Heo, J., Min Yoon, J. & Ryou, S.-Y. Raman spectroscopic analysis on the solubility mechanism of La3+ in GeS2–Ga2S3 glasses. Journal of Non-Crystalline Solids 238, 115-123 (1998).
5 Yao, W., Berg, K. & Martin, S. Structure and properties of glasses in the MI + M2S + (0.1Ga2S3 + 0.9GeS2), M = Li, Na, K and Cs, system. Journal of Non-Crystalline Solids 354, 2045-2053 (2008).
6 El Jaroudi, O., Picquenard, E., Demortier, A., Lelieur, J.-P. & Corset, J. Polysulfide Anions. 1. Structure and Vibrational Spectra of the S22- and S32- Anions. Influence of the Cations on Bond Length and Angle. Inorganic Chemistry 38, 2394-2401 (1999).
7 Xu, J. & Almeida, R. M. Sol–gel derived germanium sulfide planar waveguides. Materials Science in Semiconductor Processing 3, 339-344 (2000).
8 Saienga, J. & Martin, S. W. The comparative structure, properties, and ionic conductivity of LiI + Li2S + GeS2 glasses doped with Ga2S3 and La2S3. Journal of Non-Crystalline Solids 354, 1475-1486 (2008).
9 Kim, Y., Saienga, J. & Martin, S. W. Preparation and characterization of germanium oxy-sulfide GeS2–GeO2 glasses. Journal of Non-Crystalline Solids 351, 1973-1979 (2005).
10 Wang, X. F. et al. Thermal and optical properties of GeS2-based chalcogenide glasses. Materials Science and Engineering: B 110, 38-41 (2004).
11 Seddon, A. B. Chalcogenide glasses: a review of their preparation, properties and applications. Journal of Non-Crystalline Solids 184, 44-50 (1995).
12 Shibata, S., Terunuma, Y. & Manabe, T. Sulfide glass fibers for infrared transmission. Materials Research Bulletin 16, 703-714 (1981).
13 Goldenstein, C. S., Spearrin, R. M., Jeffries, J. B. & Hanson, R. K. Infrared laser-absorption sensing for combustion gases. Progress in Energy and Combustion Science 60, 132-176 (2017).
14 Nazeer, S. S. et al. Infrared spectroscopic imaging: Label-free biochemical analysis of stroma and tissue fibrosis. The International Journal of Biochemistry & Cell Biology 92, 14-17 (2017).
15 Socrates, G. Infrared and Raman Characteristic Group Frequencies: Tables and Charts. 3rd edn, 1-49 (John Wiley & Sons Ltd., 2001).
16 Cui, S. et al. From Selenium- to Tellurium-Based Glass Optical Fibers for Infrared Spectroscopies. Molecules 18, 5373 (2013).
17 Anheier N C,Suter J D,Qiao H A , et al. Technical Readiness and Gaps Analysis of Commercial Optical Materials and Measurement Systems for Advanced Small Modular Reactors, Prepared for the U.S. Department of Energy. (2013).


![[INIS] Radiation resistant equipmentf-archive.jaea.go.jp/Reference_information/files/file/... · [INIS] Radiation resistant equipment No. ... Nishikawa, Ichiro ; Showa Electric Wire](https://img.pdfslide.us/doc/110x75/5ab696637f8b9a1a048ded69/inis-radiation-resistant-equipmentf-inis-radiation-resistant-equipment-no-.jpg)