Embed Size (px)
Citation preview

CDP Climate Change 2016 Information RequestNovartis
Module: Introduction
Page: Introduction
CC0.1
Introduction Please give a general description and introduction to your organization. The Novartis Mission: We want to discover, develop and successfully market innovative products to prevent and cure diseases, to ease suffering and to enhance the quality of life. We also want to provide a shareholder return that reflects outstanding performance and to adequately reward those who invest ideas and work in our company. The Novartis Healthcare Portfolio: We believe our portfolio best meets the varied and often complex needs of patients and societies. Novartis is positioned to lead in innovation, partner with others and offer solutions to patients across a broad healthcare spectrum. In addition, a diverse portfolio reduces financial risk, bringing greater value to those who invest in our company. Our unique portfolio focuses on science-based healthcare sectors that are growing rapidly, reward innovation, and enhance the lives of patients. Novartis is the only company with leading positions in each of these key areas: - Pharmaceuticals: innovative patent-protected medicines - Alcon: global leader in eye care with surgical, ophthalmology and consumer products - Sandoz: affordable, high-quality generic medicines and biosimilars Since Novartis was created in 1996 - when only 45% of net sales came from healthcare - the company has shifted focus to fast-growing areas of healthcare. Our strategy is to provide healthcare solutions that address the evolving needs of patients and societies worldwide. Novartis People: Novartis Group companies employ approximately 119,000 full-time-equivalent associates. Novartis products are available in more than 180 countries around the world. Novartis associates share a vision of a better today and tomorrow for patients – a vision that drives our growth and success. The greatest job satisfaction for our associates is the knowledge that they improve the quality of life for patients with increasing precision and efficiency through breakthrough science and innovation. Our performance-oriented culture and responsible approach attract top experts in all areas – research and development, marketing and sales, finance and administration. Our talented associates have made us a global leader in healthcare. Novartis is committed to rewarding the people who invest ideas and work in our company. Environmental and Social Sustainability: Novartis believes that careful stewardship of natural resources, particularly tight control of greenhouse gas emissions and energy efficiency, is not only important for the Group but critical for society and future generations. Social and environmental sustainability is an integral part of our strategy.

Novartis strives to make efficient use of natural resources and to minimize the environmental impacts of its activities and products over their entire life-cycle. Health, safety and environmental impacts are assessed to ensure that the benefits of new products, processes and technologies outweigh remaining risks.
CC0.2
Reporting Year Please state the start and end date of the year for which you are reporting data. The current reporting year is the latest/most recent 12-month period for which data is reported. Enter the dates of this year first. We request data for more than one reporting period for some emission accounting questions. Please provide data for the three years prior to the current reporting year if you have not provided this information before, or if this is the first time you have answered a CDP information request. (This does not apply if you have been offered and selected the option of answering the shorter questionnaire). If you are going to provide additional years of data, please give the dates of those reporting periods here. Work backwards from the most recent reporting year. Please enter dates in following format: day(DD)/month(MM)/year(YYYY) (i.e. 31/01/2001).
Enter Periods that will be disclosed
Thu 01 Jan 2015 - Thu 31 Dec 2015
CC0.3
Country list configuration Please select the countries for which you will be supplying data. If you are responding to the Electric Utilities module, this selection will be carried forward to assist you in completing your response.
Select country
United States of America Germany Switzerland

Select country
India Italy Slovenia Austria Ireland United Kingdom Turkey Spain China Singapore Rest of world
CC0.4
Currency selection Please select the currency in which you would like to submit your response. All financial information contained in the response should be in this currency. USD($)
CC0.6
Modules As part of the request for information on behalf of investors, electric utilities, companies with electric utility activities or assets, companies in the automobile or auto component manufacture sub-industries, companies in the oil and gas sub-industries, companies in the information technology and telecommunications sectors and companies in the food, beverage and tobacco industry group should complete supplementary questions in addition to the main questionnaire. If you are in these sector groupings (according to the Global Industry Classification Standard (GICS)), the corresponding sector modules will not appear below but will automatically appear in the navigation bar when you save this page. If you want to query your classification, please email [email protected]. If you have not been presented with a sector module that you consider would be appropriate for your company to answer, please select the module below. If you wish to view the questions first, please see https://www.cdp.net/en-US/Programmes/Pages/More-questionnaires.aspx.

Further Information
Module: Management
Page: CC1. Governance
CC1.1
Where is the highest level of direct responsibility for climate change within your organization? Board or individual/sub-set of the Board or other committee appointed by the Board
CC1.1a
Please identify the position of the individual or name of the committee with this responsibility - Health, Safety Environment Steering Committee (HSE SteCom) chaired by the company CEO. The Novartis CEO, Joseph Jimenez, is the chairman of the Health, Safety & Environmental Steering Committee (HSE SteCom), which is responsible for authorizing and sponsoring the Energy & Climate strategy. Currently he has delegated this role to the Head of Corporate Responsibility, Jürgen Brokatzky-Geiger, who reports directly to the CEO. HSE SteCom meets three times per year and comprises heads Technical Operations of all Novartis Divisions, which are members of the executive committees of the Divisions, the head Real Estate and Facility Services of the Novartis Business Services Unit, and the head Corporate Health Safety Environment and Business Continuity (CHSE&BC). The Energy and Climate Strategy is managed by the Novartis Group Global Head Environment & Energy reporting to the global head CHSE&BC. - Undivided Line Management Responsibility: All aspects of HSE at Novartis, including energy and climate, are the undivided responsibility of line management at the various organizational levels (site, country, Division, Group), who are supported by functional units with respective technical expertise. - Functional Units on Energy and Climate: At Divisional level, Novartis has assigned global energy managers to manage the divisional energy and greenhouse gas (GHG) emission reduction programs. Decisions on divisional energy and climate strategies are included in the annual HSE Group-level Management Reviews with all Divisions, and are a regular agenda item of the HSE SteCom. At company and site levels, local energy manager functions and committees (depending on the size of the site) are assigned to manage local energy efficiency programs. Energy use and GHG emissions are part of the HSE management system, managed by a network of corporate, divisional and site HSE functions. Targets on energy efficiency improvements and climate strategies are included in the individual targets assigned to Health, Safety and Environment Officers (HSEOs), divisional and site-based energy managers and line managers at various levels of the organization. HSEOs, energy managers and line managers who have been assigned energy targets receive cash bonuses when these are achieved or exceeded. Furthermore, all employees, regardless of their functions, can submit innovative projects or ideas to improve energy efficiency and reduce GHG emissions to the Novartis Health, Safety, Environment and Business Continuity (HSE&BC) Excellence Award scheme (which was given for the 11th time in 2015), including five categories including energy and environment. The winners are judged by an internal panel of experts under a range of criteria, including: effectiveness, duplicability, use of renewable energy, social and development benefits, payback time and improvements in environmental areas.

CC1.2
Do you provide incentives for the management of climate change issues, including the attainment of targets? Yes
CC1.2a
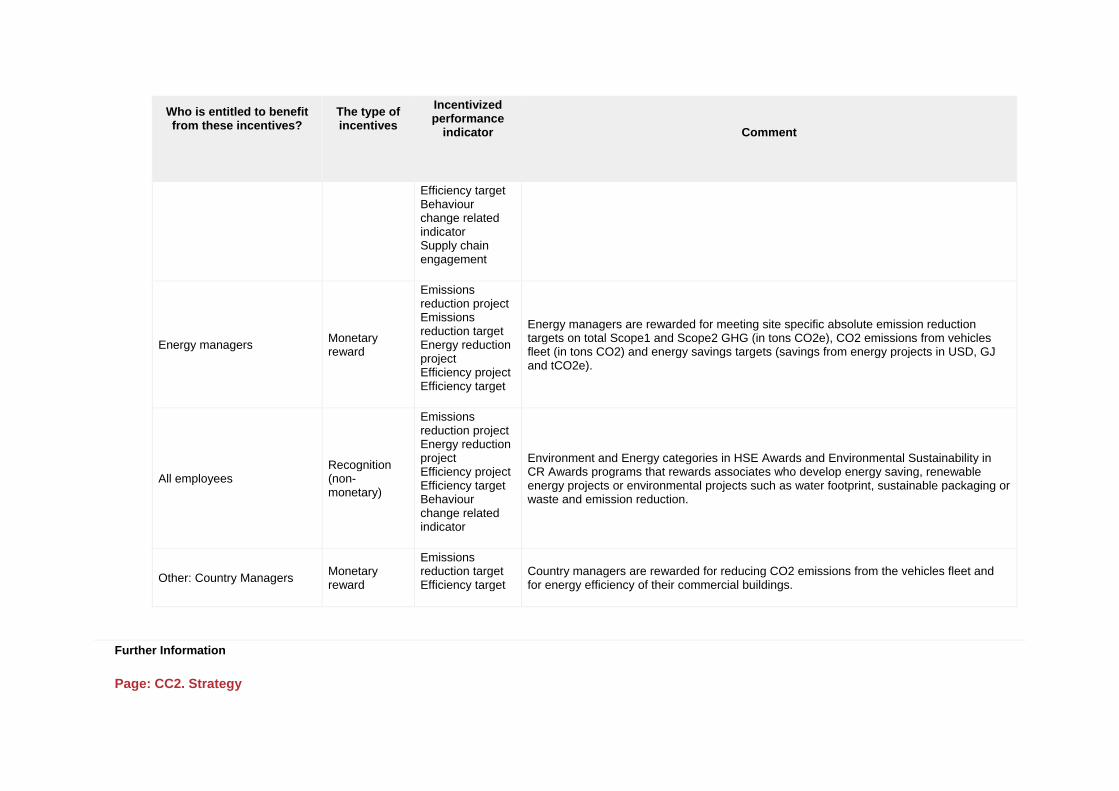
Please provide further details on the incentives provided for the management of climate change issues
Who is entitled to benefit from these incentives?
The type of incentives
Incentivized performance
indicator
Comment
Corporate executive team Monetary reward
Emissions reduction target
Divisional managers, who are members of the Novartis Executive Committee, are rewarded for meeting division specific absolute emission reduction targets on total Scope1 and Scope2 GHG (in tons CO2e) and CO2 emissions from vehicles fleet (in tons CO2).
Corporate executive team Monetary reward
Emissions reduction project Emissions reduction target Energy reduction project Energy reduction target Efficiency projectEfficiency target Behaviour change related indicator
The head Corporate Responsibility who is a permanent member to the Novartis Executive Committee, is rewarded for the corporate absolute emission reduction targets on total Scope1 and Scope2 GHG (in tons CO2e), CO2 emissions from vehicles fleet (in tons CO2) energy efficiency and energy savings targets (savings from energy projects in USD, GJ and tCO2e). His targets also include other environmental, HSE and sustainability targets.
Other: Environment/sustainability managers
Monetary reward
Emissions reduction project Emissions reduction target Energy reduction project Efficiency project
Environmental managers (on group and divisional levels) are rewarded for meeting group or division specific absolute emission reduction targets on total Scope1 and Scope2 GHG (in tons CO2e), CO2 emissions from vehicles fleet (in tons CO2) and energy savings targets (savings from energy projects in USD, GJ and tCO2e). On Group level, targets also include emission reduction and energy efficiency projects, as well as behaviour change related projects and related indicators.
Who is entitled to benefit from these incentives?
The type of incentives
Incentivized performance
indicator
Comment
Efficiency target Behaviour change related indicator Supply chain engagement
Energy managers Monetary reward
Emissions reduction project Emissions reduction target Energy reduction project Efficiency projectEfficiency target
Energy managers are rewarded for meeting site specific absolute emission reduction targets on total Scope1 and Scope2 GHG (in tons CO2e), CO2 emissions from vehicles fleet (in tons CO2) and energy savings targets (savings from energy projects in USD, GJ and tCO2e).
All employees Recognition (non-monetary)
Emissions reduction project Energy reduction project Efficiency projectEfficiency target Behaviour change related indicator
Environment and Energy categories in HSE Awards and Environmental Sustainability in CR Awards programs that rewards associates who develop energy saving, renewable energy projects or environmental projects such as water footprint, sustainable packaging or waste and emission reduction.
Other: Country Managers Monetary reward
Emissions reduction target Efficiency target
Country managers are rewarded for reducing CO2 emissions from the vehicles fleet and for energy efficiency of their commercial buildings.
Further Information
Page: CC2. Strategy
CC2.1
Please select the option that best describes your risk management procedures with regard to climate change risks and opportunities Integrated into multi-disciplinary company wide risk management processes
CC2.1a
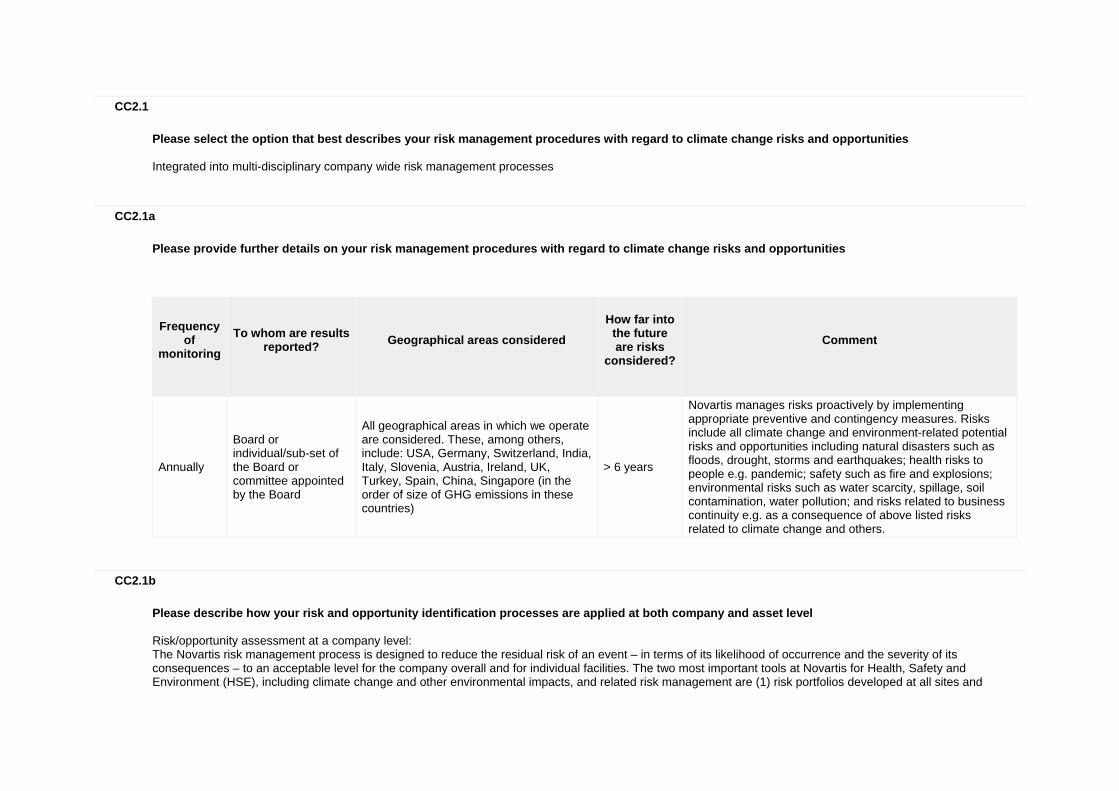
Please provide further details on your risk management procedures with regard to climate change risks and opportunities
Frequency
of monitoring
To whom are results
reported?
Geographical areas considered
How far into
the future are risks
considered?
Comment
Annually
Board or individual/sub-set of the Board or committee appointed by the Board
All geographical areas in which we operate are considered. These, among others, include: USA, Germany, Switzerland, India, Italy, Slovenia, Austria, Ireland, UK, Turkey, Spain, China, Singapore (in the order of size of GHG emissions in these countries)
> 6 years
Novartis manages risks proactively by implementing appropriate preventive and contingency measures. Risks include all climate change and environment-related potential risks and opportunities including natural disasters such as floods, drought, storms and earthquakes; health risks to people e.g. pandemic; safety such as fire and explosions; environmental risks such as water scarcity, spillage, soil contamination, water pollution; and risks related to business continuity e.g. as a consequence of above listed risks related to climate change and others.
CC2.1b
Please describe how your risk and opportunity identification processes are applied at both company and asset level Risk/opportunity assessment at a company level: The Novartis risk management process is designed to reduce the residual risk of an event – in terms of its likelihood of occurrence and the severity of its consequences – to an acceptable level for the company overall and for individual facilities. The two most important tools at Novartis for Health, Safety and Environment (HSE), including climate change and other environmental impacts, and related risk management are (1) risk portfolios developed at all sites and

consolidated at divisional and group level; and (2) HSE audits. In addition, for business-related risks, a Business Continuity Management (BCM) process and a Novartis Emergency Management (NEM) process are implemented as integral parts of the Novartis risk management framework. Since 1997, Novartis develops such risk portfolio, covering all aspects of HSE, including climate change and other environmental aspects on an annual frequency. HSE audits also cover issues related to climate change and are conducted according to an annual HSE audit plan. The selection of sites to be audited each year depends on the respective risks expressed in the risk portfolio. Corporate and divisional HSE audit groups conduct the audits following the annually defined auditing program. All major sites are audited at least all five years. Risk/opportunity assessment at an asset level: Individual risk, defined in terms of likelihood of occurrence and severity of its consequences, are evaluated and described by each site by the local experts and included in a risk portfolio. These portfolios are consolidated by each division and for the company as a whole. A formalized follow-up procedure on the results of HSE audits is in place in each division according to which corrective actions are implemented by the individual facility.
CC2.1c
How do you prioritize the risks and opportunities identified? Criteria to determine materiality/priorities: HSE and BC risk portfolios are based on a bottom-up approach, developed at each site and consolidated on divisional and group levels. Risks are expressed in terms of severity and probability of occurrence, and the risk evaluation and management process includes necessary steps to evaluate measures for reducing both severity and probability of occurrence and for increasing control levels to the defined acceptance level. The consolidated Novartis HSE Risk Portfolio in 2014 included 100 risks. This summary portfolio at group level had been consolidated from a total of over 800 risks evaluated at site level and reported to divisions and group. Implementation is controlled by HSE Steering Committee (SteCom) and at the Annual HSE Business Reviews with all divisions. The consolidated Corporate Risk Portfolio is presented to and discussed with the Risk Committee of the Board of Directors (BoD). Action plans for the risks above risk acceptance levels have been developed and are being implemented. Audit results are reported to HSE SteCom at each meeting and to the BoD Risk Committee.
CC2.1d
Please explain why you do not have a process in place for assessing and managing risks and opportunities from climate change, and whether you plan to introduce such a process in future
Main reason for not having a process
Do you plan to introduce a process?
Comment

CC2.2
Is climate change integrated into your business strategy? Yes
CC2.2a
Please describe the process of how climate change is integrated into your business strategy and any outcomes of this process Novartis' business strategy is to strengthen a diverse healthcare portfolio on pharmaceuticals, eye care and generics, being the strongest portfolio for sustained success and to best cope with challenges / opportunities related to healthcare in developed and less developed economies. Tropical diseases will become more prevalent when global temperatures rise and global climatic patterns change. Novartis is working on discovering and increasing the availability of medicines to treat those. Our Institute for Tropical Diseases (NITD) conducts research on tropical diseases of currently inadequate attention. The Novartis Foundation for Sustainable Development (NFSD) facilitates basic health programs and develops new methods for improved medical care for the poorest in developing countries. In 2015, Novartis endorsed a new environmental strategy with four priority areas: energy & climate, water & micro-pollutants, material & waste, and supply chain. We committed to two major milestones on our long term pathway to carbon neutrality. We established GHG targets on Scope 1 + 2 of -30% by 2020 and of -50% by 2030, versus 2010. Together with the new vision 2030 and targets 2020, Novartis endorsed a carbon price of USD 100 per ton of CO2e, in line with the cost of climate change to society as calculated by the World Bank. Building a carbon price into investment decisions is important as it helps identify projects that will most cost-effectively reduce GHG emissions. We have a dual strategy GHG reduction, primarily from energy and fuel usage, i.e. to improve energy efficiency and to adopt renewable energy sources. The second track is to undertake own forestry carbon sink projects to complement the internal reduction efforts. i) How the business strategy has been influenced: Novartis management is guided by input from a variety of stakeholders in developing aspects of its business strategy, including response to climate change requirements. For example, the policy to set own GHG targets in accordance with UN requirements and leading national commitments, based on the belief that governmental schemes can only be successful, if private sector companies actively contribute with targets for their own global operations. Internally we ensure progress by target setting, performance reporting and an annual process of management review on HSE with divisional heads of technical operations. The Corporate targets are approved by ECN, the decision of e.g. engagement in Forestry Carbon Sink projects by the CEO and the Chairman of the BoD. (ii) What have been the most substantial business decisions in the reporting year: - Novartis ECN endorsed a new strategy on environmental sustainability, with more ambitious GHG targets. - Novartis endorsed the use of an internal carbon price of USD 100 per ton CO2e.
- Novartis launched a new Access brand, i.e. providing lower developed communities with a portfolio of essential medicines for a preferred price. iii) What aspects of climate change have influenced the strategy: Increasing impacts from a changing climate are highly interlinked to underdevelopment and poverty. Fighting poverty and helping to develop the less developed in achieving healthier lives and higher levels of welfare by provision of medicine, by the improvement of health care systems and by providing business opportunities to the underprivileged are therefore key areas of Novartis business strategy and its energy and climate program. Our forestry projects are not only compensation of part of our own carbon footprint, but also a contribution to economic development and to protection of water sheds and bio-diversity. iv) The most important components of the short term strategy: Climate change aspects are influencing Novartis operations strategies by several factors: - Largely different carbon intensities of energy supply between Novartis existing European operations (e.g. CH / AT) and new operations in China: Due to expansions in China emissions of our operations there grow faster than reductions by efficiency programs in Europe. We thus focus on implementing energy efficiency in China: At our new research facility in Shanghai, we installed a best-in-class tri-gen energy centre based on natural gas, to minimize the use of standard coal-based electricity from the grid. In addition, buildings in Shanghai are equipped with highly energy efficient triple-glazed windows. - Governmental subsidies to support renewable energy sources had helped us to install photovoltaic array systems for over 1.5MW in New Jersey Germany, Spain and Italy and Switzerland. - Change from free allocation to auctioning emission trading allowances in the EU-ETS is a material cost factors at our European sites participating in the scheme. v) The most important components of the long term strategy: Incorporation of new technologies: Not only operations factors related to energy efficiency, carbon intensity and pricing will be more relevant for Novartis and require the application of new technology in buildings, clean room air conditioning and application of renewable resources such as wind, solar and geo-thermal energy. Increases in severe effects of sea level rise, extreme weather effects, change in precipitation patterns and water scarcity is also influencing the way Novartis selects new locations and how these are protected against the effects of climate change. Sites in water scarce areas (e.g. our research centre in La Jolla, California) include water scarcity into the risk portfolio for their site and conducted water audits. Changing core business focus: Indirect effects related to migration, political unrest and expected wider spread of tropical vector diseases such as malaria will influence Novartis business focus more strongly to tropical diseases and change the characteristics of Novartis businesses in these countries and regions where these diseases may spread. Novartis is already today among the leading pharmaceutical companies on tropical diseases such as malaria and dengue fewer. (vi) How this is gaining us strategic advantage over our competitors: With the leading position on tropical diseases such as malaria, Novartis is better prepared than competitors for these diseases related to climate change effects, as these will become more important or even critical to health care systems in a growing number of affected countries. This position gives Novartis an advantage in market such as in Africa, where malaria and other vector diseases are spreading further. Thus, Novartis is well known and has an excellent reputation. This fact helped also in other disease areas.
CC2.2b
Please explain why climate change is not integrated into your business strategy

CC2.2c
Does your company use an internal price of carbon? Yes
CC2.2d
Please provide details and examples of how your company uses an internal price of carbon Together with the new Environmental Sustainability vision 2030 and targets 2020, Novartis leadership has endorsed a carbon price of USD 100 per ton (t) of carbon dioxide equivalents, in line with the cost of climate change to society as calculated by the World Bank. Building a carbon price into investment decisions is important as it helps identify projects that will most cost-effectively reduce GHG emissions. Starting in 2016, we will select major GHG reduction projects and measures based on the cost savings they generate, as determined by our internal carbon price of USD 100/tCO2e. A cross-divisional team consisting of energy experts from divisions of Novartis Business Services – Real Estate and Facility Services will prioritize major projects and actions necessary to achieve our 2020 GHG reduction target. Projects will be submitted to top management for approval.
CC2.3
Do you engage in activities that could either directly or indirectly influence public policy on climate change through any of the following? (tick all that apply) Direct engagement with policy makers Trade associations Other
CC2.3a

On what issues have you been engaging directly with policy makers?
Focus of legislation
Corporate Position
Details of engagement
Proposed legislative solution
Cap and trade Support
We report GHG emissions from totally 6 sites in the European Union as part of the EU-Emission Trading System (EU-ETS). We consider carbon emission trading an effective tool for supporting targets achievement of emission reductions
We support the development of the EU-ETS to make it more effective and more practical. We also support the spreading of emission trading in other countries outside the EU.
Mandatory carbon reporting
Support
We participate and contribute to initiatives conducted by the World Business Council for Sustainable Development (WBCSD), Global Reporting Initiative (GRI) and corporate sustainability reporting such as The GHG Protocol, Natural Capital / True Value Reporting
We consider standardized Corporate Reporting and carbon reporting an effective tool for disclosure to and engagement with stakeholders as well as internal decision making. If practical and in line with existing globally accepted approaches legislative systems on mandatory corporate reporting could be additionally beneficial to further increase the best practice corporate reporting to additional companies.
Carbon tax Support
We have voluntarily set an internal carbon price of USD100 per ton CO2e as a shadow price for more effective and better aligned decision making on GHG emission reduction. We work with organizations such as the WBCSD, UN-Global Compact and others to support spreading the concept of carbon pricing.
We support the position of e.g. the WBCSD that allocating a true price to carbon will be effective in mitigating climate change. We have set and implement our own shadow price on carbon of 100USD/tCO2e, sufficiently high to represent the true cost of climate change and to have a relevant influence on energy costs.
Energy efficiency Support
We have implemented a comprehensive energy management and energy efficiency program, including energy audits, energy reporting and challenging energy use in capital projects. With that we were successfully anticipating emerging legal requirements such as by the EU-Energy Efficiency Directive.
We consider energy efficiency and effective management measures on energy efficiency as a feasible tool for decision making and improvements. Legislative systems on energy efficiency may additionally help to spread such best practice.
Clean energy generation Support
We continue to increase our portion of purchasing carbon-free or non-fossil based renewable electricity as a measure to further reduce our GHG emissions. Thereby we give renewable based electricity a better market acceptance and higher chance to penetrate the electricity market.
Renewables based electricity can only gain broader acceptance if accepted by consumers.
CC2.3b
Are you on the Board of any trade associations or provide funding beyond membership? No

CC2.3c
Please enter the details of those trade associations that are likely to take a position on climate change legislation
Trade association
Is your position on climate change consistent with theirs?
Please explain the trade association's position
How have you, or are you attempting to, influence the position?
CC2.3d
Do you publicly disclose a list of all the research organizations that you fund?
CC2.3e
Please provide details of the other engagement activities that you undertake 1) World Business Council for Sustainable Development (WBCSD): i. Method of engagement: Novartis primary method of engagement is being an active member of the WBCSD since its foundation in 1997, contributing to the work-streams of the WBCSD's focus areas and projects. ii. Topics of engagement: Novartis actively contributes to the work-streams on Energy and Climate, Energy Efficient Buildings, Water and Ecosystems Services and Development. Novartis experts regularly participate in WBCSD meetings and working group activities. iii. Nature of engagement: Novartis experts provide case studies and examples and strengthen WBCSD's work towards international negotiations on Climate Policy with feedback on proposals and own contributions. Before the formation of Novartis 1997, both predecessor companies Ciba Geigy and Sandoz were founding members of the WBCSD. Our rationale for participation is because WBCSD is a very active player in policy making on Climate Change, is bringing the business voice to the table of intergovernmental negotiations and is developing tools for companies to e.g. monitor and report GHG emissions and climate change disclosure, energy efficiency management and for company water performance. iv. Actions advocating: Novartis provides input to WBCSD with case histories and success stories. In 2008 and 2010 two case studies on how Novartis manages the energy efficiency of its global real estate portfolio were posted on the WBCSD webpage. In 2011 a second case study on the Novartis Energy Excellence Award scheme was developed together with WBCSD staff. In the course of the WBCSD's policy work, Novartis is advocating for clear and predictable governmental policies and national and international target setting to reduce GHG emissions as a follow up to the Kyoto Protocol. Already in the past, Novartis set its own internal GHG targets in accordance with the Kyoto Protocol and has committed to apply the flexible mechanisms for carbon offsetting related to the Kyoto Protocol. The perceived impacts of these actions are to influence other companies by setting a good example and to strengthen the voice of the WBCSD as a lobby group to influence the political agenda on climate change. In 2015 we participated in the pilot application of the Natural Capital Protocol and determined an environmental P&L for Novartis based on a monetary valuation.

2) United Nations Global Compact (UN-GC): i. Method of engagement: Novartis is a founding member of the UN-Global Compact. Klaus Leisinger, the former head of the Novartis Foundation for Sustainable Development, was an adviser to the UN Secretary General Kofi Annan for the scoping of actions and implementation of the UN Global Compact for many years; supporting the Secretary General both on substance and process of the compact. ii. Topic of engagement: Novartis is an active participant in working groups and reports to UN-GC on all aspects required, including on Energy and Climate. Representatives of Novartis are regularly participating in meetings of the UN-GC. iii. Nature of engagement: In 2011 Novartis was an active member and contributor to the UN-GCs in preparing the "Caring for Climate". In 2015, we further adopted the Paris Pledge of Action and signed up for the Science Based Target Initiative. iv. Actions advocated: Novartis has voluntarily adopted the targets and schemes of the Kyoto protocol for its global operations. Novartis is a Caring for Climate Signatory and active participant in the programs of this organization, initiated by the UN-GC. By adopting the Kyoto Protocol to its own global operations in 2004, Novartis has committed itself to the objectives of the protocol and demonstrated that the elements of the protocol (targets and tools such as the CDM) are realistic and practical and can be also used by other private sector organizations. This encourages endorsement of the protocol and actions on GHG emission mitigation by other companies. The perceived impacts of these actions are to strengthen the voice of the UN-GC in the political arena and thereby influence the respective agendas on climate change. Novartis also reports its performance according to the UN-GC requirements.
CC2.3f
What processes do you have in place to ensure that all of your direct and indirect activities that influence policy are consistent with your overall climate change strategy? Active members and participants in the WBCSD and UN-GC activities are members of either top management or corporate functional managers of the Company: World Business Council for Sustainable Development (WBCSD): The CEO is council member and the global head HSE&BC is liaison delegate to the WBCSD. The global head Corporate Responsibility and the global head HSE&BC participates in Council meetings representing the CEO when not available. The Novartis Group Global Head Environment & Energy and other experts participate in dedicated meetings and actively contribute to projects and work-group activities. Novartis signed the manifesto for Energy Efficient Buildings of the WBCSD; we are applying our GHG reporting to the GHG Protocol, developed by WBCSD and WRI and we use the Global Water Tool for setting water efficiency targets and tailoring our water efficiency program. United Nations Global Compact (UN-GC): The CEO is active members of the UN-GC organization and functional managers of our groups on HSE and Corporate Responsibility are actively involved in UN-GC related activities. We signed the pledge Caring for Climate Novartis reporting and disclosure on sustainability and energy and climate are included in our corporate responsibility reporting, which is aligned with GHG Protocol, GRI and UN-GC requirements. The 2015 Corporate Responsibility Report is structure in accordance with the GRI and UN-GC requirements.
CC2.3g

Please explain why you do not engage with policy makers
Further Information
Page: CC3. Targets and Initiatives
CC3.1
Did you have an emissions reduction or renewable energy consumption or production target that was active (ongoing or reached completion) in the reporting year? Absolute target
CC3.1a
Please provide details of your absolute target
ID
Scope
% of emissions in
scope
% reduction
from base year
Base year
Base year emissions covered by
target (metric tonnes CO2e)
Target year
Is this a science-
based target?
Comment
Abs1Scope 1+2 (market-based)
100% 30% 2010 1580000 2020 Yes
The target is to reduce combined Scope1 and Scope2 GHG emissions by 30% by 2020 and 50% by 2030 based on 2010 emissions. This target is split into annual reduction targets and specific targets for a number of different types of GHG reduction opportunities. The baseline of 1580kt is slightly corrected with respect to the actual 2010 emissions to include acquisitions after 2010 in the baseline. The status achieved in 2015 is 15.6% reduction of emission from our industrial operations plus 4.3% carbon sinks of additional GHG reductions achieved at our own forestry projects The -

ID
Scope
% of emissions in
scope
% reduction
from base year
Base year
Base year emissions covered by
target (metric tonnes CO2e)
Target year
Is this a science-
based target?
Comment
30% by 2020 and -50% by 2030 Scope1+2 targets have been confirmed to be science based by response from the SBT initiative.
Abs2
Other: Scope1 GHG emissions from vehicles
100% 50% 2010 205400 2020 Yes
The original target for scope 1 GHG emissions from vehicles (-20% by 2015 based on 2010 emissions) was already achieved in 2013 with -27%. The target was increased in 2014 to -30% by 2015 and in 2015 to -50% by 2020. Reductions were achieved by the use of more fuel efficient vehicles through the introduction of hybrid gasoline-electric cars, increased use of diesel engines fitted with particulate filters, and other emission reduction options such as liquid natural gas or bio-fuels or also electric cars, as well as conservative driving styles. Ongoing measures will allow us to further reduce these emissions in the coming years. Being part of the total Scope1+2 GHG target reduction of vehicle emissions contribute to the target achievement and thus is part of the science based target.
Abs3Scope 1+2 (market-based)
100% 50% 2010 1580000 2030 Yes
The Novartis long-term GHG target is to reduce combined Scope1 and Scope2 GHG emissions by 50% by 2030 based on 2010 emissions. The baseline of 1580kt is slightly corrected with respect to the actual 2010 emissions to include acquisitions after 2010 in the baseline and will be further adopted for future acquisitions and/or divestments. The status achieved in 2015 is 15.6% reduction of emission from our industrial operations plus 4.3% carbon sinks of additional GHG reductions achieved at our own forestry projects. The -30% by 2020 and -50% by 2030 Scope1+2 targets have been confirmed to be science based by response from the SBT initiative, being two major milestones to carbon neutrality in the second half of the 21st century, as expected by UN-FCCC.
CC3.1b

Please provide details of your intensity target
ID
Scope
% of emissions in
scope
% reduction from base
year
Metric
Base year
Normalized base year emissions covered by
target
Target year
Is this a science-based target?
Comment
CC3.1c
Please also indicate what change in absolute emissions this intensity target reflects
ID
Direction of change anticipated in absolute Scope 1+2 emissions at
target completion?
% change anticipated in absolute Scope 1+2
emissions
Direction of change anticipated in absolute Scope 3 emissions at target
completion?
% change anticipated in absolute Scope 3
emissions
Comment
CC3.1d
Please provide details of your renewable energy consumption and/or production target
ID
Energy types
covered by target
Base year
Base year energy for energy type covered
(MWh)
% renewable
energy in base year
Target year
% renewable energy in target
year
Comment

CC3.1e
For all of your targets, please provide details on the progress made in the reporting year
ID
% complete (time)
% complete (emissions or
renewable energy)
Comment
Abs1 50% 66% Novartis reduced total scope 1+2 GHG emissions by 15.6% for Novartis industrial operations and 19.8% when Novartis forestry carbon sink projects are additionally considered. This represents almost two third of the 30% reduction target for 2020 achieved after half the target period of 10 years.
Abs2 50% 65% Novartis has reduced GHG emissions from vehicles by 32.6% in 2015 based on the 2010 baseline, which represents 65% of the 50% reduction target for 2020, achieved after half the target period of 10 years.
Abs3 25% 40% The 2030 target was formulated as a long-term supplement to the 2020 target on total Scope1+2 GHG emissions. The 19.8% reduction achieved after 5 years of the total 20 years target period (25%) represents a reduction of already 40% of the 50% reduction target.
CC3.1f
Please explain (i) why you do not have a target; and (ii) forecast how your emissions will change over the next five years
CC3.2
Do you classify any of your existing goods and/or services as low carbon products or do they enable a third party to avoid GHG emissions? Yes
CC3.2a

Please provide details of your products and/or services that you classify as low carbon products or that enable a third party to avoid GHG emissions
Level of
aggregation
Description of product/Group of products
Are you
reporting low carbon product/s or avoided emissions?
Taxonomy, project or
methodology used to classify
product/s as low carbon or to calculate
avoided emissions
%
revenue from low carbon
product/s in the
reporting year
% R&D in
low carbon
product/s in the
reporting year
Comment
Group of products
Sandoz, the generic division of Novartis is a leading producer of anti-infective Active Pharmaceutical Ingredients (AI APIs). Our manufacturing portfolio of AI APIs is predominantly located in Europe (Austria, Germany, Italy, Slovenia and Spain). Sandoz/Novartis is one of the few pharma companies that produces AI APIs outside China and India. We put high efforts in the energy efficiency of our manufacturing processes for AI APIs and achieved up to 30% energy efficiency improvement of these processes over the last 10 years. Furthermore, the carbon intensity of the energy used at our locations in Europe is by far lower compared the carbon intensities in China and India. Carbon Footprint LCA assessments of our AI API products have demonstrated that the per ton carbon impact of our products is in the order of magnitude of 16kgCO2e/kg API compared to 35 to 48 kgCO2e/kgAPI when produced in China or India. They have a 2 to 3 times lower carbon footprint compared to most other AI APIs. Therefore we consider the Sandoz AI APIs as low-carbon products.
Low carbon product
Other: Carbon Footprint LCA study
4% Less than or equal to 10%
Carbon Footprint LCA assessments of our AI API products have demonstrated that the per ton carbon impact of our products is in the order of magnitude of 16kgCO2e/kg API compared to 35 to 48 kgCO2e/kg API when produced in China or India.

CC3.3
Did you have emissions reduction initiatives that were active within the reporting year (this can include those in the planning and/or implementation phases) Yes
CC3.3a
Please identify the total number of projects at each stage of development, and for those in the implementation stages, the estimated CO2e savings
Stage of development
Number of projects
Total estimated annual CO2e savings in metric tonnes CO2e (only for rows marked *)
Under investigation 3 185000 To be implemented* 0 0 Implementation commenced* 2 60000 Implemented* 5 396000 Not to be implemented 0 0
CC3.3b
For those initiatives implemented in the reporting year, please provide details in the table below

Activity type
Description of activity
Estimated annual CO2e
savings (metric tonnes CO2e)
Scope
Voluntary/ Mandatory
Annual monetary savings
(unit currency
- as specified in CC0.4)
Investment required
(unit currency -
as specified in CC0.4)
Payback period
Estimated lifetime of
the initiative
Comment
Low carbon energy purchase
Off-site Wind PPA in USA (under investigation): Novartis currently investigates developing a major off-site wind power purchase agreement (PPA) for its operations in Texas, USA and potentially other operations across the US. The size considered is between 40 and 60MW electricity.
120000
Scope 2 (location-based) Scope 2 (market-based)
Voluntary 500000 0 4-10
years 16-20 years
As this project is considered as a PPA, the investment required as zero. However, the contractual conditions mean that the savings will be shared in some form with the contractor, who will develop and realize the respective wind farm installations.
Low carbon energy installation
On-site solar PPA in USA, Europe and Asia (under investigation): Novartis currently investigates expanding its on-site solar energy capacity from 1.5MW to over 10MW with solar PV and solar thermal opportunities at 8 sites in the USA (California, New Jersey and Colorado), projects in Europe (UK) and Asia (India) and Singapore. it is considered to structure these projects as on-site Power Purchase Agreement (PPA)
50000
Scope 2 (location-based) Scope 2 (market-based)
Voluntary 2200000 0 4-10
years 11-15 years
It is considered to structure these projects as on-site Power Purchase Agreement (PPA) As a consequence of that we consider investment required as zero. However, the contractual conditions mean that the savings will be shared in some form with the contractor.

Activity type
Description of activity
Estimated annual CO2e
savings (metric tonnes CO2e)
Scope
Voluntary/ Mandatory
Annual monetary savings
(unit currency
- as specified in CC0.4)
Investment required
(unit currency -
as specified in CC0.4)
Payback period
Estimated lifetime of
the initiative
Comment
contracts.
Energy efficiency: Building services
Energy Management Program with regional Facility Services providers (under investigation): Novartis currently investigates possibilities to actively engaging facility management service providers at its sites into energy management programs. Part of the energy efficiency programs as conducted in the past by Novartis-own engineering and facility management groups will be transferred to third party service providers. Estimated savings range between 0.8 and 1.2% of energy use/cost and equal amount of related GHG savings.
15000
Scope 1 Scope 2 (location-based) Scope 2 (market-based)
Voluntary 3300000 0 1-3
years 6-10 years
Transportation: fleet
Program on fuel efficient vehicles (implementation commenced): Novartis has set a global target on CO2 emission reduction of its global vehicles fleet. The target of 50% reduction by 2020 (compared to 2010).
40000 Scope 1
Voluntary Mandatory
7000000 0 1-3 years 3-5 years
Novartis maintains lease programs for its approximately 25,000 company cars, operated by its country organizations. Typical duration of

Activity type
Description of activity
Estimated annual CO2e
savings (metric tonnes CO2e)
Scope
Voluntary/ Mandatory
Annual monetary savings
(unit currency
- as specified in CC0.4)
Investment required
(unit currency -
as specified in CC0.4)
Payback period
Estimated lifetime of
the initiative
Comment
2015 status is at -32.6%. Novartis country or divisional organizations maintain programs to increase the fuel efficiency of their vehicles fleet and thereby reduce the CO2 emissions. A bonus/malus system is used e.g. in Germany to motivate drivers (primarily sales personnel) to choose more fuel efficient and lower emitting cars. Specific targets are set on the emission performance (gCO2/km) in Europe or fuel efficiency (miles per gallon) in the USA. The program in Europe is partly driven by regulatory requirements on car fuel efficiency. Additional GHG and related cost savings to achieve the target are considered.
lease is 3-4 years. Monetary savings emerge from lower fuel consumption due to higher engine efficiency.
Transportation: use
Product Distribution (implementation commenced): Novartis had started to work with transportation providers to
20000 Scope 3
Voluntary 0 0 1-3
years 3-5 years
Cost savings and related investments have not yet been assessed, but they are not expected to

Activity type
Description of activity
Estimated annual CO2e
savings (metric tonnes CO2e)
Scope
Voluntary/ Mandatory
Annual monetary savings
(unit currency
- as specified in CC0.4)
Investment required
(unit currency -
as specified in CC0.4)
Payback period
Estimated lifetime of
the initiative
Comment
deliberately choose for its product distribution transportation modes that create lower environmental impacts compared to the ones used before. This primarily concerns switching transports from air freight to sea freight, where transportation conditions and time requirements allow.
be decisive. GHG emission savings are expected to be remarkable.
Other
Forestry carbon-sink projects (implemented): The four Novartis-owned carbon-sink forestry projects in Argentina, Colombia, Sichuan, China and Mali are becoming highly valid contributors on our total GHG balance. In the reporting year 2015 the most advanced projects in Argentina and Mali contributed 67.3ktCO2e GHG savings. Projects in Sichuan, China and Colombia do not contribute carbon-sink yet, as the China project shows a lower growth rate and the
67300 Scope 1
Voluntary 0 5800000 16-20
years >30 years
The total cost for the four projects in the calendar year 2015 sum up to USD 5.8mio. It covers investment costs for the installations of plantations, the maintenance of plantations and additional cost for carbon management (monitoring, verification etc.).

Activity type
Description of activity
Estimated annual CO2e
savings (metric tonnes CO2e)
Scope
Voluntary/ Mandatory
Annual monetary savings
(unit currency
- as specified in CC0.4)
Investment required
(unit currency -
as specified in CC0.4)
Payback period
Estimated lifetime of
the initiative
Comment
Colombia project was commended only 2 years ago. Cost savings from these projects will only occur in the future and from the projects in Argentina and Colombia only as these are considered a forest operation business case. Additional environmental and social benefits form these forestry projects are about to be quantified in the course of our work on Natural Capital Assessment.
Low carbon energy installation
On-site Photovoltaic solar system (implemented): Novartis has a number of sites who installed solar PV, solar thermal and small scale hydro-electric systems at their sites in the US and in Europe. New installations in 2015 include two contracted solar PV systems in Spain of 300kW each. The two new installations give 250tCO2e GHG savings and USD 33,000 cost savings.
2500
Scope 2 (location-based) Scope 2 (market-based)
300000 0

Activity type
Description of activity
Estimated annual CO2e
savings (metric tonnes CO2e)
Scope
Voluntary/ Mandatory
Annual monetary savings
(unit currency
- as specified in CC0.4)
Investment required
(unit currency -
as specified in CC0.4)
Payback period
Estimated lifetime of
the initiative
Comment
Overall, savings with on-site solar systems are estimated to USD 300,000 and GHG savings of approximately 2.5ktCO2e.
Low carbon energy installation
On-site use of renewable fuels (implemented): Novartis has a number of sites who installed renewable / biomass energy in India (bagasse), Germany (woodchips), Italy (biogas) Slovenia and Austria (mycelium waste). No new systems were installed in the reporting year 2015. Overall, the use of renewable bio-fuels achieves a total of 50ktCO2e GHG savings every year but little cost savings.
50000 Scope 1 0 0
Energy efficiency: Processes
Energy efficiency program results 2015 (implemented): Our multi-year energy management / energy efficiency program resulted in the reporting year 2015 in a 26.3kt GHG savings. Related cost and energy savings amounted to USD
26300
Scope 1 Scope 2 (location-based) Scope 2 (market-based)
6000000 19300000 1-3 years 6-10 years
The energy management program includes a detailed energy project accounting system with annual reporting of completed energy projects at all sites

Activity type
Description of activity
Estimated annual CO2e
savings (metric tonnes CO2e)
Scope
Voluntary/ Mandatory
Annual monetary savings
(unit currency
- as specified in CC0.4)
Investment required
(unit currency -
as specified in CC0.4)
Payback period
Estimated lifetime of
the initiative
Comment
6mio and 309TJ in 2015. The investment for these projects amounts to USD 19.3 mio, i.e. an average payback of 3.2 years. Over a period of 5 years the total savings amount to more than USD 70 mio and 220kt GHG savings.
globally.
Transportation: fleet
Program on fuel efficient vehicles (implemented): Since 2010 Novartis implements a program to increase the fuel efficiency of its vehicles fleet and reduce related CO2 emissions. A separate global target had been set on this aspect of Scope1 GHG emissions, in order to support the program. Annual cost, and GHG savings achieved over 5 years since 2010 are at 32.6% or 65kt CO2e compared to a business as usual scenario.
65000 Scope 1
Voluntary Mandatory
11400000 0 1-3 years 3-5 years
Investments are considered zero, as the vehicles are leased (typically 3 years lease terms) and lease costs on average are not higher for more fuel efficient than for standard cars. More so, savings in fuel costs are considerable.
CC3.3c

What methods do you use to drive investment in emissions reduction activities?
Method
Comment
Lower return on investment (ROI) specification
Novartis allows a relaxed payback scheme (over the full lifetime of the asset) for energy projects and require that all relevant investment projects include an energy challenge.
Internal incentives/recognition programs
Since 2004, (overall over 10 years) Novartis has sponsored annual Energy Excellence Awards for innovative energy saving and emission reduction projects and achievements at its operations worldwide. The awards recognize outstanding performance in energy management. More recently the scope of the award scheme had been broadened to include environmental and also HSE and CR topics.
Other
Compliance with own group-wide requirements/standards: In 2008, Novartis has issued internal energy and climate procedural requirements and standards for buildings and building/process equipment. The implementation of these standards are controlled by an audit program, with energy and GHG targets, a comprehensive reporting program and with a tight "Energy Challenge" process for all new investments.
Internal price of carbon
Together with the new Environmental Sustainability vision 2030 and targets 2020, Novartis leadership has endorsed a carbon price of USD 100 per ton (t) of carbon dioxide equivalents, in line with the cost of climate change to society as calculated by the World Bank. Building a carbon price into investment decisions is important as it helps identify projects that will most cost-effectively reduce GHG emissions. Starting in 2016, we will select major GHG reduction projects and measures based on the cost savings they generate, as determined by our internal carbon price of USD 100/tCO2e. A cross-divisional team consisting of energy experts from divisions of Novartis Business Services – Real Estate and Facility Services will prioritize major projects and actions necessary to achieve our 2020 GHG reduction target. Projects will be submitted to top management for approval.
CC3.3d
If you do not have any emissions reduction initiatives, please explain why not
Further Information
Page: CC4. Communication
CC4.1

Have you published information about your organization’s response to climate change and GHG emissions performance for this reporting year in places other than in your CDP response? If so, please attach the publication(s)
Publication
Status
Page/Section reference
Attach the document
Comment
In mainstream reports (including an integrated report) but have not used the CDSB Framework
Complete pp. 7,32, 69-70 https://www.cdp.net/sites/2016/24/13524/Climate Change 2016/Shared Documents/Attachments/CC4.1/novartis-annual-report-2015-en-low-res.pdf
Novartis Annual Report 2015
In voluntary communications Complete pp.7,17,53-55,57-62
https://www.cdp.net/sites/2016/24/13524/Climate Change 2016/Shared Documents/Attachments/CC4.1/novartis-cr-performance-report-2015.pdf
Novartis Corporate Responsibility Report 2015
Further Information
Module: Risks and Opportunities
Page: CC5. Climate Change Risks
CC5.1
Have you identified any inherent climate change risks that have the potential to generate a substantive change in your business operations, revenue or expenditure? Tick all that apply Risks driven by changes in regulation Risks driven by changes in physical climate parameters Risks driven by changes in other climate-related developments
CC5.1a

Please describe your inherent risks that are driven by changes in regulation
Risk driver
Description
Potential impact
Timeframe
Direct/Indirect
Likelihood
Magnitude of impact
Estimated financial
implications
Management
method
Cost of
management
Cap and trade schemes
EU-ETS: Novartis has 6 sites in the European Union that are part of the European Emissions Trading Scheme (EU-ETS). The total amount of allowances for 2015 is 130299 tons. With an average price of currently Euro 8 this represents a value of app. Euro 1,042,000. In 2015 these 6 Novartis sites were able to keep their GHG emissions managed under EU-ETS at 144786 tonnes (1.6% lower than in 2014), but 11.2% above the amount of allowances received. The gap was compensated in 2015 with surplus from Phase II, purchase of additional EUAs (in Slovenia and the UK). Allowances will be further reduced during Phase III between 2016 and 2020, while our ongoing energy and GHG reduction program will also allow for further emission reductions over coming years. Most recent
Increased operational cost
3 to 6 years Direct Very likely Low-
medium
The 2015 shortage of 11.2% is valued to Euro 116500 (USD 130000), which so far could be compensated with surplus from previous years, small amounts of EUA purchase and EUA-CER swaps. Over the entire Phase III total cost is not expected to grow over USD 0.5 million per year.
Ongoing strong energy and GHG reduction programs across the organization are in place to work towards the global energy efficiency and GHG reduction targets. The largest sites included in the scheme is the Anti-Infectives manufacturing plant of Sandoz Division in Kundl, Austria. Kundl implemented a comprehensive energy management program (being the first site in Austria with ISO 50,000 Energy Management System certification). Major projects
The EU-ETS sites and Corporate HSE have very little if any additional management cost to comply with EU-ETS. These are limited to some additional monitoring and the verification costs, which are estimated to below USD 0.1 million p.a.

Risk driver
Description
Potential impact
Timeframe
Direct/Indirect
Likelihood
Magnitude of impact
Estimated financial
implications
Management
method
Cost of
management
experience showed that we were not able to stay below the allowances received and will have to compensate the shortage. Additional regulatory risks identified that will increase the financial implications for Novartis are an expected re-increase in the allowance price and the potential introduction of emission trading schemes in other regions or countries (e.g. USA, Canada, Japan, Australia, China).
of energy efficiency improvement and related GHG emission reduction are electricity and heat energy savings of the fermentation processes, waste heat recovery from processes and from waste water treatment. The Sandoz site in Rovereto, Italy implemented a project for heat recovery and the generation and internal use of biogas, generated from their high-load waste water and from waste water sludge.
International agreements
With respect to regulatory schemes (such as the continued Kyoto protocol and future national and supra-national legal
Increased operational cost
>6 years Direct Likely Medium
Total energy costs were USD 336 million in 2015 and existing carbon
Ongoing strong energy and GHG reduction programs across the
Energy projects over last 5 years had an average

Risk driver
Description
Potential impact
Timeframe
Direct/Indirect
Likelihood
Magnitude of impact
Estimated financial
implications
Management
method
Cost of
management
requirements following the Paris Agreement), Novartis has taken a proactive approach towards existing and forthcoming legal schemes on greenhouse gas (GHG) emissions as set forth in its Corporate Energy and Climate Strategy (adopted by the Executive Committee of Novartis in June 2015 with GHG targets for 2020 and 2030). Novartis will also be impacted in more general terms, when prices of carbon will become more fully integrated into prices of goods and services, in particularly energy and water. In view of such integration Novartis has also endorsed by top management to use an internal carbon price of USD100/tCO2e as shadow price, anticipating the most recent UN-GC call for a company voluntary carbon price of USD100/ton CO2e at minimum.
costs were marginal. Energy prices did not increase in recent years. Since the introduction of our energy program in 2008 we have reduced annual energy costs by USD 71 million through projects compared to a business as usual scenario. Future increases in energy prices and the implementation of carbon costs may have a stronger impact of estimated 20-30% of energy cost in the long-term, i.e. USD 67-101 million per year.
organization are in place to work towards the global energy efficiency and GHG reduction targets. Novartis has put in place an energy project accounting process for all divisions and sites. The mandatory reporting includes investment, energy cost savings, energy savings and GHG emission reduction by each implemented project. Novartis has set an energy saving target of 17% energy and related GHG emission saving by 2015 (baseline 2008) and divisions implemented
payback of 2.6 years. Management costs for the energy management programs at Divisions and sites of app. USD 4-5 million per year were largely over-compensated by the savings of so far USD 71 million p.a. in energy costs achieved by the program over last 7 years; i.e. no additional costs but rather attractive cost reductions overall.
Risk driver
Description
Potential impact
Timeframe
Direct/Indirect
Likelihood
Magnitude of impact
Estimated financial
implications
Management
method
Cost of
management
this target specifically at their sites. This internal target was overachieved in 2015 by 17.9% savings. A new target of 20% savings based on 2010 was now set for 2020.
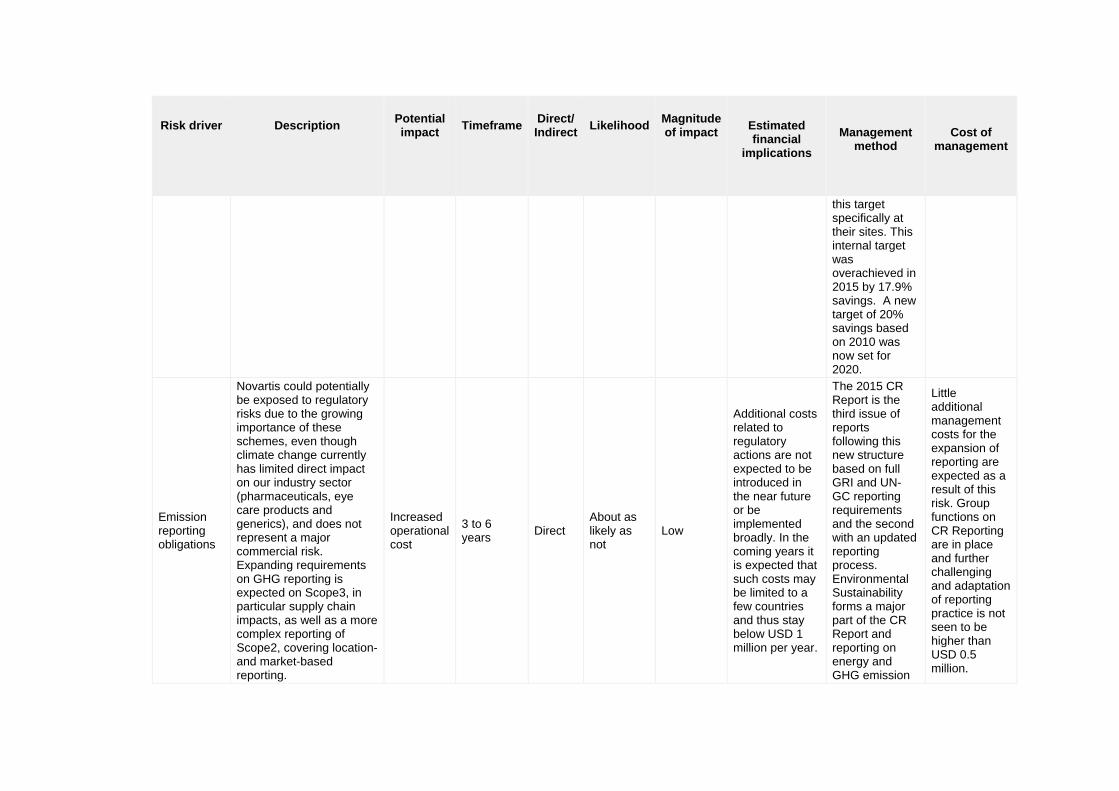
Emission reporting obligations
Novartis could potentially be exposed to regulatory risks due to the growing importance of these schemes, even though climate change currently has limited direct impact on our industry sector (pharmaceuticals, eye care products and generics), and does not represent a major commercial risk. Expanding requirements on GHG reporting is expected on Scope3, in particular supply chain impacts, as well as a more complex reporting of Scope2, covering location- and market-based reporting.
Increased operational cost
3 to 6 years Direct
About as likely as not
Low
Additional costs related to regulatory actions are not expected to be introduced in the near future or be implemented broadly. In the coming years it is expected that such costs may be limited to a few countries and thus stay below USD 1 million per year.
The 2015 CR Report is the third issue of reports following this new structure based on full GRI and UN-GC reporting requirements and the second with an updated reporting process. Environmental Sustainability forms a major part of the CR Report and reporting on energy and GHG emission
Little additional management costs for the expansion of reporting are expected as a result of this risk. Group functions on CR Reporting are in place and further challenging and adaptation of reporting practice is not seen to be higher than USD 0.5 million.

Risk driver
Description
Potential impact
Timeframe
Direct/Indirect
Likelihood
Magnitude of impact
Estimated financial
implications
Management
method
Cost of
management
reduction performance and targets is a central part. We are constantly challenging our reporting practice and mirror it with requirements formulated by SRI groups such as DJSI, and business organizations such as GRI and the WBCSD.
Lack of regulation
We believe that a lack of clear international agreements and national legislation on climate change and respective targets may have a negative impact on our ability to plan measures to reduce climate change impact. Novartis has invested in long-term carbon sink afforestation/reforestation projects, has certified them with formal schemes such as CDM or VCS, and
Other: Loss of value of carbon offsets
>6 years Direct About as likely as not
Low
As Novartis developed its own forestry carbon sink projects and designed them as a business case, the actual price of credits is not a key parameter in our approach. Additional economic, social and environmental
Novartis will continue its forestry carbon sink projects, and add additional sustainability values (social, environmental, economic) into the projects. We are working towards making the forestry carbon sink projects a
Management costs related to these projects are a marginal part of the total costs required to run the four forestry carbon sink projects, which overall is <USD 0.3 million per year.

Risk driver
Description
Potential impact
Timeframe
Direct/Indirect
Likelihood
Magnitude of impact
Estimated financial
implications
Management
method
Cost of
management
compensates part of its emissions with the carbon sinks gained from these projects. Uncertainty in the application and use of these schemes creates disadvantages for our forestry carbon sink projects and the value of credits developed.
values are created with these projects. We also do not intend to sell the credits. The registration under CDM and VCS are solely made for quality reasons. The effect of low credit prices is rather immaterial, related to the credibility and acceptance of the forestry projects. Any financial implication is not expected to exceed USD 1 million per year.
business case with an economically positive outcome, which also will secure their long-term continuation and durability of the carbon stocks.
CC5.1b
Please describe your inherent risks that are driven by changes in physical climate parameters

Risk driver
Description
Potential impact
Timeframe
Direct/Indirect
Likelihood
Magnitude of impact
Estimated financial
implications
Management
method
Cost of
management
Induced changes in natural resources
Availability of energy and water: Situation: Supply chain screening assessments of Novartis suppliers conducted in 2010 and again in 2015 have shown that several types of material and resource supplies are highly sensitive to climate change effects. The supply of electricity, almost any type (hydro-electric or thermal) to Novartis manufacturing and research operations highly depend on the availability of clean water. Also, Novartis sites need fresh water for cleaning and
Reduction/disruption in production capacity
3 to 6 years
Indirect (Supply chain)
Very likely Medium
Increase in energy and water costs in water scarce areas due to further increased water stress could amount to 20-30% of the site energy and water costs. For the top-10 water scarce sites, total electricity costs in 2015 were USD 46 million and total water costs were USD 7 million. An increase as estimated above would result in an addition USD8-12mil per year.
The management method applied to this risk is a proactive facility and resource procurement and energy/water management approach. Saving programs are being implemented at the top-10 water scarce sites already. Water footprint savings achieved in recent years are partly over 20%. Additional projects are being considered and implemented. The target on water footprint set for 2016 is -12% (baseline 2010).
Costs associated with running the water savings program are marginal, below USD 0.2 million per year for the entire global program.

Risk driver
Description
Potential impact
Timeframe
Direct/Indirect
Likelihood
Magnitude of impact
Estimated financial
implications
Management
method
Cost of
management
cooling purposes. Task: In order to most effectively manage water resources first of all at its own operations, Novartis includes monitoring of water as a priority element in its environmental strategy, monitors water flows and asks sites to actively manage water efficiency where relevant. Action: Novartis has identified all its sites located in water scarce areas (projection for 2025) and requires these sites (in e.g. Egypt, Northern Africa; San Diego, South California; Fort Worth, Texas; Mumbai,

Risk driver
Description
Potential impact
Timeframe
Direct/Indirect
Likelihood
Magnitude of impact
Estimated financial
implications
Management
method
Cost of
management
Hyderabad and Dhaka, South Asia and Beijing, Northeast China; Batam, Indonesia) to include direct and indirect water scarcity into the risk portfolio for these sites. The ten top sites with respect to water footprint and water scarcity were required to design and implement a water saving program as of 2013 including water audit, water flow chart, list of water savings projects and site-specific water savings target. Result: For 2014 and 2015 water savings of about 10% were set as a

Risk driver
Description
Potential impact
Timeframe
Direct/Indirect
Likelihood
Magnitude of impact
Estimated financial
implications
Management
method
Cost of
management
reduction target at these 10 sites. 10 additional sites with high water footprint of high water scarcity were requested in 2014 and 2015 to as well implement learnings on water savings made at the top-10 sites.
Change in precipitation extremes and droughts
Flooding of operations: Situation: Novartis manufacturing operations located in critical areas, e.g. Elbe river plains in Barleben-Magdeburg, Germany and Illinois in the USA Mid-West, the Mumbai area in India and in the Shanghai area in China, could be flooded
Reduction/disruption in production capacity
3 to 6 years Direct Very likely Medium
Sites must invest in the reinforcement of site infrastructure (larger storm water run-off, dykes, specific building protection, etc.), which is estimated to USD 2-5 million per site or USD 20 to 25 million overall. The total cost for the flood protection project
Actions related to flood protection are aspects of site engineering and facility management. Risks are assessed in the annual risk evaluation process, where natural disasters are a regular part of and are prepared site by site.
Site engineering might use 5-10% more resources over several years when such flood protection projects have to be implemented. These additional engineering costs are assessed to 0.4-0.5 million in total over next 5 years.

Risk driver
Description
Potential impact
Timeframe
Direct/Indirect
Likelihood
Magnitude of impact
Estimated financial
implications
Management
method
Cost of
management
during severe weather events with respective damages and production interruptions. Flooding risks were even found in California, where local situations could unexpectedly create a flooding risk at severe weather events. Task: In order to avoid such events, specific risk assessment and consequently necessary protection measures might become necessary. This will lead to higher costs to keep such risks within acceptable limits. Action: Our production site in San
implemented in San Carlos, California amounted to 0.25 million in correction measures on the local creek and protection equipment for the building.

Risk driver
Description
Potential impact
Timeframe
Direct/Indirect
Likelihood
Magnitude of impact
Estimated financial
implications
Management
method
Cost of
management
Carlos in Central California has recently implemented a flood protection project, in cooperation with local authorities and neighbouring firms. Result: With the measures taken the site successfully controlled the risk of flooding and minimized the related consequences for the operation.
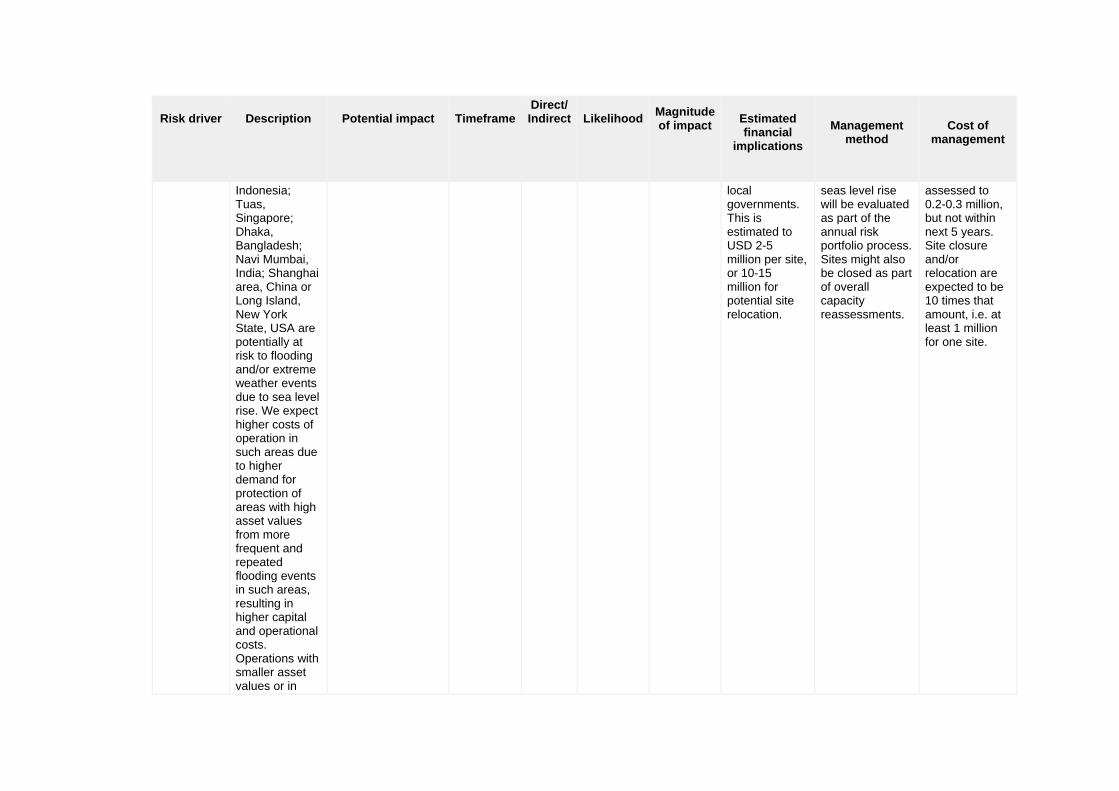
Sea level rise
Flooding of Novartis manufacturing operations at coastal locations: Novartis manufacturing operations in coastal locations, e.g. in Batam Island,
Increased capital cost >6 years Direct
About as likely as not
Low-medium
Sites will need to invest in the reinforcement of site infrastructure (dykes or storm protection) or contribute to larger protection measures undertaken by
Actions related to flood protection are normal aspects of site engineering and facility management. Risks related to natural disasters or climate change induced risks such as
Site engineering might use 5-10% more resources over several years when such reinforcements will be implemented. Additional engineering costs are
Risk driver
Description
Potential impact
Timeframe
Direct/Indirect
Likelihood
Magnitude of impact
Estimated financial
implications
Management
method
Cost of
management
Indonesia; Tuas, Singapore; Dhaka, Bangladesh; Navi Mumbai, India; Shanghai area, China or Long Island, New York State, USA are potentially at risk to flooding and/or extreme weather events due to sea level rise. We expect higher costs of operation in such areas due to higher demand for protection of areas with high asset values from more frequent and repeated flooding events in such areas, resulting in higher capital and operational costs. Operations with smaller asset values or in
local governments. This is estimated to USD 2-5 million per site, or 10-15 million for potential site relocation.
seas level rise will be evaluated as part of the annual risk portfolio process. Sites might also be closed as part of overall capacity reassessments.
assessed to 0.2-0.3 million, but not within next 5 years. Site closure and/or relocation are expected to be 10 times that amount, i.e. at least 1 million for one site.

Risk driver
Description
Potential impact
Timeframe
Direct/Indirect
Likelihood
Magnitude of impact
Estimated financial
implications
Management
method
Cost of
management
poorer areas such as in Dhaka, Bangladesh will potentially be required to move to other locations.
Tropical cyclones (hurricanes and typhoons)
Damage to operations in critical areas: Tropical cyclones or tornadoes are extreme weather events that can cause significant damage and loss of assets at Novartis manufacturing and research operations. Such locations in East- and South-East USA (e.g. Duluth, Georgia; Fort Worth, Texas) will need higher protection to cope with such increased risk or will be
Increased capital cost
1 to 3 years Direct Likely Low
Site will be required to reinforce the infrastructure of their buildings and provide additional protection (shelter) for their employees. This could amount to estimated USD 2-5 million per site, depending on the size of site and number of associates working at these sites.
Actions related to typhoon, hurricane and tornado protection are normal aspects of site engineering and facility management in areas where such severe event could happen. Local engineering and HSE groups are aware of increasing risks related to change of weather patterns are include such changes in their risk evaluation.
Site engineering at these sites might use 5-10% more resources over several years when measures for building reinforcement and employee protection will need to be implemented. This may result in extra costs of estimated 0.2-0.3 million overall for major sites such as Fort Worth and Johns Creek.

Risk driver
Description
Potential impact
Timeframe
Direct/Indirect
Likelihood
Magnitude of impact
Estimated financial
implications
Management
method
Cost of
management
required to move to other locations.
Induced changes in natural resources
Availability of agro-materials for fermentation processes supplied for Novartis fermentation operations as global commodities represents a risk as the price for such commodities is expected to rise with increasing effects of climate change, due to various climate factors.
Reduction/disruption in production capacity
>6 years Indirect (Supply chain)
Likely Low
Prices for agricultural commodities may increase by 20-30% over the next 10 years.
The unit has an active procurement program in place to constantly optimize procurement situation for all key process materials.
Additional management costs for this aspect to be minor, i.e. less than USD 0.1 million.
Other physical climate drivers
Melting of glaciers and related changes in water availability or temporary water scarcity: Novartis has several locations north and south of the Alps in Kundl, Austria;
Reduction/disruption in production capacity
>6 years Direct Unlikely Medium-high
Replacing cooling water by mechanical chilling at any of the sites potentially impacted would results in additional energy costs of estimated 20% at these sites, resulting in
Energy Management is a key function at these sites and efficiency improvements and optimization measures are ongoing aspects of process and facility management. Risks related to
Additional management costs for change of equipment and replacement if existing techniques would be an estimated USD 0.5 million over several years.

Risk driver
Description
Potential impact
Timeframe
Direct/Indirect
Likelihood
Magnitude of impact
Estimated financial
implications
Management
method
Cost of
management
Menges and Lendava, Slovenia and Rovereto, Italy, with fermentation operations that depend on a regular availability of water for process cooling. Water resources could become more expensive, or water may not be available for cooling anymore on a constant year-long basis, as rivers could dry out at certain periods of the year.
higher electricity costs of up to USD 20 million per year. Replacement of equipment estimated at USD 50 million and payback of 4-5 years would also become necessary.
change in the availability of water for cooling will be addressed in the risk evaluation process that is conducted at each site on an annual basis.
Other physical climate drivers
Higher temperature in rivers and limitations of using the water for cooling purposes (process and/or comfort cooling) for example at
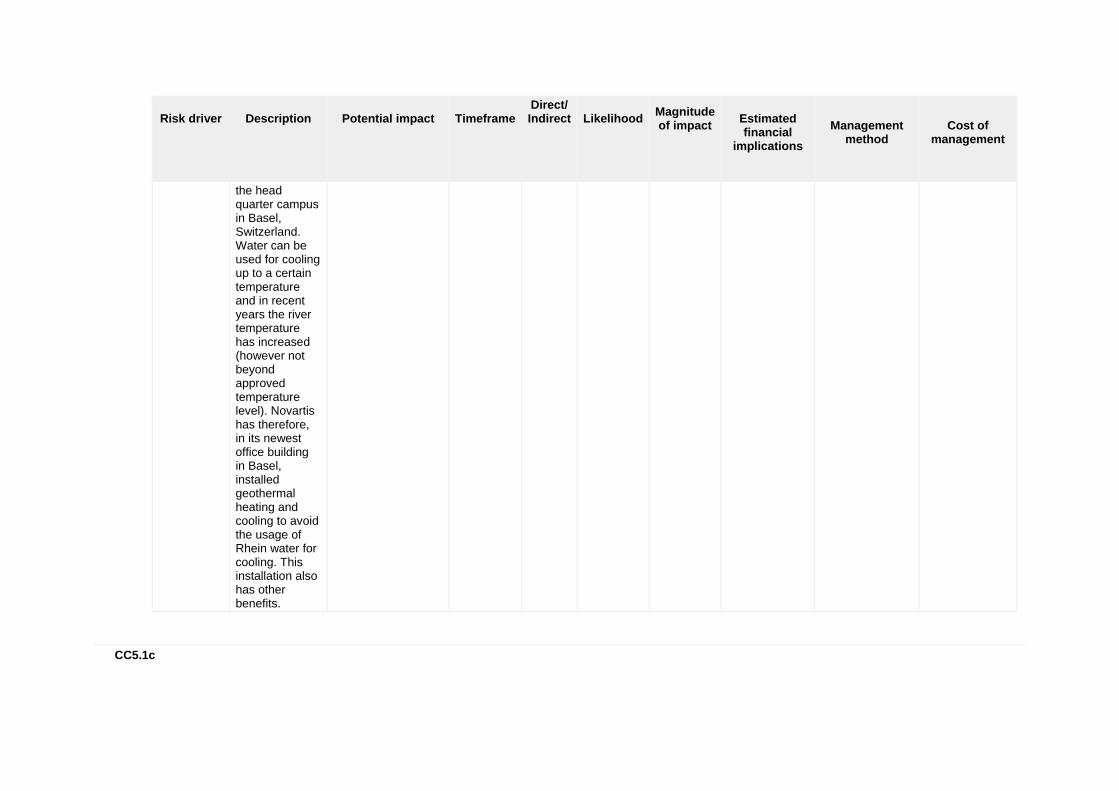
Risk driver
Description
Potential impact
Timeframe
Direct/Indirect
Likelihood
Magnitude of impact
Estimated financial
implications
Management
method
Cost of
management
the head quarter campus in Basel, Switzerland. Water can be used for cooling up to a certain temperature and in recent years the river temperature has increased (however not beyond approved temperature level). Novartis has therefore, in its newest office building in Basel, installed geothermal heating and cooling to avoid the usage of Rhein water for cooling. This installation also has other benefits.
CC5.1c

Please describe your inherent risks that are driven by changes in other climate-related developments
Risk driver
Description
Potential impact
Timeframe
Direct/Indirect
Likelihood
Magnitude of impact
Estimated financial
implications
Management
method
Cost of
management
Other drivers
Biodiversity: A temperature rise of 1.5 to 2.5°C above pre-industrial levels, which are expected by 2050 as a minimum, will lead to the extinction of 20-30% of known plant and animal species (IPCC 2007). Potential reduction in biodiversity caused by climate change may have long term impacts on Novartis' pharmaceutical business. With over 60% of all new anti-cancer and anti-infective agents (both important parts of Novartis drug portfolio) being derived from natural products or their derivatives, Novartis could suffer severely from the reduction of biodiversity over the next 30 to 50 years. Current Novartis products based on
Inability to do business
>6 years Direct More likely than not Medium
Current Novartis products based on natural compounds include top-selling brands like Miracalcin, Neoral and Sandostatin, which together bring more than USD 2 billion in net sales. An estimation of potential costs related to this effect in the longer term future could be in the same order of magnitude of the current level of sales in this category of products.
Novartis operates a Natural Products Unit (of app. 50 researchers) within its R&D Division, including bio-prospecting programs in Asia and Latin America.
The issue are covered within the Natural Products Unit. A decrease of biodiversity will make bioprospecting programs more difficult, more time consuming and less effective. Cost for such studies may easily be doubled compared to today, i.e. reach USD 5-10mio.

Risk driver
Description
Potential impact
Timeframe
Direct/Indirect
Likelihood
Magnitude of impact
Estimated financial
implications
Management
method
Cost of
management
natural compounds include brands like Miracalcin, Neoral and Sandostatin. The Novartis products Sennoside and Coartem are herbal medical products or contain natural compounds that are extracted from plants.
Increasing humanitarian demands
Increased need and higher expectations to fight tropical diseases: Climate change will affect the spread of tropical diseases like malaria and dengue fever due to changing climate patterns to areas which are today sub-tropical or temperate (e.g. Mediterranean, northern parts of the USA, China and areas of higher altitude in India and Africa). Novartis is very active in supporting the fight against malaria with its innovative
Increased capital cost
3 to 6 years Direct
About as likely as not
Medium
The increased spread may results in an estimated 10% higher demand. As long as the malaria treatment is given on production costs with no profit, such spread will result in a higher demand and thus higher costs to Novartis. In case malaria will also spread out into higher income areas outside Africa (e.g. Southern Europe or North America) Novartis will have a business benefit
Novartis main management method on this aspect is research for new applications and alternative treatment methods for malaria. New malaria drugs are under development at Novartis. These include other combination of ingredients to overcome growing resistance to substances included in Coartem and alternative ways
Management costs would equally increase by 10%.

Risk driver
Description
Potential impact
Timeframe
Direct/Indirect
Likelihood
Magnitude of impact
Estimated financial
implications
Management
method
Cost of
management
combination medicine Coartem and new malaria drugs under development. In a unique collaboration with international organizations (e.g. WHO), Novartis has provided more than 750million Coartem treatment courses to the public sector in Africa (e.g. Kenya and Tanzania) without profit since 2001. These treatments have helped to save approximately 550000 lives. If malaria potentially will spread into additional tempered areas as a result of climate change, Novartis will experience higher demand for medication and will continue help fighting malaria also outside Africa.
from selling the malaria treatment to such developed markets.
of treatment.
CC5.1d

Please explain why you do not consider your company to be exposed to inherent risks driven by changes in regulation that have the potential to generate a substantive change in your business operations, revenue or expenditure
CC5.1e
Please explain why you do not consider your company to be exposed to inherent risks driven by physical climate parameters that have the potential to generate a substantive change in your business operations, revenue or expenditure
CC5.1f
Please explain why you do not consider your company to be exposed to inherent risks driven by changes in other climate-related developments that have the potential to generate a substantive change in your business operations, revenue or expenditure
Further Information
Page: CC6. Climate Change Opportunities
CC6.1
Have you identified any inherent climate change opportunities that have the potential to generate a substantive change in your business operations, revenue or expenditure? Tick all that apply Opportunities driven by changes in regulation Opportunities driven by changes in physical climate parameters
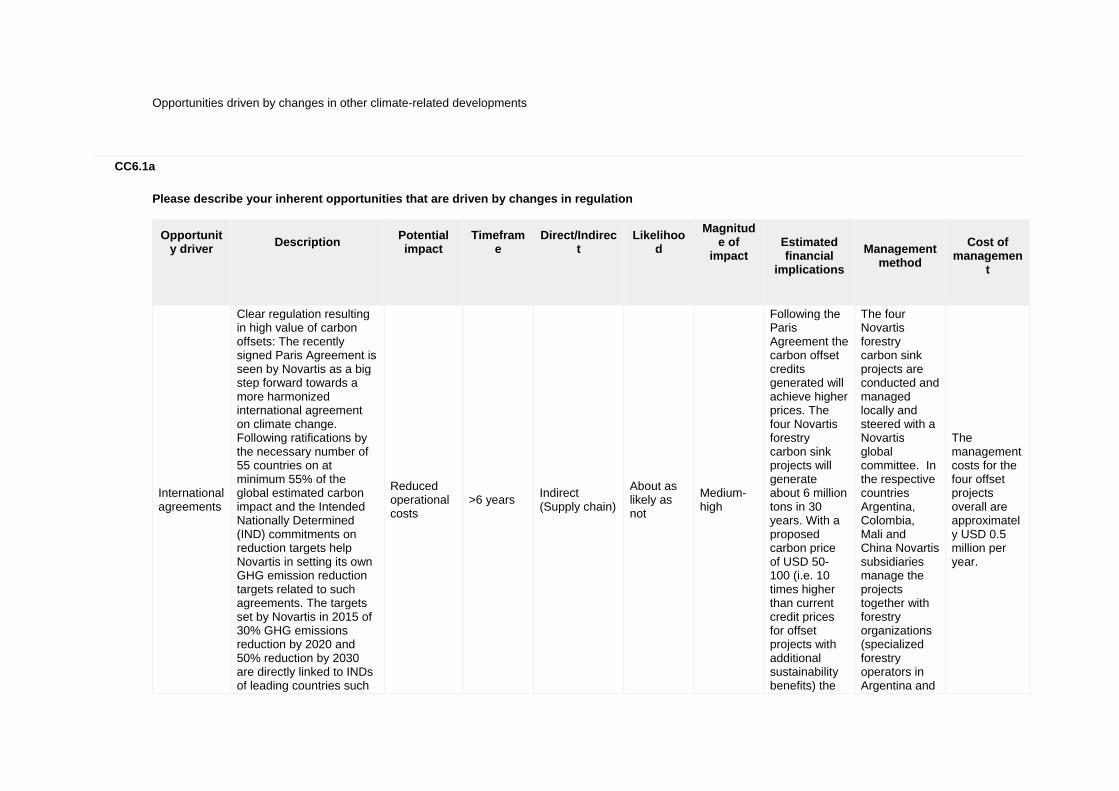
Opportunities driven by changes in other climate-related developments
CC6.1a
Please describe your inherent opportunities that are driven by changes in regulation
Opportunity driver
Description
Potential impact
Timeframe
Direct/Indirect
Likelihood
Magnitude of
impact
Estimated financial
implications
Management
method
Cost of
management
International agreements
Clear regulation resulting in high value of carbon offsets: The recently signed Paris Agreement is seen by Novartis as a big step forward towards a more harmonized international agreement on climate change. Following ratifications by the necessary number of 55 countries on at minimum 55% of the global estimated carbon impact and the Intended Nationally Determined (IND) commitments on reduction targets help Novartis in setting its own GHG emission reduction targets related to such agreements. The targets set by Novartis in 2015 of 30% GHG emissions reduction by 2020 and 50% reduction by 2030 are directly linked to INDs of leading countries such
Reduced operational costs
>6 years Indirect (Supply chain)
About as likely as not
Medium-high
Following the Paris Agreement the carbon offset credits generated will achieve higher prices. The four Novartis forestry carbon sink projects will generate about 6 million tons in 30 years. With a proposed carbon price of USD 50-100 (i.e. 10 times higher than current credit prices for offset projects with additional sustainability benefits) the
The four Novartis forestry carbon sink projects are conducted and managed locally and steered with a Novartis global committee. In the respective countries Argentina, Colombia, Mali and China Novartis subsidiaries manage the projects together with forestry organizations (specialized forestry operators in Argentina and
The management costs for the four offset projects overall are approximately USD 0.5 million per year.

Opportunity driver
Description
Potential impact
Timeframe
Direct/Indirect
Likelihood
Magnitude of
impact
Estimated financial
implications
Management
method
Cost of
management
as Switzerland or the EU. Without ratification and more ambitions commitments, tools for carbon offsetting and carbon trading will also remain unclear or existing systems might even further deteriorate. This could reduce the value of established credits based on the current existing official or voluntary carbon offsetting schemes. Novartis has already developed CDM projects in Argentina and China and is developing another one in Colombia. Novartis also conducts a carbon offset project in Mali, based on voluntary schemes (VCS and ISO). The Novartis projects will further gain credibility and acceptance with updated international agreements, and the carbon offset credits generated would achieve higher values. Novartis has also set an internal carbon price of USD100/tCO2e as shadow price for better decision making, in agreement with latest requirements of
projects have a total long-term value of USD 300-600 million for the carbon sinks alone. Assuming an increase of the price to USD 200 in the very long term, the total value could increase to USD 1.2 billion.
Colombia, an agroforestry company in Mali and governmental forest bureaux in China). Additionally, Novartis engages with mediators (NGOs, academia and specialized carbon consultants), to ensure the projects are following best practice and most advanced methodologies.

Opportunity driver
Description
Potential impact
Timeframe
Direct/Indirect
Likelihood
Magnitude of
impact
Estimated financial
implications
Management
method
Cost of
management
international organizations.
Cap and trade schemes
EU-ETS: Possibility to sell surplus allowances related to increased energy efficiency and GHG emission reduction performance: Novartis might be able to reduce its GHG emissions at the sites included in the EU-ETS to levels that it will have surplus allowances and will be able to sell these to other companies.
Reduced operational costs
3 to 6 years Direct Unlikely Low
Due to the fact that EU-ETS allowances have been reduced by 33% when moving from phase II to Phase III, the potential surplus is expected to be USD <0.1 million by 2020.
Ongoing strong energy and GHG reduction programs across the organization are in place to work towards the global energy efficiency and GHG reduction targets
The EU-ETS and Corporate have very little if any additional management cost to comply with EU-ETS. These are limited to some additional monitoring and the verification costs, which are estimated to below USD 0.1 million per year.
Voluntary agreements
Voluntary use of Carbon Offset schemes: Novartis has initiated its own forestry carbon sink projects in Argentina (CDM project: Reforestation of Grazing Lands in Santo Domingo, Argentina, registered by UN-FCCC by February 10, 2011), Mali (Mali
Wider social benefits >6 years Direct Likely Medium
The forestry carbon sink projects in Argentina and Colombia are designed as business cases and will create economic returns at a
The projects are conducted and managed locally by forestry organizations and controlled by Novartis locally and centrally.
The management costs for the four offset projects overall are approximately USD 0.5 million per year.

Opportunity driver
Description
Potential impact
Timeframe
Direct/Indirect
Likelihood
Magnitude of
impact
Estimated financial
implications
Management
method
Cost of
management
Jatropha Initiative; a validated VCS/ISO project), China (Afforestation/Reforestation of Degraded land in Southwest Sichuan, China) and Colombia (Reforestation of grazing lands in Hacienda El Manantial, Puerto Lopez, Colombia). These projects will not only produce carbon sinks, that Novartis uses for compensating part of its GHG emissions, but also generate wider social (economic development and community development) and environmental (water shed management, biodiversity, agro-forestation) benefits. In addition, the projects in Argentina, Colombia and Mali are designed as a business case and are therefore intended to generate long-term economic benefits to Novartis, with a reasonable return of investments and establishment costs.
later stage (estimated 20 years after start). The benefits will be shared with the operating partners and can grow to USD 2-5 million per year for Novartis locally.
Emission reporting
Novartis reporting practices: Novartis is
Investment opportunitie
1 to 3 years Direct Very likely Low Positive
financial In Novartis disclosure and
Overall cost of CR

Opportunity driver
Description
Potential impact
Timeframe
Direct/Indirect
Likelihood
Magnitude of
impact
Estimated financial
implications
Management
method
Cost of
management
obligations following a proactive reporting and disclosure style, including comprehensive and timely reporting of energy and climate aspects in its annual business report, on the website and in accordance to UN-Global Compact and GRI reporting requirements.
s outcome from proactive reporting and disclosure is difficult to estimate. However, a growing number of investors are carefully looking on companies CR performance for their investment decisions. In some countries, e.g. Sweden CR performance aspects become to be decisive for market access. Sales in these countries will therefore be positively influenced with our comprehensive CR disclosure and reporting.
reporting of non-financial information, including environmental data, are part of Corporate Responsibility (CR) management at Group Level.
reporting and disclosure is roughly assessed to be USD 2-5 million per year., including all internal resources needed to collect all the requested performance information from the global organization.

CC6.1b
Please describe the inherent opportunities that are driven by changes in physical climate parameters
Opportunity driver
Description
Potential impact
Timeframe
Direct/ Indirect
Likelihood
Magnitude of impact
Estimated financial
implications
Management
method
Cost of
management
Change in mean (average) temperature
Due to higher global temperature and increase of expected precipitation level changes, Novartis expects that tropical vector diseases such as malaria, dengue fever and others will spread into more temperate zones. Thereby, larger percentage of the global population will be affected and will need treatment against these diseases. Novartis has malaria drugs in its portfolio and is working on the development of more effective malaria drugs
Increased demand for existing products/services
>6 years Direct About as likely as not
Low-medium
In a unique collaboration with international organizations (e.g. WHO), Novartis has provided more than 750 million Coartem treatment courses to the public sector in Africa (e.g. Kenya and Tanzania) without profit since 2001. Profits from a gradual spread into more-developing areas will initially be zero or marginal (when continued to be distributed in the course of CR programs), but could become more relevant in the longer term. Even if demand
Novartis is very active in supporting the fight against malaria with its innovative combination medicine Coartem and new malaria drugs under development. Should malaria and other vector diseases spread more broadly outside less-developed tropical countries, the business of providing medication for such diseases will be included in normal business processes.
Management costs are estimated to grow to the same extent as markets and required product volumes will grow.

Opportunity driver
Description
Potential impact
Timeframe
Direct/ Indirect
Likelihood
Magnitude of impact
Estimated financial
implications
Management
method
Cost of
management
and on drugs for dengue fever and other neglected diseases in its Novartis Institute on Tropical Diseases in Singapore (NITD). Businesses selling these drugs may benefit especially if these diseases spread to more developed countries.
may grow to considerable amounts, such products will continue to be generic with relatively low margins.
CC6.1c
Please describe the inherent opportunities that are driven by changes in other climate-related developments
Opportunity driver
Description
Potential impact
Timeframe
Direct/ Indirect
Likelihood
Magnitude of impact
Estimated financial
implications
Management
method
Cost of
management
Reputation
Among-the-leader profile in climate change management:
Reduced operational costs
3 to 6 years Direct Very likely Medium
Positive financial outcome from proactive
Novartis global CR and HSE programs are based on a
The energy and climate management program and

Opportunity driver
Description
Potential impact
Timeframe
Direct/ Indirect
Likelihood
Magnitude of impact
Estimated financial
implications
Management
method
Cost of
management
The Novartis energy and climate management, and broader Health, Safety and Environmental (HSE) management objective is to be at the forefront together with leading peers. Novartis has set ambitions targets on absolute GHG emissions reductions and is the only pharmaceutical company that has developed and implemented its own forestry carbon sink projects.
energy & climate and HSE programs are e.g. savings on energy. Our energy and climate program has achieved USD 74 mio over last 7 years, which is more than 20% of the total company energy costs.
network of experts on local, divisional and group level, including about 450 HSE experts worldwide. Many production facilities are certified to ISO 14001, ISO 50001 and OSHAS 18001 management system standards.
energy efficiency program is managed by local, divisional and corporate HSE and engineering groups. Overall, may be 100 associates worldwide spend part of their time on this topic, to make use of all kind of saving opportunities and improvements. Few examples have shown that management cost for a proactive management of energy were much less than the savings achieved. Extra costs for the higher engagement to run an "among the leaders" program have not been assessed.
Increasing Increased need Increased >6 years Direct More likely Medium The increased Novartis main Management

Opportunity driver
Description
Potential impact
Timeframe
Direct/ Indirect
Likelihood
Magnitude of impact
Estimated financial
implications
Management
method
Cost of
management
humanitarian demands
and higher expectations to fight tropical diseases: Climate change will affect the spread of tropical diseases like malaria and dengue fever due to changing climate patterns to areas which are today sub-tropical or temperate (e.g. Mediterranean, northern parts of the USA, China and areas of higher altitude in India and Africa). Novartis is very active in supporting the fight against malaria with its innovative combination medicine Coartem and new malaria drugs under development. In a unique collaboration with international organizations
demand for existing products/services
than not spread may results in an estimated 10-20% higher demand. As long as the malaria treatment is given on production costs with no profit, such spread will result in a higher demand and thus higher costs to Novartis. In case malaria will also spread out into higher income areas outside Africa (e.g. Southern Europe or North America) Novartis will have a business benefit from selling the malaria treatment also to such developed markets.
management method on this aspect is research for new applications and alternative treatment methods for malaria. New malaria drugs are under development at Novartis. These include other combination of ingredients to overcome growing resistance to substances included in Coartem and alternative ways of treatment.
costs will equally increase by 10-20%.

Opportunity driver
Description
Potential impact
Timeframe
Direct/ Indirect
Likelihood
Magnitude of impact
Estimated financial
implications
Management
method
Cost of
management
(e.g. WHO), Novartis has provided more than 750million Coartem treatment courses to the public sector in Africa (e.g. Kenya and Tanzania) without profit since 2001. These treatments have helped to save approximately 550000 lives. When malaria potentially will spread into additional tempered areas as a result of climate change, Novartis will experience higher demand for medication and will continue help fighting malaria also outside Africa.
CC6.1d

Please explain why you do not consider your company to be exposed to inherent opportunities driven by changes in regulation that have the potential to generate a substantive change in your business operations, revenue or expenditure
CC6.1e
Please explain why you do not consider your company to be exposed to inherent opportunities driven by physical climate parameters that have the potential to generate a substantive change in your business operations, revenue or expenditure
CC6.1f
Please explain why you do not consider your company to be exposed to inherent opportunities driven by changes in other climate-related developments that have the potential to generate a substantive change in your business operations, revenue or expenditure
Further Information
Module: GHG Emissions Accounting, Energy and Fuel Use, and Trading
Page: CC7. Emissions Methodology
CC7.1
Please provide your base year and base year emissions (Scopes 1 and 2)

Scope
Base year
Base year emissions (metric tonnes CO2e)
Scope 1 Fri 01 Jan 2010 - Fri 31 Dec 2010
617909
Scope 2 (location-based) Fri 01 Jan 2010 - Fri 31 Dec 2010
1062041
Scope 2 (market-based) Fri 01 Jan 2010 - Fri 31 Dec 2010
962836
CC7.2
Please give the name of the standard, protocol or methodology you have used to collect activity data and calculate Scope 1 and Scope 2 emissions
Please select the published methodologies that you use
The Greenhouse Gas Protocol: A Corporate Accounting and Reporting Standard (Revised Edition)
CC7.2a
If you have selected "Other" in CC7.2 please provide details of the standard, protocol or methodology you have used to collect activity data and calculate Scope 1 and Scope 2 emissions

CC7.3
Please give the source for the global warming potentials you have used
Gas
Reference
CO2 IPCC Fourth Assessment Report (AR4 - 100 year) Other: CFC-11 IPCC Fourth Assessment Report (AR4 - 100 year) Other: CFC-12 IPCC Fourth Assessment Report (AR4 - 100 year) Other: CFC-13 IPCC Fourth Assessment Report (AR4 - 100 year) Other: Halon-1211 IPCC Fourth Assessment Report (AR4 - 100 year) Other: Halon-1301 IPCC Fourth Assessment Report (AR4 - 100 year) Other: Halon-2402 IPCC Fourth Assessment Report (AR4 - 100 year) Other: HCFC-123 IPCC Fourth Assessment Report (AR4 - 100 year) Other: HCFC-22 IPCC Fourth Assessment Report (AR4 - 100 year) Other: HFC-134 IPCC Fourth Assessment Report (AR4 - 100 year) Other: HFC-143a IPCC Fourth Assessment Report (AR4 - 100 year) Other: Methane IPCC Fourth Assessment Report (AR4 - 100 year) Other: Nitrous oxide IPCC Fourth Assessment Report (AR4 - 100 year) Other: Sulphur hexafluoride IPCC Fourth Assessment Report (AR4 - 100 year)
CC7.4
Please give the emissions factors you have applied and their origin; alternatively, please attach an Excel spreadsheet with this data at the bottom of this page
Fuel/Material/Energy
Emission Factor
Unit
Reference
Natural gas 0.055 metric tonnes CO2e per GJ International Energy Agency

Fuel/Material/Energy
Emission Factor
Unit
Reference
Methane 0.056 metric tonnes CO2e per GJ International Energy Agency Propane 0.06 metric tonnes CO2e per GJ International Energy Agency Distillate fuel oil No 2 0.0737 metric tonnes CO2e per GJ International Energy Agency Distillate fuel oil No 5 0.077 metric tonnes CO2e per GJ International Energy Agency Diesel/Gas oil 0.0736 metric tonnes CO2e per GJ International Energy Agency Motor gasoline 0.0739 metric tonnes CO2e per GJ International Energy Agency Jet gasoline 0.0732 metric tonnes CO2e per GJ International Energy Agency
Further Information
Page: CC8. Emissions Data - (1 Jan 2015 - 31 Dec 2015)
CC8.1
Please select the boundary you are using for your Scope 1 and 2 greenhouse gas inventory Operational control
CC8.2
Please provide your gross global Scope 1 emissions figures in metric tonnes CO2e 533736
CC8.3

Does your company have any operations in markets providing product or supplier specific data in the form of contractual instruments? Yes
CC8.3a
Please provide your gross global Scope 2 emissions figures in metric tonnes CO2e
Scope 2, location-based
Scope 2, market-
based (if applicable)
Comment
1085252 829375 Novartis did recalculate Scope 2 GHG emissions following the location-and market-based methods in accordance with the GHG Protocol Scope 2 Guidance. In the absence of contractual agreements for the market-based method, we used location-based emission factors.
CC8.4
Are there are any sources (e.g. facilities, specific GHGs, activities, geographies, etc.) of Scope 1 and Scope 2 emissions that are within your selected reporting boundary which are not included in your disclosure? No
CC8.4a
Please provide details of the sources of Scope 1 and Scope 2 emissions that are within your selected reporting boundary which are not included in your disclosure

Source
Relevance of Scope 1 emissions from this
source
Relevance of location-based Scope 2 emissions from this
source
Relevance of market-based Scope 2 emissions from this source (if
applicable)
Explain why the source is excluded
CC8.5
Please estimate the level of uncertainty of the total gross global Scope 1 and 2 emissions figures that you have supplied and specify the sources of uncertainty in your data gathering, handling and calculations
Scope
Uncertainty
range
Main sources of uncertainty
Please expand on the uncertainty in your data
Scope 1 Less than or equal to 2%
Metering/ Measurement Constraints
In 2006 Novartis implemented a comprehensive and sophisticated data reporting process and data management application that reduces uncertainty in our data to the bare minimum. In 2015, GHG emissions data was collected from 261 reporting units covering practically all Novartis operations world-wide. The data reporting process involves one dedicated person to enter data and a separate person to verify data at the site level. Automatic data plausibility checks are carried out by the Data Management System during data entry. Additional checks are undertaken at the Divisional and Corporate levels. The final data is then review by an independent assurance expert (PwC) before publication in the Novartis Annual Report and in the Corporate Responsibility Performance Report. Please note that the data reported in this section of the CDP may differ slightly from the data presented in the Novartis Reports. The data presented in these publications is based on so-called 9+3 forecasts derived from 9 months of actual data and 3 months of estimated data. The data presented in the CDP is the actual data from the full 12 months of 2015. Potential minor inaccuracies could result from imprecise energy meter readings.
Scope 2 (location-based)
Less than or equal to 2%
Metering/ Measurement Constraints
In 2006 Novartis implemented a comprehensive and sophisticated data reporting process and data management application that reduces uncertainty in our data to the bare minimum. In 2015, GHG emissions data was collected from 261 reporting units covering practically all Novartis operations world-wide. The data reporting process involves one dedicated person to enter data and a separate person to verify data at the site level. Automatic data plausibility checks are carried out by the Data Management System during data entry. Additional checks are undertaken at the Divisional and Corporate levels. The final data is then review by an independent assurance expert (PwC) before publication in the Novartis Annual Report and in the Corporate Responsibility Performance Report. Please note that the data

Scope
Uncertainty
range
Main sources of uncertainty
Please expand on the uncertainty in your data
presented in these publications is based on so-called 9+3 forecasts derived from 9 months of actual data and 3 months of estimated data, and are calculated using emissions factors provided by energy suppliers or factors from the IEA (comparable to the market-based method). The data presented here is the actual data from the full 12 months of 2015, according to the location-based method. Potential minor inaccuracies could result from imprecise energy meter readings.
Scope 2 (market-based)
Less than or equal to 2%
Metering/ Measurement Constraints
In 2006 Novartis implemented a comprehensive and sophisticated data reporting process and data management application that reduces uncertainty in our data to the bare minimum. In 2015, GHG emissions data was collected from 261 reporting units covering practically all Novartis operations world-wide. The data reporting process involves one dedicated person to enter data and a separate person to verify data at the site level. Automatic data plausibility checks are carried out by the Data Management System during data entry. Additional checks are undertaken at the Divisional and Corporate levels. The final data is then review by an independent assurance expert (PwC) before publication in the Novartis Annual Report and in the Corporate Responsibility Performance Report. Please note that the data presented in these publications is based on so-called 9+3 forecasts derived from 9 months of actual data and 3 months of estimated data, and are calculated using emissions factors provided by energy suppliers or factors from the IEA (comparable to the market-based method). The data presented in the CDP is the actual data from the full 12 months of 2015, according to the market-based method (in the absence of contractual agreements, we used location-based emission factors). Potential minor inaccuracies could result from imprecise energy meter readings.
CC8.6
Please indicate the verification/assurance status that applies to your reported Scope 1 emissions Third party verification or assurance process in place
CC8.6a

Please provide further details of the verification/assurance undertaken for your Scope 1 emissions, and attach the relevant statements
Verification
or assurance cycle in place
Status in
the current reporting
year
Type of verification
or assurance
Attach the statement
Page/section
reference
Relevant standard
Proportion of reported
Scope 1 emissions verified (%)
Annual process Complete Limited
assurance
https://www.cdp.net/sites/2016/24/13524/Climate Change 2016/Shared Documents/Attachments/CC8.6a/Novartis-Annual-Report-Assurance-2015.pdf
p71 ISAE3000 100
CC8.6b
Please provide further details of the regulatory regime to which you are complying that specifies the use of Continuous Emissions Monitoring Systems (CEMS)
Regulation
% of emissions covered by the system
Compliance period
Evidence of submission
CC8.7
Please indicate the verification/assurance status that applies to at least one of your reported Scope 2 emissions figures Third party verification or assurance process in place
CC8.7a
Please provide further details of the verification/assurance undertaken for your location-based and/or market-based Scope 2 emissions, and attach the relevant statements

Location-based or market-based figure?
Verification
or assurance
cycle in place
Status in
the current
reporting year
Type of verification
or assurance
Attach the statement
Page/Section reference
Relevant standard
Proportion of
reported Scope 2
emissions verified
(%)
Market-based
Annual process Complete Limited
assurance
https://www.cdp.net/sites/2016/24/13524/Climate Change 2016/Shared Documents/Attachments/CC8.7a/Novartis-Annual-Report-Assurance-2015.pdf
p71 ISAE3000 100
CC8.8
Please identify if any data points have been verified as part of the third party verification work undertaken, other than the verification of emissions figures reported in CC8.6, CC8.7 and CC14.2
Additional data points
verified
Comment
Year on year change in emissions (Scope 1 and 2)
Our Annual Report 2015 includes total GHG emissions Scope 1 and Scope 2 data from the previous year, that is also verified during the assurance provision process. (2015 Annual Report, page 70)
Year on year change in emissions (Scope 1)
Our Annual Report 2015 includes GHG emissions Scope 1 data from the previous year (combustion and processes on site, and vehicles) that is also verified during the assurance provision process. (2015 Annual Report, page 70)
Year on year change in emissions (Scope 2)
Our Annual Report 2015 includes total GHG emissions Scope 2 data from the previous year (purchased energy), that is also verified during the assurance provision process. (2015 Annual Report, page 70)
Emissions reduction activities The content of the "A new vision for the environment" section of the Annual Report on page 69 provides details on the progress of our initiatives and information on our new environmental sustainability plan and targets.
Emissions reduction activities The data on halogenated and non-halogenated VOC emission reductions, displayed on page 70 of the 2015 Annual Report, are covered by the scope of the 2015 assurance engagement.
Other: Performance data on contact water use and water discharge to treatment, as well as data on operational hazardous and non-

Additional data points
verified
Comment
hazardous waste, displayed on page 70 of the 20154 Annual Report, are covered by the scope of the 2015 assurance. engagement.
CC8.9
Are carbon dioxide emissions from biologically sequestered carbon relevant to your organization? No
CC8.9a
Please provide the emissions from biologically sequestered carbon relevant to your organization in metric tonnes CO2
Further Information
Page: CC9. Scope 1 Emissions Breakdown - (1 Jan 2015 - 31 Dec 2015)
CC9.1
Do you have Scope 1 emissions sources in more than one country? Yes
CC9.1a

Please break down your total gross global Scope 1 emissions by country/region
Country/Region
Scope 1 metric tonnes CO2e
United States of America 143688.3 Austria 75652.5 United Kingdom 38861.9 Germany 37085.4 Slovenia 31154.4 Spain 24915.3 Italy 23225.9 Ireland 14115.2 Turkey 12704.6 Switzerland 12319.3 Belgium 9885.5 Poland 9175.1 Japan 9106.8 China 7311.8 Rest of world 84533.8
CC9.2
Please indicate which other Scope 1 emissions breakdowns you are able to provide (tick all that apply) By business division By GHG type By activity
CC9.2a

Please break down your total gross global Scope 1 emissions by business division
Business division
Scope 1 emissions (metric tonnes CO2e)
Sandoz 215603.6 Pharmaceuticals 194987.5 Alcon 103127.8 Novartis Research 13901.4 Novartis International 6115.5
CC9.2b
Please break down your total gross global Scope 1 emissions by facility
Facility
Scope 1 emissions (metric tonnes CO2e)
Latitude
Longitude
CC9.2c
Please break down your total gross global Scope 1 emissions by GHG type
GHG type
Scope 1 emissions (metric tonnes CO2e)
CO2 524631.6 HFCs 9104.2

GHG type
Scope 1 emissions (metric tonnes CO2e)
SF6 0 N2O 0 CH4 0
CC9.2d
Please break down your total gross global Scope 1 emissions by activity
Activity
Scope 1 emissions (metric tonnes CO2e)
Manufacturing (onsite combustion & processes) 311408.1 Administration (onsite combustion & processes) 61316.1 R&D (onsite combustion & processes) 22151.3 Sales (vehicle emissions) 138860.3
Further Information
Page: CC10. Scope 2 Emissions Breakdown - (1 Jan 2015 - 31 Dec 2015)
CC10.1
Do you have Scope 2 emissions sources in more than one country? Yes

CC10.1a
Please break down your total gross global Scope 2 emissions and energy consumption by country/region
Country/Region
Scope 2, location-based
(metric tonnes CO2e)
Scope 2, market-based (metric tonnes CO2e)
Purchased and consumed
electricity, heat, steam or cooling
(MWh)
Purchased and consumed low carbon electricity, heat, steam or
cooling accounted in market-based approach (MWh)
United States of America 322505.7 310713.6 623634 11321
Switzerland 91963.3 70523.0 446978 168283 India 81242.0 77031.6 88785 0 Slovenia 72906.4 29631.2 215190 31781 Germany 64301.7 56320.6 361330 82575 Austria 61286.1 2126.4 327383 316010 Spain 59374.7 12745.1 78437 0 China 47492.2 47685.6 84407 0 Italy 46920.9 36277.4 153612 25789 Malaysia 36681.8 31275.1 50442.5 0 Singapore 35117.6 29157.8 70168 0 Indonesia 23085.2 21446.9 32551 0 Turkey 21582.2 13716.4 47051 17218 Ireland 21016.6 13373.9 46548 23404 Rest of world 99775.7 77350.4 242817 2408
CC10.2
Please indicate which other Scope 2 emissions breakdowns you are able to provide (tick all that apply)

By business division By activity
CC10.2a
Please break down your total gross global Scope 2 emissions by business division
Business division
Scope 2 emissions, location based (metric tonnes CO2e)
Scope 2 emissions, market-based
(metric tonnes CO2e)
Sandoz 422718.3 277262.4 Alcon 310582.5 283225.7 Pharmaceuticals 261653.0 200572.1 Novartis Research 88894.8 68118.3 Novartis International 1403.0 196.1
CC10.2b
Please break down your total gross global Scope 2 emissions by facility
Facility
Scope 2 emissions, location based (metric tonnes CO2e)
Scope 2 emissions, market-based (metric tonnes CO2e)
CC10.2c

Please break down your total gross global Scope 2 emissions by activity
Activity
Scope 2 emissions, location based (metric tonnes CO2e)
Scope 2 emissions, market-based (metric tonnes CO2e)
Manufacturing 778149.5 569278.0 Administration 181409.9 160541.0 R&D 125692.3 99555.5
Further Information
The figures reported under "Purchased and consumed low carbon electricity, heat, steam or cooling accounted in market-based approach (MWh)" are the total amount of energy purchased that is generated from renewable energy sources (photovoltaic, solar-thermal, geothermal, wind, biomass or small-scale hydroelectricity less than 300kW). In order to report energy purchased from renewable sources, our reporting guidance stipulates that sites should obtain a certificate issued by a third party guaranteeing the renewable energy content of the energy mix. Such certificates are provided by the energy suppliers.
Page: CC11. Energy
CC11.1
What percentage of your total operational spend in the reporting year was on energy? More than 0% but less than or equal to 5%
CC11.2
Please state how much heat, steam, and cooling in MWh your organization has purchased and consumed during the reporting year

Energy type
Energy purchased and consumed (MWh)
Heat 163142 Steam 457126 Cooling 0
CC11.3
Please state how much fuel in MWh your organization has consumed (for energy purposes) during the reporting year 1933980
CC11.3a
Please complete the table by breaking down the total "Fuel" figure entered above by fuel type
Fuels
MWh
Natural gas 1795630 Distillate fuel oil No 2 48846 Distillate fuel oil No 5 4450 Other: Waste - Fossil in nature 42854 Other: Bagasse 27488 Wood or wood waste 11616 Other: Waste - Biological in nature 3096
CC11.4

Please provide details of the electricity, heat, steam or cooling amounts that were accounted at a low carbon emission factor in the market-based Scope 2 figure reported in CC8.3a
Basis for applying a low carbon emission factor
MWh consumed associated with low carbon electricity,
heat, steam or cooling
Comment
Contract with suppliers or utilities, supported by energy attribute certificates
678788
The figure reported here is the total amount of energy purchased that is generated from renewable energy sources (photovoltaic, solar-thermal, geothermal, wind, biomass or small-scale hydroelectricity below300kW). Many of our sites, particularly in Europe and the US, have chosen to purchase "low carbon energy". In order to report energy purchased from renewable sources, our reporting guidance stipulates that sites should obtain a certificate issued by a third party guaranteeing the renewable energy content of the energy mix. Such certificates are provided by the energy suppliers.
CC11.5
Please report how much electricity you produce in MWh, and how much electricity you consume in MWh
Total
electricity consumed
(MWh)
Consumed electricity
that is purchased
(MWh)
Total
electricity produced
(MWh)
Total
renewable electricity produced
(MWh)
Consumed renewable
electricity that is produced by
company (MWh)
Comment
2324122 2249066 72214 6840 6840
Total electricity consumed is calculated based on consumed electricity that is purchased from third parties, plus electricity generated on-site from renewable energy sources, plus electricity produced on-site from CHP (Combined Heat and Power) installations, minus electricity sold to third parties.
Further Information

Page: CC12. Emissions Performance
CC12.1
How do your gross global emissions (Scope 1 and 2 combined) for the reporting year compare to the previous year? No change
CC12.1a
Please identify the reasons for any change in your gross global emissions (Scope 1 and 2 combined) and for each of them specify how your emissions compare to the previous year
Reason
Emissions value
(percentage)
Direction of change
Please explain and include calculation
Emissions reduction activities 1.93 Decrease
Nominal total Scope 1 and Scope 2 GHG emissions have remained flat between 2014 and 2015, with a slight increase of 0.2% from 1360.6kt in 2014 to 1363.4kt in 2015. The program activities undertaken in 2015 achieved emission reductions of 26.3 kilotons CO2e (kt) in 2015 equivalent to 1.93% reduction (Calculation: 26.3 kt * 100 / 1363.4 kt).
Divestment 0 No change The data submitted to the CDP reflects continuing operations (excluding Consumer Health and Vaccines and Diagnostics which were divested, respectively in February 2015 and in March 2015).
Acquisitions 0 No change Novartis did not make any acquisitions in 2015. Mergers 0 No change Novartis was not involved in any mergers in 2015. Change in output 0 No change There were no major changes in output at Novartis facilities. Change in methodology 0 No change Novartis did calculate Scope 2 emissions according to a market-based principle before implementation
of the new Scope 2 accounting practices.
Change in boundary 1.87 Increase
During 2015 Novartis opened two new manufacturing locations in Singapore and St. Petersburg (Russia), and largely expanded its two Research Facilities in Shanghai (China) and Cambridge (USA), creating 95,381m2 of new operating area, referring to an increase in operating area of 1.87%. (Calculation: 95,381 m2 * 100 / 5,105879 m2)
Change in physical operating conditions
0 No change Physical operation conditions at Novartis facilities did not change in 2015.
Unidentified 0 No change
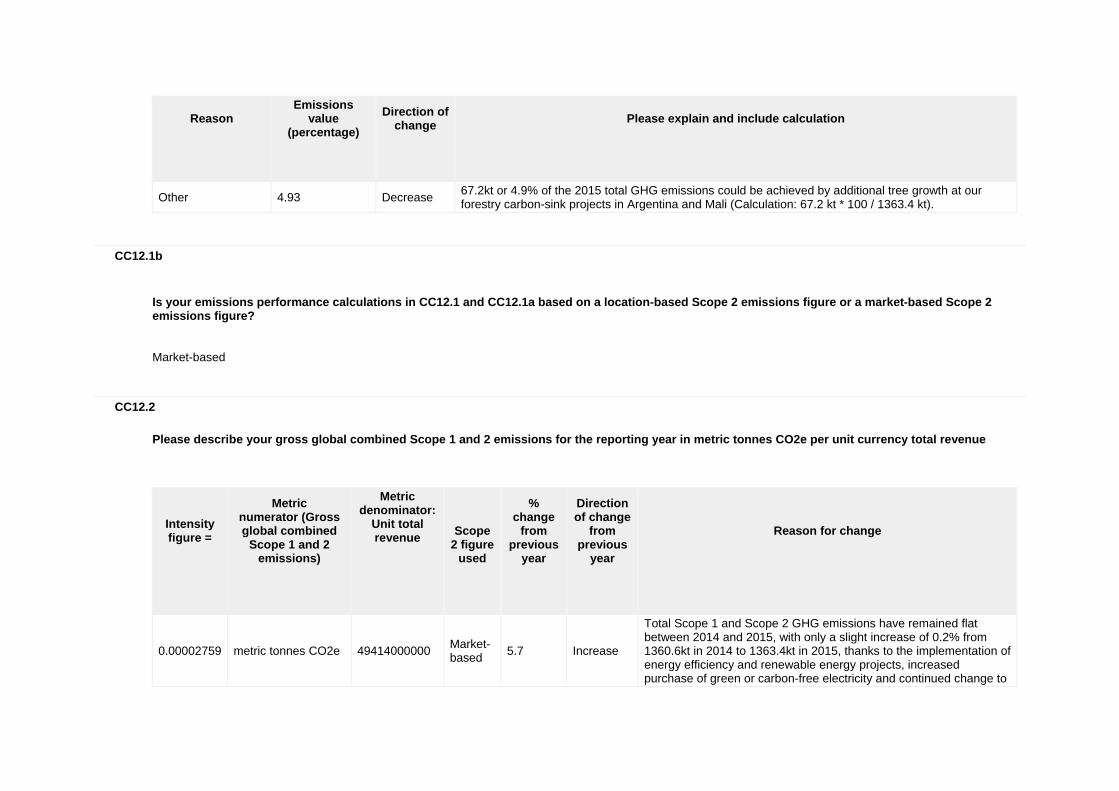
Reason
Emissions value
(percentage)
Direction of change
Please explain and include calculation
Other 4.93 Decrease 67.2kt or 4.9% of the 2015 total GHG emissions could be achieved by additional tree growth at our forestry carbon-sink projects in Argentina and Mali (Calculation: 67.2 kt * 100 / 1363.4 kt).
CC12.1b
Is your emissions performance calculations in CC12.1 and CC12.1a based on a location-based Scope 2 emissions figure or a market-based Scope 2 emissions figure? Market-based
CC12.2
Please describe your gross global combined Scope 1 and 2 emissions for the reporting year in metric tonnes CO2e per unit currency total revenue
Intensity figure =
Metric numerator (Gross global combined
Scope 1 and 2 emissions)
Metric denominator:
Unit total revenue
Scope
2 figure used
% change
from previous
year
Direction of change
from previous
year
Reason for change
0.00002759 metric tonnes CO2e 49414000000 Market-based 5.7 Increase
Total Scope 1 and Scope 2 GHG emissions have remained flat between 2014 and 2015, with only a slight increase of 0.2% from 1360.6kt in 2014 to 1363.4kt in 2015, thanks to the implementation of energy efficiency and renewable energy projects, increased purchase of green or carbon-free electricity and continued change to
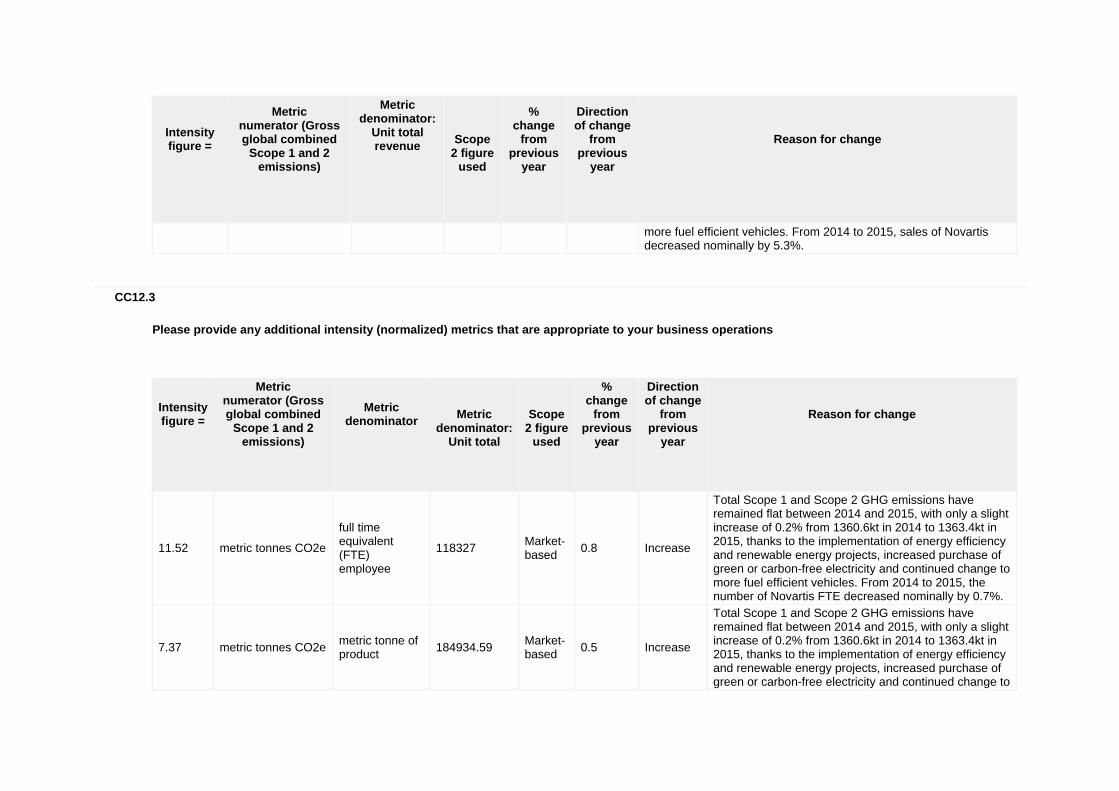
Intensity figure =
Metric numerator (Gross global combined
Scope 1 and 2 emissions)
Metric denominator:
Unit total revenue
Scope
2 figure used
% change
from previous
year
Direction of change
from previous
year
Reason for change
more fuel efficient vehicles. From 2014 to 2015, sales of Novartis decreased nominally by 5.3%.
CC12.3
Please provide any additional intensity (normalized) metrics that are appropriate to your business operations
Intensity figure =
Metric numerator (Gross global combined
Scope 1 and 2 emissions)
Metric denominator
Metric
denominator: Unit total
Scope
2 figure used
% change
from previous
year
Direction of change
from previous
year
Reason for change
11.52 metric tonnes CO2e
full time equivalent (FTE) employee
118327 Market-based 0.8 Increase
Total Scope 1 and Scope 2 GHG emissions have remained flat between 2014 and 2015, with only a slight increase of 0.2% from 1360.6kt in 2014 to 1363.4kt in 2015, thanks to the implementation of energy efficiency and renewable energy projects, increased purchase of green or carbon-free electricity and continued change to more fuel efficient vehicles. From 2014 to 2015, the number of Novartis FTE decreased nominally by 0.7%.
7.37 metric tonnes CO2e metric tonne of product 184934.59 Market-
based 0.5 Increase
Total Scope 1 and Scope 2 GHG emissions have remained flat between 2014 and 2015, with only a slight increase of 0.2% from 1360.6kt in 2014 to 1363.4kt in 2015, thanks to the implementation of energy efficiency and renewable energy projects, increased purchase of green or carbon-free electricity and continued change to

Intensity figure =
Metric numerator (Gross global combined
Scope 1 and 2 emissions)
Metric denominator
Metric
denominator: Unit total
Scope
2 figure used
% change
from previous
year
Direction of change
from previous
year
Reason for change
more fuel efficient vehicles. From 2014 to 2015, production decreased nominally by 0.4%.
Further Information
Page: CC13. Emissions Trading
CC13.1
Do you participate in any emissions trading schemes? Yes
CC13.1a
Please complete the following table for each of the emission trading schemes in which you participate
Scheme name
Period for which data is supplied
Allowances allocated
Allowances purchased
Verified emissions in metric tonnes
CO2e
Details of ownership
European Union ETS
Thu 01 Jan 2015 - Thu 31 Dec 2015
130229 26828 144786 Facilities we own and operate

CC13.1b
What is your strategy for complying with the schemes in which you participate or anticipate participating? Novartis is in full compliance with EU-ETS requirements. It is our strategy to minimize emissions from these sites in order to remain within the amount of allowances being allocated. The strategy includes coordination between the six sites being involved with regular contacts and information exchange. A corporate trading strategy was developed, which determines conditions for internal trading. As long as total shortage is below certain limits, sites are free to sell or buy allowances if needed. Experiences in Phase I and II have shown that sites were able to reduce their emissions considerably more than expected, when we regularly achieved a surplus. The allowances for Phase III are now 33% lower compared to Phase II and further decrease year on year since 2013. This is a growing motivator to continue our strong GHG emission reduction program. In addition, Novartis's strategy is to voluntarily offset part of its global total Scope 1 and Scope 2 GHG emissions with own originated forestry carbon-sink projects. The sinks generated by these projects are annually monitored and accounted to compensate part of Novartis global total GHG emissions. Credits received under the CDM or VCS schemes (so far 100,000 tons in 2013) were voluntarily retired after issuance as a consequence. Additional credits generated as of 2017 or later will also be retired in the same way after being accounted against company emission.
CC13.2
Has your organization originated any project-based carbon credits or purchased any within the reporting period? No
CC13.2a
Please provide details on the project-based carbon credits originated or purchased by your organization in the reporting period

Credit origination
or credit purchase
Project type
Project identification
Verified to which standard
Number of credits (metric
tonnes of CO2e)
Number of credits (metric tonnes
CO2e): Risk adjusted volume
Credits cancelled
Purpose, e.g. compliance
Further Information
Page: CC14. Scope 3 Emissions
CC14.1
Please account for your organization’s Scope 3 emissions, disclosing and explaining any exclusions
Sources of Scope 3
emissions
Evaluation status
metric tonnes CO2e
Emissions calculation methodology
Percentage of
emissions calculated using data obtained
from suppliers or value chain
partners
Explanation
Purchased goods and services
Relevant, calculated 3780000
The amount of Scope3 GHG emissions for purchased goods and services reported here is the result of a study on 2015 data of direct material procurement. The tool uses average emission intensities by industry sector and incorporates regional trade flows and interrelationships to calculate emissions from purchased goods spend data. The amount reported includes at least six tiers of suppliers in
0.00%
This study based on an input/output assessment was undertaken in spring 2016 using 2015 purchasing data and was conducted to provide equally accurate data and scope as the study undertaken in 2015 on the previous year. It will allow us to determine a trend over several years.

Sources of Scope 3
emissions
Evaluation status
metric tonnes CO2e
Emissions calculation methodology
Percentage of
emissions calculated using data obtained
from suppliers or value chain
partners
Explanation
the materials value chain.
Capital goods Relevant, calculated 180000
This data is estimated on the basis of the gross floor area of administration and manufacturing buildings operated by Novartis (accurate primary data) and assumptions for GHG emission factors associated with these buildings and their contents.
0.00% This study was undertaken in 2010 and has not been repeated.
Fuel-and-energy-related activities (not included in Scope 1 or 2)
Not relevant, explanation provided
There are no other fuel and energy related activities apart from potentially the transportation of fuel. However, such GHG emissions are not considered material for Novartis operations. Energy related GHG emissions of tier 2 to tier n suppliers are included in the category "purchased goods and services" above.
Upstream transportation and distribution
Not relevant, explanation provided
Considering the Scope 3 emissions from downstream (product distribution) transportation, it is assumed that the emissions emerging from upstream transportation from direct suppliers are of similar magnitude and therefore not relevant. GHG emissions emerging from transportation from tier 2 to tier n suppliers are included in the category "purchased goods and services" above.
Waste generated in operations
Not relevant, calculated 53000
This is a calculation based on the various types and amounts of waste (accurate primary data) and respective assumptions for GHG emission factors from each of these waste types determined from their composition and climate-
100.00%
A procedure was established to calculate GHG emissions from reported waste data, based on emission factors determined for each waste category and disposal path and property and composition of each waste type.

Sources of Scope 3
emissions
Evaluation status
metric tonnes CO2e
Emissions calculation methodology
Percentage of
emissions calculated using data obtained
from suppliers or value chain
partners
Explanation
related properties.
Business travel Relevant, calculated 231000
Data obtained from Hogg Robinson Group (HRG), the travel agency responsible for booking over 95% of Novartis business travel for 2015 worldwide. Data was calculated from miles travelled in different flight distances (intercontinental, international, domestic) and booking classes for each individual country, added to a total. It covers all flight travel for Novartis employees plus service providers on their trips for Novartis. Calculations are based on emissions factors determined by DEFRA.
100.00%
This data is provided quarterly by Hogg Robinson Group. This Scope 3 aspect and related performance number is included in the environmental performance summary table in the Novartis CR Report page 7, which is part of the assurance scope.
Employee commuting
Relevant, calculated 144000
Novartis calculated this data on the basis of the regional distribution of employees (accurate primary data) and respective assumptions for GHG emission factors for private and public transport in each major geographic region.
0.00% This study was undertaken in 2010 and has not been repeated.
Upstream leased assets
Not relevant, explanation provided
Novartis does not maintain many upstream leased assets and any GHG emissions associated with such assets would not be considered material.
Downstream transportation and distribution
Not relevant, calculated 57000
This calculation is based on the following assumptions derived from regional production types and volumes (accurate primary data): 1) All products are transported over 500 km by train or 40 t lorry (50% each) 2) All products are transported by small lorries on the last 25 km 3) Products delivered to internal and external destinations are treated equally 4)10% of all products are transported by ship for 5000 km 5)
0.00% Compared to the total Scope 1, 2 & 3 emissions from Novartis, these emissions are not considered relevant.

Sources of Scope 3
emissions
Evaluation status
metric tonnes CO2e
Emissions calculation methodology
Percentage of
emissions calculated using data obtained
from suppliers or value chain
partners
Explanation
3% of all products are transported by airplane for 5000 km.
Processing of sold products
Not relevant, explanation provided
Only very few Novartis goods are processed further after they are sold. Related emissions are thus considered not relevant.
Use of sold products
Relevant, calculated 124000
The use of Novartis products does not generally result in GHG emissions, with the exception of an inhaler product that uses HFC R134a as a propellant. All quantities of HFC R134a used in the production of the inhaler product are measured. GHG emissions are calculated using the IPCC emissions factor for HFC 134a.
100.00%
The use of Novartis products does not generally result in GHG emissions, with the exception of an inhaler product that uses HFC R134a as a propellant.
End of life treatment of sold products
Not relevant, explanation provided
Novartis pharmaceutical products (tablets, injectables, etc.) are consumed by patients and no GHG emissions associated with the end of life of sold Novartis products occur by that. Novartis has only few medical device products (e.g. inhalers, surgery tools and contact lenses). Therefore we can assume that GHG emissions of these products are not relevant.
Downstream leased assets
Not relevant, explanation provided
Any GHG emissions associated with downstream leased assets are not considered relevant.
Franchises Not relevant, explanation provided
Any GHG emissions associated with franchises are not considered relevant.
Investments Not relevant, explanation
Any GHG emissions associated with investments are not considered relevant.
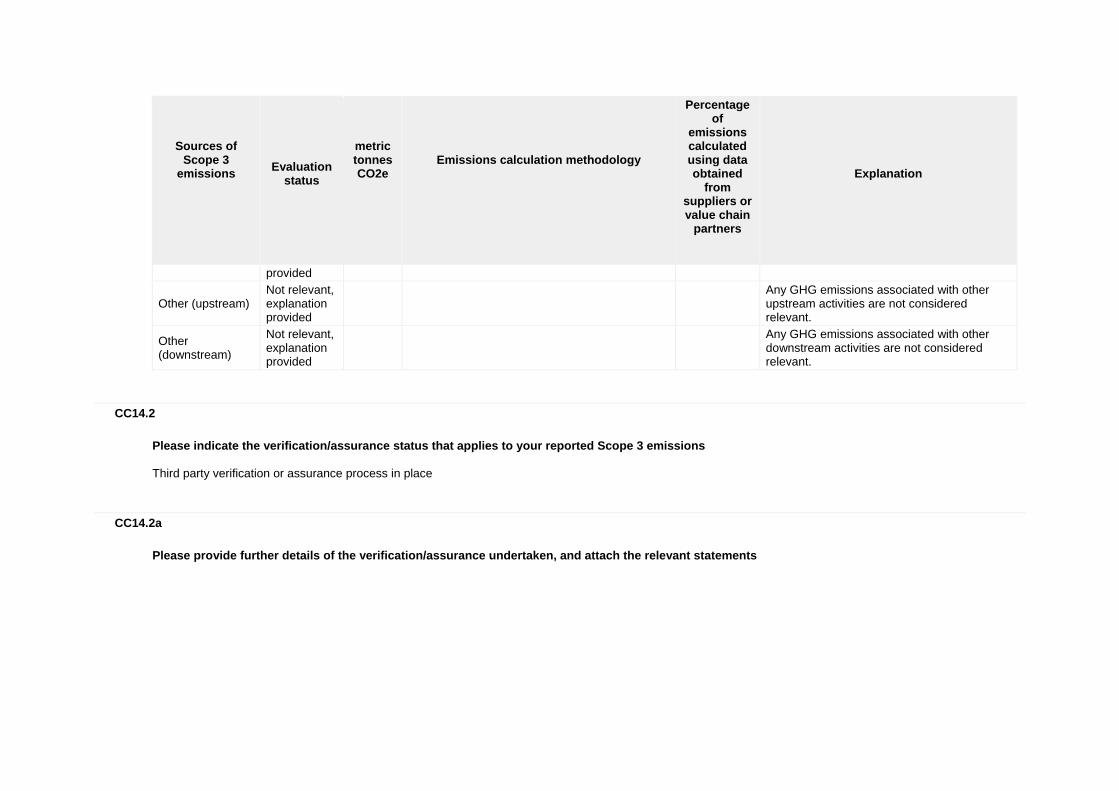
Sources of Scope 3
emissions
Evaluation status
metric tonnes CO2e
Emissions calculation methodology
Percentage of
emissions calculated using data obtained
from suppliers or value chain
partners
Explanation
provided
Other (upstream) Not relevant, explanation provided
Any GHG emissions associated with other upstream activities are not considered relevant.
Other (downstream)
Not relevant, explanation provided
Any GHG emissions associated with other downstream activities are not considered relevant.
CC14.2
Please indicate the verification/assurance status that applies to your reported Scope 3 emissions Third party verification or assurance process in place
CC14.2a
Please provide further details of the verification/assurance undertaken, and attach the relevant statements

Verification
or assurance
cycle in place
Status in
the current
reporting year
Type of verification
or assurance
Attach the statement
Page/Section reference
Relevant standard
Proportion of
reported Scope 3 emissions verified (%)
Annual process
First year it has taken place
Limited assurance
https://www.cdp.net/sites/2016/24/13524/Climate Change 2016/Shared Documents/Attachments/CC14.2a/novartis-cr-performance-report-2015.pdf
Novartis CR Performance Report 2015 pp. 90-91: Scope 3 GHG emissions from business travel is included in the verification scope (p.7)
ISAE3000 5
CC14.3
Are you able to compare your Scope 3 emissions for the reporting year with those for the previous year for any sources? Yes
CC14.3a
Please identify the reasons for any change in your Scope 3 emissions and for each of them specify how your emissions compare to the previous year
Sources of Scope 3
emissions
Reason for
change
Emissions value
(percentage)
Direction of change
Comment
Purchased Change in 17.7 No change Scope 3 GHG emissions from purchased goods increased from 3211 kilotons in 2014 to 3780

Sources of Scope 3
emissions
Reason for
change
Emissions value
(percentage)
Direction of change
Comment
goods & services
output kilotons in 2015 due to an equal increase of spent volume for direct materials. A slight change of methodology applied in 2016. Also, a change of boundary, due to divestments in 2015, was corrected with a recalculation of the 2015 data with new scope (Novartis ongoing businesses) and methodology.
Waste generated in operations
Emissions reduction activities
28 Decrease
Scope 3 GHG emissions from waste disposal decreased from 74 kilotons in 2014 to 53 kilotons in 2015. The decrease is achieved with waste reduction and increased recycling efforts at Novartis manufacturing locations. Waste reduction is one of the key environmental targets for Novartis.
Business travel
Change in output 24 Increase
Scope 3 GHG emissions from business travel increased from 186 kilotons in 2014 to 231 kilotons in 2015. The slight increase is predominately due to increased travel intensity due to restrictions implemented the previous year.
Use of sold products
Change in output 25 Increase
Scope 3 GHG emissions from product usage increased from 99 kilotons in 2014 to124 kilotons in 2015. The increase is predominately due to growing production volumes of the inhaler product that uses HFC R134a as propellant.
CC14.4
Do you engage with any of the elements of your value chain on GHG emissions and climate change strategies? (Tick all that apply) Yes, our suppliers Yes, our customers
CC14.4a
Please give details of methods of engagement, your strategy for prioritizing engagement and measures of success Engagement with suppliers: As part of our Responsible Procurement program we systematically engage with our suppliers on corporate responsibility issues, including, human and labor rights, health, safety and environmental aspects.

- Method of engagement: Engagement with suppliers include HSE audits and respective corrective action plans. Additional direct engagement with suppliers has initially started with packaging suppliers for plastic (blister film) and for fibre materials (cardboard and paper). More recently it was expanded to suppliers of active pharmaceutical ingredients (API). - Strategy for prioritizing engagements: With a risk based approach of our PR approach, suppliers located in China and India are one of our focal areas. In 2015 we conducted a lifecycle assessment (LCA) on the Glivec API. Novartis also undertook a number of LCA studies since 2012 to compare the environmental impacts of various blister packaging options. - Results of engagements: Each Responsible Procurement Audit lead to a list of Corrective Action measures, to be conducted by the audited supplier company according to a give schedule. Visits to supplier companies and LCAs result in better understanding and awareness on HSE and environmental topic, our expectations and improvements and next steps of actions as specifically agreed. - Engagement Example: One of the options in the study included a high moisture barrier film produced by Honeywell called Aclar ®. Follow-up of these studies were conducted in 2014 and 2015. Studies undertaken by Honeywell provided Novartis with accurate data for the LCA and also highlighted additional opportunities for carbon footprint reductions in the production of Aclar ®. As a company committed to efficient and sustainable production processes, Honeywell made a significant investment in thermal oxidation equipment in 2014/2015 at its production facility, to further reduce greenhouse gas emissions from these processes. The carbon footprint of the blister film, which is now being used by Novartis, has effectively been halved as a result. Furthermore, Novartis started to engage directly with selected API suppliers in China and India. The two main aspects evaluated with them is the risk related to water effluents and the carbon intensity of these suppliers' on-site processes and energy supply. Switching from coal to natural gas was one of the topics discussed with them. Engagement with customers: Engagement with customers includes aspects of the carbon footprint of pharmaceutical products and specific input to LCA studies conducted by these customers. In 2015, Novartis directly engaged e.g. with the National Health Services (NHS) of England on the carbon footprint of prescription drugs.
CC14.4b
To give a sense of scale of this engagement, please give the number of suppliers with whom you are engaging and the proportion of your total spend that they represent
Number of suppliers
% of total spend (direct and
indirect)
Comment
5 0.5% Novartis started to engage with packaging suppliers in 2012 and will continue to increase our activities here in the future. A new sustainable procurement program, which partly aims to reduce GHG emissions in the supply chain, was launched in April 2013 and is expected to initiate further supplier engagement.
CC14.4c

If you have data on your suppliers’ GHG emissions and climate change strategies, please explain how you make use of that data
How you make use of the data
Please give details
Identifying GHG sources to prioritize for reduction actions
Starting from the results of the Input/Output assessment supplier groups or individual suppliers are prioritized based on types of material purchased and country of manufacture, intensity of GHG emission and spend volume.
Managing physical risks in the supply chain
As part of our Responsible Procurement program we conduct CSR and HSE audits at a large number of suppliers. The suppliers selected for the program are chosen based on a risk profile (considering, sector, country, strategy for relationship, spend volume and results of questionnaires and/or of previous audits and status of corrective action implementation.
CC14.4d
Please explain why you do not engage with any elements of your value chain on GHG emissions and climate change strategies, and any plans you have to develop an engagement strategy in the future
Further Information
Module: Sign Off
Page: CC15. Sign Off
CC15.1
Please provide the following information for the person that has signed off (approved) your CDP climate change response
Name
Job title
Corresponding job category
Jürgen Brokatzky-Geiger
Novartis global head Corporate Responsibility
Other: Global head Corporate Responsibility, reporting to the CEO

Further Information
CDP