Embed Size (px)
Citation preview

November 7, 2018
Novartis 2016 and 2015 Financials Updated Segment Reporting
Novartis AG

Summary – Updated 2015, 2016 and 2017 Segment Financial Reporting
2 | Updated Segment Reporting | November 2018
In April 2018, following announcements of decisions to move the ophthalmic over the counter (OTC) products1, together with a small portfolio of surgical diagnostics products2, from the Innovative Medicines Division to the Alcon Division, Novartis issued updated segment financial reporting for FY 2017, as if the transfer had taken place from January 1, 2017
Now to further enable the comparability of financial results, we issue updated segment financial reporting for FY 2015 and 2016, as if the transfer had taken place from January 1, 2015 2015 net sales of the ophthalmic OTC products and the surgical diagnostics products were USD 774 million
2016 net sales of the ophthalmic OTC products and the surgical diagnostics products were USD 731 million
2017 net sales of the ophthalmic OTC products and the surgical diagnostics products were USD 747 million
The updated operating income for Alcon reflects all costs attributable to the transferred businesses Allocation of attributable overhead costs is based on the direct activities that they support (e.g. manufacturing non-production costs
and general and administrative overhead)
The updated segment financial reporting is provided in accordance with the requirements of IFRS, and to aid comparability of results which are reported using the new division structure from Q1 2018
The transfer does not result in changes to the 2015, 2016 or 2017 total Group Audited Consolidated Financial Statements
1. Announced on October 24, 2017 in the Q3 2017 results media release2. Announced on January 24, 2018 in the Q4 2017 results media release

Restated consolidated income statements ‐ Segmentation ‐ FY 2016
Innovative Medicines
USDm
SandozUSDm
AlconUSDm
Corporate(including
eliminations)USDm
GroupUSDm
(audited)
Net sales to third parties 31 831 10 144 6 543 48 518 Sales to other segments 624 104 - 728 Net sales 32 455 10 248 6 543 - 728 48 518 Other revenues 815 37 4 62 918 Cost of Goods Sold -8 976 -5 971 -3 447 874 -17 520 Gross profit 24 294 4 314 3 100 208 31 916 Selling, General & Administration -9 225 -1 981 -2 480 - 506 -14 192 Research & Development -7 696 - 814 - 529 -9 039 Other income 1 091 185 48 603 1 927 Other expense -1 209 - 259 - 100 - 776 -2 344 Operating income 7 255 1 445 39 - 471 8 268 Income from associated companies 6 697 703 Interest expenses - 707 Other financial income and expense - 447 Income before tax 7 817 Taxes -1 119 Net income 6 698
Group 2016 – Updated Segment Consolidated Income Statement Reporting – No change in Group total results
| Updated Segment Reporting | November 20183
Note: In accordance with IFRS, Novartis is required to update its segment income statements to reflect the previously announced move of the ophthalmic OTC and surgical diagnostics products from the Innovative Medicines Division to the Alcon Division, as if transfer had taken place from January 1, 2016:1. Innovative Medicines results exclude the transfer of USD 731 million sales and USD 171 million operating income to Alcon2. No change to the reported results as published in the Novartis Group Annual Report 20173. Alcon results include the transfer of USD 731 million sales and USD 171 million operating income from Innovative Medicines
1 32 2 2

Restated consolidated income statements ‐ Segmentation ‐ FY 2015
Innovative Medicines
USDm
SandozUSDm
AlconUSDm
Corporate(including
eliminations)USDm
GroupUSDm
(audited)
Net sales to third parties 32 571 10 070 6 773 49 414 Sales to other segments 518 128 - 620 26 Net sales 33 089 10 198 6 773 - 620 49 440 Other revenues 792 25 23 107 947 Cost of Goods Sold -8 832 -5 844 -3 517 789 -17 404 Gross profit 25 049 4 379 3 279 276 32 983 Selling, General & Administration -9 270 -2 025 -2 304 - 648 -14 247 Research & Development -7 670 - 782 - 483 -8 935 Other income 1 148 109 55 737 2 049 Other expense -1 634 - 381 - 74 - 784 -2 873 Operating income 7 623 1 300 473 - 419 8 977 Income from associated companies 2 264 266 Interest expenses - 655 Other financial income and expense - 454 Income before tax 8 134 Taxes -1 106 Net income from continuing operations 7 028 Net income from discontinued operations 10 766 Net income 17 794
Group 2015 – Updated Segment Consolidated Income Statement Reporting – No change in Group total results
| Updated Segment Reporting | November 20184
Note: In accordance with IFRS, Novartis is required to update its segment income statements to reflect the previously announced move of the ophthalmic OTC and surgical diagnostics products from the Innovative Medicines Division to the Alcon Division, as if transfer had taken place from January 1, 2015:1. Innovative Medicines results exclude the transfer of USD 774 million sales and USD 192 million operating income to Alcon2. No change to the reported results as published in the Novartis Group Annual Report 20173. Alcon results include the transfer of USD 774 million sales and USD 192 million operating income from Innovative Medicines
1 32 2 2

Alcon 2016 and 2015 – Updated Segment Income Statement Reporting
5
1. Sales increased by USD 731 million in 2016 and USD 774 million in 2015 related to the ophthalmic OTC and surgical diagnostics products, moved from Innovative Medicines to Alcon. The products moved include the Systane®, Tears Naturale® and ICAPS® brands
2. COGS increased by USD 355 million in 2016 and USD 372 million in 2015 related to the ophthalmic OTC and surgical diagnostics products
3. SG&A increased by USD 188 million (25.7% of sales) in 2016 and USD 191 million (24.7% of sales) in 2015 related to the ophthalmic OTC and surgical diagnostics products
4. R&D increased by USD 13 million (1.8% of sales) in 2016 and USD 15 million (1.9% of sales) in 2015 related to the ophthalmic OTC and surgical diagnostics products
5. Other expenses increased by USD 4 million in 2016 and by USD 5 million in 2015 related to the ophthalmic OTC and surgical diagnostics products
6. The move of ophthalmic OTC and surgical diagnostics products increased Alcon’s reported operating margin by +2.9%pts in 2016 and +2.3%pts in 2015 and core operating margin by +3.0%pts in 2016 and +2.4%pts in 2015
7. Core adjustments increased by 129 million in 2016 and by USD 128 million in 2015 related to the ophthalmic OTC and surgical diagnostics products intangible asset amortization expense recorded in COGS
2
3
1
4
5
6
| Updated Segment Reporting | November 2018
7
6
Note: In accordance with IFRS, Novartis is required to update its segment income statements to reflect the previously announced move of the ophthalmic OTC and surgical diagnostics products from the Innovative Medicines Division to the Alcon Division, as if transfer had taken place from January 1, 2015.Core results are non-IFRS measures. An explanation of these measures can be found on page 179 of the 2017 Novartis Annual Report
Restated reported and core operating income ‐ Alcon
Q1 2016USDm
Q2 2016USD
HY 2016USDm
Q3 2016USDm
9M 2016USDm
Q4 2016USDm
FY 2016USDm
FY 2015USDm
Net sales to third parties 1 604 1 689 3 293 1 623 4 916 1 627 6 543 6 773 Sales to other segments Net sales 1 604 1 689 3 293 1 623 4 916 1 627 6 543 6 773 Other revenues 4 4 4 4 23 Cost of Goods Sold - 851 - 873 -1 724 - 855 -2 579 - 868 -3 447 -3 517 Gross profit 757 816 1 573 768 2 341 759 3 100 3 279 Selling, General & Administration - 578 - 622 -1 200 - 631 -1 831 - 649 -2 480 -2 304 Research & Development - 118 - 143 - 261 - 134 - 395 - 134 - 529 - 483 Other income 18 9 27 19 46 2 48 55 Other expense - 8 - 10 - 18 - 28 - 46 - 54 - 100 - 74 Operating income 71 50 121 - 6 115 - 76 39 473 as % of net sales 4.4% 3.0% 3.7% -0.4% 2.3% -4.7% 0.6% 7.0%
Core adjustmentsCost of Goods Sold 240 249 489 254 743 256 999 1’011 Selling, General & Administration 32 Research & Development 3 8 11 17 28 3 31 13 Other income -1 -1 -1 -2 -2 -4 -9 Other expense 2 5 7 19 26 59 85 35 Core Operating income 315 312 627 283 910 240 1’150 1’555 as % of net sales 19.6% 18.5% 19.0% 17.4% 18.5% 14.8% 17.6% 23.0%

Note: In accordance with IFRS, Novartis is required to update its segment income statements to reflect the previously announced move of the ophthalmic OTC and surgical diagnostics products from the Innovative Medicines Division to the Alcon Division, as if transfer had taken place from January 1, 2015.Core results are non-IFRS measures. An explanation of these measures can be found on page 179 of the 2017 Novartis Annual Report
Innovative Medicines 2016 and 2015 – Updated Segment Income Statement Reporting
6
1. Sales decreased by USD 731 million in 2016 and USD 774 million in 2015 related to the ophthalmic OTC and surgical diagnostics products, moved from Innovative Medicines to Alcon. The products moved include the Systane®, Tears Naturale® and ICAPS® brands
2. COGS decreased by 355 million in 2016 and USD 372 million in 2015 related to the ophthalmic OTC and surgical diagnostics products
3. SG&A decreased by USD 188 million (25.7% of sales) in 2016 and USD 191 million (24.7% of sales) in 2015 related to the ophthalmic OTC and surgical diagnostics products
4. R&D decreased by USD 13 million (1.8% of sales) in 2016 and USD 15 million (1.9% of sales) in 2015 related to the ophthalmic OTC and surgical diagnostics products
5. Other expenses decreased by USD 4 million in 2016 and by USD 5 million in 2015 related to the ophthalmic OTC and surgical diagnostics products
6. The transfer of the ophthalmic OTC and surgical diagnostics products had a negligible impact on Innovative Medicines Division’s reported operating margin in 2016 and 2015 and slightly decreased the core operating margin by -0.2%pts in 2016 and in 2015
7. Core adjustments decreased by USD 129 million in 2016 and USD 128 million on 2015 related to the ophthalmic OTC and surgical diagnostics products intangible asset amortization expense recorded in COGS
6
2
3
1
4
5
| Updated Segment Reporting | November 2018
7
6
Restated reported and core operating income ‐ Innovative Medicines
Q1 2016USDm
Q2 2016USDm
HY 2016USDm
Q3 2016USDm
9M 2016USDm
Q4 2016USDm
FY 2016USDm
FY 2015USDm
Net sales to third parties 7 551 8 204 15 755 7 986 23 741 8 090 31 831 32 571 Sales to other segments 164 142 306 158 464 160 624 518 Net sales 7 715 8 346 16 061 8 144 24 205 8 250 32 455 33 089 Other revenues 177 189 366 193 559 256 815 792 Cost of Goods Sold -2 152 -2 286 -4 438 -2 189 -6 627 -2 349 -8 976 -8 832 Gross profit 5 740 6 249 11 989 6 148 18 137 6 157 24 294 25 049 Selling, General & Administration -2 116 -2 376 -4 492 -2 246 -6 738 -2 487 -9 225 -9 270 Research & Development -1 728 -1 841 -3 569 -1 886 -5 455 -2 241 -7 696 -7 670 Other income 541 65 606 264 870 221 1 091 1 148 Other expense - 297 - 274 - 571 - 304 - 875 - 334 -1 209 -1 634 Operating income 2 140 1 823 3 963 1 976 5 939 1 316 7 255 7 623 as % of net sales 28.3% 22.2% 25.2% 24.7% 25.0% 16.3% 22.8% 23.4%
Core adjustmentsOther revenues -50 -50 -28 Cost of Goods Sold 585 596 1’181 573 1’754 612 2’366 2’428 Selling, General & Administration 7 7 43 Research & Development 27 42 69 119 188 408 596 183 Other income -447 -31 -478 -242 -720 -107 -827 -825 Other expense 225 165 390 173 563 144 707 1’118 Core Operating income 2’530 2’595 5’125 2’599 7’724 2’330 10’054 10’542 as % of net sales 33.5% 31.6% 32.5% 32.5% 32.5% 28.8% 31.6% 32.4%
Appendix
2016 and 2015 Segment Financials as previously reported
Novartis 2017 Financials Updated Segment Reporting(As published April 3, 2018)

Group 2016 – Segment Consolidated Income Statement Reporting – As previously reported in 2016 Annual Report
8 | Updated Segment Reporting | November 2018
Reported consolidated income statements ‐ Segmentation ‐ FY 2016
(audited)
Innovative Medicines
USDm
SandozUSDm
AlconUSDm
Corporate(including
eliminations)USDm
GroupUSDm
Net sales to third parties 32 562 10 144 5 812 48 518 Sales to other segments 624 104 - 728 Net sales 33 186 10 248 5 812 - 728 48 518 Other revenues 815 37 4 62 918 Cost of Goods Sold -9 331 -5 971 -3 092 874 -17 520 Gross profit 24 670 4 314 2 724 208 31 916 Selling, General & Administration -9 413 -1 981 -2 292 - 506 -14 192 Research & Development -7 709 - 814 - 516 -9 039 Other income 1 091 185 48 603 1 927 Other expense -1 213 - 259 - 96 - 776 -2 344 Operating income 7 426 1 445 - 132 - 471 8 268 Income from associated companies 6 697 703 Interest expenses - 707 Other financial income and expense - 447 Income before tax 7 817 Taxes -1 119 Net income 6 698

Group 2015 – Segment Consolidated Income Statement Reporting – As previously reported in 2016 Annual Report
9 | Updated Segment Reporting | November 2018
Reported consolidated income statements ‐ Segmentation ‐ FY 2015
(audited)
Innovative Medicines
USDm
SandozUSDm
AlconUSDm
Corporate(including
eliminations)USDm
GroupUSDm
Net sales to third parties 33 345 10 070 5 999 49 414 Sales to other segments 518 128 - 620 26 Net sales 33 863 10 198 5 999 - 620 49 440 Other revenues 792 25 23 107 947 Cost of Goods Sold -9 204 -5 844 -3 145 789 -17 404 Gross profit 25 451 4 379 2 877 276 32 983 Selling, General & Administration -9 461 -2 025 -2 113 - 648 -14 247 Research & Development -7 685 - 782 - 468 -8 935 Other income 1 149 109 54 737 2 049 Other expense -1 639 - 381 - 69 - 784 -2 873 Operating income 7 815 1 300 281 - 419 8 977 Income from associated companies 2 264 266 Interest expenses - 655 Other financial income and expense - 454 Income before tax 8 134 Taxes -1 106 Net income from continuing operations 7 028 Net income from discontinued operations 10 766 Net income 17 794

Alcon 2016 and 2015 – Segment Income Statement ReportingAs previously reported in 2016 Annual Report and 2016 quarterly earnings reports
10
1. Core results are non-IFRS measures and are unaudited. An explanation of these measures can be found on page 171 of the 2016 Novartis Annual Report
1
| Updated Segment Reporting | November 2018
Reported and core operating income ‐ Alcon
Q1 2016USDm
Q2 2016USD
HY 2016USDm
Q3 2016USDm
9M 2016USDm
Q4 2016USDm
FY 2016USDm
FY 2015USDm
Net sales to third parties 1 426 1 506 2 932 1 436 4 368 1 444 5 812 5 999 Sales to other segments Net sales 1 426 1 506 2 932 1 436 4 368 1 444 5 812 5 999 Other revenues 4 4 4 4 23 Cost of Goods Sold - 763 - 783 -1 546 - 764 -2 310 - 782 -3 092 -3 145 Gross profit 667 723 1 390 672 2 062 662 2 724 2 877 Selling, General & Administration - 532 - 576 -1 108 - 584 -1 692 - 600 -2 292 -2 113 Research & Development - 114 - 140 - 254 - 131 - 385 - 131 - 516 - 468 Other income 18 9 27 19 46 2 48 54 Other expense - 8 - 9 - 17 - 26 - 43 - 53 - 96 - 69 Operating income 31 7 38 - 50 - 12 - 120 - 132 281 as % of net sales 2.2% 0.5% 1.3% -3.5% -0.3% -8.3% -2.3% 4.7%
Core adjustmentsCost of Goods Sold 209 219 428 221 649 227 876 887 Selling, General & Administration 32 Research & Development 3 7 10 18 28 2 30 13 Other income -1 -1 -1 -2 -2 -4 -9 Other expense 1 5 6 18 24 56 80 31 Core Operating income 243 238 481 206 687 163 850 1’235 as % of net sales 17.0% 15.8% 16.4% 14.3% 15.7% 11.3% 14.6% 20.6%

Innovative Medicines 2016 and 2015 – Segment Income Statement Reporting – As previously reported in 2016 Annual Report and 2016 quarterly earnings reports
11
1. Core results are non-IFRS measures and are unaudited. An explanation of these measures can be found on page 171 of the 2016 Novartis Annual Report
1
| Updated Segment Reporting | November 2018
Reported and core operating income ‐ Innovative Medicines
Q1 2016USDm
Q2 2016USDm
HY 2016USDm
Q3 2016USDm
9M 2016USDm
Q4 2016USDm
FY 2016USDm
FY 2015USDm
Net sales to third parties 7 729 8 387 16 116 8 173 24 289 8 273 32 562 33 345 Sales to other segments 164 142 306 158 464 160 624 518 Net sales 7 893 8 529 16 422 8 331 24 753 8 433 33 186 33 863 Other revenues 177 189 366 193 559 256 815 792 Cost of Goods Sold -2 240 -2 376 -4 616 -2 280 -6 896 -2 435 -9 331 -9 204 Gross profit 5 830 6 342 12 172 6 244 18 416 6 254 24 670 25 451 Selling, General & Administration -2 162 -2 422 -4 584 -2 293 -6 877 -2 536 -9 413 -9 461 Research & Development -1 732 -1 844 -3 576 -1 889 -5 465 -2 244 -7 709 -7 685 Other income 541 65 606 264 870 221 1 091 1 149 Other expense - 297 - 275 - 572 - 306 - 878 - 335 -1 213 -1 639 Operating income 2 180 1 866 4 046 2 020 6 066 1 360 7 426 7 815 as % of net sales 28.2% 22.2% 25.1% 24.7% 25.0% 16.4% 22.8% 23.4%
Core adjustmentsOther revenues -50 -50 -28 Cost of Goods Sold 616 626 1’242 606 1’848 641 2’489 2’552 Selling, General & Administration 7 7 43 Research & Development 27 43 70 118 188 409 597 183 Other income -447 -31 -478 -242 -720 -107 -827 -825 Other expense 226 165 391 174 565 147 712 1’122 Core Operating income 2’602 2’669 5’271 2’676 7’947 2’407 10’354 10’862 as % of net sales 33.7% 31.8% 32.7% 32.7% 32.7% 29.1% 31.8% 32.6%

Appendix
2016 and 2015 Segment Financials as previously reported
Novartis 2017 Financials Updated Segment Reporting(As published April 3, 2018)

Novartis 2017 FinancialsUpdated Segment ReportingApril 3, 2018
Novartis AG
As published April 3, 2018
Disclaimer
| Updated Segment Reporting | April 201814
This presentation contains forward-looking statements that can be identified by terminology such as such as “potential,” “expected,” “will,” “planned,” “pipeline,” “outlook,” or similar expressions, orby express or implied discussions regarding potential new products, potential new indications for existing products, or regarding potential future revenues from any such products; or regarding thepotential outcome of the strategic review being undertaken to maximize shareholder value of the Alcon Division; or regarding the potential financial or other impact of the significant acquisitions andreorganizations of recent years; or regarding the potential impact of the share buyback plan; or regarding potential future sales or earnings of the Novartis Group or any of its divisions or potentialshareholder returns; or by discussions of strategy, plans, expectations or intentions. You should not place undue reliance on these statements. Such forward looking statements are based on ourcurrent beliefs and expectations regarding future events, and are subject to significant known and unknown risks and uncertainties. Should one or more of these risks or uncertainties materialize, orshould underlying assumptions prove incorrect, actual results may vary materially from those set forth in the forward looking statements. There can be no guarantee that any new products will beapproved for sale in any market, or that any new indications will be approved for any existing products in any market, or that any approvals which are obtained will be obtained at any particulartime, or that any such products will achieve any particular revenue levels. Nor can there be any guarantee that the strategic review being undertaken to maximize shareholder value of the AlconDivision will reach any particular results, or at any particular time, or that the result of the strategic review will in fact maximize shareholder value. Neither can there be any guarantee that Novartiswill be able to realize any of the potential strategic benefits, synergies or opportunities as a result of the significant acquisitions and reorganizations of recent years. Neither can there be anyguarantee that shareholders will achieve any particular level of shareholder returns. Nor can there be any guarantee that the Group, or any of its divisions, will be commercially successful in thefuture, or achieve any particular credit rating or financial results. In particular, our expectations could be affected by, among other things: global trends toward health care cost containment,including government, payor and general public pricing and reimbursement pressures and requirements for increased pricing transparency; regulatory actions or delays or government regulationgenerally; the potential that the strategic benefits, synergies or opportunities expected from the significant acquisitions and reorganizations of recent years may not be realized or may take longer torealize than expected; the inherent uncertainties involved in predicting shareholder returns; the uncertainties inherent in the research and development of new healthcare products, including clinicaltrial results and additional analysis of existing clinical data; our ability to obtain or maintain proprietary intellectual property protection, including the ultimate extent of the impact on Novartis of theloss of patent protection and exclusivity on key products which commenced in prior years and will continue this year; safety, quality or manufacturing issues; uncertainties regarding actual orpotential legal proceedings, including, among others, actual or potential product liability litigation, litigation and investigations regarding sales and marketing practices, intellectual property disputesand government investigations generally; uncertainties involved in the development or adoption of potentially transformational technologies and business models; general political and economicconditions, including uncertainties regarding the effects of ongoing instability in various parts of the world; uncertainties regarding future global exchange rates; uncertainties regarding futuredemand for our products; and uncertainties regarding potential significant breaches of data security or data privacy, or disruptions of our information technology systems; and other risks and factorsreferred to in Novartis AG’s current Form 20-F on file with the US Securities and Exchange Commission. Novartis is providing the information in this presentation as of this date and does notundertake any obligation to update any forward-looking statements as a result of new information, future events or otherwise.
As published April 3, 2018

Summary – Updated 2017 Segment Financial Reporting
| Updated Segment Reporting | April 201815
The following updated segment financial reporting for FY 2017 reflects the previously announced decisions to move the ophthalmic over the counter (OTC) products1, together with a small portfolio of surgical diagnostics products2, from the Innovative Medicines Division to the Alcon Division, as if the transfer had taken place from January 1, 2017 2017 net sales of the ophthalmic OTC products and the surgical diagnostics products were USD 747 million
The updated segment financial reporting is provided in accordance with the requirements of IFRS, and to aid comparability of 2018 quarterly results which will be reported using the new division structure from Q1 2018
The updated operating income for Alcon reflects all costs attributable to the transferred businesses Allocation of attributable overhead costs is based on the direct activities that they support (e.g. manufacturing non-production costs
and general and administrative overhead)
The transfer does not result in a change to the 2017 total Group Audited Consolidated Financial Statements The 2018 full year Division guidance, communicated on January 24 2018, was provided in line with the new
segment structure
1. Announced on October 24, 2017 in the Q3 results media release2. Announced on January 24, 2018 in the Q4 results media release
As published April 3, 2018
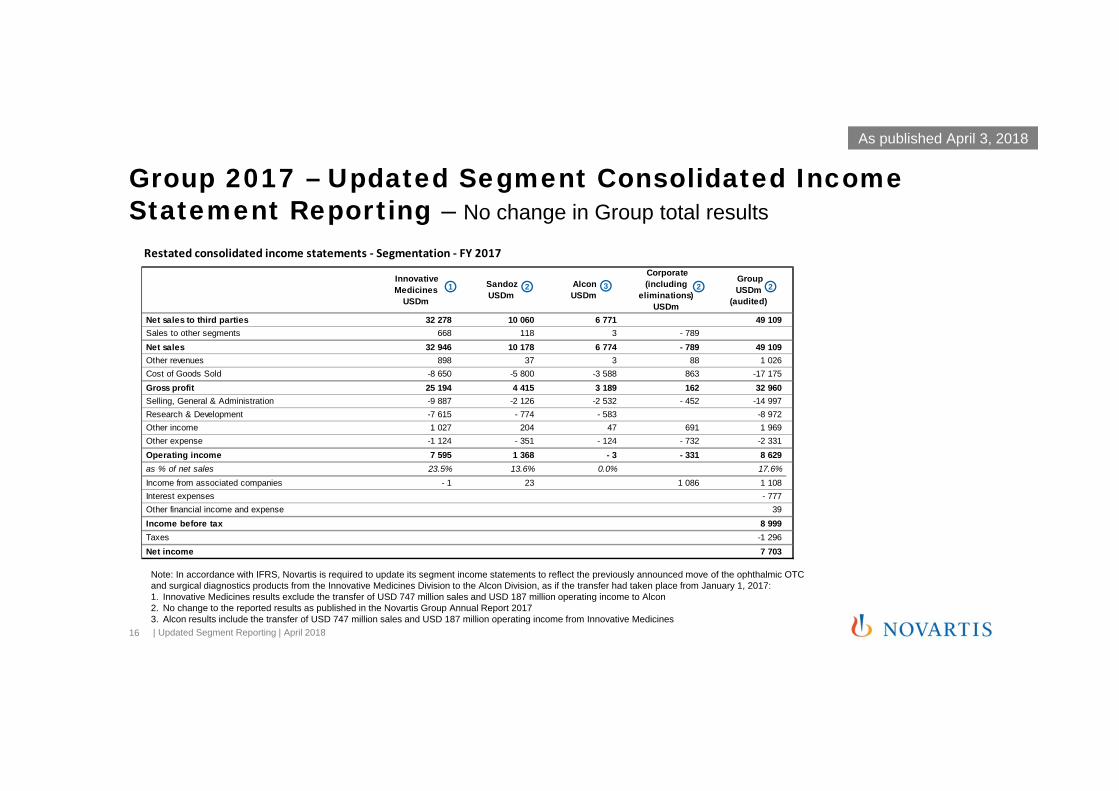
Restated consolidated income statements ‐ Segmentation ‐ FY 2017
Innovative Medicines
USDm
SandozUSDm
AlconUSDm
Corporate(including
eliminations)USDm
GroupUSDm
(audited)
Net sales to third parties 32 278 10 060 6 771 49 109 Sales to other segments 668 118 3 - 789 Net sales 32 946 10 178 6 774 - 789 49 109 Other revenues 898 37 3 88 1 026 Cost of Goods Sold -8 650 -5 800 -3 588 863 -17 175 Gross profit 25 194 4 415 3 189 162 32 960 Selling, General & Administration -9 887 -2 126 -2 532 - 452 -14 997 Research & Development -7 615 - 774 - 583 -8 972 Other income 1 027 204 47 691 1 969 Other expense -1 124 - 351 - 124 - 732 -2 331 Operating income 7 595 1 368 - 3 - 331 8 629 as % of net sales 23.5% 13.6% 0.0% 17.6%Income from associated companies - 1 23 1 086 1 108 Interest expenses - 777 Other financial income and expense 39 Income before tax 8 999 Taxes -1 296 Net income 7 703
Group 2017 – Updated Segment Consolidated Income Statement Reporting – No change in Group total results
| Updated Segment Reporting | April 201816
Note: In accordance with IFRS, Novartis is required to update its segment income statements to reflect the previously announced move of the ophthalmic OTC and surgical diagnostics products from the Innovative Medicines Division to the Alcon Division, as if the transfer had taken place from January 1, 2017:1. Innovative Medicines results exclude the transfer of USD 747 million sales and USD 187 million operating income to Alcon2. No change to the reported results as published in the Novartis Group Annual Report 20173. Alcon results include the transfer of USD 747 million sales and USD 187 million operating income from Innovative Medicines
1 32 2 2
As published April 3, 2018

Restated reported and core operating income ‐ Alcon
Q1 2017USDm
Q2 2017USDm
HY 2017USDm
Q3 2017USDm
9M 2017USDm
Q4 2017USDm
FY 2017USDm
Net sales to third parties 1 591 1 707 3 298 1 712 5 010 1 761 6 771 Sales to other segments 1 1 2 1 3 3 Net sales 1 592 1 708 3 300 1 713 5 013 1 761 6 774 Other revenues 1 1 2 3 3 Cost of Goods Sold - 868 - 895 -1 763 - 884 -2 647 - 941 -3 588 Gross profit 724 814 1 538 831 2 369 820 3 189 Selling, General & Administration - 605 - 649 -1 254 - 641 -1 895 - 637 -2 532 Research & Development - 122 - 128 - 250 - 187 - 437 - 146 - 583 Other income 14 7 21 17 38 9 47 Other expense - 13 - 15 - 28 - 22 - 50 - 74 - 124 Operating income - 2 29 27 -2 25 - 28 - 3 as % of net sales -0.1% 1.7% 0.8% -0.1% 0.5% -1.6% 0.0%
Core adjustmentsCost of Goods Sold 252 254 506 255 761 254 1 015 Selling, General & Administration Research & Development 3 2 5 62 67 11 78 Other income - 6 - 6 - 8 - 14 - 3 - 17 Other expense 11 6 17 10 27 68 95 Core Operating income 258 291 549 317 866 302 1 168 as % of net sales 16.2% 17.0% 16.6% 18.5% 17.3% 17.1% 17.3%
Alcon 2017 – Updated Segment Income Statement Reporting
17
1. Sales increased by USD 747 million related to the products moved from Innovative Medicines to Alcon, thereof USD 683 million to the Vision Care Franchise, related to the ophthalmic OTC products, and USD 64 million to the Surgical Franchise, related to the surgical diagnostics products. The products moved include the Systane®, Tears Naturale® and ICAPS® brands
2. COGS increased by USD 357 million related to theophthalmic OTC and surgical diagnostics products
3. SG&A increased by USD 188 million (25.2% of sales) related to the ophthalmic OTC and surgical diagnostics products
4. R&D increased by USD 15 million (2.0% of sales) related to the ophthalmic OTC and surgical diagnostics products
5. The move of ophthalmic OTC and surgical diagnostics products increased Alcon’s reported operating margin by +3.2%pts and core operating margin by +3.1%pts
6. Core adjustments increased by USD 124 million related to the ophthalmic OTC and surgical diagnostics products intangible asset amortization expense recorded in COGS. Core results are non-IFRS measures. An explanation of these measures can be found on page 179 of the 2017 Novartis Annual ReportNote: In accordance with IFRS, Novartis is required to update its segment income statements to reflect the previously announced move of the ophthalmic
OTC and surgical diagnostics products from the Innovative Medicines Division to the Alcon Division, as if the transfer had taken place from January 1, 2017.
2
3
1
4
5
5
6
| Updated Segment Reporting | April 2018
As published April 3, 2018

Restated reported and core operating income ‐ Innovative Medicines
Q1 2017USDm
Q2 2017USDm
HY 2017USDm
Q3 2017USDm
9M 2017USDm
Q4 2017USDm
FY 2017USDm
Net sales to third parties 7 518 8 084 15 602 8 117 23 719 8 559 32 278 Sales to other segments 174 157 331 171 502 166 668 Net sales 7 692 8 241 15 933 8 288 24 221 8 725 32 946 Other revenues 217 220 437 241 678 220 898 Cost of Goods Sold -2 068 -2 162 -4 230 -2 172 -6 402 -2 248 -8 650 Gross profit 5 841 6 299 12 140 6 357 18 497 6 697 25 194 Selling, General & Administration -2 286 -2 496 -4 782 -2 415 -7 197 -2 690 -9 887 Research & Development -1 861 -1 739 -3 600 -1 857 -5 457 -2 158 -7 615 Other income 285 272 557 247 804 223 1 027 Other expense - 299 - 309 - 608 - 201 - 809 - 315 -1 124 Operating income 1 680 2 027 3 707 2 131 5 838 1 757 7 595 as % of net sales 22.3% 25.1% 23.8% 26.3% 24.6% 20.5% 23.5%
Core adjustmentsCost of Goods Sold 529 511 1 040 479 1 519 500 2 019 Selling, General & Administration - 3 - 3 Research & Development 182 31 213 128 341 240 581 Other income - 189 - 217 - 406 - 218 - 624 - 52 - 676 Other expense 153 144 297 58 355 148 503 Core Operating income 2 355 2 496 4 851 2 578 7 429 2 590 10 019 as % of net sales 31.3% 30.9% 31.1% 31.8% 31.3% 30.3% 31.0%
Innovative Medicines 2017 – Updated Segment Income Statement Reporting
18
1. Sales decreased by USD 747 million related to the ophthalmic OTC and surgical diagnostics products, moved from Innovative Medicines to Alcon. The products moved include the Systane®, Tears Naturale® and ICAPS® brands
2. COGS decreased by USD 357 million related to the ophthalmic OTC and surgical diagnostics products
3. SG&A decreased by USD 188 million (25.2% of sales) related to the ophthalmic OTC and surgical diagnostics products
4. R&D decreased by USD 15 million (2.0% of sales) related to the ophthalmic OTC and surgical diagnostics products
5. The transfer of the ophthalmic OTC and surgical diagnostics products slightly decreased Innovative Medicines Division’s reported operating margin by -0.1%pts and core operating margin by -0.3%pts
6. Core adjustments decreased by USD 124 million related to the ophthalmic OTC and surgical diagnostics products intangible asset amortization expense recorded in COGS. Core results are non-IFRS measures. An explanation of these measures can be found on page 179 of the 2017 Novartis Annual Report
6
Note: In accordance with IFRS, Novartis is required to update its segment income statements to reflect the previously announced move of the ophthalmic OTC and surgical diagnostics products from the Innovative Medicines Division to the Alcon Division, as if the transfer had taken place from January 1, 2017.
2
3
1
4
5
5
| Updated Segment Reporting | April 2018
As published April 3, 2018

Appendix
As published April 3, 2018

Group 2017 – Segment Consolidated Income Statement Reporting – As previously reported in 2017 Annual Report
20
Reported consolidated income statements ‐ Segmentation ‐ FY 2017
(audited)
Innovative Medicines
USDm
SandozUSDm
AlconUSDm
Corporate(including
eliminations)USDm
GroupUSDm
Net sales to third parties 33 025 10 060 6 024 49 109 Sales to other segments 668 118 3 - 789 Net sales 33 693 10 178 6 027 - 789 49 109 Other revenues 898 37 3 88 1 026 Cost of Goods Sold -9 007 -5 800 -3 231 863 -17 175 Gross profit 25 584 4 415 2 799 162 32 960 Selling, General & Administration -10 075 -2 126 -2 344 - 452 -14 997 Research & Development -7 630 - 774 - 568 -8 972 Other income 1 027 204 47 691 1 969 Other expense -1 124 - 351 - 124 - 732 -2 331 Operating income 7 782 1 368 - 190 - 331 8 629 as % of net sales 23.6% 13.6% -3.2% 17.6%Income from associated companies - 1 23 1 086 1 108 Interest expenses - 777 Other financial income and expense 39 Income before tax 8 999 Taxes -1 296 Net income 7 703
| Updated Segment Reporting | April 2018
As published April 3, 2018

Alcon 2017 – Segment Income Statement ReportingAs previously reported in 2017 Annual Report and quarterly earnings reports
21
Reported and core operating income ‐ Alcon
Q1 2017USDm
Q2 2017USDm
HY 2017USDm
Q3 2017USDm
9M 2017USDm
Q4 2017USDm
FY 2017USDm
Net sales to third parties 1 417 1 516 2 933 1 527 4 460 1 564 6 024 Sales to other segments 1 1 2 1 3 3 Net sales 1 418 1 517 2 935 1 528 4 463 1 564 6 027 Other revenues 1 1 2 3 3 Cost of Goods Sold - 781 - 806 -1 587 - 795 -2 382 - 849 -3 231 Gross profit 637 712 1 349 735 2 084 715 2 799 Selling, General & Administration - 561 - 600 -1 161 - 597 -1 758 - 586 -2 344 Research & Development - 120 - 123 - 243 - 183 - 426 - 142 - 568 Other income 14 7 21 17 38 9 47 Other expense - 13 - 15 - 28 - 22 - 50 - 74 - 124 Operating income - 43 - 19 - 62 - 50 - 112 - 78 - 190 as % of net sales -3.0% -1.3% -2.1% -3.3% -2.5% -5.0% -3.2%
Core adjustmentsCost of Goods Sold 222 222 444 224 668 223 891 Selling, General & Administration Research & Development 3 2 5 62 67 11 78 Other income - 6 - 6 - 8 - 14 - 3 - 17 Other expense 11 6 17 10 27 68 95 Core Operating income 187 211 398 238 636 221 857 as % of net sales 13.2% 13.9% 13.6% 15.6% 14.3% 14.1% 14.2%
1. Core results are non-IFRS measures and are unaudited. An explanation of these measures can be found on page 179 of the 2017 Novartis Annual Report
1
| Updated Segment Reporting | April 2018
As published April 3, 2018

Reported and core operating income ‐ Innovative Medicines
Q1 2017USDm
Q2 2017USDm
HY 2017USDm
Q3 2017USDm
9M 2017USDm
Q4 2017USDm
FY 2017USDm
Net sales to third parties 7 692 8 275 15 967 8 302 24 269 8 756 33 025 Sales to other segments 174 157 331 171 502 166 668 Net sales 7 866 8 432 16 298 8 473 24 771 8 922 33 693 Other revenues 217 220 437 241 678 220 898 Cost of Goods Sold -2 155 -2 251 -4 406 -2 261 -6 667 -2 340 -9 007 Gross profit 5 928 6 401 12 329 6 453 18 782 6 802 25 584 Selling, General & Administration -2 330 -2 545 -4 875 -2 459 -7 334 -2 741 -10 075 Research & Development -1 863 -1 744 -3 607 -1 861 -5 468 -2 162 -7 630 Other income 285 272 557 247 804 223 1 027 Other expense - 299 - 309 - 608 - 201 - 809 - 315 -1 124 Operating income 1 721 2 075 3 796 2 179 5 975 1 807 7 782 as % of net sales 22.4% 25.1% 23.8% 26.2% 24.6% 20.6% 23.6%
Core adjustmentsCost of Goods Sold 559 543 1 102 510 1 612 531 2 143 Selling, General & Administration - 3 - 3 Research & Development 182 31 213 128 341 240 581 Other income - 189 - 217 - 406 - 218 - 624 - 52 - 676 Other expense 153 144 297 58 355 148 503 Core Operating income 2 426 2 576 5 002 2 657 7 659 2 671 10 330 as % of net sales 31.5% 31.1% 31.3% 32.0% 31.6% 30.5% 31.3%
Innovative Medicines 2017 – Segment Income Statement Reporting – As previously reported in 2017 Annual Report and quarterly earnings reports
22
1. Core results are non-IFRS measures and are unaudited. An explanation of these measures can be found on page 179 of the 2017 Novartis Annual Report
1
| Updated Segment Reporting | April 2018
As published April 3, 2018