Embed Size (px)
Citation preview

NOTTAWASAGA RIVER
SHOREWALL STANDARDS
December 2014
Prepared for
THE TOWN OF WASAGA BEACH

THE TOWN OF WASAGA BEACH
NOTTAWASAGA RIVER SHOREWALL STANDARDS
AINLEY & ASSOCIATES LIMITED File No. 212001 Consulting Engineers and Planners December 2014 550 Welham Road Barrie, Ontario L4N 8Z7 Telephone: (705) 726-3371 Facsimile: (705) 726-4391
Town of Wasaga Beach Nottawasaga River Shorewall Standards
Ainley Group File #212001 – December 2014 Report i
TABLE OF CONTENTS
PAGE
1.0 Introduction ................................................................................................. 1 1.1 Background ............................................................................................ 2 2.0 Existing Conditions ..................................................................................... 2 2.1 Hydrology ............................................................................................... 2
2.1.1 Baseflow .............................................................................. 2 2.1.2 Return Period Flows ............................................................ 3
2.2 Hydraulic Modelling ................................................................................ 4 2.2.1 Modelling Assumptions ....................................................... 4 2.2.2 Modelling Results ................................................................ 4
2.3 Fluvial Geomorphology .......................................................................... 4 2.3.1 Existing Conditions .............................................................. 5
2.3.1.1 Geology & Physiography ...................................................... 5 2.3.1.2 General Watershed Characteristics and Channel
Characterization ................................................................... 6 2.3.1.3 Reach Delineation ................................................................ 8 2.3.1.4 Reach 1 ................................................................................ 8 2.3.1.5 Reach 2 ................................................................................ 9 2.3.1.6 Reach 3 ................................................................................ 9
2.3.2 Stream Assessment Scores .............................................. 11 2.3.3 Rapid Geomorphic Assessment (RGA) ............................. 11 2.3.4 Rapid Stream Assessment Technique (RSAT) ................. 12 2.3.5 Channel Flows ................................................................... 14 2.3.6 Geomorphic Summary ...................................................... 15
2.4 Erosion Calculations ............................................................................ 16 2.4.1 Straight Channel Sections ................................................. 17 2.4.2 Channel Bends .................................................................. 17
3.0 Shorewall Alternatives .............................................................................. 19 3.1 Naturalization ....................................................................................... 19 3.2 Bioengineering ..................................................................................... 20 3.3 Armourstone ........................................................................................ 20 3.4 Cedar posts .......................................................................................... 21 3.5 Sheet Piles ........................................................................................... 21 4.0 Selecting Appropriate Shorewall Protection Process ............................... 21 4.1 Prescreening ........................................................................................ 22 4.2 Technical Screening ............................................................................ 23 5.0 Conclusions and Recommendations ........................................................ 23 6.0 References ............................................................................................... 24
Town of Wasaga Beach Nottawasaga River Shorewall Standards
Ainley Group File #212001 – December 2014 Report ii
LIST OF TABLES
Table 1: Return Period Flows .......................................................................... 3 Table 2: Summary of Study Area Geomorphic Parameters .......................... 10 Table 3: Interpretation of RGA Score ............................................................ 12 Table 4: Interpretation of RSAT Score .......................................................... 14 Table 5: Shear Stresses Within Straight Channel Sections .......................... 17 Table 6: Bend Shear Results for Selected Bends ......................................... 18
LIST OF FIGURES
Figure 1: Study Area......................................................................................... 1 Figure 2: Local Physiography Landforms (data from MNDM) .......................... 6 Figure 3: Location of Site (modified map from Google Maps) .......................... 7 Figure 4: Flow Regression Analysis for Nottawasaga River at Wasaga Beach15 Figure 5: Measurable Bank Migration Within the Vicinity of Woodland Drive. 16 Figure 6: Bend Locations for Shear Analysis. ................................................ 19
LIST OF Standard Drawings
• Seed, Stake/Plant • Plant/Stake, Seed, Coir Log • Fascine/Brush Mattress • Toe Armouring and Plantings/Seeding with Geotextile • Vegetated Buttress • Embedded Armourstone with Naturalized Toe • Armourstone Retaining Wall • Sheet Pile
LIST OF APPENDICES
Appendix A – Shorewall Selection Criteria & Standard Drawings Appendix B – Water’s Edge Calculations Appendix C – HEC-RAS & HEC-SSP Modelling (CD Only) Appendix D – Photos (CD Only)

Town of Wasaga Beach Nottawasaga River Shorewall Standards
Ainley Group File #212001 – December 2014 Report 1
1.0 Introduction
Ainley and Associates Limited (“Ainley Group”) has been retained by the Town of Wasaga Beach (“Town”) to develop a Shorewall Replacement Standard for property owners fronting onto the Nottawasaga River in the Town of Wasaga Beach. The Ainley Group has retained Water’s Edge to assist with the environmental and geomorphology components of developing a Shorewall Replacement Standard.
The newly developed Shorewall Replacement Standard is intended to assist residents in determining the appropriate type of shorewall protection needed to stabilize the Nottawasaga River Shoreline along their properties, and streamline the review process with appropriate review agencies including, but not limited to the Nottawasaga Valley Conservation Authority.
The study area covers the developed portion of the Nottawasaga River within the limits of the Town of Wasaga Beach, as shown on Figure 1.
Figure 1: Study Area

Town of Wasaga Beach Nottawasaga River Shorewall Standards
Ainley Group File #212001 – December 2014 Report 2
1.1 Background
Properties fronting on the Nottawasaga River are a mix of old and new cottages and homes in a variety of sizes and with varying setbacks. This same variety can also be found in the shorewalls along the banks of the Nottawasaga River through Wasaga Beach. These shorewalls are in various states of repair ranging from newly constructed to failing.
A need was identified for a Shorewall Replacement Standard. The purpose of this standard is to help ensure that as shorewalls come due for replacement, that they are replaced with the appropriate type of structure and that the same criteria are applied to all residents. In addition to replacing existing structures, this standard may be used to protect shoreline banks that are not currently armoured. It is intended that this standard will be used to help promote stable riverbanks with regard for a more aesthetically pleasing shoreline.
2.0 Existing Conditions
2.1 Hydrology
Given the large size and complexity of the entire Nottawasaga River watershed, preparing a hydrologic model as part of this study would not be practical. Instead data from the Edenvale Flow Gauge on located on the Nottawasaga River upstream of Wasaga Beach and survey data were combined to estimate baseflow and return period flows as discussed below.
2.1.1 Baseflow
For the purposes of this study, flow data has been estimated using a base HEC-RAS model provided by the Nottawasaga Valley Conservation Authority. The base model has been supplemented using surveyed cross sections of the river completed by Water’s Edge.
The base HEC-RAS model was generated based on digital elevation model data. This process is unable to determine topography below water surfaces. As such, the channel invert elevations within the base HEC-RAS model correspond with the water surface elevations along
Town of Wasaga Beach Nottawasaga River Shorewall Standards
Ainley Group File #212001 – December 2014 Report 3
the Nottawasaga River. To more accurately represent the actual river bottom, the survey data collected by Water's Edge was entered into the HEC-RAS model to more closely depict the river topography below the water surface elevation. The updated HEC-RAS model was then run with a range of flows to determine the flow value when the water surface elevations match the channel inverts from the NVCA HEC-RAS model. This match point has been assumed to be the baseflow for the Nottawasaga River through Wasaga Beach. The estimated baseflow is approximately 25m3/s.
2.1.2 Return Period Flows
The NVCA was contacted to determine if there was an overall hydrologic model available that could be used to determine design storms for the Nottawasaga River through Wasaga Beach and it was determined that no such model was available.
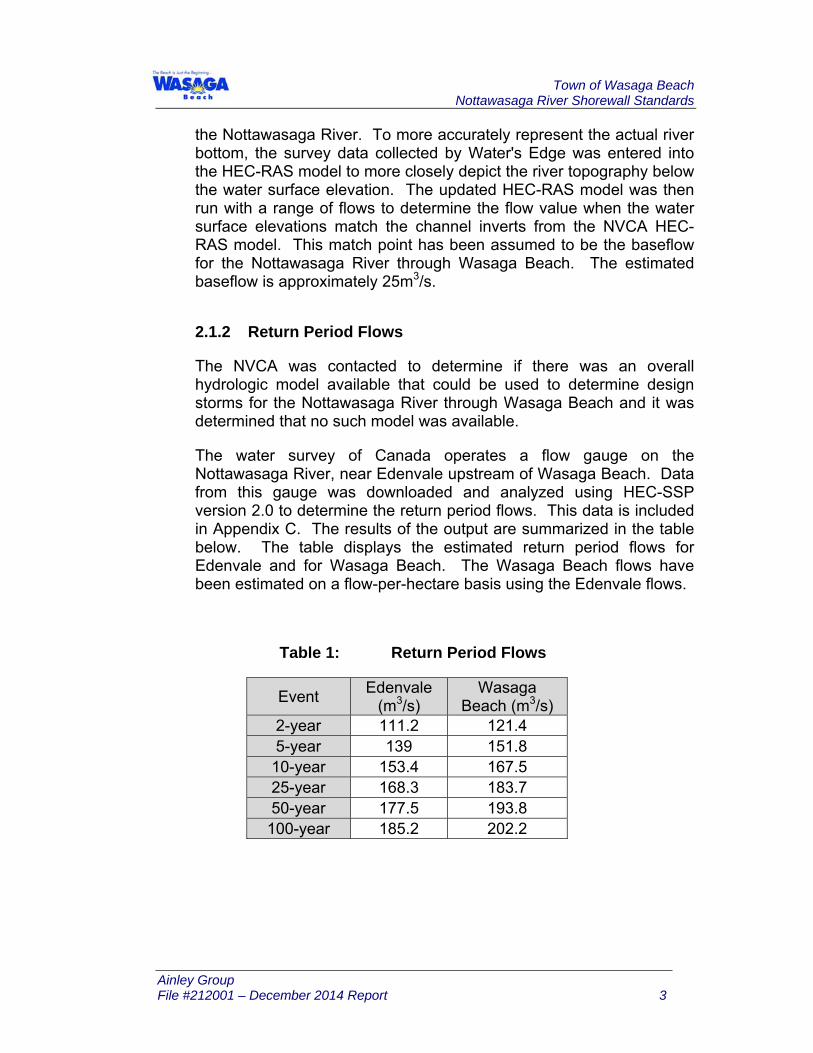
The water survey of Canada operates a flow gauge on the Nottawasaga River, near Edenvale upstream of Wasaga Beach. Data from this gauge was downloaded and analyzed using HEC-SSP version 2.0 to determine the return period flows. This data is included in Appendix C. The results of the output are summarized in the table below. The table displays the estimated return period flows for Edenvale and for Wasaga Beach. The Wasaga Beach flows have been estimated on a flow-per-hectare basis using the Edenvale flows.
Table 1: Return Period Flows
Event Edenvale (m3/s)
Wasaga Beach (m3/s)
2-year 111.2 121.4 5-year 139 151.8 10-year 153.4 167.5 25-year 168.3 183.7 50-year 177.5 193.8
100-year 185.2 202.2
Town of Wasaga Beach Nottawasaga River Shorewall Standards
Ainley Group File #212001 – December 2014 Report 4
2.2 Hydraulic Modelling
The HEC-RAS software package, version 4.1.0 was used for hydraulic modelling. A base HEC-RAS model was obtained from the NVCA and updated with survey information collected at selected locations along the Nottawasaga River. HEC-RAS is used to perform one-dimensional hydraulic calculations for rivers and channels based on the channel’s geometric properties.
2.2.1 Modelling Assumptions
For the purposes of this study, a steady-flow hydraulic model has been developed using peak flows. The HEC-RAS model received from the Nottawasaga Valley Conservation Authority included a peak Regulatory flow of 200m3/s. A baseflow of 25m3/s was added to this flow, for a total flow of 225m3/s. It is worth noting that the estimated 100-year return period flow based on the Water Survey of Canada flow gauge at Edenvale is 202.2m3/s, which is similar to the Regulatory flow provided by the NVCA in the base HEC-RAS model. More information on the return period flows can be found in Section 2.1.2.
2.2.2 Modelling Results
As might reasonably be expected, average flow velocities along the Nottawasaga River through Wasaga Beach were typically low (less than 1.2m/s). This is most likely due to very flat topography and the influence of the backwater from Nottawasaga Bay. A slight increase in the average velocity was observed at channel bends. A summary of the HEC-RAS model output can be found in Appendix C.
2.3 Fluvial Geomorphology
We have completed our assessment of the watercourse in accordance with the approved project Terms of Reference. Data sources for the analysis include:
• Map of the study area (from Google Imagery);
• Physiography of Southern Ontario by Chapman & Putnam (digital data from Ministry of Northern Development and Mines (MNDM));

Town of Wasaga Beach Nottawasaga River Shorewall Standards
Ainley Group File #212001 – December 2014 Report 5
• Nottawasaga Valley Source Protection Area Approved Assessment Report (November 2011)
• Site Inspections and Geomorphic Surveys; and,
• Discussions with Town and NVCA staff.
Site inspections and a geomorphic survey of the Nottawasaga River were completed by Water’s Edge staff in November 2013. The site inspection was undertaken after an initial review of the mapping and available literature was completed in order to confirm site and general system characteristics.
The Study Area (see Figures 1 and 2) is located in Wasaga Beach, Ontario. The complete study reach of the river is approximately 13 km long.
2.3.1 Existing Conditions
2.3.1.1 Geology & Physiography
Reviewing the site area’s surficial materials is important to evaluate active channel processes. Stream channel form and sediment supply are controlled by the region’s physiography and underlying surficial geology. Figure 1 shows the local physiography in the study area.
The study reach of Nottawasaga River is located within the Nottawasaga Basin of the Simcoe Lowlands physiographic region. Sandy beaches form the major characteristic component of this basin. This basin was a part of the floor of Lake Algonquin. Therefore, the surface beds deposits in this area are deltaic and lacustrine in origin as opposed to glacial outwash.

Town of Wasaga Beach Nottawasaga River Shorewall Standards
Ainley Group File #212001 – December 2014 Report 6
Figure 2: Local Physiography Landforms (data from MNDM)
2.3.1.2 General Watershed Characteristics and Channel Characterization
The Nottawasaga River originates from the headwaters in the Niagara Escarpment. It drains into Georgian Bay through Wasaga Beach.
A geomorphic survey was performed on a portion of the Nottawasaga River. The study area began approximately 13 km upstream of the mouth of the river. The downstream boundary was formed by Lake Huron. A total of 13 cross sections were surveyed.
Figure 2 shows the study reach within Nottawasaga River. In addition to confirming our desktop assessment, field reconnaissance and a geomorphic survey included the determination of various geomorphic parameters. In particular, bankfull channel dimensions are surveyed in order to make estimates of channel hydraulics contributing to existing fluvial
Town of Wasaga Beach Nottawasaga River Shorewall Standards
Ainley Group File #212001 – December 2014 Report 7
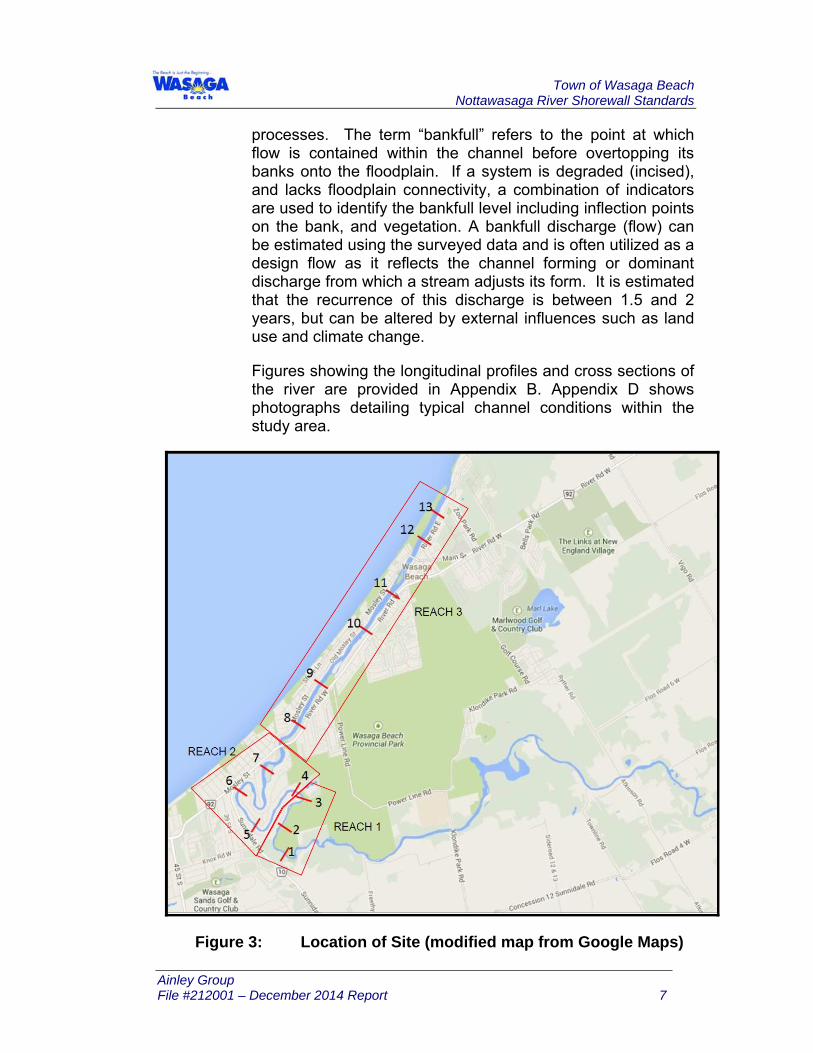
processes. The term “bankfull” refers to the point at which flow is contained within the channel before overtopping its banks onto the floodplain. If a system is degraded (incised), and lacks floodplain connectivity, a combination of indicators are used to identify the bankfull level including inflection points on the bank, and vegetation. A bankfull discharge (flow) can be estimated using the surveyed data and is often utilized as a design flow as it reflects the channel forming or dominant discharge from which a stream adjusts its form. It is estimated that the recurrence of this discharge is between 1.5 and 2 years, but can be altered by external influences such as land use and climate change.
Figures showing the longitudinal profiles and cross sections of the river are provided in Appendix B. Appendix D shows photographs detailing typical channel conditions within the study area.
Figure 3: Location of Site (modified map from Google Maps)

Town of Wasaga Beach Nottawasaga River Shorewall Standards
Ainley Group File #212001 – December 2014 Report 8
2.3.1.3 Reach Delineation
Channel morphology and substrate characteristics can change along a watercourse. Hence, it becomes imperative to account for these changes by delineating lengths of a watercourse that exhibit similar planform, sediment substrate, land use, local geology, valley confinement, hydrology and slope. In this study, three different reaches were delineated to account for change in land use, slope, and channel geometry. Other characteristics remained very comparable along the entire length of the Nottawasaga River that was studied. Figure 2 shows the planform view of the different cross sections surveyed. Cross sections 1 to 3 fall in Reach 1, cross sections 4 to 7 represent Reach 2 and the remaining cross sections are a part of Reach 3.
Two metrics which are explained below are the entrenchment ratio and the width-to-depth ratio. The entrenchment ratio is used to indicate the connectivity of a channel to its floodplain. An entrenched channel has undergone incision, or is confined to its valley and therefore fluvial forces are contained within the channel for larger flows before it can disperse onto the floodplain. Ratios less than 1.4 indicate that a channel is entrenched; a moderately entrenched stream may have a small floodplain or has undergone some incision. The width-to-depth ratio is used to understand the distribution of energy within a channel, the higher the value (>15) the more likely that energy is distributed towards the banks. Lower values (<8) are indicative of channels in which energy is primarily expended upon the bed. Better distribution throughout occurs in channels width/depth around 10. Low ratios are more likely to endure incision and degradation, while higher ratios will more likely undergo widening and aggradation. These two metrics are used as a part of the Rosgen (1994) stream classification for natural watercourses which is a method that simplifies a variety of complex channel characteristics into a common framework that can be easily understood and communicated between parties working on river systems (Appendix B).
2.3.1.4 Reach 1
This reach is the furthest upstream and is approximately 2 km long. The substrate within the reach ranges from sands to
Town of Wasaga Beach Nottawasaga River Shorewall Standards
Ainley Group File #212001 – December 2014 Report 9
cobbles with some boulders present in the riffle sections. The channel is moderately entrenched (1.4 < Entrenchment Ratio < 2.2) and shows moderate to high Width/Depth ratios (W/D > 12). The average bankfull slope in the reach is 0.08%. The general bankfull width is approximately 38 m (based on our evaluation of bankfull conditions). Of the studied reaches, this is the narrowest reach. The channel progressively expands in width as it nears its mouth. This reach shows the characteristics of a Rosgen B5 channel with some signs of an entrenched Rosgen F5 channel.
2.3.1.5 Reach 2
The substrate within the reach ranges from sands to cobbles. However, the riffles of this reach are dominated by gravels and some cobbles. The channel is entrenched (Entrenchment Ratio < 1.4) and has moderate to high Width/Depth ratios (W/D > 12). The average bankfull slope in the reach is 0.02%. The general bankfull width is approximately 52 m (based on our evaluation of bankfull conditions). A Rosgen classification of B5 can be assigned for this reach.
2.3.1.6 Reach 3
This is the downstream most reach. Throughout most of the length of the reach, there are flood protection works on the banks in the form of steel and wood retaining walls. The substrate within the reach is predominantly sands. The channel is moderately entrenched (1.4 < Entrenchment Ratio < 2.2) and shows moderate to high Width/Depth ratios (W/D > 12). The average bankfull slope in the reach is 0.01%. The general bankfull width is approximately 89 m (based on our evaluation of bankfull conditions). Due to the artificial nature of this reach, a Rosgen classification is not applicable.
The results of the observed and calculated geomorphic parameters are noted in Table 1. Stream classifications are also presented in Table 1. While classification of stream systems into relatively simple categories can be problematic, classification for the purposes of communicating a general idea of stream conditions is simple and helpful. However, the nature of the watershed and the highly altered channel conditions result in a system that may not be in equilibrium

Town of Wasaga Beach Nottawasaga River Shorewall Standards
Ainley Group File #212001 – December 2014 Report 10
with its classification. Classification is not to be considered as a prediction for the ultimate response to existing erosion treatments. As such, this classification should be considered carefully.
Table 2: Summary of Study Area Geomorphic Parameters
Parameter Reach 1 Reach 2 Reach 3
Bankfull Width (m) 37.8 52.2 88.6
Bankfull Mean Depth (m) 1.4 1.5 1.6
Bankfull Max Depth (m) 2.0 2.1 2.1
Bankfull Area (m2) 56.0 71.1 143.9
Wetted Perimeter (m) 38.5 53.0 89.2
Hydraulic Radius (m) 1.4 1.4 1.6
Width-Depth Ratio 26.0 39.9 55.9
Entrenchment Ratio 1.5 1.4 1.2
Bankfull Slope 0.00076 0.00017 0.0001
Channel Substrate Sands to Boulder
Sands to Cobbles Sands
Rosgen Classification B5/F5 B5 -

Town of Wasaga Beach Nottawasaga River Shorewall Standards
Ainley Group File #212001 – December 2014 Report 11
2.3.2 Stream Assessment Scores
In addition to classification of a stream system, various techniques for geomorphic assessments are used to better understand general stream conditions (stability, habitat, erosion/degradation, riparian, etc.). In our assessment of Nottawasaga River, we used Rapid Geomorphic Assessment and Rapid Stream Assessment Technique. The raw worksheets for these assessments can be found in Appendix B.
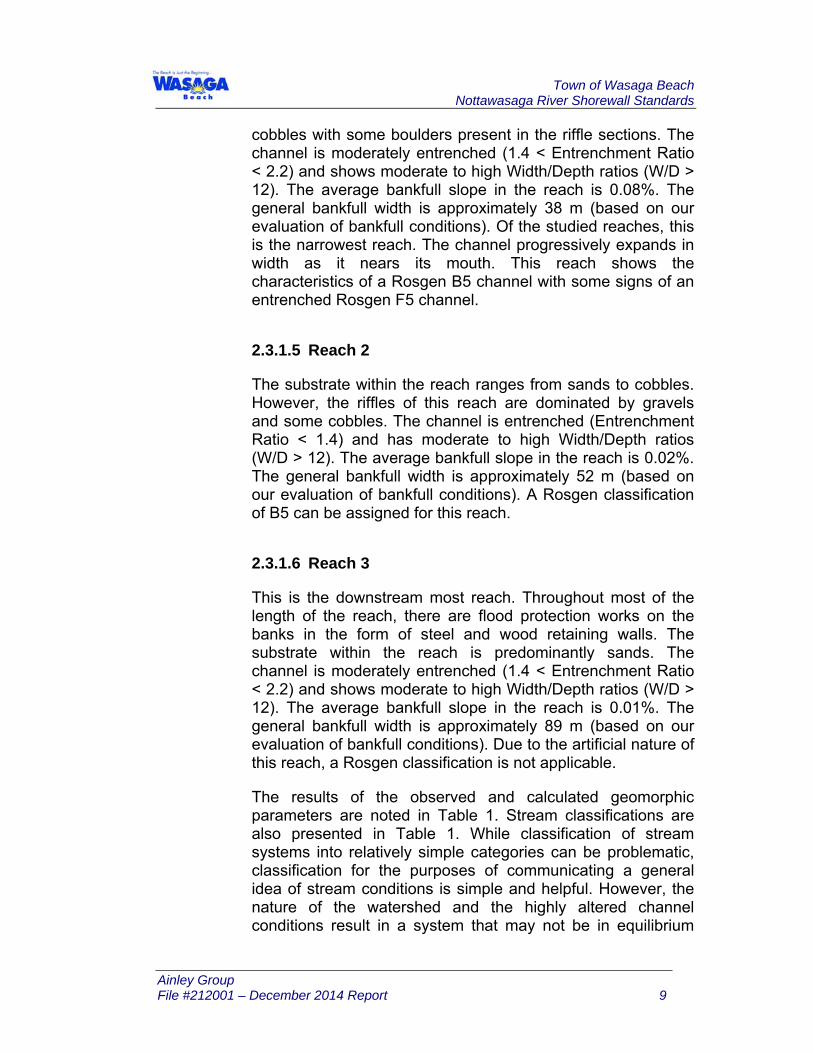
2.3.3 Rapid Geomorphic Assessment (RGA)
Watercourse stability was assessed using a Rapid Geomorphic Assessment (MOE, 2004). The RGA assessment focuses entirely on the geomorphic component of a river system. The RGA method consists of four factors that summarize various components of channel adjustment, specifically: aggradation, degradation, channel widening and plan form adjustment. Each factor is assessed separately and the total score indicates the overall stability of the system. This methodology has been applied to numerous streams and rivers and the following table details the ranking criteria (see Table 3).
The scores for the reaches of Nottawasaga River were determined to range from 0.16 to 0.31 which can largely be considered to be indicative of a “Transitional” or “Stressed” system. However, the middle reach was determined to be “in regime” while the remaining reaches were determined to be “transitional” since evidence of aggradation, widening and planimetric form adjustments were observed. The detailed RGA evaluation is presented in Appendix B.
Town of Wasaga Beach Nottawasaga River Shorewall Standards
Ainley Group File #212001 – December 2014 Report 12
Table 3: Interpretation of RGA Score
Stability Index
(SI) Value Classification Interpretation
SI ≤ 0.20 In Regime
The channel morphology is within a range of variance for rivers of similar hydrographic characteristics and evidence of instability is isolated or associated with normal river meander processes.
0.21 ≤ SI ≤0.40 Transitional/Stressed
Channel morphology is within a range of variance for rivers of similar hydrographic characteristics but the evidence of instability is frequent.
SI ≥ 0.40 In Adjustment
Channel morphology is not within the range of variance and evidence of instability is wide spread.
2.3.4 Rapid Stream Assessment Technique (RSAT)
Rapid Stream Assessment Technique was developed by John Galli and other staff of the Metropolitan Washington (DC) Council of Governments (Galli et al, 1996). The RSAT systematically focuses on conditions reflecting aquatic-system response to watershed urbanization. It groups responses into six categories, presumed to adequately evaluate the conditions of the river system at the time of measurement on a reach-by-reach basis. The six categories are:
Town of Wasaga Beach Nottawasaga River Shorewall Standards
Ainley Group File #212001 – December 2014 Report 13
1. Channel stability;
2. Channel scouring and sediment deposition;
3. Physical in-stream habitat;
4. Water quality;
5. Riparian habitat conditions; and
6. Biological conditions.
River channel stability and cross-sectional characterization is a critical component of RSAT. The entire channel was inspected for signs of instability (such as bank sloughing, recently exposed non-woody tree roots, general absence of vegetation within bottom third of the bank, recent tree falls, etc.) and channel degradation or downcutting (such as high banks in small headwater streams and erosion around man-made structures). Observations were noted and cross-section measurements were made.
A rapid assessment of soil conditions along the river banks was also conducted to determine soil texture and potential erodibility of the watercourse bank. Qualitative water quality measurements were also made (temperature, turbidity, colour and odour) along with an indication of substrate fouling (i.e., the unwanted accumulation of sediment).
RSAT also typically involves a quantitative sampling and evaluation of benthic organisms. As no benthic sampling was undertaken, the score was based on site conditions and general observations of water quality.
Each category was assigned a value which was then summed to provide an overall score and ranking. Table 3 details the range of scores and rankings with a higher score suggesting a healthier system.
Within these broad categories, we evaluated the study area and determined an average RSAT score of 39, 34 and 33 in Reaches 1, 2 and 3, respectively. In general, Nottawasaga River, within the study area, is a “good” system. Meaning that, overall positive indicators of a healthy stream were present however some improvements could be

Town of Wasaga Beach Nottawasaga River Shorewall Standards
Ainley Group File #212001 – December 2014 Report 14
made in bank stability, water quality, in-stream habitat, and riparian conditions.
The results of the RSAT evaluation are included in Appendix B.
Table 4: Interpretation of RSAT Score
RSAT Score
Ranking
41-50 Excellent
31-40 Good
21-30 Fair
11-20 Poor
0-10 Degraded
2.3.5 Channel Flows
Using data from the geomorphic field work, and using a friction factor/relative roughness methodology, bankfull flows in this system were determined. The results of the friction factor approach were very similar to that of Limerinos’ method and the Darcy-Weisbach method. Bankfull flows for the Nottawasaga River range from 86.5 to 158.8 m3/s and averages 124.3 m3/s.
Independently, and based on our database of stream systems of stream in quasi-equilibrium, we also examined a typical bankfull width and depth for this size of watershed (2,925.95 km2). Based on the resultant area (width x depth, computed using information from our stream database) and a velocity determined with Manning’s equation, an average of 118.6 m3/s was calculated.

Town of Wasaga Beach Nottawasaga River Shorewall Standards
Ainley Group File #212001 – December 2014 Report 15
Typically, bankfull return periods have been associated with 1:1.5 year return period. The existing return period flows presented in Section 2.2.2 were regressed. The resultant 1:1.5 year return period flow is expected to be 114.3 m3/s (see Figure 3).
Figure 4: Flow Regression Analysis for Nottawasaga River at Wasaga Beach
2.3.6 Geomorphic Summary
The reach of the Nottawasaga River studied originates approximately 13 km upstream of its mouth in the Town of Wasaga Beach. The stream flows through the Simcoe Lowlands physiographic region.
In order to carry out a fluvial assessment, a geomorphic survey of approximately 13 km of the stream in the area of interest was carried out. The sediment substrate in the study area was dominated by sand throughout the study reach. Gravels and cobbles were also found in the upstream and middle sub-reaches. As such, the study area was determined to predominantly show characteristics of a Rosgen B5 channel. Certain entrenched portions of the study reach show characteristics of a Rosgen F5 channel. Two assessment tools, namely, RSAT and RGA, were used to assess stream condition. RSAT scores show that the stream is generally in a good state. Therefore, the habitat conditions and the stream’s response to urbanization are “Good”. RGA score indicates that the stream, like most urban streams is in a transitional state, i.e., the stream is trying to achieve the state of quasi-equilibrium. The bankfull return period is approximately 114 m3/s.
y = 28.881ln(x) + 102.57R² = 0.9896Fl
ow (cms)
Return Period (years)

Town of Wasaga Beach Nottawasaga River Shorewall Standards
Ainley Group File #212001 – December 2014 Report 16
2.4 Erosion Calculations
Within the study area, sites of excessive erosion and channel migration are limited. This is likely the combined result of a low gradient channel with base level control by Lake Huron (backwatering), and extensive artificial streambank armouring. Historical photos revealed that over 46 years (1970-2006), the channel has remained atypically stable in its planform configuration. Bank migration could only be accurately measured using air photos from one bend, occurring in two directions: laterally and downstream (Figure 4). This is a high valley contact comprised of erodible sands, where maximum rates of bank migration in each direction at this bend are 0.46m/year, with averages of 0.32 and 0.30m/year. The maximum rate over 100 years would be 46m of lateral migration. Woodland Drive ends in proximity to this meander, at a distance of 58m from the approximate bankfull channel: an acceptable distance beyond the 100-year erosion limit at this location.
Figure 5: Measurable Bank Migration Within the Vicinity of Woodland Drive.
Extensive bank armouring has created a relatively stable planform compared to that of more natural streams over the period of photo record: 1954-2006. This practice has resulted in a disconnected floodplain and degraded riparian habitat. Where structures have become undermined, or are in an unrepairable condition, there is an opportunity to replace these structures, and if possible, utilize a natural

Town of Wasaga Beach Nottawasaga River Shorewall Standards
Ainley Group File #212001 – December 2014 Report 17
approach in the design. Such treatments need to be appropriately selected and sized based on existing shear stresses. These forces vary both along the channel plan and profile. Geomorphic field assessments indicated that these reaches have low slopes (0.01 to 0.076%); therefore variation in shear stress should primarily occur as the position along the channel planform changes.
2.4.1 Straight Channel Sections
Flow velocities through straight portions of stream channels are generally greatest nearer the surface at the centre of the stream and decrease towards the margins. Inherently, the distribution of shear stress follows the same pattern. The mean shear stress for straight portions of river channels are calculated as a function of the hydraulic radius and slope, and were determined for each reach under bankfull conditions (Table 5).
These results show a downstream reduction in shear, with the highest value occurring in Reach 1, due to the steeper gradient. Overall these shear values are relatively low, but under bankfull conditions medium gravels (8-16mm diameter) should become mobilized.
Table 5: Shear Stresses Within Straight Channel Sections
Reach Mean Shear (N/m2)
1 10.44 2 2.33 3 1.57
2.4.2 Channel Bends
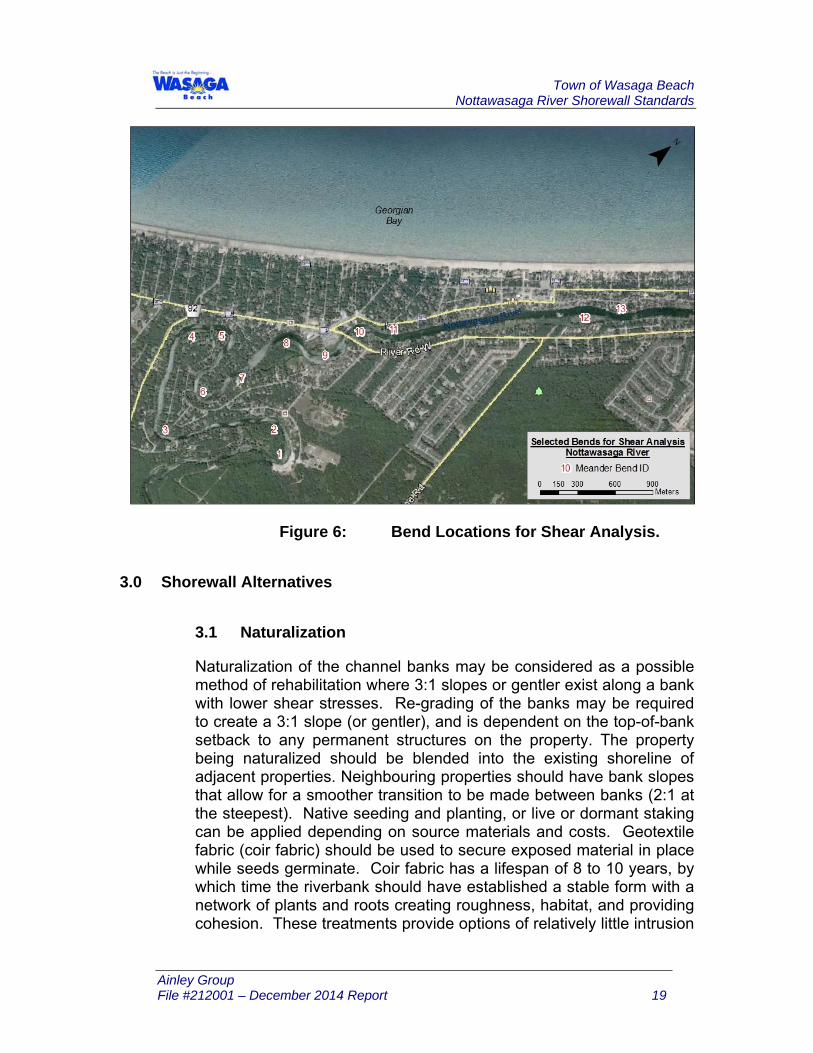
As a channel bends, flows are directed towards the outer bank, elevating the water surface towards the outside, with the maximum velocity current moving from near the inner bank at the bend entrance to nearer the outer bank at the bend exit. The ultimate result is a maximum boundary shear stress close to the outer bank immediately downstream of the apex of the bend (Knighton, 1998). Calculation of the shear stress through meander bend is completed by multiplying the mean shear applied of a straight section by a factor dependent on the ratio of the radius of curvature of the bend to the top width of the water surface (Thornton et al, 2001: Approach I). Thirteen bends were assessed within the study area (Figure 6). As may be expected,
Town of Wasaga Beach Nottawasaga River Shorewall Standards
Ainley Group File #212001 – December 2014 Report 18
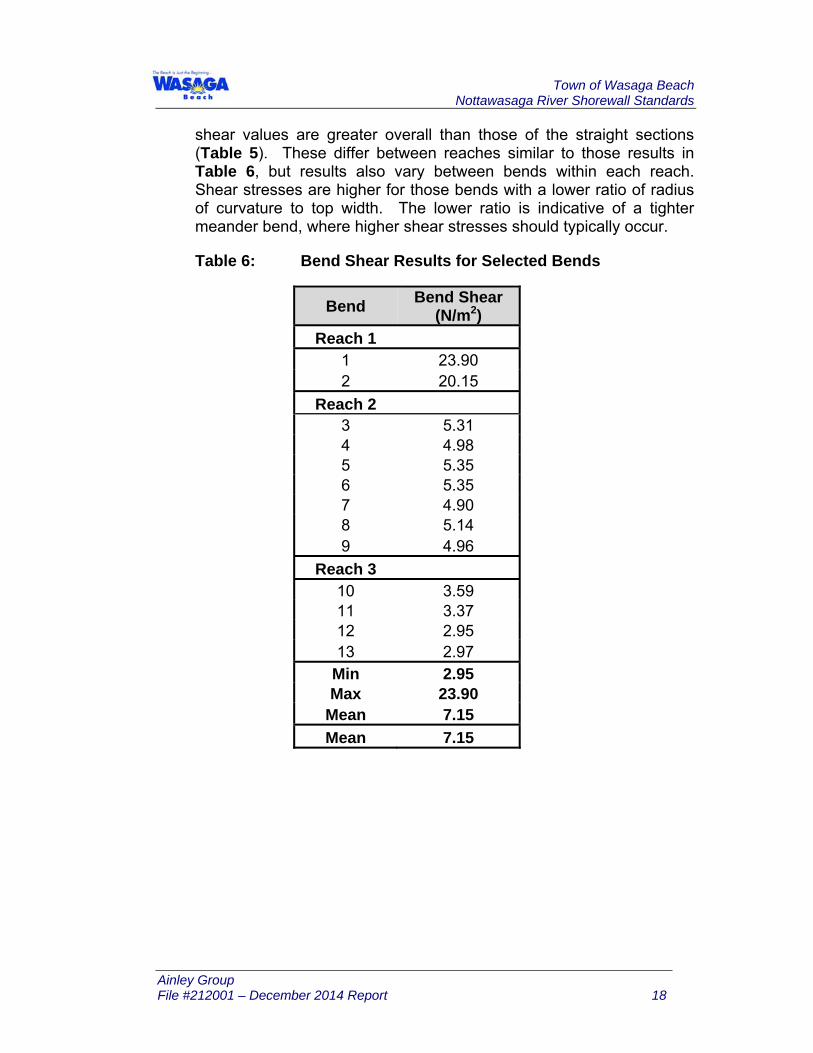
shear values are greater overall than those of the straight sections (Table 5). These differ between reaches similar to those results in Table 6, but results also vary between bends within each reach. Shear stresses are higher for those bends with a lower ratio of radius of curvature to top width. The lower ratio is indicative of a tighter meander bend, where higher shear stresses should typically occur.
Table 6: Bend Shear Results for Selected Bends
Bend Bend Shear (N/m2)
Reach 1 1 23.90 2 20.15
Reach 2 3 5.31 4 4.98 5 5.35 6 5.35 7 4.90 8 5.14 9 4.96
Reach 3 10 3.59 11 3.37 12 2.95 13 2.97
Min 2.95 Max 23.90
Mean 7.15 Mean 7.15
Town of Wasaga Beach Nottawasaga River Shorewall Standards
Ainley Group File #212001 – December 2014 Report 19
Figure 6: Bend Locations for Shear Analysis.
3.0 Shorewall Alternatives
3.1 Naturalization
Naturalization of the channel banks may be considered as a possible method of rehabilitation where 3:1 slopes or gentler exist along a bank with lower shear stresses. Re-grading of the banks may be required to create a 3:1 slope (or gentler), and is dependent on the top-of-bank setback to any permanent structures on the property. The property being naturalized should be blended into the existing shoreline of adjacent properties. Neighbouring properties should have bank slopes that allow for a smoother transition to be made between banks (2:1 at the steepest). Native seeding and planting, or live or dormant staking can be applied depending on source materials and costs. Geotextile fabric (coir fabric) should be used to secure exposed material in place while seeds germinate. Coir fabric has a lifespan of 8 to 10 years, by which time the riverbank should have established a stable form with a network of plants and roots creating roughness, habitat, and providing cohesion. These treatments provide options of relatively little intrusion
Town of Wasaga Beach Nottawasaga River Shorewall Standards
Ainley Group File #212001 – December 2014 Report 20
and cost. Coir fabric should be applied to all bare and seeded surfaces, and extend at least to the bankfull elevation.
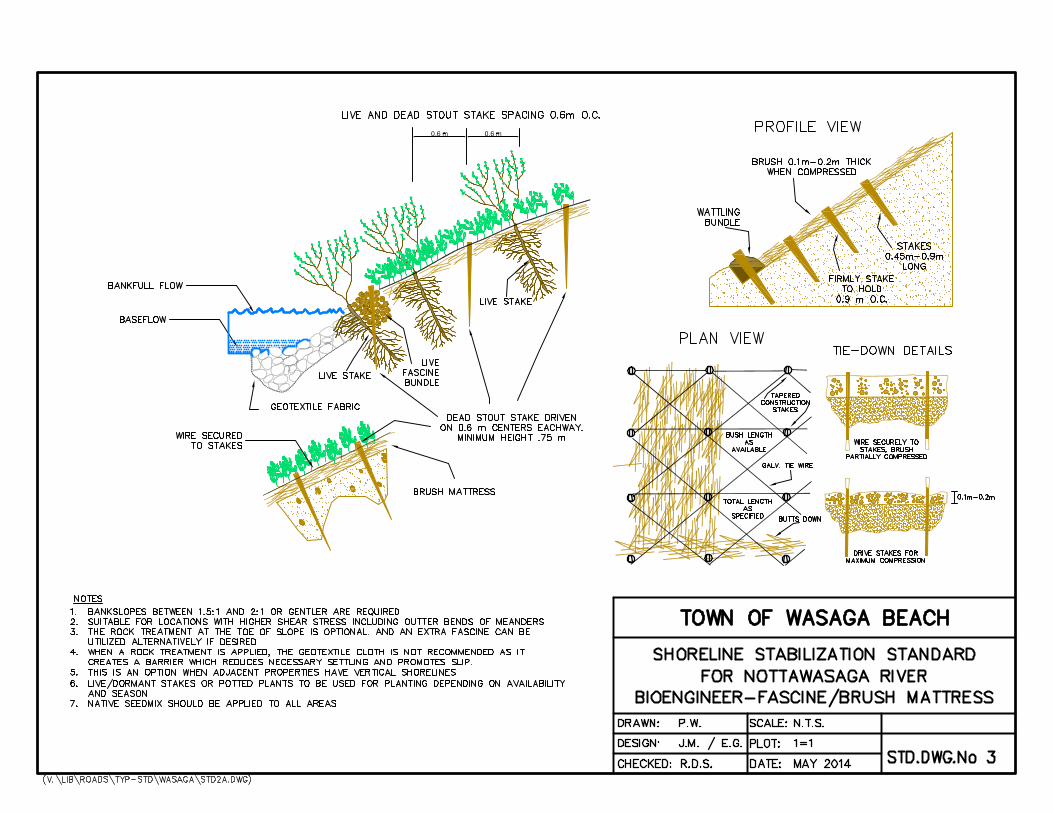
3.2 Bioengineering
Although the naturalization methods described in Section 3.1 are a form of bioengineering (e.g. coir fabric), separation between bank treatments has been made due to changes in the type of material, complexity of the application, and increased cost. Therefore, in this context, bioengineering refers to more natural methods that also employ some more robust structure and techniques which can be applied to steeper slopes – as steep as 1.5:1 depending on the selected application.
From the shear analysis, it is evident that shear stresses are greater along meander bends than through straight sections. Therefore, more robust treatments will likely be warranted at bend locations, particularly along the outside, but also the inside of the meander upon entry. Each treatment will depend on the existing bank slope being between 1.5:1 and 3:1, or whether there is an ability to create these slopes. Similarly to the naturalized treatments, there is also an influence from adjacent properties. If vertical banks are present on either side, a natural treatment that can remain stable at steeper slopes (e.g. 1.5:1) should be selected (e.g. brush mattress). Where more natural, or gentler banks adjoin the property being rehabilitated, a softer bioengineering approach may be taken with seeding, and planting/staking occurring higher on the bank, with rip rap, or herbaceous coir logs/fascines applied along the toe. Each bioengineering treatment includes vegetation to add roughness and stability (root cohesion) to the banks, and additionally provide riparian and aquatic habitat.
3.3 Armourstone
Armourstone retaining walls should be designed where property bank slopes are steeper than 1.5:1 and setbacks are not great enough to allow for the development of a 1.5:1 slope. Armourstone blocks should be stacked with some offset away from the channel to reduce the bank slope, and create roughness.

Town of Wasaga Beach Nottawasaga River Shorewall Standards
Ainley Group File #212001 – December 2014 Report 21
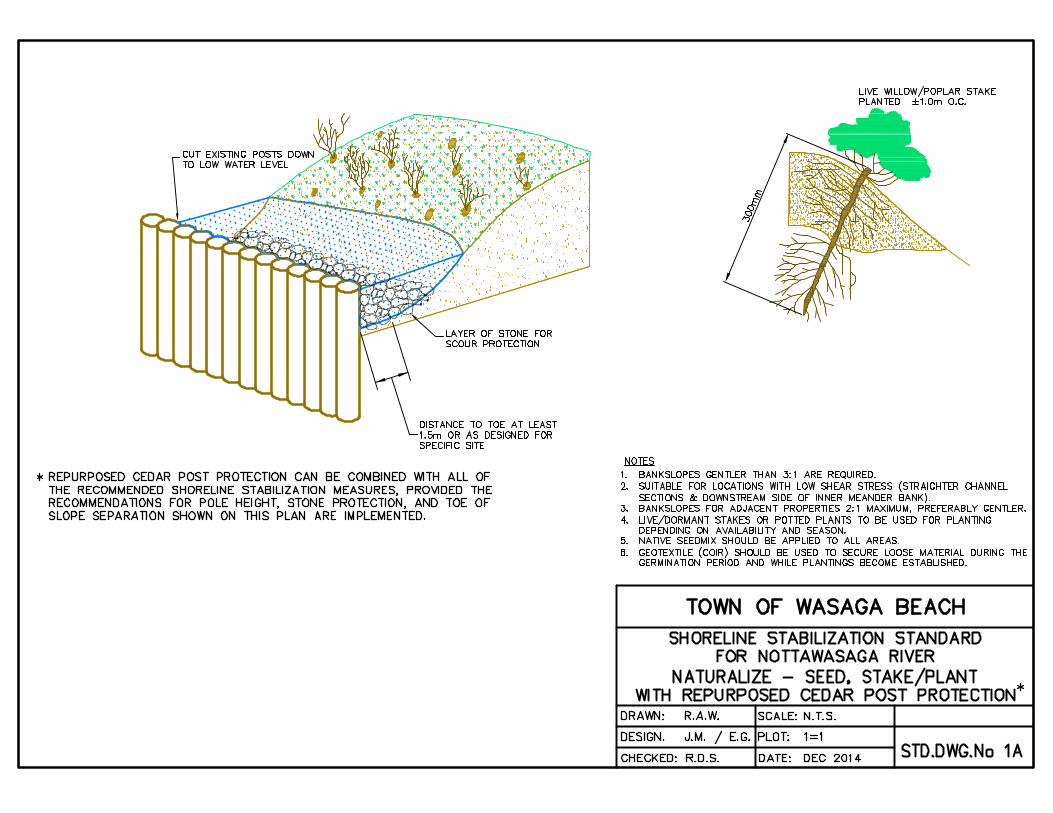
3.4 Cedar posts
As cedar posts currently exist within the study reach and where properly installed have remained rather robust. These should be designed where property bank slopes are steeper than 1.5:1 and setbacks are not great enough to allow for the development of a 1.5:1 slope. This option is recommended when naturalization or armourstone retaining walls are not a viable option.
In sections where cedar posts currently exist but a different shorewall has been selected for construction, the old posts can be cut down along the toe of the bank for added toe protection - provided there is an appropriate setback to the new treatment or replacement. Between these posts and the toe of the new bank treatment, a layer of appropriately sized stone should be placed along the bed to avoid toe scour.
It should be noted that these posts are not a replacement for beneficial in-stream and riparian vegetation. But, ideally, some sediment would accumulate on the shoreline side of the cut posts and provide growing medium for emergent and submergent aquatic plants. If this structure is to be built, it should be thought of as an addition to several shoreline options discussed above, and not a stand-alone treatment.
3.5 Sheet Piles
Sheet piles will likely be needed for sections of the river where there are existing vertical shorelines and there is no room to regrade the bank due to a small setback between the top of bank and a building structure, or driveway, or other significant property features. This option is recommended where when naturalization or armourstone retaining walls are not a viable option.
4.0 Selecting Appropriate Shorewall Protection Process
To assist with the selection of the appropriate shorewall stabilization measure, the above stabilization options have been summarized into four key categories:
1. “Do Nothing” – repair existing shorewall or maintain existing stable conditions.

Town of Wasaga Beach Nottawasaga River Shorewall Standards
Ainley Group File #212001 – December 2014 Report 22
2. Naturalization - stabilize shorewall using plantings and flatter slopes where possible. There are various options for naturalization that depend on site-specific characteristics.
3. Bioengineering - is an extension of Option 2. Bioengineering builds on naturalization using some more robust structural components, while still employing plantings and naturalization strategies.
4. Structural - when none of the other above options are viable, structural shoreline stabilization options may be the only alternative available. Some site-specific reasons why Structural measures must be used may include, but not be limited to existing dwellings close to the shore, very steep slopes and/or other important property features exist that need to remain protected.
Given the diversity of the shoreline along the Nottawasaga River through Wasaga Beach, there are several alternatives for each option. Detailed information on these various options can be found in Appendix A. The following section will set out guidelines for determining the appropriate shoreline stabilization method.
Regardless of the recommended shoreline stabilization option, a qualified design professional should be contacted to provide site specific details and certify the site-specific design. The Shorewall Standards presented in this report are intended as a guide to assist residents and the Town of Wasaga Beach assess alternatives and provide a standardized framework for the evaluation of shorewall stabilization alternatives.
4.1 Prescreening
The intent of the prescreening process is to help direct residents to determine an appropriate course of action to stabilize their shoreline. Numerous factors contribute to the selection of the appropriate stabilization measures including adjacent shorewalls, the location on the river, velocities and setback. To assist with the selection of the appropriate shorewall stabilization measure, a flow chart has been developed. This can be found in Appendix A. The prescreening flow chart will assist residents in determining which of the four shoreline stabilization options present in Section 4.0 they should consider for stabilizing their shoreline:
Town of Wasaga Beach Nottawasaga River Shorewall Standards
Ainley Group File #212001 – December 2014 Report 23
1. “Do Nothing”;
2. Naturalization;
3. Bioengineering; or
4. Structural.
4.2 Technical Screening
The technical screening process is intended to guide residents once they have completed the prescreening process. For Option 2 and Option 3, a checklist has been developed to help further refine the preferred method of shoreline stabilization based on site-specific criteria such as bank slope, adjacent bank slope, potential for regrading existing slopes, proximity of existing dwellings to the water, location along the channel (inside bend, outside bend or straight channel section), velocities, shear and of course the state of the existing shoreline. This Checklist is included in Appendix D. For Option 4, structural shorewalls, local site constraints will determine if an armourstone retaining wall is an option, or if a sheet pile wall is the only possible option.
5.0 Conclusions and Recommendations
Properties fronting along the Nottawasaga River though Wasaga Beach vary greatly. Many of these properties have shorewalls in various states of repair. Other properties may not currently have any added shoreline protection.
A need was identified for a Shorewall Replacement Standard. The purpose of the Shorewall Replacement Standard is to assist residents in determining the appropriate type of shoreline protection, promote stable riverbanks, provide for a more aesthetically pleasing shoreline and assist the Nottawasaga Valley Conservation Authority with the review and approval process for the construction of new or replacement of existing shorewalls.
The process of developing a Shorewall Standard involved the review of existing conditions along the Nottawasaga River through Wasaga Beach. Numerous factors were considered including hydrology (baseflow vs. return period flows), river hydraulics (shear stresses, velocities, bankflow

Town of Wasaga Beach Nottawasaga River Shorewall Standards
Ainley Group File #212001 – December 2014 Report 24
capacities), fluvial geomorphology, geology, physiography, channel classification, erosion and bank migration.
Following the evaluation of existing conditions, four categories of shorewall replacement were developed:
1. “Do Nothing”;
2. Naturalization;
3. Bioengineering; or
4. Structural.
These four categories of shorewall replacement increase in order of complexity.
To assist residents with the selection of the appropriate shorewall stabilization measure, a prescreening flow chart has been developed. This flow chart can be found in Appendix D. Additional checklists to help residents refine the type of shorewall stabilization needed once they have determined which one of the four categories should be used to stabilize their shoreline are also provided in Appendix D.
The standards serve as a guide, but ultimately need to be designed on a site-specific basis. The standards are intended to promote an aesthetically-pleasing uniformity along the Nottawasaga River through Wasaga Beach while promoting stable riverbanks. Additionally, the Shorewall Replacement Standards should help the Town of Wasaga Beach to give some direction to residents with respect to the replacement of aging or failing shorewalls.
6.0 References
A number of reports and references were consulted as part of the background review for this study. These are listed as follows:
Galli, J. 1996, Rapid Stream Assessment Technique (RSAT) field methods. 36 pp. Metropolitan
Knighton, D. 1998. Fluvial Forms and Processes: A New Perspective. Arnold, London.

Town of Wasaga Beach Nottawasaga River Shorewall Standards
Ainley Group File #212001 – December 2014 Report 25
Washington Council of Governments, Department of Environmental Programs, Washington, DC.
Ontario Ministry of Environment. March 2003. Stormwater Management Planning and Design Manual. Chapter 3.
Platts, W.S., W.F. Megahan, and G.W. Minshall. 1983. Methods for evaluating stream, riparian,
and biotic conditions. U.S. Department of Agriculture, Forest Service, General Technical Report
INT-138.
Town of Wasaga Beach Nottawasaga River Shorewall Standards
Ainley Group File #212001 –December 2014 Report
APPENDIX A
Shorewall Selection Criteria & Standard Drawings


See Section 4 of "Nottawasaga River Shorewall Standards" August 2014 for additional information
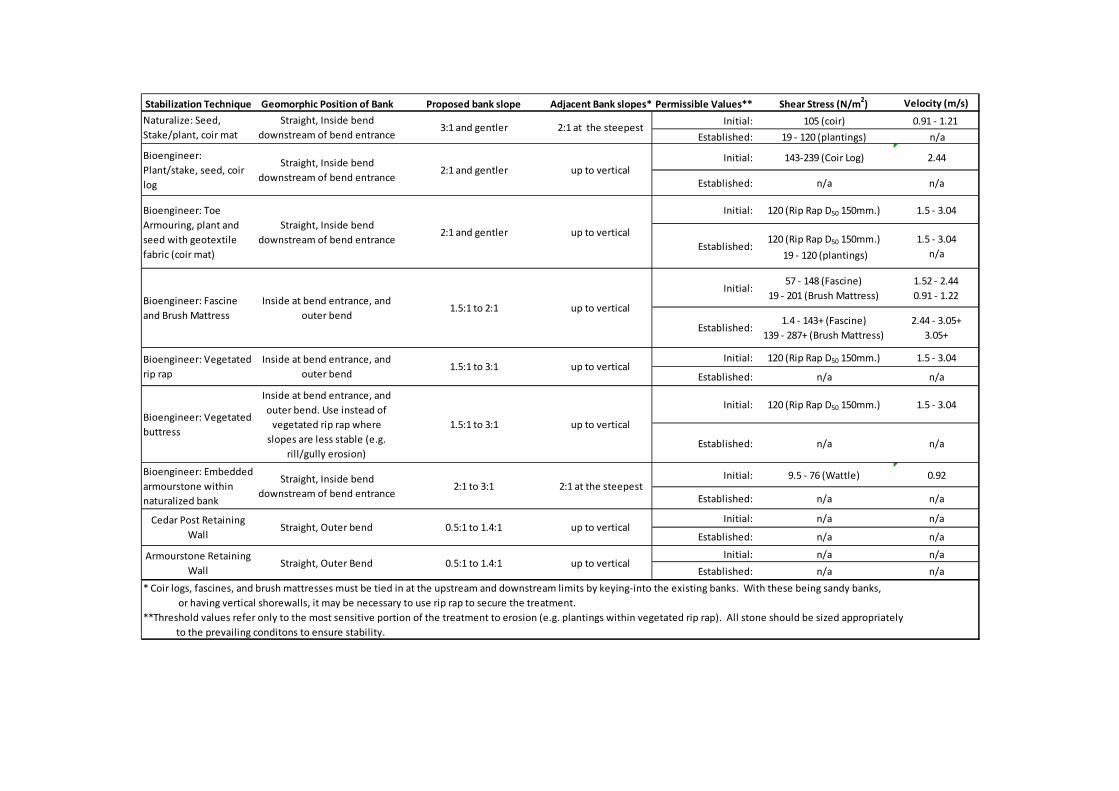
Stabilization Technique Geomorphic Position of Bank Proposed bank slope Adjacent Bank slopes* Permissible Values** Shear Stress (N/m2) Velocity (m/s)
Initial: 105 (coir) 0.91 - 1.21
Established: 19 - 120 (plantings) n/a
Initial: 143-239 (Coir Log) 2.44
Established: n/a n/a
Initial: 120 (Rip Rap D50 150mm.) 1.5 - 3.04
Established:120 (Rip Rap D50 150mm.)
19 - 120 (plantings)
1.5 - 3.04
n/a
Initial:57 - 148 (Fascine)
19 - 201 (Brush Mattress)
1.52 - 2.44
0.91 - 1.22
Established:1.4 - 143+ (Fascine)
139 - 287+ (Brush Mattress)
2.44 - 3.05+
3.05+
Initial: 120 (Rip Rap D50 150mm.) 1.5 - 3.04
Established: n/a n/a
Initial: 120 (Rip Rap D50 150mm.) 1.5 - 3.04
Established: n/a n/a
Initial: 9.5 - 76 (Wattle) 0.92
Established: n/a n/a
Initial: n/a n/a
Established: n/a n/a
Initial: n/a n/a
Established: n/a n/a
* Coir logs, fascines, and brush mattresses must be tied in at the upstream and downstream limits by keying-into the existing banks. With these being sandy banks,
or having vertical shorewalls, it may be necessary to use rip rap to secure the treatment.
**Threshold values refer only to the most sensitive portion of the treatment to erosion (e.g. plantings within vegetated rip rap). All stone should be sized appropriately
to the prevailing conditons to ensure stability.
Cedar Post Retaining
WallStraight, Outer bend 0.5:1 to 1.4:1 up to vertical
Armourstone Retaining
WallStraight, Outer Bend 0.5:1 to 1.4:1 up to vertical
up to vertical2:1 and gentlerStraight, Inside bend
downstream of bend entrance
Bioengineer:
Plant/stake, seed, coir
log
up to vertical1.5:1 to 3:1
Inside at bend entrance, and
outer bend. Use instead of
vegetated rip rap where
slopes are less stable (e.g.
rill/gully erosion)
Bioengineer: Vegetated
buttress
Bioengineer: Toe
Armouring, plant and
seed with geotextile
fabric (coir mat)
Straight, Inside bend
downstream of bend entrance2:1 and gentler up to vertical
Naturalize: Seed,
Stake/plant, coir mat
Straight, Inside bend
downstream of bend entrance3:1 and gentler 2:1 at the steepest
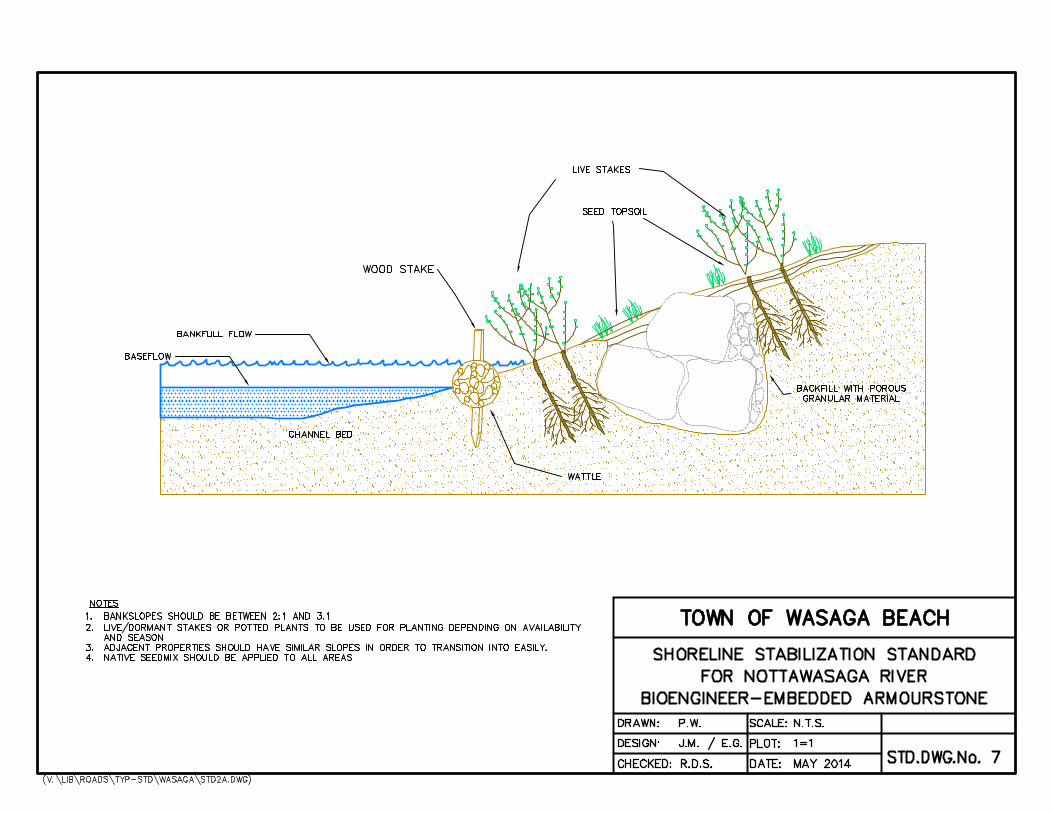
Bioengineer: Embedded
armourstone within
naturalized bank
Straight, Inside bend
downstream of bend entrance2:1 to 3:1 2:1 at the steepest
up to vertical1.5:1 to 2:1Inside at bend entrance, and
outer bend
Bioengineer: Fascine
and Brush Mattress
Bioengineer: Vegetated
rip rap
Inside at bend entrance, and
outer bend1.5:1 to 3:1 up to vertical

Figure: Index map showing shear condition along banks.

Town of Wasaga Beach Nottawasaga River Shorewall Standards
Ainley Group File #212001 –December 2014 Report
APPENDIX B
Water’s Edge Calculations

File #:12001
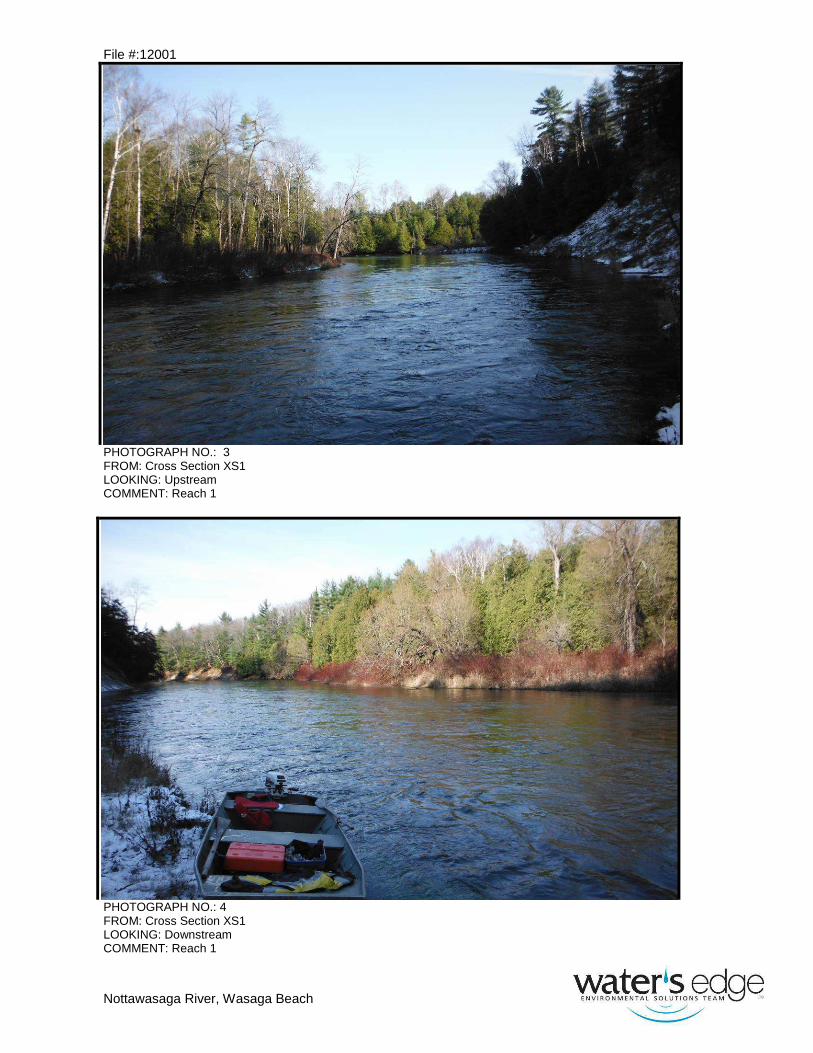
Nottawasaga River, Wasaga Beach
Figure 1: Longitudinal Profile
File #:12001
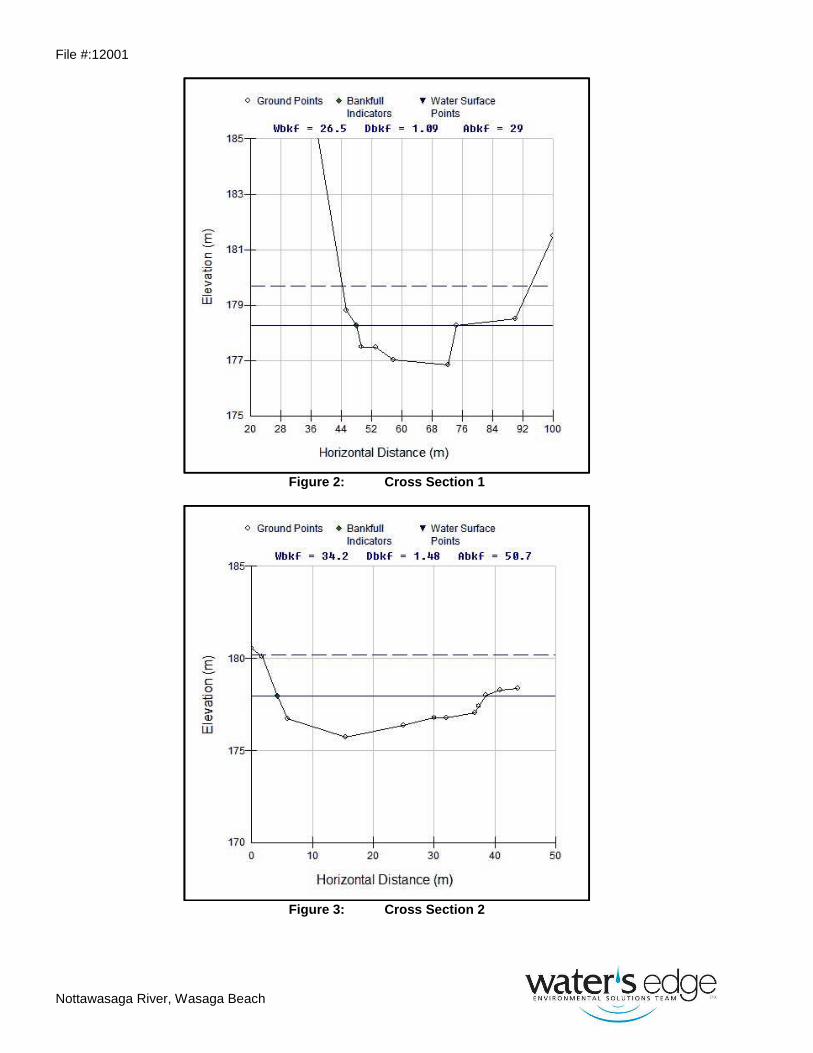
Nottawasaga River, Wasaga Beach
Figure 2: Cross Section 1
Figure 3: Cross Section 2

File #:12001
Nottawasaga River, Wasaga Beach
Figure 4: Cross Section 3
Figure 5: Cross Section 4

File #:12001
Nottawasaga River, Wasaga Beach
Figure 6: Cross Section 5
Figure 7: Cross Section 6

File #:12001
Nottawasaga River, Wasaga Beach
Figure 8: Cross Section 7
Figure 9: Cross Section 8

File #:12001
Nottawasaga River, Wasaga Beach
Figure 10: Cross Section 9
Figure 11: Cross Section 10

File #:12001
Nottawasaga River, Wasaga Beach
Figure 12: Cross Section 11
Figure 13: Cross Section 12

File #:12001
Nottawasaga River, Wasaga Beach
Figure 14: Cross Section 13

Table B1: Rapid Geomorphic Assessment Results

Table B2: Rapid Stream Assessment Technique Results

Equations used in calculations of shear stress:
Mean boundary shear in straight sections:
�� � � ∗ � ∗ � Eq. 1
Where:
� �Specific weight of water = 9810 N/m3
� �Hydraulic Radius = m
� �Slope = m/m
Boundary shear stress in bends:
� � ∗�� Eq. 2
Where:
�The ratio of shear stress in a channel bend to the straight channel shear stress (dimensionless);
determined using Thornton et al, 2001: Approach I:
� 2.29 When: ���/��� � 2 Eq. 3
� �0.113���/��� � 2.51 When: 2 � ���/��� � 10 Eq. 4
� 1.05 When: ���/��� � 10 Eq. 5
Where:
�� � Radius of curvature of the meander bend (m)
�� � Top width of channel (water surface) (m)
Stone Sizing for Critical Median Particle Size (D50 mm):
The method used was presented in the National Cooperative Highway Research Program Report 108
(Anderson, Paintal, and Davenport, 1970) as cited in Technical Supplement 14C: Stone Sizing Criteria,
from the National Engineering Handbook (2007). This method can be used for both high and low energy
applications, and provides a slightly more conservative value than that of the Shields parameter (1936).
The following equation has been modified to allow for imperial-metric conversions. It also uses �� from
Eq. 1. However, if located along a bend, � should be used (Eq. 3). Angular rock would provide further
stability, and a factor of safety of 2 can be applied to the D50 to ensure stability, particularly under ice-
flows.
��� � !"#
$%.&&'( ) ∗ 304.8 Eq. 6
Where:
��� � Median Particle Size (mm)
�� � Mean Boundary Shear Stress (N/m2)

47.88 � Conversion from N/m2 to lb/ft
2
304.8 � Conversion from ft to mm

Town of Wasaga Beach Nottawasaga River Shorewall Standards
Ainley Group File #212001 –December 2014 Report
APPENDIX C
HEC-RAS & HEC-SSP Modelling
(CD Only)
Town of Wasaga Beach Nottawasaga River Shorewall Standards
Ainley Group File #212001 –December 2014 Report
APPENDIX D
Photos
(CD Only)
File #:12001
Nottawasaga River, Wasaga Beach
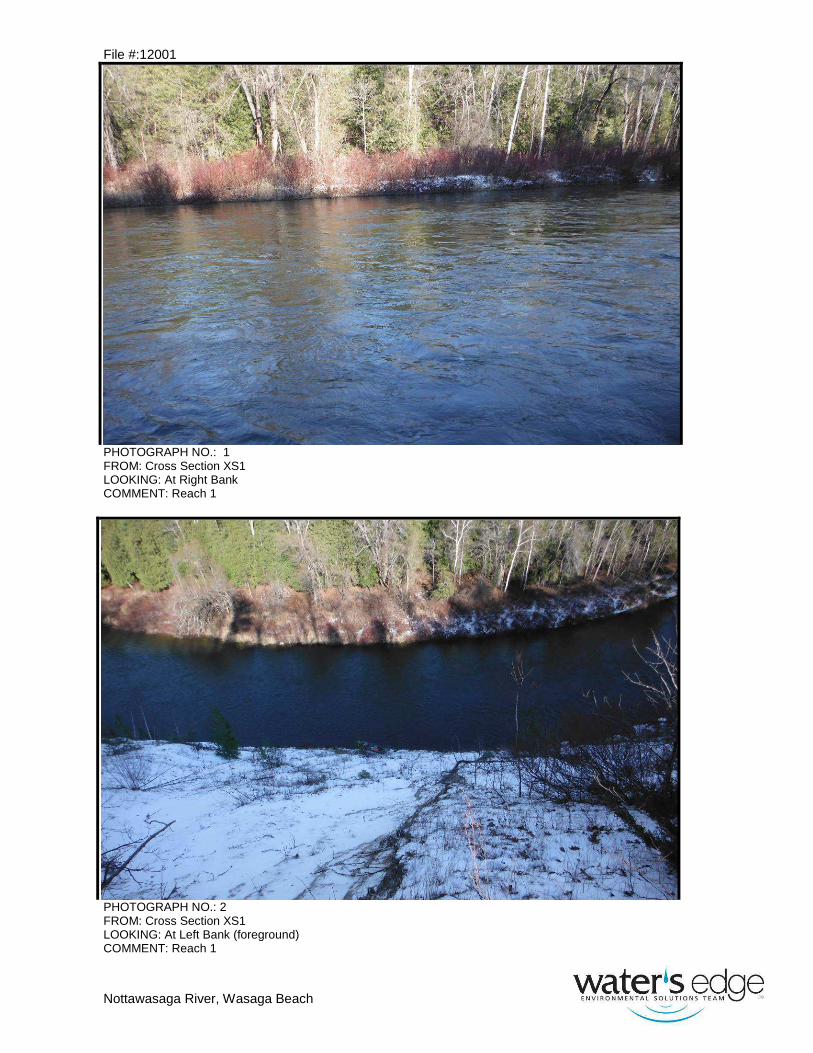
PHOTOGRAPH NO.: 1 FROM: Cross Section XS1 LOOKING: At Right Bank COMMENT: Reach 1
PHOTOGRAPH NO.: 2 FROM: Cross Section XS1 LOOKING: At Left Bank (foreground) COMMENT: Reach 1
File #:12001
Nottawasaga River, Wasaga Beach
PHOTOGRAPH NO.: 3 FROM: Cross Section XS1 LOOKING: Upstream COMMENT: Reach 1
PHOTOGRAPH NO.: 4 FROM: Cross Section XS1 LOOKING: Downstream COMMENT: Reach 1

File #:12001
Nottawasaga River, Wasaga Beach
PHOTOGRAPH NO.: 5 FROM: Cross Section XS3 LOOKING: At Right Bank COMMENT: Reach 1
PHOTOGRAPH NO.: 6 FROM: Cross Section XS3 LOOKING: At Left Bank COMMENT: Reach 1
File #:12001
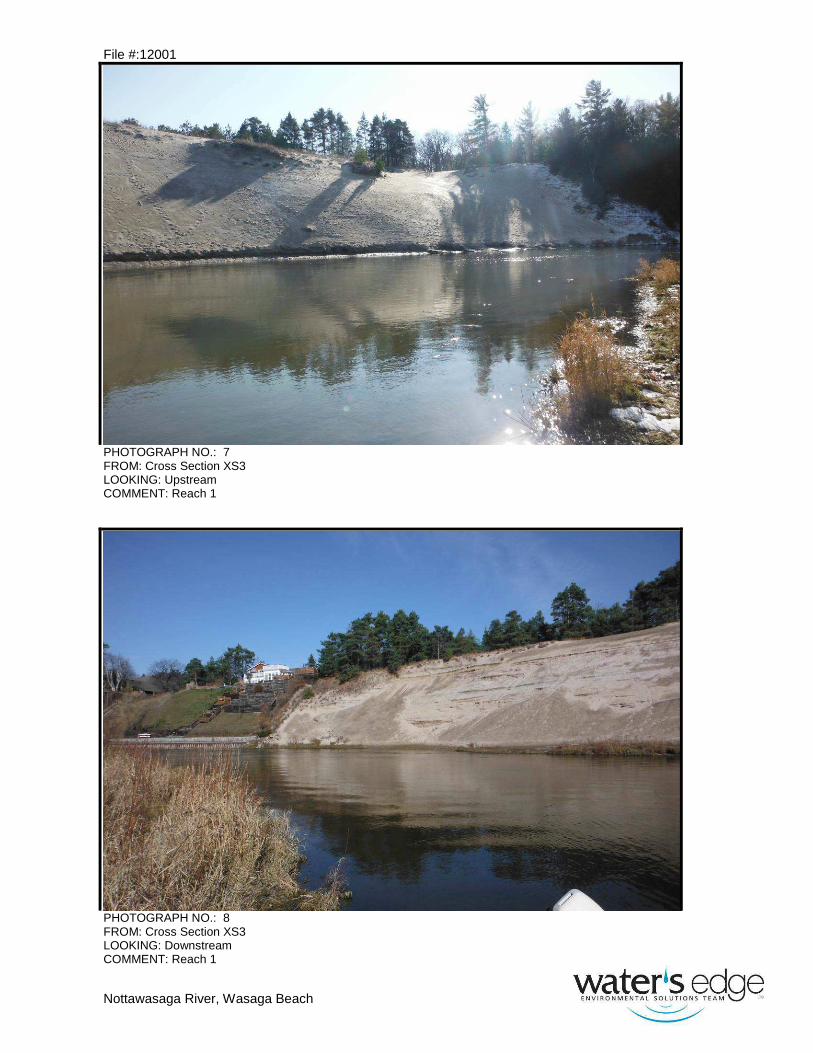
Nottawasaga River, Wasaga Beach
PHOTOGRAPH NO.: 7 FROM: Cross Section XS3 LOOKING: Upstream COMMENT: Reach 1
PHOTOGRAPH NO.: 8 FROM: Cross Section XS3 LOOKING: Downstream COMMENT: Reach 1

File #:12001
Nottawasaga River, Wasaga Beach
PHOTOGRAPH NO.: 9 FROM: Cross Section XS4 LOOKING: Downstream COMMENT: Reach 2
PHOTOGRAPH NO.: 10 FROM: Cross Section XS5 LOOKING: At Right Bank COMMENT: Reach 2

File #:12001
Nottawasaga River, Wasaga Beach
PHOTOGRAPH NO.: 11 FROM: Cross Section XS5 LOOKING: Upstream COMMENT: Reach 2
PHOTOGRAPH NO.: 12 FROM: Cross Section XS5 LOOKING: Downstream COMMENT: Reach 2

File #:12001
Nottawasaga River, Wasaga Beach
PHOTOGRAPH NO.: 13 FROM: Cross Section XS7 LOOKING: At Right Bank COMMENT: Reach 2
PHOTOGRAPH NO.: 14 FROM: Cross Section XS7 LOOKING: At Left Bank COMMENT: Reach 2

File #:12001
Nottawasaga River, Wasaga Beach
PHOTOGRAPH NO.: 15 FROM: Cross Section XS7 LOOKING: Downstream COMMENT: Reach 2
PHOTOGRAPH NO.: 16 FROM: Cross Section XS7 LOOKING: Upstream COMMENT: Reach 2

File #:12001
Nottawasaga River, Wasaga Beach
PHOTOGRAPH NO.: 17 FROM: Cross Section XS8 LOOKING: At Right Bank COMMENT: Reach 3
PHOTOGRAPH NO.: 18 FROM: Cross Section XS8 LOOKING: At Left Bank COMMENT: Reach 3

File #:12001
Nottawasaga River, Wasaga Beach
PHOTOGRAPH NO.: 19 FROM: Cross Section XS8 LOOKING: Upstream COMMENT: Reach 3
PHOTOGRAPH NO.: 20 FROM: Cross Section XS8 LOOKING: Upstream COMMENT: Reach 3

File #:12001
Nottawasaga River, Wasaga Beach
PHOTOGRAPH NO.: 21 FROM: Cross Section XS9 LOOKING: Right Bank COMMENT: Reach 3
PHOTOGRAPH NO.: 22 FROM: Cross Section XS9 LOOKING: Left Bank COMMENT: Reach 3

File #:12001
Nottawasaga River, Wasaga Beach
PHOTOGRAPH NO.: 23 FROM: Cross Section XS9 LOOKING: Downstream COMMENT: Reach 3
PHOTOGRAPH NO.: 24 FROM: Cross Section XS9 LOOKING: Upstream COMMENT: Reach 3

File #:12001
Nottawasaga River, Wasaga Beach
PHOTOGRAPH NO.: 25 FROM: Cross Section XS13 LOOKING: Right Bank COMMENT: Reach 3
PHOTOGRAPH NO.: 26 FROM: Cross Section XS13 LOOKING: Left Bank COMMENT: Reach 3

File #:12001
Nottawasaga River, Wasaga Beach
PHOTOGRAPH NO.: 27 FROM: Cross Section XS13 LOOKING: Downstream COMMENT: Reach 3
PHOTOGRAPH NO.: 28 FROM: Cross Section XS13 LOOKING: Upstream COMMENT: Reach 3

File #:12001
Nottawasaga River, Wasaga Beach
PHOTOGRAPH NO.: 29 FROM: Cross Section R2-XS2 LOOKING: Right Bank COMMENT: Reach 2
PHOTOGRAPH NO.: 30 FROM: Cross Section R2-XS2 LOOKING: Downstream COMMENT: Reach 2

File #:12001
Nottawasaga River, Wasaga Beach
PHOTOGRAPH NO.: 31 FROM: Cross Section R2-XS2 LOOKING: Upstream COMMENT: Reach 2