Embed Size (px)
Citation preview

NOTICE OF CONFIDENTIALITY: PORTION OF THIS DOCUMENT HAS BEEN FILED UNDER SEAL.
BEFORE THE PUBLIC UTILITIES COMMISSION
OF THE STATE OF COLORADO
* * * * *
RE: IN THE MATTER OF ADVICE LETTER NO. 1672-ELECTRIC FILED BY PUBLIC SERVICE COMPANY OF COLORADO TO REVISE ITS COLORADO PUC NO. 7-ELECTRIC TARIFF TO IMPLEMENT A GENERAL RATE SCHEDULE ADJUSTMENT AND OTHER RATE CHANGES EFFECTIVE JULY 18, 2014.
) ) ) ) PROCEEDING NO. 14AL-________E ) ) ) ) )
DIRECT TESTIMONY AND ATTACHMENTS OF MARK R. FOX
ON
BEHALF OF
PUBLIC SERVICE COMPANY OF COLORADO
June 17, 2014
BEFORE THE PUBLIC UTILITIES COMMISSION OF THE STATE OF COLORADO
* * * * *
RE: IN THE MATTER OF ADVICE LETTER NO. 1672-ELECTRIC FILED BY PUBLIC SERVICE COMPANY OF COLORADO TO REVISE ITS COLORADO PUC NO. 7-ELECTRIC TARIFF TO IMPLEMENT A GENERAL RATE SCHEDULE ADJUSTMENT AND OTHER RATE CHANGES EFFECTIVE JULY 18, 2014.
) ) ) ) PROCEEDING NO. 14AL-________E ) ) ) ) )
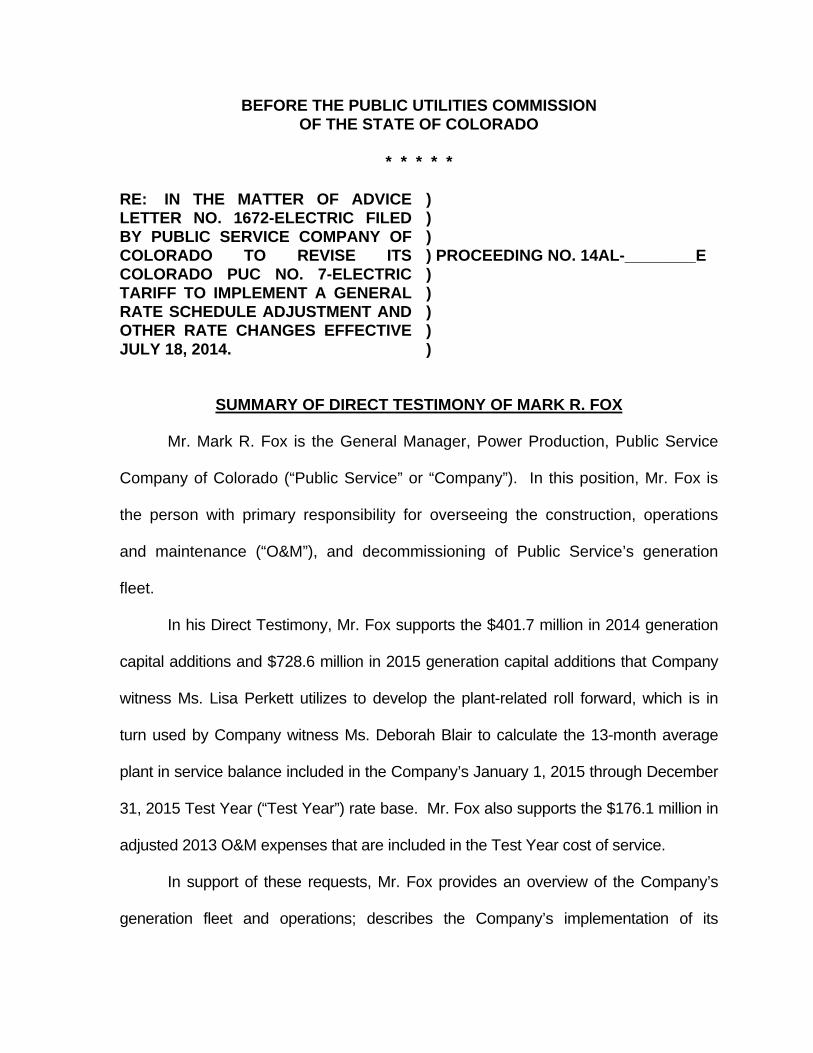
SUMMARY OF DIRECT TESTIMONY OF MARK R. FOX Mr. Mark R. Fox is the General Manager, Power Production, Public Service
Company of Colorado (“Public Service” or “Company”). In this position, Mr. Fox is
the person with primary responsibility for overseeing the construction, operations
and maintenance (“O&M”), and decommissioning of Public Service’s generation
fleet.
In his Direct Testimony, Mr. Fox supports the $401.7 million in 2014 generation
capital additions and $728.6 million in 2015 generation capital additions that Company
witness Ms. Lisa Perkett utilizes to develop the plant-related roll forward, which is in
turn used by Company witness Ms. Deborah Blair to calculate the 13-month average
plant in service balance included in the Company’s January 1, 2015 through December
31, 2015 Test Year (“Test Year”) rate base. Mr. Fox also supports the $176.1 million in
adjusted 2013 O&M expenses that are included in the Test Year cost of service.
In support of these requests, Mr. Fox provides an overview of the Company’s
generation fleet and operations; describes the Company’s implementation of its

compliance plan under the Clean Air-Clean Jobs Act (“CACJA”), including current
budgets and a discussion of variances from prior project estimates; describes how the
Company budgets are developed for generation-related projects other than CACJA
projects; identifies the Company’s generation-related capital additions and planned
decommissionings in 2014 and 2015 that are reflected in the Test Year presented by
Ms. Blair; and discusses the generation-related O&M expenses that are reflected in the
Test Year. Mr. Fox notes that the Company’s 2013 O&M expenses are subject to
adjustments to reflect reduced non-labor O&M expenses as a result of the Arapahoe 4
decommissioning, increased base commodities costs associated with new or upgraded
generation facilities for CACJA compliance, and elimination of a non-recurring expense,
in addition to an adjustment for labor expenses explained by Company witness Ms.
Ruth Lowenthal.
With respect to the Company’s implementation of its CACJA compliance plan,
Mr. Fox notes that while there are variances for each project, the most significant being
for the Pawnee emissions control project, the Company’s implementation of its CACJA
plan is now projected to be less than what the Company projected in Proceeding No.
10M-245E, where the Commission approved of the Company’s CACJA compliance
plan. In addition to presenting projected capital additions and O&M costs for CACJA
projects that impact the Test Year cost of service, Mr. Fox also gives an estimate of the
CACJA-related capital additions that the Company expects to incur in 2016 and 2017,
which the Company proposes to recover through a CACJA rider, subject to true-up.
The CACJA rider is discussed in more detail by Company witnesses Ms. Alice Jackson
and Mr. Scott Brockett.

Mr. Fox also describes the metrics used in the Company’s proposed generation
performance benchmarking plan – the Equivalent Availability Factor Mechanism –
which is also discussed by Ms. Jackson and included into the modified Electric
Commodity Adjustment clause presented by Mr. Brockett. This mechanism will provide
an incentive for the Company to improve unit availability and a penalty if performance
falls below specified levels. As Mr. Fox explains, using the Equivalent Availability
Factor (“EAF”) reported into the North America Electric Reliability Corporation (“NERC”)
Generating Availability Data System (“GADS”), as adjusted for certain identified special
circumstances, the plan will benchmark the performance of the Company’s Comanche,
Hayden, Pawnee, Fort St. Vrain, Rocky Mountain Energy Center, and Cherokee Unit 4
generating units against historic performance levels.
Mr. Fox recommends that the Colorado Public Utilities Commission
(“Commission”) approve the $401.7 million in 2014 generation capital additions and
$728.6 million in 2015 generation capital additions presented in my testimony as
reasonable and necessary to support Public Service’s generation operations; that the
Commission approve the 2013 O&M expense of $176.1 million, as adjusted, as
reasonable and necessary to support Public Service’s generation operations; and that
the Commission find that both levels of costs are a reasonable basis to set rates in the
Test Year cost of service.

BEFORE THE PUBLIC UTILITIES COMMISSION
OF THE STATE OF COLORADO
* * * * * RE: IN THE MATTER OF ADVICE LETTER NO. 1672-ELECTRIC FILED BY PUBLIC SERVICE COMPANY OF COLORADO TO REVISE ITS COLORADO PUC NO. 7-ELECTRIC TARIFF TO IMPLEMENT A GENERAL RATE SCHEDULE ADJUSTMENT AND OTHER RATE CHANGES EFFECTIVE JULY 18, 2014.
) ) ) ) PROCEEDING NO. 14AL-________E ) ) ) ) )
DIRECT TESTIMONY AND ATTACHMENTS OF MARK R. FOX
INDEX
SECTION PAGE
I. INTRODUCTION, QUALIFICATIONS, PURPOSE OF TESTIMONY, AND RECOMMENDATIONS……………………………………………………...........1
II. ENERGY SUPPLY FUNCTIONS AND ACTIVITIES...................................... 6 III. TEST YEAR CAPITAL ADDITIONS............................................................ 12
A. Overview .......................................................................................... 12
B. CACJA Projects ............................................................................... 16 C. Non-CACJA Capital Additions........................................................ 29
IV. ENERGY SUPPLY O&M EXPENSES ......................................................... 37 V. GENERATION PERFORMANCE BENCHMARKING PLAN....................... 45

LIST OF ATTACHMENTS
Attachment No. MRF-1
Energy Supply Capital Additions 2014 and 2015
Attachment No.
MRF-2
Cherokee 2x1 Combined Cycle Project Capital Cost Estimate
HIGHLY CONFIDENTIAL Attachment No. MRF-2A
Highly Confidential Version of Cherokee 2x1 Combined Cycle Project Capital Cost Estimate
Attachment No. MRF-3
Hayden SCR Project Capital Cost Estimate
HIGHLY CONFIDENTIAL Attachment No. MRF-3A
Highly Confidential Version of Hayden SCR Project Capital Cost Estimate
Attachment No. MRF-4
Pawnee SCR and Scrubber Project Capital Cost Estimate
HIGHLY CONFIDENTIAL Attachment No. MRF-4A
Highly Confidential Version of Pawnee SCR and Scrubber Project Capital Cost Estimate
Attachment No.
MRF-5
2013 O&M Expenditures by Object and FERC Account

GLOSSARY OF ACRONYMS AND DEFINED TERMS
Acronym/Defined Term Meaning
CACJA Clean Air-Clean Jobs Act
Commission Colorado Public Utilities Commission
CPCN Certificate of Public Convenience and Necessity
CT Combustion Turbine
ECA Electric Commodity Adjustment
EAF Equivalent Availability Factor
EAFPM Equivalent Availability Factor Performance Mechanism
EPM Enterprise Project Management
ERP Electric Resource Plan
FERC Federal Energy Regulatory Commission
GAAP Generally Acceptable Accounting Principles
GADS Generating Availability Data System
IRS Internal Revenue Service
NERC North America Electric Reliability Corporation
NMC Net Maximum Capacity
NOx Nitrous Oxides
O&M Operations and Maintenance
OMC Outside Management Control

Acronym/Defined Term Meaning
PCCA Purchased Capacity Cost Adjustment
PM Project Manager
Public Service, or Company
Public Service Company of Colorado
RPC Regional Planning Committee
SCR Selective Catalytic Reduction
SO2 Sulfur Dioxide
Test Year January 1, 2015 through December 31, 2015
Tri-State Tri-State Generation and Transmission
Xcel Energy Xcel Energy Inc.
XES Xcel Energy Services Inc.

BEFORE THE PUBLIC UTILITIES COMMISSION OF THE STATE OF COLORADO
* * * * *
RE: IN THE MATTER OF ADVICE LETTER NO. 1672-ELECTRIC FILED BY PUBLIC SERVICE COMPANY OF COLORADO TO REVISE ITS COLORADO PUC NO. 7-ELECTRIC TARIFF TO IMPLEMENT A GENERAL RATE SCHEDULE ADJUSTMENT AND OTHER RATE CHANGES EFFECTIVE JULY 18, 2014.
) ) ) ) PROCEEDING NO. 14AL-________E ) ) ) ) )
DIRECT TESTIMONY AND ATTACHMENTS OF MARK R. FOX
I. INTRODUCTION, QUALIFICATIONS, PURPOSE OF TESTIMONY, AND 1 RECOMMENDATIONS 2
Q. PLEASE STATE YOUR NAME AND BUSINESS ADDRESS. 3
A. My name is Mark R. Fox. My business address is 5460 W. 60th Avenue, 4
Arvada, Colorado 80003. 5
Q. BY WHOM ARE YOU EMPLOYED AND IN WHAT CAPACITY? 6
A. I am employed by Public Service Company of Colorado (“Public Service” or 7
“Company”) as General Manager, Power Production. 8
Q. ON WHOSE BEHALF ARE YOU TESTIFYING IN THE PROCEEDING? 9
A. I am testifying on behalf of Public Service. 10
Q. PLEASE BRIEFLY EXPLAIN YOUR DUTIES AND RESPONSIBILITIES. 11
A. Within the Energy Supply Business Area, I have primary responsibility for 12
overseeing the construction, operations and maintenance (“O&M”), and 13

2
decommissioning of Public Service’s generation fleet. In this capacity, I am 1
responsible for the development and execution of O&M and capital budgets 2
for these units. A statement of my education and relevant experience is set 3
forth in Attachment A. 4
Q. WHAT IS THE PURPOSE OF YOUR DIRECT TESTIMONY? 5
A. The purpose of my testimony is to support the $401.7 million in 2014 generation 6
capital additions and $728.6 million in 2015 generation capital additions that 7
Company witness Ms. Lisa Perkett utilizes to develop the plant-related roll 8
forward, which is in turn used by Company witness Ms. Deborah Blair to 9
calculate the 13-month average plant in service balance included in the 10
Company’s January 1, 2015 through December 31, 2015 Test Year (“Test 11
Year”) rate base. 12
I also support $176.1 million in adjusted 2013 O&M expenses for the 13
Energy Supply Business Area that are included in the Test Year cost of service. 14
The O&M costs that I support reflect actual labor costs incurred in 2013 for 15
Energy Supply. Company witness Ms. Ruth Lowenthal supports the increase in 16
labor expenses due to merit and base salary increases for non-bargaining and 17
bargaining employees through December 31, 2015, and Ms. Blair quantifies the 18
increase in total labor expenses included in the Test Year. 19
To support the generation capital additions for 2014 and 2015 and 20
Energy Supply’s O&M expenses included in the Test Year, I provide the 21
following: 22
A description of the Company’s generation fleet and operations; 23

3
Support for the Company’s implementation of its Commission-approved plan 1
under the Clean Air-Clean Jobs Act (“CACJA"). As part of this support, I 2
provide current budgets for our CACJA projects, explaining variances from 3
the capital expenditure estimates we previously provided to the Commission 4
in the course of certificate of public convenience and necessity (“CPCN”) or 5
other related proceedings for these projects, and also comparing our 6
currently budgeted capital costs to implement our CACJA compliance plan 7
to what we estimated in our CPCN requests; 8
Details regarding the Company’s budgeting process for generation-related 9
capital projects other than CACJA projects; 10
Identification of the Company’s generation-related capital additions and 11
planned decommissions in 2014 and 2015 that are reflected in the Test Year; 12
and 13
Support for the level of generation-related O&M expenses (other than the 14
anticipated increase to the labor portion of these expenses, which is 15
supported by Ms. Lowenthal and Ms. Blair) reflected in the Test Year, 16
including proposed adjustments to reflect reduced non-labor O&M expenses 17
as a result of the Arapahoe 4 decommissioning, increased base commodities 18
costs associated with new or upgraded generation facilities for CACJA 19
compliance, and elimination of a non-recurring expense. 20
In presenting projected capital and O&M cost information, I also provide 21
estimates of, and support for, the CACJA related capital additions that the 22
Company requests to recover in 2016 and 2017 through the Company’s 23

4
proposed CACJA rider. The CACJA rider is discussed in more detail by 1
Company witnesses Ms. Alice K. Jackson and Mr. Scott Brockett. 2
I also describe the metrics used in the Company’s proposed Generation 3
Performance Benchmarking Plan – the Equivalent Availability Factor 4
Performance Mechanism (“EAFPM”) – which is also discussed by Ms. Jackson 5
and included into the modified Electric Commodity Adjustment (“ECA”) clause 6
presented by Mr. Brockett. This mechanism will provide an incentive for the 7
Company to improve unit availability and a penalty if performance falls below 8
specified levels. Using the Equivalent Availability Factor (“EAF”) reported into 9
the North America Electric Reliability Corporation (“NERC”) Generating 10
Availability Data System (“GADS”), as adjusted for certain identified special 11
circumstances, the plan will benchmark the performance of the Company’s 12
Comanche, Hayden, Pawnee, Fort St. Vrain, Rocky Mountain Energy Center, 13
and Cherokee Unit 4 generating units against historic performance levels. 14
Q. ARE YOU SPONSORING ANY ATTACHMENTS WITH YOUR 15
TESTIMONY? 16
A. Yes. I am sponsoring the following Attachments: 17
Attachment No. MRF-1 (Energy Supply Capital Additions 2014 and 18
2015); 19
The public and highly confidential version of Attachment No. MRF-2 20
(Cherokee 2x1 Combined Cycle Project Capital Cost Estimate); 21
The public and highly confidential version of Attachment No. MRF-3 22
(Hayden SCR Project Capital Cost Estimate); 23

5
The public and highly confidential version of Attachment No. MRF-4 1
(Pawnee SCR and Scrubber Project Capital Cost Estimate); and 2
Attachment No. MRF-5 (2013 O&M Expenditures by Object and 3
Federal Energy Regulatory Commission (“FERC”) Account) 4
Q. WHAT RECOMMENDATIONS ARE YOU MAKING IN YOUR TESTIMONY? 5
A. I recommend that the Commission approve the $401.7 million in 2014 6
generation capital additions and $728.6 million in 2015 generation capital 7
additions presented in my testimony as reasonable and necessary to support 8
Public Service’s generation operations; that the Commission approve the 2013 9
O&M expense of $176.1 million, as adjusted, as reasonable and necessary to 10
support Public Service’s generation operations; and that the Commission find 11
that both levels of costs are a reasonable basis to set rates in the Test Year cost 12
of service. 13

6
II. ENERGY SUPPLY FUNCTIONS AND ACTIVITIES 1
Q. PLEASE PROVIDE AN OVERVIEW OF THE COMPANY’S GENERATION 2
BUSINESS AREA. 3
A. Public Service’s generation activities are to a large extent centrally managed by 4
the Energy Supply Business Area of Xcel Energy Services Inc. (“XES”), Public 5
Service’s service company affiliate. By coordinating activities through XES, the 6
Xcel Energy Inc. (“Xcel Energy”) utility companies are able to share best 7
practices and achieve efficiencies. The focus of Energy Supply is to help 8
coordinate and to provide support services for the construction, operation, 9
maintenance, decommissioning, and dismantling of the electric generating 10
facilities of Public Service and its sister utility companies within the Xcel Energy 11
Inc. system in a safe, reliable, cost-effective, and environmentally-sound 12
manner. Energy Supply is also responsible for electric generation dispatch and 13
environmental compliance oversight for these generating plants. 14
There are a total of approximately 2,215 employees in the Energy 15
Supply Business Area in the Xcel Energy system. Of this number, Public 16
Service employs approximately 820 people, most of whom work in our 17
generation plants. 18
Q. PLEASE DESCRIBE PUBLIC SERVICE’S GENERATION PORTFOLIO. 19
A. Public Service serves its electric, retail, and wholesale customers in Colorado 20
with power purchased pursuant to long-term power purchase agreements or 21
power generated by its own power plants. The focus of my testimony is 22
limited to the generation that is owned by the Company. We recover all of our 23

7
capacity and energy costs associated with our purchased power resources 1
through a combination of the Purchased Capacity Cost Adjustment (“PCCA”) 2
and ECA riders, which are annually reviewed by the Commission in other 3
proceedings, not through base rates. 4
Public Service’s owned generating plants have a net maximum 5
capacity of over 5,400 MW and represent 55 percent of the total generation 6
capacity available to serve our customers. Our generating facilities use a 7
variety of fuel sources including coal, natural gas, water (hydro), and, at 8
present, wind. Table 1 below provides a breakout of Company-owned 9
generation units and total capacity by fuel type. 10
Table 1 Summary of Current Generation Units and Capacity
2013 Type
No. of Units Total MWs
Coal 12 2,661
Gas 16 2,158
Mixed Fuel 2 244
Hydro 11 350
Wind 1 26
In 2018, after the implementation of our CACJA compliance plan and the 11
retirement of Arapahoe Unit 4 and the Ponnequin wind units, the profile of our 12
generation fleet will be as shown in Table 2 below. 13

8
Table 2 Summary of Post-CACJA Generation Units and Capacity
2018 Type
No. of Units Total MWs
Coal 8 2,008
Gas 21 3,079
Mixed Fuel 1 60
Hydro 11 350
Wind 0 0
Q. PLEASE IDENTIFY THE CURRENT GENERATING UNITS IN PUBLIC 1
SERVICE’S GENERATION PORTFOLIO. 2
A. Public Service’s current generating fleet presently includes the following 3
facilities, several of which will undergo significant changes pursuant to our 4
CACJA compliance plan that I discuss in more detail later in my testimony: 5
Coal: 6
Arapahoe Generating Station: originally consisting of four units, this 7
two-unit 149 MW generating facility located just south of downtown Denver 8
was retired on December 31, 2013; 9
Cherokee Generating Station: presently a two unit, 504 MW 10
generating facility located just north of downtown Denver. Unit 2 was retired 11
and converted to a synchronous condenser in 2012 and will continue to 12
operate in that mode. Unit 3 will be retired in 2015 after the new combined 13
cycle facility (Units 5, 6, and 7) at Cherokee station is in-service. Unit 4 is 14
fueled by coal but is configured to be gas fired as a support fuel. This unit will 15
be converted to gas-only operation at the end of 2017; 16

9
Comanche Generating Station: a three unit, 1,443 MW generating 1
station in which Public Service has rights to 1,182 MW, located in Pueblo, 2
Colorado; 3
Craig Generating Station: a three unit, 2,183 MW generating facility 4
located in Craig, Colorado in which Public Service has rights to 84 MW of 5
capacity from two units. This facility is operated by Tri-State as part of the 6
Yampa Project; 7
Hayden Generating Station: a two unit, 446 MW generating facility 8
located in Hayden, Colorado. Public Service operates this plant on behalf of 9
itself and three other co-owners as part of the Yampa Project. Public Service 10
has rights to 237 MW of capacity from the two units. We are adding 11
emissions control equipment to Hayden plant as part of our CACJA 12
compliance plan; and 13
Pawnee Generating Station: a one unit, 505 MW generating facility 14
located in Brush, Colorado. We are adding emissions control equipment to 15
Pawnee plant as part of our CACJA compliance plan. 16
Natural Gas: 17
Blue Spruce Energy Center: a two unit, 300 MW simple cycle 18
generating plant located in Aurora, Colorado; 19
Fort St. Vrain Generation Station: a six unit, 1,035 MW combined and 20
simple cycle generating plant that was repowered with gas after the nuclear 21
plant on the site was decommissioned in 1989. This facility is located in 22
Platteville, Colorado; 23

10
Rocky Mountain Energy Center: a three unit, 615 MW combined cycle 1
generating facility located in Hudson, Colorado; 2
Alamosa: a two unit, 35 MW simple cycle gas peaking facility, located 3
in Alamosa, Colorado; 4
Ft. Lupton: a two unit, 100 MW simple cycle gas peaking facility, 5
located in Ft. Lupton, Colorado; and 6
Fruita: a single unit, 20 MW single cycle gas peaking facility, located in 7
Fruita, Colorado. 8
Mixed Fuel: 9
Valmont Generating Station: a two unit, 237 MW generating facility. 10
Unit 5 is a 184 MW coal-fired unit that can also use natural gas as a fuel and 11
will be retired at the end of 2017. Unit 6 is a 53 MW simple cycle combustion 12
turbine that uses natural gas as a fuel. The original four units have been 13
retired. The facility is located in Boulder, Colorado; and 14
Zuni Generating Station: a one unit, 60 MW generating station fueled 15
by either natural gas or oil, located near downtown Denver. 16
Hydro: 17
Ames Hydro Generating Station: A one unit, 3.8 MW generating 18
facility located near Ophir, Colorado; 19
Cabin Creek Generating Station: A two unit, 324 MW generating 20
facility located near Georgetown, Colorado; 21
Georgetown Hydro Generating Station: A two unit, 1.6 MW generating 22
facility located in Georgetown, Colorado; 23
11
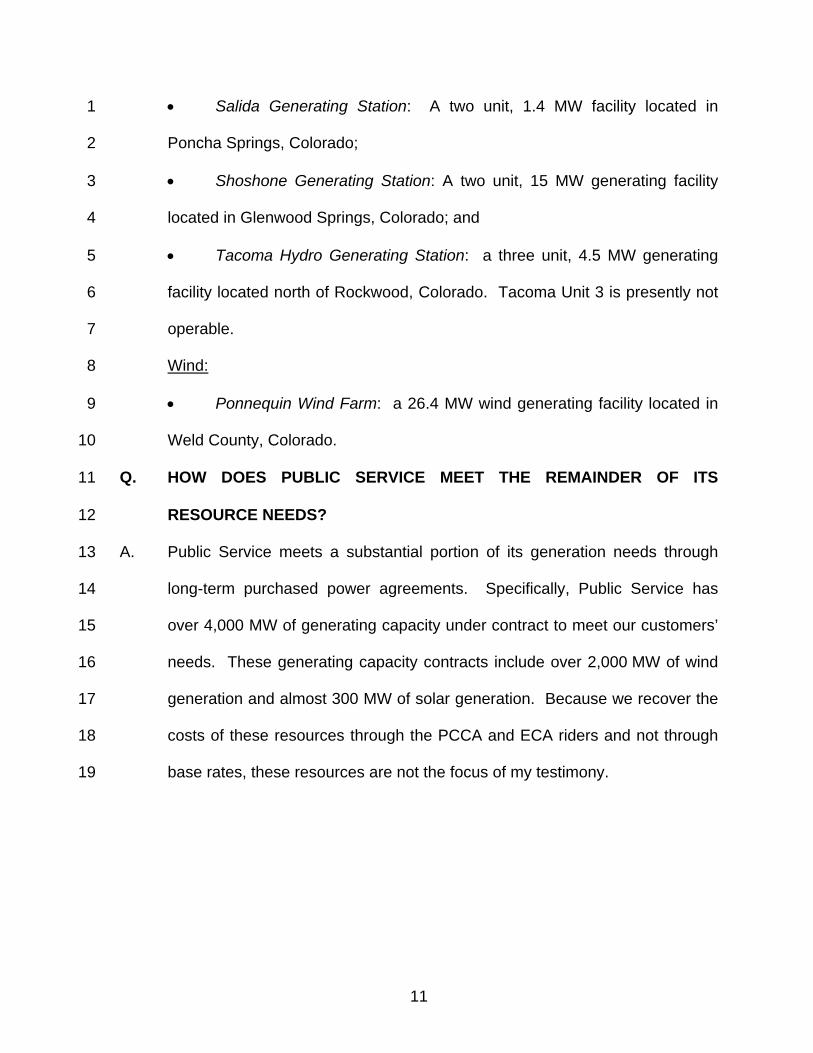
Salida Generating Station: A two unit, 1.4 MW facility located in 1
Poncha Springs, Colorado; 2
Shoshone Generating Station: A two unit, 15 MW generating facility 3
located in Glenwood Springs, Colorado; and 4
Tacoma Hydro Generating Station: a three unit, 4.5 MW generating 5
facility located north of Rockwood, Colorado. Tacoma Unit 3 is presently not 6
operable. 7
Wind: 8
Ponnequin Wind Farm: a 26.4 MW wind generating facility located in 9
Weld County, Colorado. 10
Q. HOW DOES PUBLIC SERVICE MEET THE REMAINDER OF ITS 11
RESOURCE NEEDS? 12
A. Public Service meets a substantial portion of its generation needs through 13
long-term purchased power agreements. Specifically, Public Service has 14
over 4,000 MW of generating capacity under contract to meet our customers’ 15
needs. These generating capacity contracts include over 2,000 MW of wind 16
generation and almost 300 MW of solar generation. Because we recover the 17
costs of these resources through the PCCA and ECA riders and not through 18
base rates, these resources are not the focus of my testimony. 19
12
III. TEST YEAR CAPITAL ADDITIONS 1
A. Overview 2
Q. PLEASE SUMMARIZE THE CAPITAL ADDITIONS THAT ENERGY SUPPLY 3
WILL MAKE DURING 2014 AND 2015? 4
A. We are placing $401.7 million of capital additions in service in 2014, and 5
$728.6 million of capital additions in service in 2015. 6
Attachment No. MRF-1 provides additional detail regarding the capital 7
additions for the base period of 2014 through 2015. The columns in this 8
spreadsheet provide the following information: 9
Column A Work Order Number The parent project number used to denote the project
Column B Description A brief description of the project from our budget system
Column C Estimated In-Service Date The date the project is expected to be placed into service
Columns D and E
Years 2014 and 2015 The annual amount budgeted to be placed into service for each respective year.
Column F CACJA Identification of CACJA compliance projects
Q. PLEASE SUMMARIZE THE MAJOR PROJECTS THAT WILL BE PLACED 10
IN-SERVICE IN 2014. 11
A. A little less than 75 percent of our budgeted capital additions for 2014 are 12
associated with the installation of SCR technology and new scrubbers at Unit 13
1 of our Pawnee generating station as part of our CACJA implementation 14
efforts, which I describe further below. This capital addition is budgeted at 15

13
approximately $296 million. The remainder of our 2014 capital budget is 1
related to routine maintenance work at our plants. This includes additional 2
replacements and upgrades at our Pawnee station, such as replacement of 3
the air heating baskets at Unit 1 budgeted as a capital addition of $4.5 million; 4
as well as additional maintenance work at Unit 1 of our Comanche station, 5
such as the replacement of the Unit 1 coal piping which is budgeted as a 6
capital addition of $1.8 million. 7
Q. WHAT ARE THE MAJOR PROJECTS THAT WILL BE PLACED IN-8
SERVICE IN 2015? 9
A. Approximately 90 percent of our budgeted capital additions for 2015 relate to 10
CACJA projects. The principal cost is the repowering of our Cherokee station 11
to natural gas. This includes the installation of the new 2x1 combined cycle 12
facility at Cherokee, consisting of combined cycle combustion turbines at new 13
Cherokee Unit 5, budgeted for approximately $127 million in capital additions; 14
installation of combined cycle combustion turbines at new Cherokee Unit 6, 15
budgeted for approximately $126 million in capital additions; installation of 16
combined cycle steam turbines at new Cherokee Unit 7, budgeted for 17
approximately $103 million in capital additions; and common costs for this 18
work at the Cherokee station of approximately $243 million in capital 19
additions. All combined, these capital additions are budgeted for 20
approximately $600 million. An additional approximately $58 million in capital 21
additions is related to installation of SCR technology at Unit 1 of our Hayden 22
station, which is also part of our CACJA upgrades. 23

14
The remainder of our budget capital additions for 2015 relate to routine 1
maintenance work. Our 2015 capital budget also includes the costs 2
associated with the decommissioning and dismantling of the Arapahoe 3
Generating Station. 4
Q. PLEASE DISCUSS THE DECOMMISSIONING AND DECONSTRUCTION OF 5
THE ARAPAHOE STATION. 6
A. The Arapahoe Station was a four-unit coal-fired power plant. Units 1 and 2 were 7
shut down in 2003 due to our efforts to reduce emissions in the metro-Denver 8
area. As part of our CACJA compliance plan, we shut down Unit 3 at the end of 9
2013, as well as Unit 4 after obtaining Commission approval in our most recent 10
Electric Resource Plan proceeding (Docket No. 11A-869E) to shutdown that unit 11
instead of converting it to gas-only operation. Because none of the units are 12
operating any longer, we will be dismantling the plant and restoring the site. We 13
are submitting a decommissioning plan concurrent with this rate case filing. 14
We have budgeted approximately $34.8 million in retirement funding for 15
the decommissioning work. We have performed preliminary work to ensure that 16
the vacant plant continues to be safe to those around it and those who will be 17
performing the deconstruction work. We are currently in the engineering and 18
contracting phases of this project and expect to begin performing the physical 19
dismantling sometime in 2015. Ms. Perkett and Ms. Blair discuss how the costs 20
of the decommissioning were developed and would be recovered through rates, 21
respectively. 22

15
Q. WHY IS THE PONNEQUIN WIND FARM BEING RETIRED? 1
A. The Ponnequin Wind Farm makes up about 25 MW of Public Service’s total 2
2,140 MW of wind generation. It was built in a series of phases between 1999 3
and 2001, and will reach the end of its 15-year life in about 2015. We have 4
determined that the capital investments and ongoing O&M costs necessary to 5
continue the life of this facility are not justified. Therefore, we plan to retire the 6
Ponnequin facility in 2015. 7
The steel and bolts for this facility will reach the end of their engineering 8
life in 2018/2019, leading to structural fatigue and safety risks associated with 9
the towers possibly falling and causing injuries. Further, we are experiencing 10
failures of the gearboxes, generators, and turbine bearings at an increasing rate 11
which would require us to eventually replace all of the turbines over the course 12
of several years. Finally, due to the vintage of these turbines, spare parts can 13
be costly and difficult to source. Our analysis indicates that replacing this facility 14
with market wind purchases would be the least cost alternative for our 15
customers in lieu of investing in the continued life of the facility. 16
Ms. Perkett discusses the remaining depreciable life of this asset and the 17
financial and rate impact of its retirement in 2015. 18
Q. HOW IS THE INFORMATION PROVIDED BY YOU HERE INCORPORATED 19
INTO THE TEST YEAR? 20
A. Ms. Perkett uses Energy Supply’s capital additions budget to develop the plant-21
related roll forward that is used by Ms. Blair to calculate the 13-month average 22
plant in-service balance used to calculate the Test Year rate base. Ms. Blair 23

16
provides further discussion regarding the rate-making implications of our 1
capital additions. 2
Q. ARE YOU CONFIDENT THAT THESE PLANNED CAPITAL ADDITIONS 3
WILL MEET THEIR CURRENT BUDGETS AND BE PLACED INTO 4
SERVICE BY THE END OF THE TEST YEAR? 5
A. Yes. The capital additions related to CACJA have been planned for a long 6
period of time, and there are no indications that we will need to materially revise 7
our capital budgets for this work or that they will be delayed. As to our routine 8
maintenance capital additions, they are within a reasonably predictable range 9
from year to year. 10
B. CACJA Projects 11
Q. WHAT IS THE CLEAN AIR-CLEAN JOBS ACT (CACJA)? 12
A. In 2010, the Colorado legislature enacted the CACJA to assist in achieving 13
the State’s air quality goals. Prompted in part by the possibility of federal 14
intervention into air regulation in the Denver metro area due to multiple 15
pending air mandates, CACJA required Public Service to submit an emissions 16
reduction plan that included the retirement or fuel-switching of a minimum of 17
900 megawatts of coal-fired generation, which would have to be fully 18
implemented by December 31, 2017. Public Service filed its proposed 19
CACJA compliance plan with the Commission in August 2010, in Proceeding 20
No. 10M-245E, which the Commission approved with modifications in 21
December 2010. Ms. Jackson goes into more detail regarding certain CACJA 22
requirements in her direct testimony. 23

17
Q. PLEASE DESCRIBE PUBLIC SERVICE’S CACJA COMPLIANCE PLAN. 1
A. To comply with CACJA, we are undertaking a variety of projects to 2
significantly reduce the overall emissions of our generation fleet. The 3
Commission approved a plan requiring the early retirement of five Public 4
Service coal-fired generation units, the installation of emission controls at 5
three other coal-fired units, the fuel conversion of two more coal units to 6
natural gas, and the construction of a new combined cycle natural gas plant 7
at our Cherokee station. Subsequently, the Commission approved retiring 8
Arapahoe Unit 4 in a joint order addressing our Electric Resource Plan 9
(“ERP”) filing (Proceeding No. 11A-869E) and application for the early 10
retirement of Arapahoe Unit 4 (Proceeding No. 12A-785E), rather than having 11
the unit converted to gas as provided in the original CACJA order. The 12
projects we are implementing as a result of CACJA and subsequent 13
Commission orders are as follows: 14

18
Table 3 CACJA Projects
Unit Action Date CPCN
Proceeding
Cherokee 1 Retirement 2012 11A-303E
Cherokee 2 Retirement and Conversion to a
Synchronous Condenser 2011
11A-303E; 11A-209E
Cherokee 3 Retirement 2015 N/A
Cherokee 4 Conversion to Gas 2017 N/A
Cherokee 5-7 New Construction 2015 11A-609E
Arapahoe 3
Retirement (initial approval to convert
to synchronous condenser)
2013 N/A
Arapahoe 4 Retirement
(initial approval to convert to gas)
2014 N/A
Valmont 5 Retirement 2017 N/A
Hayden 1 Selective Catalytic
Reduction 2015 11A-917E
Hayden 2 Selective Catalytic
Reduction 2016 11A-917E
Pawnee Selective Catalytic
Reduction and Scrubbers 2014 11A-325E
Q. WHAT CACJA CAPITAL ADDITIONS DOES PUBLIC SERVICE PROPOSE 1
TO INCLUDE IN THE TEST YEAR? 2
A. Public Service is requesting cost recovery through base rates for the following 3
CACJA capital projects with 2014 and 2015 in-service dates: 4
In August 2014 we will have completed installation of selective catalytic 5
reduction (“SCR”) technology at Unit 1 of our Pawnee facility to control 6

19
nitrous oxides (“NOx”), as well as added new scrubbers to control 1
sulfur dioxide (“SO2”) emissions; 2
As discussed by Ms. Jackson these projects will serve as the baseline 3
for the proposed CACJA Rider; 4
The conversion of the Cherokee station from coal to natural gas occurs 5
in 2015. This involves the shutdown of Cherokee Unit 3 (Units 1 and 2 6
were shutdown in 2012 and 2011, respectively), and the start-up of a 7
569 MW combined cycle gas plant at Cherokee (Units 5, 6, and 7) to 8
begin operation in 2015; and 9
SCR technology is being installed at Unit 1 at our Hayden station 10
during 2015 to control the emissions of NOx. 11
Together, these projects constitute a major part of our compliance with the 12
Commission’s CACJA and subsequent, related orders, representing 13
approximately $296 million in 2014 or nearly 75 percent of Energy Supply’s 14
2014 capital additions, and $658 million in 2015 or approximately 90 percent 15
of our 2015 capital additions. 16
Q. WILL ALL CACJA CAPITAL PROJECTS BE IN SERVICE BY THE END OF 17
THE TEST YEAR? 18
A. No. We will have additional work to complete beyond 2015. 19
In 2016, we will install SCR technology at Hayden Unit 2, which we 20
estimate to be a $36.1 million capital addition. We will also have some follow-21
on costs related to the conversion of our Cherokee station conversion to gas 22

20
(Units 5, 6, and 7) in 2016, which we estimate will be a capital addition of 1
$3.2 million. 2
In 2017, Cherokee Unit 4 will be converted to natural gas and Valmont 3
Unit 5 will be retired. Because Cherokee Unit 4 is already configured to be 4
fired by natural gas, conversion of this unit from coal to gas consists mainly of 5
ceasing coal operations and no capital modifications to the plant will be made. 6
Additionally, although we will be retiring Valmont Unit 5, the remaining simple 7
cycle combustion turbine at the Valmont station will remain in-service after 8
Unit 5 is retired, and so we do not have a capital budget for dismantling the 9
plant. Ms. Perkett discusses the impact of the retirement of Valmont Unit 5 10
on rates. 11
Public Service is proposing that the capital additions representing the 12
2016 and 2017 CACJA projects be approved for recovery, subject to true-up, 13
through a CACJA rider that will start in 2016.Ms. Jackson and Mr. Brockett 14
discuss our proposed CACJA rider and recovery of 2016 and 2017 CACJA 15
project capital costs. 16
Q. WILL IMPLEMENTATION OF THE CACJA PROJECTS ALSO AFFECT 17
PUBLIC SERVICE’S O&M COSTS? 18
A. Yes. The new 2x1 combined cycle facility at Cherokee and the emissions 19
control projects at Hayden and Pawnee will increase our use of chemicals 20
and water, referred to as base commodities, at those plants to control 21
emissions. As I detail later in my testimony, we are requesting an adjustment 22

21
of $7.2 million to the historic 2013 O&M expenses to account for this 1
increased CACJA-related O&M cost in the Test Year. 2
However, because Cherokee Units 5, 6, and 7, and the SCR 3
installation at Hayden Unit 1 will be in service for only the second half of the 4
Test Year, the balance of the annual incremental increase in base 5
commodities for those CACJA projects will not be incurred until 2016. 6
Similarly, half of the annual incremental increase in base commodities for the 7
installation of SCR at Hayden Unit 2 will be incurred in the second half of 8
2016 when that CACJA project goes into service, with the balance of the 9
annual increase occurring in the first half of 2017. In addition, Cherokee Unit 10
3 will be retired in 2016, creating savings of approximately $900,000. We are 11
requesting that the Commission account for these costs in our CACJA Rider, 12
subject to true-up. 13
Q. PLEASE DESCRIBE HOW THE CACJA PROJECTS WERE BUDGETED. 14
A. The CACJA projects were not developed and budgeted in the course of our 15
regular budgeting process, but rather in response to the specific requirements 16
of the CACJA legislation. 17
In our proposed CACJA compliance plan, we provided capital cost 18
estimates for each project. We developed our capital cost estimates with the 19
assistance of third-party engineering firms. This involved the engineering 20
consultants developing their cost estimates based on their expertise and 21
experience, which we then refined based on our accounting practices, 22
company experience, and ancillary overhead costs. 23

22
The Commission found that our capital cost information was sufficient 1
for approving our plan, but was too high-level for ratemaking purposes. The 2
Commission therefore ordered us to provide more detailed capital cost 3
information in the course of obtaining CPCNs for our CACJA projects, which 4
we did. To be clear, the CPCN estimates addressed the capital expenditures 5
we anticipated to be incurred to build the project. Upon completion, a 6
project’s actual capital cost is one of several components used to determine 7
its value as plant in service for the purpose of setting rates. Ms. Perkett 8
discusses the development of the values for the capital additions we are 9
proposing to add to our rate base in this proceeding. 10
Q. PLEASE DESCRIBE THE MORE DETAILED CAPITAL COST 11
INFORMATION PROVIDED IN THE CPCN PROCEEDINGS? 12
A. After verifying their accuracy, we presented our previous estimates with much 13
greater supporting detail, which also reflected changes we determined should 14
be made with respect to material costs, as well as likely escalation because 15
the CACJA estimates were in 2010 dollars while the projects will be built and 16
paid for in 2012 to 2016 dollars. As discussed in each of the CPCN 17
proceedings, our estimates were developed according to industry standards for 18
initial cost estimation and included a range of accuracy of approximately +/- 19
20 percent, which is typical industry practice for estimating project costs at 20
that stage of development. This range narrows as an individual project 21
comes closer to construction and completion. For those CACJA projects that 22
have been completed, we have actual costs that can be compared to the CPCN 23

23
estimates. For those CACJA projects that are currently in construction, we have 1
narrowed the range of accuracy from +/- 20 percent included in the CPCN 2
estimates, as I discuss in more detail below. 3
Q. HOW DO THE COSTS OF THE PROJECTS COMPARE WITH THE 4
UPDATED ESTIMATES PUBLIC SERVICE PROVIDED THE COMMISSION? 5
A. Table 4 provides a comparison of our CPCN capital expenditure estimates to 6
our current budgeted capital expenditure estimates for the projects, several of 7
which have been completed. Our current budgeted expenditures are 8
approximately $18.3 million or approximately 2 percent over our CPCN 9
estimates. 10
Table 4 Comparison of CACJA Project
CPCN Estimates and Current Budgeted/Actual Costs
Project Title CPCN
Estimated Budget
Current Budget
Variance Status
Cherokee 2 Synchronous Condenser
$ 9,478,000 $ 8,829,540 -$648,460 Project Complete
Cherokee 2x1 Combined Cycle
$531,525,000 $531,525,000 -- In Construction
Cherokee 1& 2 Retirement $ 23,050,000 $ 21,645,545 -$1,404,455 Project Complete
Hayden 1 SCR $ 55,803,000 $ 55,803,000 -- In Construction
Hayden 2 SCR $ 34,040,000 $ 34,064,000 +24,000 In Construction
Pawnee Scrubber and SCR
$252,045,000 $272,338,000 +$20,293,00
0 In Construction
Total Cost $905,941,000 $924,205,085 +$18,264,08
5

24
Q. WHAT COMMENTS DO YOU HAVE ABOUT THE VARIANCE BETWEEN 1
THE ACTUAL OR UPDATED BUDGETED COSTS AND THE COSTS 2
PROJECTED IN THE CPCN PROCEEDINGS? 3
A. As Table 4 shows, we are over budget as compared to our CPCN estimates 4
almost entirely due to one project, the Pawnee Scrubber and SCR Project. The 5
$20.3 million overage represents an 8 percent increase over our CPCN 6
estimate, which is well within our range of accuracy for that project. I provide 7
more detail about the status of that project and all of the other CACJA projects 8
below. 9
Moreover, if you compare our current estimated project costs to what we 10
projected for implementation of our entire CACJA plan at the time the 11
Commission approved it, we are projecting that our total CACJA capital costs 12
will be less than what we predicted. We expected that it would cost 13
$928.1 million to implement our CACJA compliance plan, but our present 14
projected cost for target completion is $3.9 million less. As we managed its 15
implementation, we were able to achieve savings to our overall CACJA 16
compliance plan on a portfolio basis by eliminating the three items shown in 17
Table 5, which I discuss further below. 18

25
Table 5 Eliminated CACJA Projects
Project Title CPCN Estimated
Budget
Arapahoe 3 Synchronous Condenser
$ 4,890,000
Cherokee 3 Coal Conveyor Modifications
$ 13,198,000
Cherokee 4 Generator Step Up Transformer
$ 4,200,000
Total Cost $ 22,288,000
Q. PLEASE DESCRIBE HOW THE CURRENT ACTUAL BUDGET FOR THE 1
ARAPAHOE 3 AND CHEROKEE 2 SYNCHRONOUS CONDENSER 2
PROJECTS COMPARES TO PUBLIC SERVICE’S ESTIMATED BUDGET. 3
A. The scope of these two projects changed from what the Commission approved 4
in its CACJA order. The initial order included synchronous condenser 5
installations on Cherokee Unit 2 ($3,961,000) and on Arapahoe Unit 3 6
($4,890,000). In our CPCN proceeding for our Cherokee 2 project (Proceeding 7
No. 11A-209E), the estimate was increased to $9,480,000 primarily because the 8
installation of the synchronous condenser also required us to replace the exciter. 9
The Commission granted our requested CPCN for the Cherokee 2 synchronous 10
condenser as part of a settlement in which the Company agreed to perform an 11
additional study to determine the need for the Arapahoe Unit 3 synchronous 12
condenser project. The results of the study concluded the Arapahoe 3 project 13
was not necessary and it was subsequently cancelled. The Commission in a 14
separate proceeding approved the retirement of Arapahoe 3 (Proceeding No. 15
12A-846E). 16

26
The Cherokee 2 synchronous condenser project was placed in service in 1
2012. It came in approximately $575,000, or 6 percent, under the budget 2
presented in the CPCN proceeding. 3
Q. HOW DO THE ACTUAL COSTS FOR THE RETIREMENT OF CHEROKEE 4
UNITS 1 AND 2 COMPARE TO THE COMPANY’S ESTIMATED BUDGET? 5
A. The retirements of Cherokee 1 and 2 approved in Proceeding No. 11A-303E are 6
complete, and the demolition of those projects was completed for $21.6 million, 7
which is $1.4 million (6 percent) under the $23 million estimate for that project. 8
Q. PLEASE DESCRIBE THE ESTIMATED AND ACTUAL BUDGETS FOR THE 9
CHEROKEE 3 AND 4 PROJECTS. 10
A. When Cherokee station was originally assessed for suitability as a combined 11
cycle site, it was thought that the coal conveyor supplying coal to Cherokee Unit 12
3 would have to be removed from service to facilitate efficient construction of the 13
combined cycle plant. This would have required modifying the Cherokee Unit 4 14
coal delivery system to supply coal to Unit 3. After preliminary engineering and 15
design was performed, the configuration of the new combined cycle plant was 16
revised and it was determined that Unit 3’s coal conveyor could remain in 17
service, which eliminated the need to modify Unit 4’s coal delivery system. This 18
design optimization allowed us to avoid an estimated capital expenditure of 19
$13.2 million. 20
With respect to Cherokee Unit 4, a modification to the existing 115 kV 21
bus at the station allows for the continued use of the existing 115 kV generator 22

27
step up transformer for the unit, thus eliminating the need for a new transformer 1
and saving another $4.2 million in expenditures. 2
Q. HOW DOES THE ACTUAL BUDGET FOR THE 2X1 COMBINED CYCLE 3
PROJECT AT CHEROKEE STATION COMPARE TO THE COST ESTIMATE 4
FOR THAT PROJECT IN PROCEEDING NO. 11A-609E? 5
A. This project is expected to come in on budget and on schedule. While the cost 6
of the Company-supplied equipment (combustion turbines, heat recovery steam 7
generators, steam turbine, and step-up transformers) was lower than originally 8
estimated, the site development costs and the design build contract, which 9
included supply of balance of plant equipment and construction labor, were 10
higher than estimated. These higher costs generally offset the equipment 11
savings. A copy of our current budget estimate for this project is included as 12
public and highly confidential versions of Attachment No. MRF-2, Cherokee 2x1 13
Combined Cycle Project Capital Cost Estimate, which has a range of accuracy 14
of +/- 2 percent. 15
Q. PLEASE DESCRIBE THE CURRENT VERSUS ESTIMATED BUDGET FOR 16
THE INSTALLATION OF EMISSION CONTROLS AT THE HAYDEN 17
STATION. 18
A. Virtually all of the work to be done for the installation of SCR at Hayden Unit 1 is 19
now under contract, resulting in our current budget estimate of $55,800,000, 20
which is equal to the CPCN estimate in Proceeding No. 11A-917E for the 21
project. While the SCR project for Unit 2 at Hayden is not as far along as Unit 1, 22
it is tracking to come in at its budget of $34 million. A copy of our current budget 23

28
estimate for these projects is included as public and highly confidential versions 1
of Attachment No. MRF-3, Hayden SCR Project Capital Cost Estimate, which 2
has an accuracy range of +/ 7 percent for Unit 1, and +/- 10 percent for Unit 2. 3
Q. PLEASE DESCRIBE HOW THE CURRENT BUDGET FOR THE SCR AND 4
SCRUBBERS AT PAWNEE STATION COMPARE WITH THE ESTIMATED 5
BUDGET FOR THAT PROJECT IN PROCEEDING NO. 11A-325E. 6
A. As discussed above, the Pawnee emissions control project has experienced 7
increased costs, with our current budget for the project being $272 million, which 8
is approximately $20.3 million or 8 percent over the $252 million escalated 9
CPCN cost estimate. 10
As the design of the SCR and scrubber were being developed, it was 11
determined that the operating characteristics of the Pawnee boiler would prevent 12
reliable operation of the new emissions control equipment over the entire load 13
range of the unit. This meant that additional equipment not included in the 14
original estimate would be required to assure reliable operation (i) at low loads in 15
the winter to provide more flexibility for future operation with higher renewable 16
levels, and (ii) at high loads during the summer. 17
More specifically, steam coil air heaters were added to heat boiler inlet air 18
to provide adequate temperature at the inlet to the scrubber during low 19
temperature and low load operation. A tubular air heater was also added to 20
remove excess heat from the flue gas exiting the boiler at high loads in order to 21
avoid exceeding temperature limits of the catalyst in the SCR. These new 22
components also required larger Induced Draft Fans as well as large motors and 23

29
fault current limiting reactors for the fans. These changes increased the overall 1
construction cost of the project. 2
Further, the extensive reinforcement of the structural steel required by the 3
increased project scope required lead abatement that exceeded the original 4
budget by nearly $3 million. A copy of our current budget estimate for this 5
project is included as public and highly confidential versions of Attachment No. 6
MRF-4, Pawnee SCR and Scrubber Capital Cost Estimate which, given the 7
current stage of construction, has a range of accuracy of less than +/- 1 percent. 8
C. Non-CACJA Capital Additions 9
Q. IN ADDITION TO CACJA COMPLIANCE, FOR WHAT PURPOSES DOES 10
ENERGY SUPPLY UNDERTAKE INVESTMENTS IN CAPITAL 11
ADDITIONS? 12
A. Energy Supply generally makes capital additions to its system for three 13
purposes: (1) to construct (or dismantle) new (or decommissioned) 14
generating stations and units (“construction or decommissioning”), such as 15
those included as part of our CACJA compliance plan; (2) to make 16
investments to comply with new environmental FERC, NERC, and other 17
regulatory requirements; and (3) to ensure the continued safe, reliable, and 18
efficient operation of Public Service’s existing generation fleet (“routine 19
maintenance”). 20

30
Q. PLEASE DESCRIBE CONSTRUCTION OR DECOMMISSIONING 1
PROJECTS. 2
A. Changing system requirements may necessitate the construction of new 3
generation units or decommissioning of old generating units. The need for 4
such investments may result from new environmental mandates, the end of 5
the useful life of a facility, or changes in the level of energy resources needed 6
to serve our customers. An example of this type of project is the 7
decommissioning and dismantling of our Arapahoe Station. 8
Q. PLEASE DESCRIBE COMPLIANCE PROJECTS. 9
A. Our plants may require new systems and components to continue to operate 10
reliably and consistently with new regulatory requirements. This type of 11
capital addition can include repowering of units from one fuel to another or the 12
addition of new environmental technology such as scrubbers and other 13
emissions controls. Such capital projects are generally larger than routine 14
maintenance projects and planned over a longer period. They are generally 15
budgeted in addition to our routine maintenance capital spend, and are 16
considered new upgrades. 17
Q. PLEASE DESCRIBE ROUTINE MAINTENANCE PROJECTS. 18
A. Our generating stations are large, complex machines that require regular 19
maintenance to ensure they are operating reliably and efficiently. Many of our 20
capital additions take the form of routine maintenance that may involve 21
replacing worn or obsolete parts of our generating units which, under GAAP, 22
IRS regulations, and our capitalization policy are considered capital additions. 23

31
We also routinely make safety improvements at our plants, and are required 1
to make the usual investments in our plants to maintain compliance with 2
environmental or other regulatory requirements. We consider these types of 3
capital additions as routine maintenance, which forms the baseline of our 4
annual capital spend. 5
Q. DOES PUBLIC SERVICE HAVE A PROCESS IN PLACE TO DETERMINE 6
WHICH NON-CACJA CAPITAL PROJECTS IT WILL PURSUE? 7
A. Yes. Projects are submitted to Energy Supply by our plants, which we then 8
evaluate and rank based on their operational and financial merits. 9
Q. PLEASE DESCRIBE THE PROCESS BY WHICH NON-CACJA CAPITAL 10
PROJECTS ARE RANKED AND SELECTED FOR FUNDING? 11
A. Energy Supply has specific evaluation criteria it uses to review and prioritize 12
each capital project, including legislative commitments, financial merit (such 13
as Net Present Value or Present Value of Revenue Requirements), 14
operational factors (such as the impact on outage rates, equipment condition, 15
environmental compliance, and/or regulation (e.g., Grand Canyon Visibility 16
Transport Commission, Clean Air Mercury Act, Clean Air Interstate Rule)), 17
efficiency, reliability, capacity, and safety. Projects that are evaluated include 18
those that may be completed in a single year (for example, replacing the bags 19
in a fabric filter dust collector), as well as those that will require multiple years 20
to complete (for example, constructing a new lime spray dryer). 21
A ranked list of projects is then evaluated against the available budget 22
for the next year, as well as the planned unit outage schedule for the next 23

32
several years, and known regulatory factors such as new environmental 1
regulations. This capital budget process allows the Company to develop a 2
capital plan that covers a five-year period, with associated five-year capital 3
expenditures and estimated in-service dates. 4
As each new fiscal year arrives, the Public Service Regional Planning 5
Committee (“RPC”) reviews and validates the list of projects for the next fiscal 6
year, makes adjustments to schedules and/or budgets as required to account 7
for evolving conditions and factors, and proposes a list of projects that meets 8
the planned budget for the next five years. The most recent five years of 9
planning information, capital expenditures, and estimated in-service dates are 10
developed and recorded in the Unifier Enterprise Project Management 11
System (“EPM”). The RPC continually meets throughout the year to make 12
adjustments to projects currently under way. 13
As the plants identify and develop capital projects, they have specific 14
operational and other data available to them to enable identification and 15
quantification of how the project meets specific criteria. The plants specify 16
the identified information on the project document that they submit as part of 17
the project evaluation and budgeting process. 18
As each project is reviewed by the RPC, the specific criteria and 19
supporting information are reviewed and verified. The verified information is 20
entered into the EPM where numerical ranks are calculated and a project is 21
prioritized along with other submitted projects. 22

33
Q. DOES THIS BUDGETING PROCESS ALSO APPLY TO ENERGY 1
SUPPLY’S CAPITAL MAINTENANCE PROJECTS? 2
A. Yes. Although we consider certain projects to be routine maintenance 3
because they are needed to keep our plants operational, efficient, and 4
compliant with regulatory requirements, they are still significant capital 5
additions to our system. They, like all other capital additions, are ranked and 6
selected based on need and merit. 7
Q. DOES THE ENERGY SUPPLY CAPITAL BUDGET UTILIZE “ROUTINE” 8
WORKORDERS FOR SOME PROJECTS? 9
A. Yes. Our routine workorders fall into six major categories: 10
Yampa Capital Contributions: As I previously noted, Public Service is 11
a co-owner of the Craig and Hayden stations that are part of the Yampa 12
Project. While Public Service operates the Hayden station and identifies 13
capital additions as line items on our capital budget, Tri-State operates the 14
Craig station. We budget our share of the ongoing maintenance capital 15
additions that Tri-State will make to the Craig station as routine workorders. 16
Outage Support: Our gas-fired fleet must take regular outages for 17
inspection and servicing, determined by the number of hours they have 18
operated and how many starts they have undergone. This is similar to taking 19
a car in for an oil change and inspection every 5,000 miles. For these 20
planned outages, the turbines and other major pieces of equipment are 21
generally opened and inspected, with repairs made and parts replaced as 22
needed. We use manufacturer recommendations and our historic experience 23

34
with these units to forecast our expected capital budgets during these 1
outages. 2
Turbine Parts: These routine workorders are similar to our outage 3
support routine workorders. In 2012 and 2013 we entered into parts 4
exchange programs with the manufacturers of our combustion turbines. 5
Under this program, instead of investing in complete sets of spare and 6
emergency inventory parts upfront on a plant-by-plant basis, we rely on long-7
term contracts with a qualified parts supplier to provide the parts on a just-in-8
time basis. The supplier commits to having readily available a complete 9
supply of qualified spare parts to support the Company’s turbine overhaul 10
schedule, ensuring we will have the parts we need when we need them. 11
Because of our participation in this program, we budget for our parts 12
purchases for each overhaul on a routine basis. We develop these budgets 13
based on our historic experience with the particular plant and manufacturer 14
recommendations. 15
Tools: We also budget a small amount for tools that may be 16
capitalized under our capitalization policy. We develop this budget based on 17
the work we expect to perform in a particular year and our past experience. 18
Emergent Work: A small part of our capital budget is dedicated to 19
emergent work that occurs at our plants. This type of work includes 20
unexpected failure of major equipment such as air compressors, control 21
valves, gearboxes, high-energy pumps, etc. We set this budget based on our 22
historic experience at the plants, as well as the scheduled work that we will be 23

35
performing at the plants in a given year. The forecasted capital additions 1
under each workorder identify the year in which the capital addition is 2
forecasted to be made. 3
Small Project Routines: These workorders are our budget for small 4
projects that we routinely perform in a given year. These are the smallest of 5
our routine maintenance projects and are budgeted based on our historic 6
routine work performed. Unlike the emergent work, small project routines are 7
not specific to a particular plant but are instead Energy Supply wide projects. 8
Q. PLEASE EXPLAIN THE PROCESS YOU FOLLOW TO MANAGE PROJECT 9
IMPLEMENTATION. 10
A. Capital budgets are finalized at least one year prior to their execution. Part of 11
the project development process includes the identification of key schedule 12
dates and budgetary milestones. Once a capital project has been approved 13
for execution, it is assigned to a Project Manager (“PM”), typically three to six 14
months in advance of the first planned activity required to commence the 15
project. The PM is responsible for working with the plant to review and more 16
fully develop the schedule and monthly cash flow requirements for the 17
assigned project. The PM will typically contact vendors and contractors to 18
firm up cost and schedule data and begin engineering and purchasing 19
activities. If the PM identifies specific information related to changes in cost 20
or the schedule, they advise management and recommend options for 21
consideration. Management then responds as appropriate depending on the 22
specifics of the information provided. 23

36
Q. PLEASE EXPLAIN THE PROCESS YOU FOLLOW TO MANAGE THE 1
OVERALL CAPITAL BUDGET ONCE IT IS ESTABLISHED. 2
A. As discussed by Company witness Mr. Gregory Robinson, Energy Supply is 3
expected to manage to our capital budget. The most important budget 4
management tool is good project planning. If we plan, budget, and implement 5
our projects well, there is little additional management of the overall capital 6
budget needed. However, unexpected events can, and do, occur. 7
For example, if there is an unexpected failure of a large component at 8
an existing plant, such as the boiler, we must address this when it occurs. 9
Some of our routine workorders exist to meet these needs. Further, we would 10
look to reduce the costs of other budgeted projects, or defer them all together 11
if necessary and possible. However, sometimes we must continue with 12
certain projects as budgeted since they are necessary for the continued 13
reliable operations of our plants, or because putting them on hold would 14
unnecessarily incur costs despite the need for additional expenditures 15
elsewhere. Conversely, if budgeted projects are delayed or deferred, we will 16
generally find other projects to implement because the amount of projects 17
generally exceeds the capital funds available. Consequently, our capital 18
budgets reasonably reflect the amount of capital additions we will place in 19
service during the Test Year, and are a reasonable basis upon which to set 20
rates. 21

37
IV. ENERGY SUPPLY O&M EXPENSES 1
Q. WHAT ARE THE TYPES OF COSTS THAT THE ENERGY SUPPLY INCURS 2
FOR OPERATIONS AND MAINTENANCE? 3
A. As described earlier in my testimony, a variety of O&M work is performed by 4
Energy Supply. The costs to perform this work generally fall into six categories: 5
Internal Labor – costs for the labor force that runs our plants and supports 6
Energy Supply activities. Our Internal Labor budget includes planned 7
overtime, and excluding overhaul related work, to ensure we have personnel 8
available to operate our plants at all hours of the day. Internal Labor is the 9
largest component of our O&M costs. 10
Contract Labor – costs of outside contractors, experts, and other third-party 11
assistance that we utilize to augment our internal core operations and 12
maintenance competencies. Examples include crews we hire to help with 13
overhaul work, as well as experts from our equipment manufacturers to 14
provide expertise on the plants they helped engineer and construct. 15
Base Commodities – costs primarily for chemicals and water used in the 16
generation process and for the control of emissions. Chemicals for which we 17
incur the most costs include ammonia, lime, sulfuric acid, and mercury 18
absorbent. 19
Materials – costs for all non-chemical material costs we incur to operate and 20
maintain our plants. This includes everything from steel to personal protective 21
equipment. 22

38
Craig Partnership – costs paid to Tri-State to operate the Craig station as part 1
of the Yampa Project described above. 2
Other – all other costs we incur to operate and maintain our generation plants. 3
This includes transportation fleet costs, utility costs for the plants such as gas, 4
electric and sewer bills, fees such as environmental fees, and other smaller 5
miscellaneous O&M costs. 6
Q. WHAT WERE PUBLIC SERVICE’S ENERGY SUPPLY O&M COSTS DURING 7
THE 2013 O&M BASE PERIOD? 8
A. Our actual O&M expenditures during 2013 were $173.2 million. Table 6 below 9
identifies the amount of overall O&M costs by the categories I discuss above. 10
Attachment No. MRF-5, attached to my testimony provides an accounting of 11
these expenditures by Object and FERC accounts. 12
Table 6 2013 O&M Base Period
Cost Category $ Millions
Internal Labor $ 64.8
Contract Labor $ 46.0
Base Commodities $ 24.0
Materials $ 26.3
Craig Partnership $ 6.6
Other $ 5.5
Total $173.2

39
Q. ARE THE $173.2 MILLION IN 2013 O&M COSTS FOR THE ENERGY 1
SUPPLY BUSINESS AREA YOU DESCRIBE ABOVE REFLECTED IN THE 2
2015 COST OF SERVICE PRESENTED BY MS. BLAIR? 3
A. Yes, with four adjustments. As discussed by Ms. Jackson, Public Service is 4
proposing to set rates based on our historic 2013 O&M costs with limited 5
adjustments for known and anticipated changes that we expect to occur 6
between the end of the 2013 base period and December 31, 2015. With respect 7
to the Energy Supply Business Area, our 2013 historic O&M costs as adjusted 8
provide a reasonable level of O&M for the Test Year. 9
Q. WHAT ADJUSTMENTS ARE YOU PROPOSING TO THE 2013 HISTORIC 10
COST OF SERVICE FOR THE ENERGY SUPPLY BUSINESS AREA? 11
A. The first adjustment is for the incremental increase in base commodities costs 12
that Public Service will incur in the Test Year for new or upgraded generation 13
facilities for CACJA. The second adjustment is for the reduction in non-labor 14
O&M expenses associated with the retirement of Arapahoe 4, and the third 15
adjustment is for the elimination of a non-recurring expense. Table 7 below 16
summarizes these O&M expense adjustments. 17

40
Table 7 O&M Expense Adjustment
Cost $ Millions
O&M Expense for 2013 Base Period $ 173.2
Incremental Increase in Base Commodities Costs $ 7.2
Incremental Decrease in O&M Due to Retirement of Arapahoe 4
$ (3.8)
Elimination of Non-Recurring Expense $ (0.5)
Adjusted 2013 O&M Expense $ 176.1
Additionally, Ms. Lowenthal supports the fourth adjustment for the 1
increase in total labor expense included in the Test Year due to anticipated merit 2
and base salary increases for non-bargaining and bargaining employees 3
through December 31, 2015 and Ms. Blair quantifies the increase in total labor 4
expenses included in the Test Year cost of service. 5
Q. WHY IS PUBLIC SERVICE FORECASTING AN INCREASE IN BASE 6
COMMODITIES COSTS? 7
A. As part of our CACJA compliance plan, emissions control technology is being 8
added to our Hayden and Pawnee stations, and is also part of the new 9
combined cycle gas plant being constructed at our Cherokee station Placing 10
these projects in service will incrementally increase the amount of emissions 11
control chemicals as well as water used at these three plants, thus incrementally 12
increasing Test Year base commodities costs over the level of those costs in 13
2013. 14

41
Q. PLEASE DESCRIBE THE BASE COMMODITIES USED FOR EMISSION 1
CONTROLS. 2
A. Base commodities are used for a variety of reasons at our plants, but mainly for 3
operations and to control emissions. The base commodities for emissions 4
control include four principal chemicals - ammonia, lime, sulfuric acid, and 5
mercury absorbent - as well as water. I describe how these commodities are 6
used below: 7
Ammonia- ammonia is used in a SCR system such as those being 8
added to the new Cherokee CTs, and Hayden and Pawnee units. A SCR 9
system reduces the nitrogen oxides in boiler flue gas. The ammonia is 10
received and handled in a liquid form but vaporized and applied just 11
ahead of a large catalyst inside the boiler flue gas ductwork. This is 12
where nitrogen oxides react with the ammonia to form nitrogen and 13
water. Ammonia is also used for boiler water treatment. In this 14
application, it is used directly to raise the pH of the boiler water to specific 15
limits to reduce corrosion of the boiler steel. 16
Lime- lime is used to remove sulfur dioxide from the flue gas. Lime and 17
water as well as fly ash and water are combined and then both are mixed 18
to make the lime/ash water slurry used in the Spray Dry Absorber (“SDA”) 19
that is part of the SO2 removal process of a scrubber. 20
Sulfuric Acid- sulfuric acid is used to control scale formation in cooling 21
tower waters, reducing solid particle emissions from the towers. The 22
material is received and handled in liquid form. It is then metered into the 23

42
cooling tower waters where it controls scale by maintaining the pH 1
balance of the waters within certain limits. Minor amounts are also used 2
in demineralizers. 3
Mercury Absorbents- activated carbon is currently the industry standard 4
for mercy removal from flue gases. Activated carbon is received in 5
powder form and stored in large silos. From these storage silos, it is 6
metered into the boiler flue gas where it absorbs mercury. The activated 7
carbon containing mercury is ultimately caught in the air quality control 8
system and then conveyed to a secure landfill for safe storage. 9
Water- water is mixed with the lime and ash fly used to remove sulfur 10
dioxide from flue gas, as described above. 11
Q. PLEASE DESCRIBE THE IMPACT THAT THE NEW EMISSION CONTROLS 12
WILL HAVE ON PUBLIC SERVICE’S BASE COMMODITIES EXPENSE. 13
A. We estimate that as a result of the new emission controls that will be placed in 14
service in the Test Year period, our base commodities expense will increase by 15
$7.2 million or approximately 30 percent from its level of $24 million in 2013, to 16
$31.2 million in 2015. The largest portion of this increase is attributable to the 17
increased use of ammonia for the SCR systems being added at our Hayden, 18
Pawnee, and Cherokee stations. We estimate our use of ammonia will 19
quadruple as a result. The next greatest incremental expense is for the lime and 20
water used for the new scrubbers at Pawnee. We estimate a 25 percent 21
increase in our use of lime, and a 20 percent increase in the use of water. 22

43
Q. WHY IS PUBLIC SERVICE REQUESTING AN O&M ADJUSTMENT FOR 1
PLANT RETIREMENT? 2
A. We project that the shutdown of Arapahoe 4 should decrease our O&M 3
expenses by $3.75 million from 2013 levels due to the elimination of the need to 4
operate and maintain the plant. 5
Q. WHAT IS THE TOTAL AMOUNT OF O&M COSTS THAT THE ENERGY 6
SUPPLY BUSINESS AREA IS PROPOSING FOR THE TEST YEAR COST 7
OF SERVICE PRESENTED BY MS. BLAIR? 8
A. We are proposing that the Test Year cost of service reflect our historic 2013 9
O&M costs of $173.2 million with a net upward adjustment of $2.9 million, 10
reflecting the reduced non-labor O&M expenses as a result of the Arapahoe 4 11
decommissioning, increased base commodities costs associated with new or 12
upgraded generation facilities for CACJA, and elimination of a non-recurring 13
expense. 14
Q. ARE THESE O&M EXPENSES REASONABLE AND NECESSARY TO 15
CARRY OUT ENERGY SUPPLY’S KEY FUNCTIONS YOU DESCRIBED 16
ABOVE? 17
A. Yes. These O&M expenses are necessary to ensure that Energy Supply is able 18
to deliver safe and reliable electric service to our Colorado customers. 19
44
Q. IS THE COMPANY PROPOSING THAT ANY O&M COSTS BE RECOVERED 1
THROUGH THE CACJA RIDER? 2
A. Yes. Our CACJA O&M expense for base commodities will continue into 2016 3
and 2017, and as Ms. Jackson and Mr. Brockett explain, we are proposing to put 4
these costs into the CACJA rider subject to true-up. 5

45
V. GENERATION PERFORMANCE BENCHMARKING PLAN 1
Q. WHY IS THE COMPANY PROPOSING A PERFORMANCE 2
BENCHMARKING PLAN? 3
A. The performance benchmarking plan that we are proposing – specifically the 4
EAFPM – is intended to give the Company an incentive to ensure the 5
availability of our generating fleet and a penalty if we do not meet our targets. 6
Ms. Jackson discusses the Company’s rationale for proposing the plan in 7
more detail. In addition, Mr. Brockett proposed a modified version of our ECA 8
clause as the rate mechanisms to implement this incentive mechanism. 9
Q. CAN YOU PLEASE DESCRIBE THE PERFORMANCE METRICS THAT 10
ENERGY SUPPLY WILL USE TO GAUGE GENERATION 11
PERFORMANCE? 12
A. We are proposing to utilize the Equivalent Availability Factor (“EAF”) metric as 13
a measure of performance, adjusted for certain special circumstances. EAF 14
is a measure of the availability of the entire capacity of measured generating 15
units for all hours of the year and captures planned and unplanned outages 16
as well as unit de-rates. Under our proposed EAFPM plan, we would 17
calculate a weighted average EAF for our coal and combined cycle fleet 18
based on past performance and then use it to measure our current 19
performance. If the Company’s Current Year Weighted Average EAF for 20
selected plants is greater than or equal to the 2nd highest Historic Weighted 21
Average EAF from the period 2009-2013 for selected plants (at or above 22
84.18 percent), the Company will earn an incentive of $3 million. If the 23

46
Current Year Weighted Average EAF is equal to or lower than the 4th highest 1
Historic Weighted Average EAF from the period 2009-2013 for selected 2
plants (at or below 80.76 percent), the Company will be assessed a penalty. 3
If the Current Year Weighted Average EAF for selected plants falls between 4
80.76 percent and 84.18 percent, non-inclusive, the Company will neither 5
earn an incentive nor be assessed a penalty. 6
Q. WHY IS THE COMPANY PROPOSING TO USE THE EAF METRIC? 7
A. EAF is a commonly used industry metric and is reported to the North 8
American Electric Reliability Corporation (“NERC”) as part of its Generating 9
Availability Data System (“GADS”). The GADS data system contains the 10
event and performance data of all generating units in the nation greater than 11
20 MW. Event data consists of any planned or unplanned events that occur 12
to a unit. Performance data is the result of the events and the generation 13
produced by the unit. By using EAF data as reported to GADS, we will be 14
using data that is uniformly reported and subjected to established criteria. 15
EAF is also a strict measure of plant availability as it captures both 16
planned and unplanned outages as well as unit de-rates. Further, because 17
EAF measures availability, it is a reasonably good metric to measure the 18
performance of both our baseload coal fleet as well as our intermediate 19
combined cycle fleet. Consequently, EAF allows us to measure the 20
performance of our gas and coal fleet in a single metric that measures how 21
often our plants are available to serve our customers. 22

47
Q. IS PUBLIC SERVICE PROPOSING TO ADJUST ITS EAF CALCULATIONS 1
IN SPECIAL CIRCUMSTANCES? 2
A. Yes. First, we propose to adjust our EAF calculation for outage events that 3
are classified as Outside Management Control (“OMC”) in the GADS 4
database as these outage events are, by definition, outside of our control. We 5
are given the option to make this adjustment when reporting EAF information 6
to GADS. Second, we propose to adjust our EAF calculations for outage 7
events that are specifically attributable to an order of a state or federal 8
regulatory agency or law. For example, an outage to install emissions control 9
equipment would be excluded from our EAF calculation. We believe that 10
these outages are necessary for us to comply with our legal obligations and 11
therefore should not affect our performance metrics. 12
Q. WHICH PLANTS IS THE COMPANY PROPOSING TO MEASURE UNDER 13
THE PERFORMANCE PLAN? 14
A. We are proposing to utilize a weighted average EAF of our Comanche, 15
Hayden, Pawnee, Fort St. Vrain, Rocky Mountain Energy Center generating, 16
and Cherokee Unit 4 stations. This represents our gas and coal fleet that is 17
not nearing retirement. 18
Q. WHY IS THE COMPANY PROPOSING TO MEASURE ONLY THESE 19
PLANTS? 20
A. We are proposing to measure only our combined cycle and coal fleet as they 21
have the largest impact on our fuel costs and represent a significant portion of 22
the energy generated on our system. Because our peaking fleet need only be 23

48
available for a significantly smaller proportion of hours during the year, we do 1
not believe that including them in the performance plan will incentivize 2
efficient use of our resources. 3
We are also proposing to exclude those generating units that are 4
nearing retirement during the performance plan. As a project reaches the end 5
of its useful life, we reasonably try to limit both capital and O&M expenditures 6
on that unit where possible. That in turn can lead to some degradation in the 7
performance of a unit, but that result is nonetheless reasonable given the 8
short length of the unit’s expected remaining life. We are not saying that all 9
capital and O&M expenditures can be eliminated; we still have an obligation 10
to operate the unit in a safe and reliable manner, but in some situations, the 11
need to expend capital and O&M on a unit can be avoided without 12
jeopardizing our ability to operate the unit. In fact, the need to expend capital 13
and O&M on a unit can be a major factor in deciding to retire a unit early. We 14
believe the performance plan needs to reflect this situation, and not provide 15
an artificial incentive to expend capital and O&M on a unit that we would 16
otherwise not expend. 17
Q. HOW IS THE COMPANY PROPOSING TO CALCULATE ITS HISTORIC 18
PERFORMANCE FOR USE IN THE PERFORMANCE PLAN? 19
A. We gathered the GADS EAF for the units included in the performance plan for 20
2009-2013 and weighted each unit by the Net Maximum Capacity (“NMC”) 21
ratings for each unit to develop a fleetwide average historic performance 22
baseline. We selected the 2nd highest Historic Weighted Average EAF from 23

49
the period 2009-2013 and for selected plants (84.18 percent) and the 4th 1
highest Historic Weighted Average EAF from the period 2009-2013 (80.76 2
percent) as the thresholds or set points of performance for the incentive and 3
penalty payments. 4
Q. HOW WILL THE COMPANY MEASURE ITS PERFORMANCE DURING 5
THE YEARS OF THE PERFORMANCE PLAN? 6
A. In the years 2016 and 2017 following the years of the performance plan, 2015 7
and 2016, we will calculate the weighted average EAF for the plants included 8
in the plan in the same manner as we developed our historic baseline. This 9
weighted average EAF will be compared to the historic 2009-2013 derived set 10
points. 11
Q. DOES THIS CONCLUDE YOUR DIRECT TESTIMONY? 12
A. Yes. 13

Attachment A
Statement of Qualifications
Mark R. Fox
I earned a Master of Business Administration (“MBA”) from the University of
Phoenix, a Bachelor of Science Mechanical Engineering (“BSME”) from the University
of Colorado, and a Bachelor of Music Education (“BME”) from the University of Denver.
I have held various positions with Xcel Energy since 2002, including Director of
Arapahoe and Valmont Stations; Director, Plant Projects; and Manager, Capital
Projects.
I am currently the General Manager, Power Production for Xcel Energy. In this
position, I am responsible for the leadership, operation and maintenance of Xcel
Energy’s Public Service Company of Colorado fleet of power generation assets
including 9 major power plants comprised of 22 units including coal fired (sub- and
super- critical), combined cycle and simple cycle units with a combined capacity in
excess of 3500 megawatts. My responsibilities include all aspects of daily operation,
overhaul planning and execution, labor relations and management (union and exempt),
employee training, environmental and financial performance.

Attachment No. MRF-1Page 1 of 6
Budget Org ID Energy SupplyFunc Class Descr (All)
Work Order Number
Description Est ISD 2014 2015 CACJA
10137189 Va Ash Disposal Site Construc 12/31/2007 (0.05) 10531451 CCH0C-FERC License Application 12/10/2013 (2,604.54) 10542925 PAW1C - U1 Boiler Acoustic Mon 9/26/2014 (519,573.68) 10623195 PAW1C - Repl Furnace SH Div Walls 5/25/2014 (5,980,739.69) 10636058 FSV2C - U2 CT Mark V (Controls) 11/30/2015 (1,334,799.34) 10636080 SER-CHM-Instrument CO Lab 10/30/2015 (139,000.08) 10643719 COM1C 1-7 FEEDWATER HEATER RE 6/30/2014 (3,070,161.69) 10798250 HAS1C -Replace Economizer 6/18/2015 (3,006,915.17) 10798254 HAS2C -New Cooling Tower Compo 10/1/2014 (163,617.51) 10909637 SSH0C -Rplc Trash Raking Syste 9/15/2014 (400,686.00) 10910934 TAH0C -Station Batteries Rplc 4/1/2014 (26,347.95) 10924160 PAW0C - Grove Crane Replacemen 9/11/2015 (480,320.01) 10924165 PAW0C - Replace Wet Pipe Fire 3/31/2014 (5,084,325.19) 10924937 TAH0C- Rplc Animas Rvr RetainW 10/31/2014 (474,572.45) 10925108 AMH0C -Rplc Howards Fork Surge 11/30/2014 (78,739.07) 10925572 AMH0C -Ferc Lic Compliance PM 12/30/2013 (1,052.12) 10929487 TAH0C -FERC Lic Compliance PME 12/30/2013 205.93 10929986 AMH0C - Rplc Trout Lk Valve Ho 11/15/2014 (3,868,314.43) 10935164 FSV2C 15 Gas Heater 10/8/2015 (50,837.72) 10940458 COM1C WATER WALL REPLACEMENT 8/31/2014 (8,167,720.40) 11078155 HAS2C-Replace CEMS 6/19/2014 (159,208.89) 11078157 HAS2C-Replace COM 6/19/2014 (106,381.31) 11078158 HASCC-Replace Station paging s 11/30/2013 4,823.77 11078758 PAW1C - U1 Digital Control Sys 5/15/2014 (4,485,326.06) 11080731 TAH0C -Stagecoach Spillway Dam 5/30/2014 (250,033.44) 11209647 VAL5C-Coal Mill Overhauls 11/15/2014 (338,791.82) 11219386 FSV3C - U3 Hydrogen Panel Repl 11/15/2013 (109.71) 11219388 HASCC-Ash Pit Reclamation 7/30/2018 (139,149.41) (174,339.84) 11219398 FSV2C - U2 CT Row 0 Blade Repl 10/8/2015 (254,180.00) 11224292 COMNC ASH DISPOSAL CELL2 PHAS 7/29/2014 (212,537.10) 11224302 COM1C SERVICE WATR RETURN PUMP 4/30/2014 (196,511.34) 11225571 CHR4C - Coal Mill Overhl (Inst 11/28/2014 (412,658.14) 11226237 VAL6C -Rplc CT 6 Exhaust Diffu 12/1/2015 (780,982.82) 11226244 VAL6C - 6CT Rplc Exhaust Stac 12/1/2015 (1,988,182.80) 11228119 SER-0-C CHM0114 Instrumen CO L 3/18/2014 (127,250.00) 11228121 SEC-0-C0114 PMO Emission Test 10/31/2014 (112,000.00) 11233207 HAS1C - Turbine Overhaul Compo 5/15/2015 (223,185.89) 11338427 PWF0C- Rplc 6 Gear Boxes 2015 8/3/2015 (364,392.02) 11345622 VAL0C-Leggett Dam Rip Rap 9/30/2015 (193,077.52) 11345775 COM2C REP 2ABFP RECIRC CONTRL 12/31/2014 (98,697.88) 11346041 COM2C REP 2B BFP RECIRC CONTRL 12/31/2014 (55,139.52) 11346111 COM1C REP 1A&B BFP RECIRC CONT 6/29/2014 (218,002.49) 11346342 COM1C REP U1 MERCURY MONITOR 3/25/2015 (295,830.71) 11346357 COM2C REP U2 MERCURY MONITOR 7/31/2015 (297,371.30) 11346787 FSV2C - U2 CEMS Analyzer Replace 11/30/2015 (108,281.02) 11349171 SER0C -MPB0113 Tool Rplc & Up 12/30/2013 (1,209.74) 11349175 SER0C -MPB0114 Tool Rplc & Up 4/15/2014 (32,200.00)
Activity Year
Energy Supply

Attachment No. MRF-1Page 2 of 6
Work Order Number
Description Est ISD 2014 2015 CACJA
11349179 SER-MPB-Misc Tools & Equipment 4/12/2015 (32,200.00) 11349297 HAS2C-DCS I/O replacement 10/14/2014 (1,197,633.43) 11349298 HAS2C-2C Coal mill cap overhaul 4/25/2014 (155,713.73) 11349722 PAW1C - U1 Generator Protectiv 5/15/2014 (785,477.20) 11350148 AMH0C -Rplc HopeLk Dam Outlet 9/30/2015 (204,904.80) 11350477 CCH0C -Rplc Scada/EMS Controls 12/14/2015 (448,173.53) 11352436 ES0C - ES Capital Tools - 2013 12/31/2021 (112,783.76) (1.37) 11352438 ES0C - ES Capital Tools - 2014 12/30/2014 (289,529.41) 11352439 ES0C - ES Capital Tools - 2015 12/30/2015 (280,000.00) 11352579 SER-PMO-Emission Test Equipment 1/15/2015 (112,000.00) 11418666 CHR0C 2X1 Combined Cycle COD 2 12/31/2015 (243,440,833.88) Yes11418684 CHR0C Solid Waste Reg Surfc Im 12/30/2015 (1,168,378.96) 11418696 HAS1C-Selective Catalytic Redu 9/30/2015 (57,865,420.47) Yes11418711 PAW1C - Pawnee SCR and Scrubbe 12/30/2014 (296,828,684.08) Yes11418714 PAW0C Solid Waste Reg Surfac I 9/30/2014 (472,323.62) 11418882 FSV0C - U0 CO Solid Waste Reg 9/24/2015 (616,718.82) 11418887 VAL0C CO Solid Waste Reg Surf 12/29/2014 (121,613.32) 11418890 ZUN0C CO Solid Waste Reg Surfa 12/30/2014 (82,990.64) 11467384 CRG0C - Yampa Capital 2013 12/15/2013 67,949.01 11467387 CRG0C - Yampa Capital 2014 12/15/2014 (2,052,987.13) 11467389 CRG0C - Yampa Capital 2015 12/16/2015 (1,564,149.41) 11474117 CHR1C U1 Retire Decommission 7/31/2013 1,950.73 11474120 CHR5C 2X1 Combined Cycle CTG 12/31/2015 (126,674,708.41) Yes11474122 CHR6C 2X1 Combined Cycle CTG 12/31/2015 (126,108,782.02) Yes11474125 CHR7C 2X1 Combined Cycle STG 12/31/2015 (102,658,057.54) Yes11486863 FSV1C - U1 Res Aux Transf Repl 11/13/2014 (501,025.62) 11486865 FSV1C - U1 Auxiliary Transform 11/15/2015 (567,035.83) 11486872 FSV2C - U2 Exciter Controller 6/18/2015 (367,384.51) 11486876 FSV1C - U1 Exciter Controller 6/25/2015 (382,516.59) 11488621 PAW1C - U1 Mill Wear Liner Rep 12/30/2013 (773.92) 11488626 PAW1C - U1 Mill Wear Liner Rep 5/21/2015 (193,186.40) 11488628 PAW1C - U1 Mill Wear Liner Rep 14 11/26/2014 (192,518.92) 11488663 PAW1C - U1 Finishing Superheat 6/20/2014 (8,710,985.88) 11489728 HAS1C-U1 Cooling tower VFD s 11/15/2015 (185,360.05) 11491420 CCH0C -Rplc Freon Transformers 9/15/2014 (270,143.55) 11492506 COM3C SCR CATALYST - REP 2ND L 5/15/2015 (2,819,053.55) 11492545 CHR4C 13 StartUp Trasnfrmr Pro 11/17/2014 (62,328.59) 11492562 CHR4C 14 Hagan Drives 12/30/2014 (413,440.22) 11492610 COMOC REP HOUSING OVER 7&8 CON 12/31/2013 10,387.78 11492617 RKM1C 14 SCR Catalyst Rplc 10/22/2015 (622,486.42) 11492624 RKM2C 13 CEMs Upgrade 9/30/2014 (295,829.12) 11492631 RKM0C 14 Surface Impndmnt Lini 10/15/2015 (2,452,805.00) 11492632 RKM1C 14 CEMs Upgrade 10/21/2014 (296,297.04) 11492633 RKM1C 14 Vibration Monitoring 7/29/2014 (326,458.08) 11492659 BLS2C 13 CEMs Monitor Syst 1/29/2014 (5,805.28) 11492661 BLS1C 14 CT Parts 10/16/2014 (4,767,216.60) 11496597 COMECC SEC 9 LINERS 12/30/2013 (627.31) 11618352 PAW1C - U1 Submerged Flyte Conv U 5/31/2014 (1,729,920.84) 11618390 PAW0C - U0 Water Treatment Add 9/30/2013 6,580.50 11618401 PAW1C - U1 CWT Wetdown Pump Re 10/16/2013 (110,008.27) 11618404 PAW0C - U0 Transfer Tower Mods 6/13/2013 (1,105.43)
Energy Supply

Attachment No. MRF-1Page 3 of 6
Work Order Number
Description Est ISD 2014 2015 CACJA
11618424 PAW1C - U1 Generator Breaker 5 6/1/2014 (251,675.02) 11618486 FSV3C - U3 Bypass Stk Silencer 11/29/2013 (1,363.37) 11618501 FSV4C - U4 Comb Turb Autotune 3/17/2015 (301,607.98) 11618504 FSV4C - U4 Major Capital Pts L 2/27/2014 781.89 11618513 FSV3C - U3 Duct Burner Igniter 11/18/2013 (352.51) 11618515 FSV0C - U0 Gas to Gas Heater R 9/6/2013 (567.19) 11618517 FSV2C - U2 Bypass Stk Silencer 3/20/2014 (576,865.67) 11618519 FSV3C - U3 HGP Capital Labor 11/25/2013 (25,717.05) 11618530 FSV2C - U2 Duct Burner Igniter 1/15/2015 (156,088.15) 11618534 FSV2C - U2 Combustion Turbine 4/30/2014 (1,019,033.51) 11618535 FSV2C - U2 Exciter Breaker/Swi 10/31/2014 (98,107.55) 11618544 FSV2C - U2 Drum Sparging Syste 1/15/2015 (262,788.16) 11618548 FSV0C - U0 Main Building Walls 12/30/2015 (2,689,411.77) 11619735 FSV3C - U3 Exciter Breaker/Swi 6/30/2015 (98,884.92) 11619739 FSV5C - U5 Comb Turb Autotune 9/28/2015 (301,080.14) 11619744 FSV1C - U1 Dump and Drag Vlv R 4/26/2015 (96,624.38) 11619745 FSV3C - U3 BFP SW Cooling Loop 3/15/2015 (315,345.80) 11619762 FSV0C - U0 Fire Protection 1/30/2015 (400,439.10) 11619765 FSV0C - U0 Visitors Center Roo 1/30/2015 (142,656.43) 11619768 FSV0C - U0 Motorized Rotor Sta 10/13/2015 (66,089.16) 11619778 FSV2C - U2 HRSG Bellows Repl 11/6/2014 (446,804.93) 11619789 FSV2C - U2 Purchase CT Parts 10/30/2015 (4,308,698.51) 11620519 VAL5C-Coal Mill Major Rebuild 10/30/2015 (653,402.15) 11628348 ACT0C -Rplc Mech.Relays 10/30/2014 (370,194.90) 11628564 SAH2C -Rplc Penstock 2013 to 2 7/7/2015 (1,832,831.10) 11631036 FLP2C - U2 Generator Relays 10/22/2014 (339,396.50) 11631051 FLP1C - U1 Generator Relays 10/31/2014 (339,593.52) 11633697 HAS1C-Feedwater Heater Level C 5/31/2015 (277,174.53) 11633777 COMNCLIME SYSTM FOR CLARI 4/15/2014 (2,807,392.09) 11633784 COM1C REP 4160V DISCONNECT SWI 5/16/2014 (101,492.67) 11633786 COM2C REP U2 NERC RELAYS 11/15/2015 (511,798.09) 11633793 COM1C REP U1 GENERATOR BREAKER 6/30/2014 (403,031.50) 11633796 COM2C REP ALL FFDC BAGS U2 12/15/2015 (1,921,438.95) 11633814 COM3C REP ALL FFDC BAGS 2014-2015 6/30/2015 (2,506,906.57) 11644483 RKM2C 13 Turbine Part 12/30/2013 (15,580.73) 11644488 RKM2C 13 HGP Outage Support 11/30/2013 230,021.44 11644496 RKM1C 15 LTE 4/15/2015 (1,531,679.56) 11660170 HASCC - Surface Impoundments 2/27/2014 (3,223.59) 11662983 PAW0C - Emergent work 12/31/2021 (212,174.03) (186,683.71) 11662986 COMOC Emergent work 12/31/2021 (370,956.86) (665,719.11) 11662988 CHR0C Emergent Work 12/31/2021 (636,521.89) (570,177.24) 11710530 COM3C U3-SSC DRIVE CAP SPARE P 11/30/2013 18,428.65 11718101 FSV0C Emergent work 12/31/2021 (318,260.95) (280,026.07) 11718217 HASCC - Emergent work 12/31/2021 (212,174.03) (190,059.13) 11733138 GTH0C Cl Lk Metro Denver Water 11/15/2015 (9,510,450.67) 11765517 BLS0C 13 CT Parts purchase 10/15/2013 1,097.13 11769348 RKM2C 13 HRSG Elevator 11/29/2013 (29,770.99) 11770771 ES0C ES Cap 13 - 18 Transportation 12/31/2018 (56,906.90) 11774539 PAW1C - U1 13 Boiler Improve I 9/3/2014 (4,281,149.80) 11783843 HAS1C-Replace Condensate Pump 4/15/2015 (70,352.15) 11783846 HAS2C-Coal Mill Motor Replace 6/15/2015 (19,020.86)
Energy Supply

Attachment No. MRF-1Page 4 of 6
Work Order Number
Description Est ISD 2014 2015 CACJA
11783858 HAS1C-Boiler Furnace Camera 4/30/2015 (105,758.02) 11794831 VAL6C -V6 Gen Flex Probe 11/14/2015 (115,376.25) 11797454 FSV4C 14 U4 89SS Switch 11/10/2014 (154,703.33) 11797510 FSV2C U2 Evap Cooler Drain Sys 11/9/2015 (80,958.30) 11797525 FSV4C U4 Boiler Feed Pump OH 12/31/2014 (252,005.52) (1.00) 11797528 FSV2C U2 HRSG Expansion Joint 10/8/2014 (245,406.63) 11798082 BLS2C 14 U2 Turning Gear Repl 10/9/2014 (196,617.65) 11798100 BLS1C 14 U1 Blade Replacements 10/22/2014 (315,992.17) 11798207 RKM1C 15 U1 Major CT Parts Exc 10/8/2015 (5,766,174.23) 11798211 RKM2C 15 U2 CT Parts Exchange 4/1/2015 - 11798274 RKM0C 16 U0 Server Refresh 10/9/2015 - 11798312 RKM1C 14 U1 Pump Overhaul 9/6/2014 (190,112.45) 11798318 RKM1C 15 U1 Pump Overhaul 11/14/2015 (190,850.48) 11798347 RKM0C 15 U0 Compressor Replace 8/31/2015 (340,667.72) 11798714 CHR4C 14 U4 Upgrade Hot Air Ga 10/9/2014 (124,587.80) 11798776 COM2C 2-3 EXTRACTION VALVE OPE 8/30/2013 (234.70) 11799383 COMNCC COAL PILE WIND FENCE MO 12/31/2013 (464.08) 11799784 BLS2C 13 U2 HMI Controls 12/31/2013 (99.53) 11799796 CHR4C 14 U4 BFP Element Replac 11/17/2014 (386,787.01) 11801617 PAW1C - 13 Sootblowing Air Con 2/27/2014 (73,343.58) 11802517 VAL6C - Rplc Evap Cooler 11/16/2015 (225,844.00) 11804533 FLP1C 14 U1 Hot Gas Path - Capital 10/8/2014 (2,154,463.64) 11804634 FSV5C - U5 Overhaul Combustor 10/29/2015 (1,202,821.95) 11804635 FSV6C - U6 Overhaul Combustor 10/29/2015 (1,202,821.95) 11806665 FSV0C U0 Air Compressor New Un 10/8/2015 (129,128.07) 11806669 FSV3C 15 ITH Joint Tensioning 4/24/2015 (161,422.98) 11806842 FSV3C 15 Boiler Feed Pump Upgr 11/2/2015 (25,512.30) 11806847 FSV5C U5 Evap Cooler Drain Sys 11/9/2015 (25,457.00) 11806978 CHR4C 14 U4 Coal Mill Overhaul 10/11/2014 (420,930.77) 11806981 TAH3C Rebuild Unit 3 at Tacoma 11/8/2015 - 11806984 CHR4C 14 U4 Water Tower Rebuild 11/18/2014 (287,010.87) 11806993 CHR0C 15 New Auxiliary Boiler 10/8/2015 (780,740.27) 11807010 CHR4C 15 U4 BFP Element Replacement 10/24/2015 (353,181.58) 11807014 CHR4C 15 Condensate Pump Upgrade 11/20/2015 (56,062.60) 11807018 CHR0C 14 Control Room HVAC Upgrade 10/13/2014 (73,849.88) 11807051 CHR2C 14 Sync Condenser DC Oil 11/19/2014 (420,733.49) 11807054 CHR4C 15 New fill in 2 cooling cell 11/19/2015 (559,437.94) 11807067 CHR4C 15 Condensate Pump Upgrade 10/8/2015 (70,156.14) 11807079 CHR0C 15 New Mobile Crane 10/9/2015 (264,356.50) 11807083 CHR4C 15 Upsize U4 Heat Exch 10/14/2015 (305,026.72) 11807085 CHR4C 15 Cir Water Pump Vib Mon 10/22/2015 (12,323.06) 11807169 TAH1C Replace Unit 1 GSU Transfor 11/1/2015 (407,971.65) 11807174 TAH2C Replace U2 Transformer 11/5/2015 (407,971.65) 11807194 SSH0C-Emergency Generator Inst 7/31/2014 (70,277.36) 11807249 PAW1C 13 Air Heater Basket Replace 4/7/2014 (4,467,278.44) 11807286 PAW1C Sonic Sootblowing System 10/9/2015 (1,169,269.01) 11807302 PAW0C Neutralization Tank Line 5/9/2014 (96,938.56) 11807354 PAW1C Air Register Actuators 4/28/2014 (316,977.52) 11807359 ES0C Cap2014 Small Project Routines 12/30/2014 (687,500.00) 11807361 ES0C Cap2015 Small Project Routines 12/30/2015 (500,000.04) 11807385 PAW1C Primary AH Gas Inlet Dmp 5/14/2014 (86,152.24)
Energy Supply

Attachment No. MRF-1Page 5 of 6
Work Order Number
Description Est ISD 2014 2015 CACJA
11807386 PAW1C Pri Air Fan Inlet Dmpr A 5/14/2014 (86,248.04) 11807392 PAW1C Boiler Comb Monitoring Sys 6/3/2014 (806,749.51) 11807634 PAW1C Boiler Neural Network Op 6/3/2014 (813,486.19) 11807704 PAW1C - U1 Condenser Waterbox 10/13/2014 (112,589.27) 11807708 PAW0C 14 Clarifier Coating 10/9/2014 (477,161.27) 11807715 PAW0C 15 CEDI Modules 10/9/2015 (202,977.93) 11807721 PAW0C 15 RO Module Replacement 10/9/2015 (126,855.50) 11807725 PAW1C 15 Coal Mill Gearbox 10/19/2015 (803,029.09) 11808274 CCH0C Incre Upper Reservoir St 12/28/2015 (819,682.85) 11808355 COM1C REP U1 COAL PIPING 6/30/2014 (1,815,863.72) 11808892 FSV2C U2 Station DC Batteries 8/31/2013 (35,867.60) 11808902 FSV2C U2 CT HVAC Cooling Unit 9/30/2013 (12,458.01) 11809210 CHR0C 13 Scrubber Sump Pump Re 2/27/2014 (86,903.32) 11810395 COM3C - REP 1ST LAYER SCR CAT 12/31/2014 (2,342,654.69) 11810424 COM3C WATER CANNON #5 ADDITION 10/9/2015 (508,377.89) 11810430 COM1C UPGRADE U1 CIRC WATER TO 6/29/2014 (1,598,300.43) 11810436 COM1C INSTALL U1 GEN. FLUX PROBE 5/15/2014 (30,044.04) 11810445 COM1C U1 1C GEARBOX REBUILD 5/31/2014 (995,278.01) 11810446 COM3C ECNMZR ASH SYSTM FLT CON 9/29/2014 (819,380.84) 11810448 COMEC BC 5 A B CONVEYOR COVER 12/15/2015 (512,301.78) 11810449 COM1C REP U1 NERC RELAY 8/1/2014 (559,298.43) 11810450 COM1C REP TURBINE HP IP BLADES 6/30/2014 (3,350,031.15) 11810716 COM1C CWT ACID SUPPLY 10/31/2014 (250,312.37) 11810752 COM3C ACOUSTIC LEAK DETECT SYS 12/15/2015 (284,156.30) 11810761 COM3C REP AIR REGISTR & BURNER TIPS 12/15/2015 (1,135,602.92) 11810764 COM1C REP TURBINE LUBE OIL COO 5/30/2014 (641,477.46) 11810775 COM2C -REP 2B GEARBOX 12/15/2015 (546,062.46) 11810781 COM1C REP 1B1 REVERSE AIR FAN 5/31/2014 (333,524.37) 11810792 COM3C TURBINE BENTLY NEVADA SYSTEM 12/15/2015 (102,235.13) 11810828 COMECC INSTALL TRACK SWITCH TURNOUT 12/15/2015 (100,815.83) 11810838 COM1C REP PLANT LIGHTING LEVEL 4-6 12/15/2015 (146,006.02) 11810843 COM1C REP PLANT LIGHTING LEVEL 1-3 12/15/2015 (145,684.95) 11813042 HAS1C - Small Project Routine 12/29/2013 (20,820.09) 11813047 HAS2C - Small Project Routine 12/29/2013 (47,484.55) 11813048 HASCC - Small Project Routine 12/29/2013 (17,450.52) 11827420 COM3C REP ACC FAN BLADES 3/30/2014 (759,457.41) 11829095 COM0C RECONSTRUCTION BC2 CONVE 5/31/2014 (1,983,077.29) 11832563 PAW0C HVAC 7200 Volt Rm 7/31/2013 (17,835.62) 11837938 ACT0C U1 Shaft DrivenAtom Air 3/31/2014 (119,015.20) 11844460 COM2C REP2A COND PUMP SUCTION 6/1/2014 (11,952.64) 11844784 HAS1C - Battery Room HVAC 2/27/2014 (30,499.28) 11846434 CHR0C Arc Flash Detection Rela 10/31/2013 (212,589.53) 11847416 ES0C ES Cap2014 Transportation 12/31/2014 (183,333.37) 11847417 ES0C ES Cap2015 Transportation 12/31/2015 (399,999.96) 11849594 CHR4C 13 480V Breaker Door Mod 10/31/2013 (5,612.09) 11856529 PAW1C 13 A Main Transformer Bushing 10/6/2013 (154,824.81) 11858971 COM3C U3 M&D CENTER IMPLEMENTATION 12/31/2013 (11,758.20) 11858989 COM0C U1&2 M&D CENTER IMPLEMENTATIO 12/30/2013 (24,183.07) 11862018 SER-PMO-M&D Central Server 3/15/2014 (66,131.83) 11862349 COM2C ECONOMIZR SYSTEM AIR SEP TANK 2/27/2014 (143,542.65) 11862752 FSV3C 13 U3 BFP 31A Overhaul 12/31/2013 (60.22)
Energy Supply

Attachment No. MRF-1Page 6 of 6
Work Order Number
Description Est ISD 2014 2015 CACJA
11865347 RKM2C 13 Combustion Autotune S 2/27/2014 (1.00) 11865507 FSV3C - U3 HRSG Drain Modific 10/23/2013 (83,774.25) 11866583 CHR3C 13 Circ Water Pump OH 2/27/2014 (1.00) 11868813 COM3C REP U3 MAIN STEAM SAFETY 11/30/2014 (70,296.35) 11869665 COMNCC CARRY DECK CRANE 11/30/2013 (48.40) 11871029 FSV3C - U3 HRSG MCC HVAC 12/20/2013 (5,316.10) 11872323 CHR4C 13 Gas Ignitor Valve Rep 2/28/2014 (26,404.71) 11872343 CHR4C 13 Burner Assembly Replace 11/17/2014 (597,271.31) 11872915 PAW1C 13 VSD Batteries 9/30/2013 (9,107.73) 11876857 CHR0C 13 Fuel Gas Regulating Skid 10/31/2014 (1,030,617.03) 11878789 HAS1C -Cooling Tower Transform 2/27/2014 (28,302.01) 11884341 RKM1C 13 U1 Battery Charger 1/30/2014 (69,289.76) 11884741 PAW1C 13 SBAC Upgrades 2/27/2014 (1,441,782.32) 11884744 PAW1C 13 E Mill Motor 3/1/2014 (19,951.65) 11887746 RKM3C 13 Spring Bar Bolted Cle 1/30/2014 (17,175.62) 11889092 COM0C REP RECYCLE ASH RECIRC VALVE 2/15/2014 (7,982.55) 11890393 PAW1C 13 SFC Recirc Valves 11/30/2013 (2,073.95) 11890395 PAW0C 13 Ebasco Warehouse HVAC 12/16/2013 (4,360.41) 11891315 CCH0C Replace Sump Pumps 12/30/2013 (33,132.54) 11894743 FSV3C 13 Compressor Motor Rewind 12/31/2013 (6,932.83) 11894747 PAW1C 13 Mill Guillotine Dampers 6/20/2014 (628,630.81) 11901798 BLS2C 13 Station Battery Repla 2/27/2014 (4,933.56) 11903242 CCH0C Unit A SF6 Breaker Replacemen 12/30/2013 (169,945.30) 11904078 PAW0C 13 VSD UPS 12/23/2013 (64,452.99) 11904892 FSV0C Plant Site Fencing 3/31/2014 (20,381.44) 11907440 FSV0C 13 Chem Lab Roof 2/27/2014 (11,146.63) 11907884 COMNCC BALANCING TOOLS 2/27/2014 (8,496.91) 11912228 FSV3C 13 CT Stage 3 Buckets/Nozzles 12/31/2013 (109.47) 11913586 PAW0C 13 834 Dozer Rebuild 11/30/2013 (120,927.50) 11915333 PAW1C 13 Cooling Tower Fan Mot 2/27/2014 (13,471.82) 11915338 PAW1C 13 Aux Steam Check Valve 12/31/2013 (3,512.99) 11917918 PAW1C 13 Drive Assy/Shroud CWT L 12/31/2013 6,119.25 11939140 CCH0C 2014 Routine Small Proj Cap 12/15/2014 (32,183.74) 11939865 COMNCC FALL PROTECT HOOK OFF PT. 4/30/2014 (5,400.00) 11939892 COM1C INSTALL OVATION SECURITY CEN 5/29/2014 (70,429.83)
Grand Total (401,745,413.10) (728,616,368.21)
Energy Supply

Clean Air Clean Jobs Program - Cherokee Station
2x1 Combined Cycle Project - Summary Cost Estimate
CONTRACT
Baseline
Budget
Current
Estimate Spent to-date
Code Description 17-Apr-12 31-May-14 31-May-14
ENGINEERING CONTRACTS
SIA Site Infrastructure Assessment 1,400,000 1,400,000 0 1,385,042
PMS Program Management Contractor 2,200,000 1,340,000 860,000 1,334,555
SAC Staff Augmentation Contractor 3,000,000 1,425,000 1,575,000 1,207,155
ENG Engineering Contracts 5,500,000 350,000 5,150,000 236,701
OWNER FURNISHED EQUIPMENT
OFE STG, CTG, HRSG, GSU 216,500,000 164,820,000 51,680,000 147,543,428
CONSTRUCTION CONTRACTS
CCC Construction Contractors 244,000,000 319,860,000 -75,860,000 199,204,524
SPECIALTY CONTRACTS
LEG Legal Counsel 700,000 700,000 0 279,904
PMT Permits 1,000,000 800,000 200,000 766,913
TIS Testing, Studies, Surveys 1,390,000 1,500,000 -110,000 395,075
MISCELLANEOUS PURCHASE ORDERS
MPO Miscellaneous Purchase Orders 1,700,000 1,700,000 0 361,388
INDIRECT COSTS
EXP Expenses 363,000 450,000 -87,000 326,795
OVH Overhead & Insurance 6,500,000 6,700,000 -200,000 4,434,285
STC Startup Consumables / Services 7,555,000 8,900,000 -1,345,000 198,596
XLL Company Labor 9,000,000 10,700,000 -1,700,000 5,932,603
XLS Contract Labor 10,155,000 8,350,000 1,805,000 4,887,181
CONTINGENCY
RSK Escalation & Contingency 18,032,000 0 18,032,000 0
$528,995,000 $528,995,000 $0 $368,494,146
TRANSMISSION ASSET UPGRADES
TLS Switchyard Interconnect 2,530,000 2,530,000 0 1,100,000
$531,525,000 $531,525,000 $0 $369,594,146
Budget
Delta
SUB-TOTAL ENERGY SUPPLY
TOTAL PROJECT
Attachment No. MRF-2 Page 1 of 2

Attachment No. MRF-2 Page 2 of 2
Highly Confidential Attachment No. MRF-2A (Cherokee 2X1 Combined Cycle Project Capital Cost Estimate)
Filed Under Seal

Hayden SCR Unit 1 Summary Cost EstimateCONTRACT Baseline Estimate Estimate Budget Delta Spent to-date
Description 01-Sep-11 31-May-13 $ %
Direct Contracts
AE Engineering & Service Contracts 4,277,000 3,823,949 453,051$ 2,963,937 77.5%
CC Construction Contracts 21,728,000 31,787,897 (10,059,897)$ 7,053,987 22.2%
CE Controls Equipment 0 489,639 (489,639)$ 383,336 78.3%
EE Electrical Equipment 1,559,000 60,000 1,499,000$ 0 0.0%
ME Mechancial Equipment 20,843,000 20,616,516 226,484$ 14,204,742 68.9%
Totals $48,407,000 $56,778,001 (8,371,001)$ $24,606,001 43%
Indirects
ZA Misc Site P.O.s 445,000 609,066 (164,066)$ 221,985 36.4%
ZH Xcel Energy Costs 1,838,000 958,650 879,350$ 347,151 36.2%
ZL Xcel Energy Labor 3,018,000 2,520,000 498,000$ 909,186 36.1%
ZS Staff Augmentation Contracts 9,761,000 3,037,815 6,723,185$ 945,037 31.1%
ZZ Contingency 11,368,000 10,007,468 1,360,532$ 0 0.0%
Totals $26,430,000 $17,132,999 9,297,001$ $2,423,359 14.1%
PROJECT TOTAL $74,837,000 $73,911,000 926,000$ $27,029,360 36.6%
Energy Supply Total for PSCO Share (75.5%) $56,501,935 $55,802,805 699,130$ $20,407,167 36.6%
Attachment No. MRF-3 Page 1 of 4

Hayden SCR Unit 2 Summary Cost EstimateCONTRACT Baseline Estimate Current Estimate Budget Delta Spent to-date
Description 01-Sep-11 31-May-14 $ %
Direct Contracts
AE Engineering & Service Contracts 5,219,000 4,108,791 1,110,210$ 2,708,306 65.9%
CC Construction Contracts 26,711,000 35,294,531 (8,583,531)$ 1,277,807 3.6%
CE Controls Equipment 0 244,819 (244,819)$ 191,350 78.2%
EE Electrical Equipment 2,078,000 60,000 2,018,000$ 0 0.0%
ME Mechancial Equipment 24,098,000 25,021,590 (923,590)$ 11,484,315 45.9%
Totals $58,106,000 $64,729,731 (6,623,731)$ $15,661,778 24%
Indirects
ZA Misc Site P.O.s 529,000 716,751 (187,751)$ 199,008 27.8%
ZH Xcel Energy Costs 2,287,000 1,238,650 1,048,350$ 279,787 22.6%
ZL Xcel Energy Labor 3,081,000 3,698,000 (617,000)$ 509,950 13.8%
ZS Staff Augmentation Contracts 10,298,000 4,346,646 5,951,354$ 448,210 10.3%
ZZ Escalation & Contingency 16,219,000 16,350,223 (131,223)$ 0 0.0%
Totals $32,414,000 $26,350,270 6,063,731$ $1,436,954 5.5%
PROJECT TOTAL $90,520,000 $91,080,000 (560,000)$ $17,098,732 18.8%
Energy Supply Total for PSCO Share (37.4%) $33,854,480 $34,063,920 (209,440)$ $6,394,926 18.8%
Attachment No. MRF-3 Page 2 of 4

Attachment No. MRF-3 Page 3 of 4
Attachment No. MRF-3 Page 4 of 4
Highly Confidential Attachment No. MRF-3A (Hayden SCR Project Capital Cost Estimate)
Filed Under Seal

Pawnee CACJA Summary Cost Estimate
CONTRACT
Baseline
Estimate
Current
Estimate Budget Delta Spent to-date
Description 01-Jun-10 31-May-14 $ %
Direct Contracts
AE Engineering & Service Contracts 12,934,711 15,195,471 -2,260,760 14,975,100 98.5%
CC Construction Contracts 74,269,921 147,519,669 -73,249,748 140,710,179 95.4%
CE Controls Equipment 528,217 1,669,026 -1,140,809 1,658,996 99.4%
EE Electrical Equipment 2,291,000 4,535,551 -2,244,551 4,498,430 99.2%
ME Mechancial Equipment 113,826,721 89,882,283 23,944,438 85,473,597 95.1%
Totals $203,850,570 $258,802,000 -$54,951,430 $247,316,302 96%
Indirects
ZA Misc Site P.O.s 2,166,697 776,450 1,390,247 529,087 68.1%
ZH Xcel Energy Costs 5,653,513 1,831,303 3,822,210 1,552,121 84.8%
ZL Xcel Energy Labor 4,584,220 4,421,368 162,852 4,050,615 91.6%
ZS Staff Augmentation Contracts 4,250,000 6,506,879 -2,256,879 5,089,138 78.2%
ZZ Contingency and Escalation 31,539,542 0 31,539,542 0 0.0%
Totals $48,193,972 $13,536,000 $34,657,972 $11,220,961 82.9%
ENERGY SUPPLY TOTAL $252,044,542 $272,338,000 -$20,293,458 $258,537,262 94.9%
Attachment No. MRF-4 Page 1 of 3

Labor
Description
Key
Quantity
Unit
Cost
Total Equipment
Material
Cost
Total
Install
Cost Sub-Contracts Freight & Handling
Sales/Use Tax
2.9% Contingency
Total
Cost
Projected Equipment
Material Cost
ProjectedTotal
Install
Cost
Projected Sub-
Contracts
Projected Total
Cost
Xcel Energy
Clean Air Clean Jobs Program
Pawnee SCR & Scrubber Installation Project
Project Capital Cost Estimate
As Of May 31, 2014
-CONFIDENTIAL-
Project Description/Scope Definition: Equipment/Material Section Labor Section Equipment/Material
Attachment No. MRF-4 Page 2 of 3

Labor
Description
Key
Quantity
Unit
Cost
Total Equipment
Material
Cost
Total
Install
Cost Sub-Contracts Freight & Handling
Sales/Use Tax
2.9% Contingency
Total
Cost
Projected Equipment
Material Cost
ProjectedTotal
Install
Cost
Projected Sub-
Contracts
Projected Total
Cost
Xcel Energy
Clean Air Clean Jobs Program
Pawnee SCR & Scrubber Installation Project
Project Capital Cost Estimate
As Of May 31, 2014
-CONFIDENTIAL-
Project Description/Scope Definition: Equipment/Material Section Labor Section Equipment/Material
ESCALATED TOTAL PROJECT COST $252,044,542 $272,338,000
Note 1
Note 2
Note 3
Note 4
Costs included in Reactor Housing - SCR
Costs included in Inlet Duct -SCR
Costs included in SO2 Removal System - Scrubber
Costs included in Boiler and Duct stiffening and
Fabric Filter Dust Collector Upgrades
Attachment No. MRF-4 Page 3 of 3

Highly Confidential Attachment No. MRF-4A (Pawnee SCR and Scrubber Project Capital Cost Estimate)
Filed Under Seal
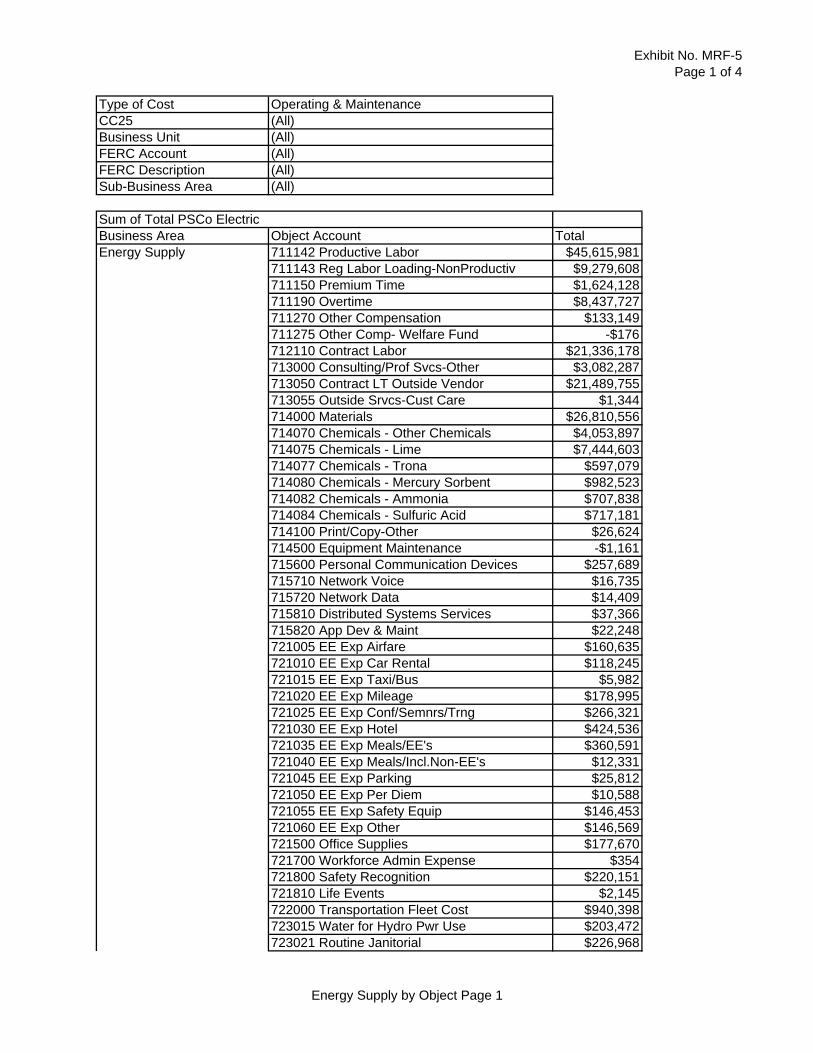
Exhibit No. MRF-5Page 1 of 4
Type of Cost Operating & MaintenanceCC25 (All)Business Unit (All)FERC Account (All)FERC Description (All)Sub-Business Area (All)
Sum of Total PSCo ElectricBusiness Area Object Account TotalEnergy Supply 711142 Productive Labor $45,615,981
711143 Reg Labor Loading-NonProductiv $9,279,608711150 Premium Time $1,624,128711190 Overtime $8,437,727711270 Other Compensation $133,149711275 Other Comp- Welfare Fund -$176712110 Contract Labor $21,336,178713000 Consulting/Prof Svcs-Other $3,082,287713050 Contract LT Outside Vendor $21,489,755713055 Outside Srvcs-Cust Care $1,344714000 Materials $26,810,556714070 Chemicals - Other Chemicals $4,053,897714075 Chemicals - Lime $7,444,603714077 Chemicals - Trona $597,079714080 Chemicals - Mercury Sorbent $982,523714082 Chemicals - Ammonia $707,838714084 Chemicals - Sulfuric Acid $717,181714100 Print/Copy-Other $26,624714500 Equipment Maintenance -$1,161715600 Personal Communication Devices $257,689715710 Network Voice $16,735715720 Network Data $14,409715810 Distributed Systems Services $37,366715820 App Dev & Maint $22,248721005 EE Exp Airfare $160,635721010 EE Exp Car Rental $118,245721015 EE Exp Taxi/Bus $5,982721020 EE Exp Mileage $178,995721025 EE Exp Conf/Semnrs/Trng $266,321721030 EE Exp Hotel $424,536721035 EE Exp Meals/EE's $360,591721040 EE Exp Meals/Incl.Non-EE's $12,331721045 EE Exp Parking $25,812721050 EE Exp Per Diem $10,588721055 EE Exp Safety Equip $146,453721060 EE Exp Other $146,569721500 Office Supplies $177,670721700 Workforce Admin Expense $354721800 Safety Recognition $220,151721810 Life Events $2,145722000 Transportation Fleet Cost $940,398723015 Water for Hydro Pwr Use $203,472723021 Routine Janitorial $226,968
Energy Supply by Object Page 1

Exhibit No. MRF-5Page 2 of 4
Business Area Object Account Total723027 General Interior/Exterior Main $3,556723031 Electric Use Costs $361,213723032 Gas Use Costs $263,076723033 Lawn Care Maint Costs $56,392723034 Sewer Maint Costs $110,823723035 Snow Removal Costs $23,803723036 Trash Removal Costs $3,401723037 Water Use Costs $8,802,212723040 Moves/Adds/Changes $16,598723110 Space -$1,274723130 Equipment Rental $785,970723131 Steam Gen Rents $0723300 Lease Costs -$1723400 Postage $55,989723480 Injuries & Damages $525,000723720 Advertising - General $83723810 Professional Association Dues $24,468723820 Utility Association Dues $220,213723821 Electric Util Assoc Dues $129,585723833 Charitable Contributions $10,413723834 Community Sponsorships $13,005723835 Civic & Political $102723854 Deductions-Corp Tickets $17,511723855 Other Deductions $3,160723860 Bank Charges $5,194723860.1000 Bank Charges -Jt Vtr Oper Acct $2,404723890 Environmental Permits & Fees $710,410723895 License Fees & Permits $721,427723897 Penalties -$636,490724100 Misc O&M Credits -$5,834,635725000 Other $2,354,609725005 Online Information Services $64,615725100 Operating Co. Overheads $1,403,215725100.1000 Op Co OH - A&G $0725110 Craig Partnership O&M $6,633,349
Energy Supply Total $173,165,174Grand Total $173,165,174
Energy Supply by Object Page 1

Exhibit No. MRF-5Page 3 of 4
Type of Cost Operating & MaintenanceObject Account (All)CC25 (All)Sub-Business Area (All)Business Unit (All)
Sum of Total PSCo ElectricBusiness Area FERC Account FERC Description TotalEnergy Supply 417.1 Exp from Non-Utility $0
426.1 Donations $23,418426.3 Penalties -$636,490426.4 Expenditures for Civic, $102426.5 Other Deductions $20,671500 Stm Prod Op & Supr $4,158,191501 Stm Gen Fuel -$128,572502 Steam Expenses Major $34,071,167505 Stm Gen Elec Exp. Major $7,458,131506 Misc Steam Pwr Exp $13,822,550507 Stm Pow Gen Rents $2,428510 Stm Maint Super&Eng $3,324,851511 Stm Maint of Structures $8,906,739512 Stm Maint of Boiler Plt $34,491,153513 Stm Maint of Elec Plant $10,137,836514 Stm Maint of Misc Stm Plt $16,820,552535 Hyd Oper Super & Eng $416,142536 Hyd Oper Water for Pwr $203,520537 Hydro Oper Hydraulic Exp $1,063,782538 Hyd Oper Electric Exp $62,518539 Hydro Oper Misc Gen Exp $1,306,901541 Hydro Mtc Super& Eng $1,362542 Hyd Maint of Structures $793,334543 Hydro Mtc Resv, Dams $871,491544 Hyd Maint of Elec Plant $706,527545 Hyd Mt Misc Hyd Plnt Mjr $243,027546 Oth Oper Super&Eng $1,489,409547 Oth Oper Fuel $3,857548 Oth Oper Gen Exp $2,879,552549 Oth Oper Misc Gen Exp $6,171,553550 Oth Oper Rents $46,844551 Oth Maint Super & Eng $301,819552 Oth Maint of Structures $3,481,494553 Oth Mtc of Gen & Ele Plant $14,813,203554 Oth Mtc Misc Gen Plt Mjr $3,106,742556 Load Dispatch $12,288560 Trans Oper Super & Eng $180,331562 Trans Oper Station Exp $81,723563 Trans Oper OH Lines $2,900566 Trans Oper Misc Exp $4,328568 Trans Mtce Super & Eng $1,192570 Tran Mnt of Station Equip $81,061571 Trans Mt of Overhead Line $6,368580 Dist Oper Sup & Eng $5
Energy Supply by FERC Page 2

Exhibit No. MRF-5Page 4 of 4
Business Area FERC Account FERC Description Total588 Dist Oper Misc Exp $183590 Dist Mtc Super & Eng $435,171598 Dist Maint of Dist Plant $0859 Trans - Other Equip $0863 Trans Mtce Mains $0874 Dist Exp-Mains & Serv $0902 Cust Acct Meter Read $0903 Cust Acct Recrds &Coll $5,194905 Cust Acct Misc $0908 Customer Asst Expense $31920 A&G Salaries $1,873,641921 A&G Office & Supplies $584,666922 A&G Admn Transfer Crdt -$5,834,635923 A&G Outside Services $285,948925 A&G Injuries & Damages $525,000930.1 A&G General Advertising $83930.2 A&G Misc General Exp $4,476,684932 A&G Maint of Structures $0935 A&G Maint of Gen PLT $7,209
Energy Supply Total $173,165,174Grand Total $173,165,174
Energy Supply by FERC Page 2