Embed Size (px)
Citation preview


1
BEAR VALLEY COMMUNITY HEALTHCARE DISTRICT BOARD OF DIRECTORS
SPECIAL FINANCE COMMITTEE MEETING MINUTES 41870 Garstin Drive, Big Bear Lake, CA 92315
December 09, 2019 MEMBERS Donna Nicely, Treasurer Garth Hamblin, CFO PRESENT: Peter Boss, M.D., President Shelly Egerer, Exec. Asst. John Friel, CEO STAFF: Kerri Jex Mary Norman COMMUNITY MEMBERS: None ABSENT: None OPEN SESSION 1. CALL TO ORDER:
Board Member Nicely called the meeting to order at 2:00 p.m.
2. ROLL CALL: Donna Nicely and Peter Boss, M.D. were present. Also present were John Friel, CEO, Garth Hamblin, CFO and Shelly Egerer, Executive Assistant.
3. ADOPTION OF AGENDA:
Board Member Nicely motioned to adopt the December 09, 2019 Finance Committee Meeting Agenda as presented. Second by President Boss to adopt the December 09, 2019 Finance Committee Meeting Agenda as presented. Board Member Nicely called for a vote. A vote in favor of the motion was unanimously approved.
• Board Member Nicely- yes • President Boss- yes
CLOSED SESSION
1. PUBLIC FORUM FOR CLOSED SESSION: Board Member Nicely opened the Hearing Section for Public Comment on Closed Session items at 2:00 p.m. Hearing no request to address the Finance Committee, Board Member Nicely closed the Hearing Section at 2:00 p.m.
2. ADJOURN TO CLOSED SESSION:
Board Member Nicely motioned to adjourn to Closed Session at 2:01 p.m. Second by President Boss to adjourn to Closed Session at 2:01 p.m. Board Member Nicely called for a vote. A vote in favor of the motion was unanimously approved.
• Board Member Nicely- yes • President Boss- yes

2
OPEN SESSION 1. CALL TO ORDER: Board Member Nicely called the meeting to order at 2:30 p.m. 2. RESULTS OF CLOSED SESSION:
Board Member Nicely stated there was no reportable action from Closed Session. 3. PUBLIC FORUM FOR OPEN SESSION:
Board Member Nicely opened the Hearing Section for Public Comment on Open Session items at 2:30 p.m. Hearing no request to address the Finance Committee, Board Member Nicely closed the Hearing Section at 2:30 p.m.
4. DIRECTOR’S COMMENTS:
• None
5. APPROVAL OF MINUTES: A. October 01, 2019
Board Member Nicely motioned to approve October 01, 2019 minutes as presented. Second by President Boss to approve the October 01, 2019 minutes as presented. Board Member Nicely called for a vote. A vote in favor of the motion was unanimously approved.
• Board Member Nicely- yes • President Boss- yes
6. OLD BUSINESS:
• None 7. NEW BUSINESS*
A. Discussion and Potential Recommendation to the Board of Directors of the Fiscal Year 2019 Audited Financial Report: • Mr. Hamblin reported the following information:
o Draft Audited Financial Statement will be presented by Jerrald Tucker w/JWT at the December Business Board Meeting
o Audited financial statement stays in draft form until the Board of Directors approve the document
o Net accounts receivable went down which caused current assets to decrease o TruBridge continues to monitor our unqualified opinion
Board Member Nicely motioned to recommend to the Board of Directors the Fiscal Year 2019 Audited Financial Statement. Second by President Boss to recommend to the Board of Directors the Fiscal Year 2019 Audited Financial Statement. Board Member Nicely called for a vote. A vote in favor of the motion was unanimously approved.
• Board Member Nicely- yes • President Boss- yes
B. Discussion and Potential Recommendation to the Board of Directors of the
Fiscal Year 2019 Medicare Cost Report: • Mr. Hamblin reported that information from the Audited Financial Statement is
used to complete the Annual Medicare Cost Report.

3
o Receivable from $186, 000 from Medicare Board Member Nicely motioned to recommend to the Board of Directors the Fiscal Year 2019 Medicare Cost Report. Second by President Boss to recommend to the Board of Directors the Fiscal Year 2019 Medicare Cost Report. Board Member Nicely called for a vote. A vote in favor of the motion was unanimously approved.
• Board Member Nicely- yes • President Boss - yes
8. PRESENTATION AND REVIEW OF FINACIAL STATEMENTS*
A. October 2019 Finances: • Mr. Hamblin reported the following information:
o $2.8 million days cash on hand o Surplus of $197,151 o Total patient revenue was over by 0.8% o Expenses are over due to the gas line leak o YTD operations are over budget o SNF census is 14 o Surplus of $1,120,549 is $185,539 more than budget, and $664,162 more than
the first four months of last year o Clinic and dental visits have decreased in patient visits
o COH has been going through some staff transitions o No shows at the clinic
• Ms. Jex reported that staff continues to try to get more patients and that the DON
and CNO will be visiting hospitals in our area to inform of services we offer and try to bring the census up. Mailers are to be sent to the senior community, potential to have an open house and lunch at the senior center.
B. CFO Report:
• Mr. Hamblin reported the following information: o Continue to work closely with TruBridge; would like to be under 60 days
o FTE Report: ○ Overall, we have 16 out of 30 departments that are under budget ○ Made changes through attrition
o HIM department is staffed with lower FTE o Acute is full staff (when we are low census we staff accordingly) o SNF when we have 13 patients is when we flex o Positions are being looked at with staffing and if there is a way to reduce
staff o ER staffing will be looked at; house supervisors are included in the SNF
and ER o Laboratory is staffed appropriately; is open 24 hours a day seven days a
week o EVS and Admitting are being reviewed o HR will decrease, one HR employee resigned o Dietary department received a resignation and will only hire as a .5
in lieu of a full-time position Dietary manager is due to begin December 23

4
o IT Strategic Plan Update ○ Continuing to view plan and moving forward ○ Highly successful in areas of improvement ○ HIPAA work group has been formed and meets
o IT Cyber Security Insurance ○ Continue to evaluate cyber insurance ○ Premiums are quite high and looking for appropriate insurance and cost ○ At this time, we do not have Cyber Insurance
o Policy & Procedure Department Update o IT, Purchasing, HIM, Accounting, Patient Accounting, Patient Access
o IT policies are being developed and under review o Admitting policies are under review o HIM policies will be reviewed by the Policy & Procedure Committee
Board Member Nicely motioned to approve the October 2019 Finance Report and CFO Report as presented. Second by Board Member Boss to approve the October 2019 Finance Report and CFO Report as presented. Board Member Nicely called for a vote. A vote in favor of the motion was unanimously approved.
• Board Member Nicely- yes • President Boss- yes
9. ADJOURNMENT*
Board Member Nicely motioned to adjourn the meeting at 3:25 p.m. Second by President Boss to adjourn the meeting. Board Member Nicely called for a vote. A vote in favor of the motion was unanimously approved.
• Board Member Nicely- yes • President Boss- yes

Finance Report
December 2019 Results
BVCHD Financial Packet - December 2019 - page 1 of 17

Summary for December 2019
• Cash on hand $ 2,131,639Investments $27,602,939
• Days Cash on hand, including investments with LAIF – 434
• Surplus of $586,082 for the month was over budget by $8,732
• Total Patient Revenue was under Budget by 2.7% for the month
• Net Patient Revenue was 0.9% over budget.• Total Expenses were 2.0% higher than budget
BVCHD Financial Packet - December 2019 - page 2 of 17

-
5,000,000
10,000,000
15,000,000
20,000,000
25,000,000
30,000,000
35,000,000
Jul-
15A
ug-
15
Sep
-15
Oct
-15
No
v-1
5D
ec-
15
Jan
-16
Feb
-16
Mar
-16
Ap
r-16
May
-16
Jun
-16
Jul-
16A
ug-
16
Sep
-16
Oct
-16
No
v-1
6D
ec-
16
Jan
-17
Feb
-17
Mar
-17
Ap
r-17
May
-17
Jun
-17
Jul-
17A
ug-
17
Sep
-17
Oct
-17
No
v-1
7D
ec-
17
Jan
-18
Feb
-18
Mar
-18
Ap
r-18
May
-18
Jun
-18
Jul-
18A
ug-
18
Sep
-18
Oct
-18
No
v-1
8D
ec-
18
Jan
-19
Feb
-19
Mar
-19
Ap
r-19
May
-19
Jun
-19
Jul-
19A
ug-
19
Sep
-19
Oct
-19
No
v-1
9D
ec-
19
Cash & Investments
Cash Investments
(1,000,000)
(500,000)
-
500,000
1,000,000
1,500,000
2,000,000Ju
l-15
Au
g-1
5Se
p-1
5O
ct-1
5N
ov-
15
De
c-1
5Ja
n-1
6Fe
b-1
6M
ar-1
6A
pr-
16M
ay-1
6Ju
n-1
6Ju
l-16
Au
g-1
6Se
p-1
6O
ct-1
6N
ov-
16
De
c-1
6Ja
n-1
7Fe
b-1
7M
ar-1
7A
pr-
17M
ay-1
7Ju
n-1
7Ju
l-17
Au
g-1
7Se
p-1
7O
ct-1
7N
ov-
17
De
c-1
7Ja
n-1
8Fe
b-1
8M
ar-1
8A
pr-
18M
ay-1
8Ju
n-1
8Ju
l-18
Au
g-1
8Se
p-1
8O
ct-1
8N
ov-
18
De
c-1
8Ja
n-1
9Fe
b-1
9M
ar-1
9A
pr-
19M
ay-1
9Ju
n-1
9Ju
l-19
Au
g-1
9Se
p-1
9O
ct-1
9N
ov-
19
De
c-1
9
Surplus / (Loss)
Actual Budget
BVCHD Financial Packet - December 2019 - page 3 of 17
-
10
20
30
40
50
60
70
Actual Budget Linear (Actual)
Patient Days - Acute
-
10
20
30
40
50
60
70
80
Actual Budget Linear (Actual)
Patient Days - Swing
BVCHD Financial Packet - December 2019 - page 4 of 17

250
300
350
400
450
500
550
600
650Patient Days - Skilled Nursing Facility
Actual Budget Linear (Actual)
350
550
750
950
1,150
1,350
1,550Emergency Room Visits
Actual Budget Linear (Actual)
BVCHD Financial Packet - December 2019 - page 5 of 17

500
1,000
1,500
2,000
2,500
3,000 Clinics Medical Visits
actual budget Linear (actual)
30
80
130
180
230
280
330
380
430
480Dental V isits
Actual Budget Linear (Actual)
Dental Visits
BVCHD Financial Packet - December 2019 - page 6 of 17

2,500,000
3,000,000
3,500,000
4,000,000
4,500,000
5,000,000
5,500,000
6,000,000
Jul-
15A
ug-
15
Sep
-15
Oct
-15
No
v-1
5D
ec-
15
Jan
-16
Feb
-16
Mar
-16
Ap
r-16
May
-16
Jun
-16
Jul-
16A
ug-
16
Sep
-16
Oct
-16
No
v-1
6D
ec-
16
Jan
-17
Feb
-17
Mar
-17
Ap
r-17
May
-17
Jun
-17
Jul-
17A
ug-
17
Sep
-17
Oct
-17
No
v-1
7D
ec-
17
Jan
-18
Feb
-18
Mar
-18
Ap
r-18
May
-18
Jun
-18
Jul-
18A
ug-
18
Sep
-18
Oct
-18
No
v-1
8D
ec-
18
Jan
-19
Feb
-19
Mar
-19
Ap
r-19
May
-19
Jun
-19
Jul-
19A
ug-
19
Sep
-19
Oct
-19
No
v-1
9D
ec-
19
Actual Budget
Revenue
750,000
1,250,000
1,750,000
2,250,000
2,750,000
3,250,000
3,750,000
Jul-
15A
ug-
15
Sep
-15
Oct
-15
No
v-1
5D
ec-
15
Jan
-16
Feb
-16
Mar
-16
Ap
r-16
May
-16
Jun
-16
Jul-
16A
ug-
16
Sep
-16
Oct
-16
No
v-1
6D
ec-
16
Jan
-17
Feb
-17
Mar
-17
Ap
r-17
May
-17
Jun
-17
Jul-
17A
ug-
17
Sep
-17
Oct
-17
No
v-1
7D
ec-
17
Jan
-18
Feb
-18
Mar
-18
Ap
r-18
May
-18
Jun
-18
Jul-
18A
ug-
18
Sep
-18
Oct
-18
No
v-1
8D
ec-
18
Jan
-19
Feb
-19
Mar
-19
Ap
r-19
May
-19
Jun
-19
Jul-
19A
ug-
19
Sep
-19
Oct
-19
No
v-1
9D
ec-
19
Net Patient Revenue
Actual Budget
BVCHD Financial Packet - December 2019 - page 7 of 17

1,400,000
1,500,000
1,600,000
1,700,000
1,800,000
1,900,000
2,000,000
2,100,000
2,200,000
2,300,000
2,400,000
Jul-
15A
ug-
15
Sep
-15
Oct
-15
No
v-1
5D
ec-
15
Jan
-16
Feb
-16
Mar
-16
Ap
r-16
May
-16
Jun
-16
Jul-
16A
ug-
16
Sep
-16
Oct
-16
No
v-1
6D
ec-
16
Jan
-17
Feb
-17
Mar
-17
Ap
r-17
May
-17
Jun
-17
Jul-
17A
ug-
17
Sep
-17
Oct
-17
No
v-1
7D
ec-
17
Jan
-18
Feb
-18
Mar
-18
Ap
r-18
May
-18
Jun
-18
Jul-
18A
ug-
18
Sep
-18
Oct
-18
No
v-1
8D
ec-
18
Jan
-19
Feb
-19
Mar
-19
Ap
r-19
May
-19
Jun
-19
Jul-
19A
ug-
19
Sep
-19
Oct
-19
No
v-1
9D
ec-
19
Total Operating Expenses
Actual Budget
Total Expenses
130.0
135.0
140.0
145.0
150.0
155.0
160.0
165.0
170.0
175.0
180.0FTE - Total Paid
Actual Budget by Month Budget full year
FTE
BVCHD Financial Packet - December 2019 - page 8 of 17

0
20
40
60
80
100
120
140
160Ju
l-15
Au
g-1
5Se
p-1
5O
ct-1
5N
ov-
15
De
c-1
5Ja
n-1
6Fe
b-1
6M
ar-1
6A
pr-
16M
ay-1
6Ju
n-1
6Ju
l-16
Au
g-1
6Se
p-1
6O
ct-1
6N
ov-
16
De
c-1
6Ja
n-1
7Fe
b-1
7M
ar-1
7A
pr-
17M
ay-1
7Ju
n-1
7Ju
l-17
Au
g-1
7Se
p-1
7O
ct-1
7N
ov-
17
De
c-1
7Ja
n-1
8Fe
b-1
8M
ar-1
8A
pr-
18M
ay-1
8Ju
n-1
8Ju
l-18
Au
g-1
8Se
p-1
8O
ct-1
8N
ov-
18
De
c-1
8Ja
n-1
9Fe
b-1
9M
ar-1
9A
pr-
19M
ay-1
9Ju
n-1
9Ju
l-19
Au
g-1
9Se
p-1
9O
ct-1
9N
ov-
19
De
c-1
9
A/R - Gross Days
-
2,000,000
4,000,000
6,000,000
8,000,000
10,000,000
12,000,000
14,000,000
16,000,000Ju
l-15
Au
g-1
5Se
p-1
5O
ct-1
5N
ov-
15
De
c-1
5Ja
n-1
6Fe
b-1
6M
ar-1
6A
pr-
16M
ay-1
6Ju
n-1
6Ju
l-16
Au
g-1
6Se
p-1
6O
ct-1
6N
ov-
16
De
c-1
6Ja
n-1
7Fe
b-1
7M
ar-1
7A
pr-
17M
ay-1
7Ju
n-1
7Ju
l-17
Au
g-1
7Se
p-1
7O
ct-1
7N
ov-
17
De
c-1
7Ja
n-1
8Fe
b-1
8M
ar-1
8A
pr-
18M
ay-1
8Ju
n-1
8Ju
l-18
Au
g-1
8Se
p-1
8O
ct-1
8N
ov-
18
De
c-1
8Ja
n-1
9Fe
b-1
9M
ar-1
9A
pr-
19M
ay-1
9Ju
n-1
9Ju
l-19
Au
g-1
9Se
p-1
9O
ct-1
9N
ov-
19
De
c-1
9
A/R - $
BVCHD Financial Packet - December 2019 - page 9 of 17

December 2019 Financial Results
For the month . . .
Total Patient Revenue for December 2019 was $5,018,492 - this was $138,714 or 2.7% lower than budget.
While lower than budget, total patient revenue for the month was $902,091 more than the previous month
(November 2019). Emergency Room revenue was 4.9% more than budget. Inpatient revenue was 12.5%
higher than budget.
Revenue deductions of $2,647,107 were lower than budget by 5.7%.
Total Operating Revenue of $2,396,757 was $42,154 or 1.7% lower than budget.
Total Expenses of $2,229,691 were 2.0% higher than budget.
Our surplus for the month of December 2019 was $586,082. This was $8,732 higher than the budgeted
amount for the month.
Our Operating Cash and Investments total $29,734,578 as of the end of month. Total days cash on hand as
of the end of December 2019 are 434.
Key Statistics
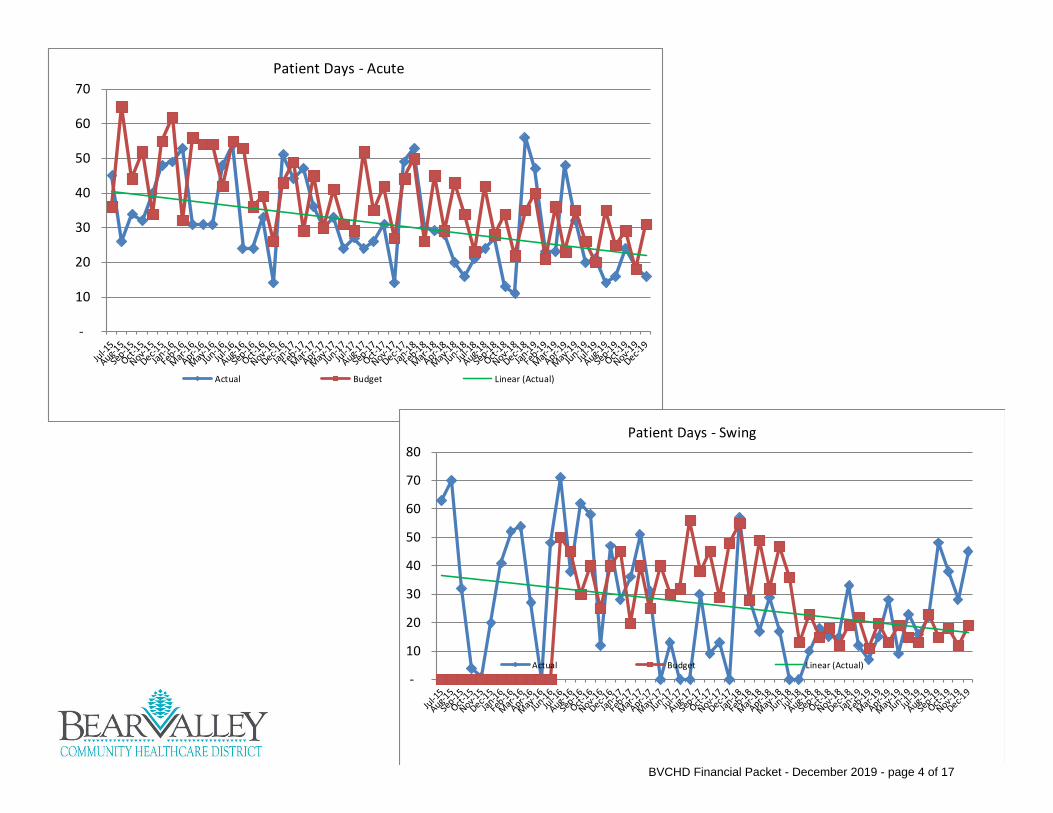
Acute patient days of 16 were about half the budgeted number of 31. Swing days of 45 were more than 2
times the budgeted number. Skilled Nursing Facility days of 432 were 145% lower than budget – our
Average Daily Census was 13.9. ER Visits of 1,236 were 3.8% lower than budget. Clinics Medical visits were
under budget while Dental visits were over budget.
FTE continue to run under budget.
Year To Date - Through the first 6 months of our Fiscal Year
Total Patient Revenue is 0.3% higher than budget
Total Operating Revenue is 3.2% higher than budget
Total Operating Expenses are 2.9% more than budget
Our Surplus of $1,724,157 is $202,700 more than budget, and $554,157 more than the first 6 months of last
year
BVCHD Financial Packet - December 2019 - page 10 of 17

A B C D E F G H I J
FY 17/18 FY 17/18
Actual Actual Budget Amount % Actual Actual Budget Amount %
1 Total patient revenue 4,986,477 5,018,492 5,157,206 (138,714) -2.7% 25,923,624 27,123,276 27,039,568 83,708 0.3%
2 Total revenue deductions 2,588,523 2,647,107 2,807,021 (159,914) -5.7% 13,813,777 14,098,152 14,753,664 (655,512) -4.4%3 % Deductions 52% 53% 54% 53% 52% 55%4 Net Patient Revenue 2,397,954 2,371,385 2,350,185 21,200 0.9% 12,109,847 13,025,124 12,285,904 739,220 6.0%5 % Net to Gross 48% 47% 46% 47% 48% 45%6 Other Revenue 4,359 25,372 88,726 (63,354) -71.4% 215,530 205,448 531,766 (326,318) -61.4%
7 Total Operating Revenue 2,402,313 2,396,757 2,438,911 (42,154) -1.7% 12,325,377 13,230,572 12,817,670 412,902 3.2%
8 Total Expenses 2,176,983 2,229,691 2,186,757 42,934 2.0% 12,477,620 13,111,959 12,747,394 364,565 2.9%9 % Expenses 44% 44% 42% 48% 48% 47%
10 Surplus (Loss) from Operations 225,330 167,066 252,154 (85,088) 33.7% (152,243) 118,613 70,275 48,337 -68.8%11 % Operating margin 5% 3% 5% -1% 0% 0%12 Total Non-operating 294,474 419,017 325,197 93,820 28.9% 1,322,243 1,605,544 1,451,182 154,362 10.6%
13 Surplus/(Loss) 519,805 586,082 577,351 8,732 -1.5% 1,170,000 1,724,157 1,521,457 202,700 -13.3%14 % Total margin 10% 12% 11% 5% 6% 6%
A B C D E
December December NovemberFY 17/18 FY 18/19 FY 18/19
Amount %
15 Gross Accounts Receivables 8,675,554 9,512,758 9,129,843 382,915 4.2%16 Net Accounts Receivables 2,990,625 3,014,176 2,852,276 161,900 5.7%17 % Net AR to Gross AR 34% 32% 31%
18 Days Gross AR 66.0 65.7 64.9 0.8 1.2%19 Cash Collections 1,642,959 1,981,049 1,500,891 480,158 32.0%20 Settlements/IGT Transactions 204,278 159,520 57,346 102,174 178.2%21 Investments 20,260,225 27,602,939 25,454,833 2,148,106 8.4%22 Cash on hand 1,688,071 2,131,639 3,058,371 (926,732) -30.3%23 Total Cash & Invest 21,948,296 29,734,578 28,513,204 1,221,374 4.3%24 Days Cash & Invest 339 434 417 17 4.1%
Total Cash and Investments 21,948,296 29,734,578 Increase Current Year vs. Prior Year 7,786,282
BALANCE SHEET
FY 18/19
VARIANCE
Bear Valley Community Healthcare District
Financial Statements December, 2019
Financial Highlights──Hospital
STATEMENT OF OPERATIONS
FY 18/19 VARIANCE
Current Month Year-to-Date
VARIANCE
BVCHD Financial Packet - December 2019 - page 11 of 17

Bear Valley Community Healthcare District
Financial Statements December, 2019
A B C D E F G H I J
FY 17/18 FY 17/18
Actual Actual Budget Amount % Actual Actual Budget Amount %
Gross Patient Revenue
1 Inpatient 284,233 160,880 143,022 17,858 12.5% 799,893 769,735 760,404 9,331 1.2%2 Outpatient 765,170 714,674 910,564 (195,890) -21.5% 5,256,697 5,033,404 5,298,504 (265,099) -5.0%3 Clinic Revenue 339,847 338,589 410,336 (71,747) -17.5% 2,239,262 2,247,229 2,516,846 (269,617) -10.7%4 Emergency Room 3,383,606 3,636,063 3,466,260 169,803 4.9% 16,289,624 17,814,284 17,116,317 697,967 4.1%5 Skilled Nursing Facility 213,621 168,287 227,024 (58,737) -25.9% 1,338,147 1,258,623 1,347,498 (88,875) -6.6%
6 Total patient revenue 4,986,477 5,018,492 5,157,206 (138,714) -2.7% 25,923,624 27,123,276 27,039,568 83,708 0.3%
Revenue Deductions
7 Contractual Allow 2,406,874 2,425,259 2,497,033 (71,774) -2.9% 12,880,266 13,413,076 13,128,375 284,701 2.2%
8 Contractual Allow PY (150,000) (175,000) - (175,000) #DIV/0! (1,243,374) (1,024,101) - (1,024,101) #DIV/0!9 Charity Care 4,625 38,889 13,854 25,035 180.7% 80,630 96,123 72,638 23,485 32.3%10 Administrative 26,102 68 16,882 (16,814) -99.6% 44,449 23,065 88,513 (65,448) -73.9%11 Policy Discount 9,975 16,444 15,085 1,359 9.0% 78,951 87,336 79,091 8,245 10.4%12 Employee Discount 5,688 2,568 6,307 (3,739) -59.3% 36,321 25,125 33,069 (7,944) -24.0%13 Bad Debts 198,143 253,297 257,860 (4,563) -1.8% 1,211,634 1,043,844 1,351,978 (308,134) -22.8%14 Denials 177,395 85,583 - 85,583 #DIV/0! 724,901 433,685 - 433,685 #DIV/0!15 Total revenue deductions 2,588,523 2,647,107 2,807,021 (159,914) -5.7% 13,813,777 14,098,152 14,753,664 (655,512) -4.4%
16 Net Patient Revenue 2,397,954 2,371,385 2,350,185 21,200 0.9% 12,109,847 13,025,124 12,285,904 739,220 6.0%-
40.2% 40.2% 40.2% 40.2% 447.4% 447.4% 0.0%
39.2% 39.2% 39.2% 39.2% 437.2% 437.2% 0.0%
17 Other Revenue 4,359 25,372 88,726 (63,354) -71.4% 215,530 205,448 531,766 (326,318) -61.4%
18 Total Operating Revenue 2,402,313 2,396,757 2,438,911 (42,154) -1.7% 12,325,377 13,230,572 12,817,670 412,902 3.2%
Expenses
19 Salaries 945,048 914,346 886,673 27,673 3.1% 5,269,800 5,470,712 5,269,316 201,396 3.8%20 Employee Benefits 295,949 305,507 329,791 (24,284) -7.4% 1,642,013 1,853,651 1,926,294 (72,643) -3.8%21 Registry 29,974 - - - #DIV/0! 29,974 5,100 - 5,100 #DIV/0!22 Salaries and Benefits 1,270,971 1,219,853 1,216,464 3,389 0.3% 6,941,787 7,329,464 7,195,610 133,854 1.9%23 Professional fees 169,550 174,740 216,812 (42,072) -19.4% 1,047,087 1,056,064 1,173,642 (117,578) -10.0%24 Supplies 136,723 177,659 150,192 27,467 18.3% 797,752 986,975 849,799 137,176 16.1%25 Utilities 42,170 36,316 46,171 (9,855) -21.3% 256,370 257,141 273,222 (16,081) -5.9%26 Repairs and Maintenance 42,197 77,722 47,756 29,966 62.7% 182,400 345,715 285,938 59,777 20.9%27 Purchased Services 320,095 342,734 326,453 16,281 5.0% 2,217,686 1,936,881 1,872,514 64,367 3.4%28 Insurance 28,560 31,653 30,917 736 2.4% 170,008 189,641 185,502 4,139 2.2%29 Depreciation 81,905 83,739 78,725 5,014 6.4% 464,348 499,166 472,350 26,816 5.7%30 Rental and Leases 11,158 15,541 12,370 3,171 25.6% 67,624 73,289 74,220 (931) -1.3%32 Dues and Subscriptions 10,898 6,272 6,488 (216) -3.3% 38,090 36,048 38,928 (2,880) -7.4%33 Other Expense. 62,756 63,462 54,409 9,053 16.6% 294,467 401,575 325,669 75,906 23.3%
34 Total Expenses 2,176,983 2,229,691 2,186,757 42,934 2.0% 12,477,620 13,111,959 12,747,394 364,565 2.9%
35 Surplus (Loss) from Operations 225,330 167,066 252,154 (85,088) 33.7% (152,243) 118,613 70,275 48,337 -68.8%
36 Non-Operating Income37 Tax Revenue 184,244 201,917 201,917 - 0.0% 1,105,464 1,211,502 1,211,502 - 0.0%38 Other non-operating - 75,040 5,750 69,290 1205.0% 44,095 132,743 34,500 98,243 284.8%
Interest Income 117,923 149,497 125,100 24,397 19.5% 218,540 306,633 250,600 56,033 22.4%Interest Expense (7,693) (7,438) (7,570) 132 -1.7% (45,856) (45,333) (45,420) 87 -0.2%IGT Expense - - - - #DIV/0! - - - - #DIV/0!
39 Total Non-operating 294,474 419,017 325,197 93,820 28.9% 1,322,243 1,605,544 1,451,182 154,362 10.6%
40 Surplus/(Loss) 519,805 586,082 577,351 8,732 -1.5% 1,170,000 1,724,157 1,521,457 202,700 -13.3%
Total Revenue Deductions as a percent to
gross revenue including Prior Year Contractual Allowances as a percent to
gross revenue WO PY and Other CA
FY 18/19 VARIANCE FY 18/19 VARIANCE
Statement of Operations
Current Month Year-to-Date
BVCHD Financial Packet - December 2019 - page 12 of 17

Current Year Trending Statement of Operations
A Statement of Operations──CURRENT YEAR 20201 2 3 4 5 6 7 8 9 10 11 12
July Aug Sept Oct Nov Dec Jan Feb Mar Apr May June YTD
Gross Patient Revenue
1 Inpatient 132,376 109,683 117,618 135,332 113,846 160,880 769,735 2 Outpatient 852,704 893,759 883,248 900,575 788,445 714,674 5,033,404 3 Clinic 369,855 413,535 386,658 398,761 339,831 338,589 2,247,229 4 Emergency Room 2,937,844 3,116,633 2,904,860 2,531,862 2,687,022 3,636,063 17,814,284 5 Skilled Nursing Facility 234,536 237,879 218,184 212,481 187,257 168,287 1,258,623
6 Total patient revenue 4,527,315 4,771,490 4,510,568 4,179,010 4,116,401 5,018,492 - - - - - - 27,123,276
Revenue Deductions C/A 0.45 0.53 0.47 0.48 0.56 0.48 #DIV/0! #DIV/0! #DIV/0! #DIV/0! #DIV/0! #DIV/0! 0.49
7 Contractual Allow 2,048,634 2,523,579 2,128,363 1,986,465 2,300,777 2,425,259 13,413,076 8 Contractual Allow PY (100,000) (150,040) (150,000) (150,000) (299,061) (175,000) (1,024,101) 9 Charity Care 21,771 10,036 2,177 5,803 17,447 38,889 96,123 10 Administrative 9,113 (337) 5,344 3,687 5,190 68 23,065 11 Policy Discount 11,209 16,516 14,783 15,253 13,132 16,444 87,336 12 Employee Discount 7,850 3,870 1,620 6,914 2,302 2,568 25,125 13 Bad Debts 262,975 160,654 203,254 98,670 64,994 253,297 1,043,844 14 Denials 56,797 58,918 53,258 96,348 82,780 85,583 433,685
15
Total revenue
deductions 2,318,349 2,623,196 2,258,799 2,063,140 2,187,561 2,647,107 - - - - - - 14,098,152 0.51 0.55 0.50 0.49 0.53 0.53 #DIV/0! #DIV/0! #DIV/0! #DIV/0! #DIV/0! #DIV/0!
16 Net Patient Revenue 2,208,966 2,148,293 2,251,769 2,115,870 1,928,841 2,371,385 - - - - - - 13,025,124
net / tot pat rev 48.8% 45.0% 49.9% 50.6% 46.9% 47.3% #DIV/0! #DIV/0! #DIV/0! #DIV/0! #DIV/0! #DIV/0! 48.0%
17 Other Revenue 4,070 26,718 4,820 140,781 3,687 25,372 205,448
18
Total Operating
Revenue 2,213,036 2,175,012 2,256,589 2,256,651 1,932,528 2,396,757 - - - - - - 13,230,572
Expenses
19 Salaries 909,799 920,881 905,534 902,906 917,246 914,346 5,470,712 20 Employee Benefits 314,164 285,924 374,193 257,931 315,932 305,507 1,853,651 21 Registry - - - 4,380 720 - 5,100 22 Salaries and Benefits 1,223,962 1,206,805 1,279,728 1,165,217 1,233,898 1,219,853 - - - - - - 7,329,464 23 Professional fees 227,413 134,001 176,263 176,896 166,751 174,740 1,056,064 24 Supplies 157,037 146,720 158,949 174,312 172,298 177,659 986,975 25 Utilities 45,550 47,425 46,842 40,886 40,122 36,316 257,141 26 Repairs and Maintenance 38,865 29,353 29,812 135,968 33,995 77,722 345,715 27 Purchased Services 302,946 319,068 323,112 365,076 283,943 342,734 1,936,881 28 Insurance 32,000 31,410 31,548 31,515 31,515 31,653 189,641 29 Depreciation 82,105 82,105 83,739 83,739 83,739 83,739 499,166 30 Rental and Leases 12,010 11,891 12,918 10,463 10,466 15,541 73,289 32 Dues and Subscriptions 7,130 5,446 5,785 5,299 6,116 6,272 36,048 33 Other Expense. 56,525 72,916 73,560 64,758 70,355 63,462 401,575
34 Total Expenses 2,185,543 2,087,141 2,222,256 2,254,129 2,133,199 2,229,691 - - - - - - 13,111,959
35
Surplus (Loss) from
Operations 27,492 87,870 34,333 2,522 (200,671) 167,066 - - - - - - 118,613
36 Non-Operating Income
37 Tax Revenue 201,917 201,917 201,917 201,917 201,917 201,917 1,211,502 38 Other non-operating 25,040 9,000 20 40 23,603 75,040 132,743
Interest Income 300 286 156,148 212 190 149,497 306,633 Interest Expense (7,711) (7,590) (7,541) (7,540) (7,513) (7,438) (45,333) IGT Expense - - - - - - -
39 Total Non-operating 219,546 203,612 350,544 194,629 218,196 419,017 - - - - - - 1,605,544
40 Surplus/(Loss) 247,038 291,483 384,877 197,151 17,526 586,082 - - - - - - 1,724,157
Bear Valley Community Healthcare DistrictFinancial Statements
Input Trend Stmt Ops Monthly Operating Report December 19BVCHD Financial Packet - December 2019 - page 13 of 17

2019-20 Actual BS
BALANCE SHEET PY
Includes Final Entries 6-30-19 July Aug Sept Oct Nov Dec June
ASSETS:
Current AssetsCash and Cash Equivalents (Includes CD's) 2,992,558 3,178,108 3,141,519 2,853,286 3,058,371 2,131,639 2,406,940Gross Patient Accounts Receivable 8,667,951 8,621,871 9,149,724 8,858,810 9,128,887 9,511,803 8,792,362 Less: Reserves for Allowances & Bad Debt 5,919,643 5,911,721 6,297,145 6,112,108 6,276,611 6,497,627 5,906,428Net Patient Accounts Receivable 2,748,308 2,710,149 2,852,579 2,746,702 2,852,276 3,014,176 2,885,934Tax Revenue Receivable 2,423,000 2,423,000 2,423,000 2,423,000 2,040,789 1,100,642 46,556Other Receivables 90,680 126,745 113,997 605,220 -118,588 -87,096 80,710Inventories 130,378 130,687 123,077 117,611 124,523 132,932 136,982Prepaid Expenses 420,319 422,235 425,830 473,165 415,216 397,410 406,467Due From Third Party Payers 0 0Due From Affiliates/Related Organizations 0 0Other Current Assets 0 0
Total Current Assets 8,805,242 8,990,924 9,080,003 9,218,984 8,372,587 6,689,703 5,963,589
Assets Whose Use is Limited
Investments 25,298,992 25,298,992 25,454,833 25,454,833 25,454,833 27,602,939 25,298,992Other Limited Use Assets 144,375 144,375 144,375 144,375 144,375 144,375 144,375
Total Limited Use Assets 25,443,367 25,443,367 25,599,208 25,599,208 25,599,208 27,747,314 25,443,367
Property, Plant, and EquipmentLand and Land Improvements 570,615 570,615 570,615 570,615 570,615 570,615 570,615Building and Building Improvements 10,063,006 10,087,902 10,105,802 10,110,802 10,110,802 10,110,802 10,063,006Equipment 12,367,216 12,390,920 12,483,917 12,555,150 12,624,831 12,677,717 12,365,728Construction In Progress 220,454 221,354 221,354 221,886 221,886 233,163 220,454Capitalized Interest Gross Property, Plant, and Equipment 23,221,290 23,270,791 23,381,687 23,458,453 23,528,134 23,592,297 23,219,802Less: Accumulated Depreciation 14,657,536 14,739,641 14,823,380 14,907,119 14,990,857 15,074,596 14,575,430
Net Property, Plant, and Equipment 8,563,754 8,531,150 8,558,308 8,551,334 8,537,277 8,517,700 8,644,372
TOTAL UNRESTRICTED ASSETS 42,812,363 42,965,441 43,237,518 43,369,526 42,509,072 42,954,717 40,051,328
Restricted Assets 0 0 0 0 0 0 0
TOTAL ASSETS 42,812,363 42,965,441 43,237,518 43,369,526 42,509,072 42,954,717 40,051,328
BVCHD Financial Packet - December 2019 - page 14 of 17

2019-20 Actual BS
BALANCE SHEET PY
Includes Final Entries 6-30-19 July Aug Sept Oct Nov Dec June
LIABILITIES:
Current LiabilitiesAccounts Payable 1,109,879 948,094 1,080,601 1,024,845 1,022,614 968,794 922,125Notes and Loans PayableAccrued Payroll 814,113 894,578 1,021,042 1,105,147 666,489 886,860 733,342Patient Refunds PayableDue to Third Party Payers (Settlements) 3,279,267 3,416,509 3,287,677 3,388,603 3,145,949 3,118,768 3,311,092Advances From Third Party PayersCurrent Portion of Def Rev - Txs, 2,256,083 2,054,166 1,852,249 1,655,332 1,453,415 1,251,498 35,000Current Portion - LT Debt 35,000 35,000 35,000 40,000 40,000 40,000 35,000Current Portion of AB915Other Current Liabilities (Accrued Interest & Accrued Other) 15,339 22,930 30,471 37,971 45,451 7,560 7,689
Total Current Liabilities 7,509,682 7,371,277 7,307,040 7,251,897 6,373,917 6,273,481 5,044,247
Long Term DebtUSDA Loan 2,860,000 2,860,000 2,860,000 2,855,000 2,855,000 2,815,000 2,860,000Leases Payable 0 0 0 0 0 0 0 Less: Current Portion Of Long Term Debt 35,000 35,000 35,000 40,000 40,000 40,000 35,000
Total Long Term Debt (Net of Current) 2,825,000 2,825,000 2,825,000 2,815,000 2,815,000 2,775,000 2,825,000
Other Long Term LiabilitiesDeferred Revenue 0 0 0 0 0 0 0Other 0 0 0 0 0
Total Other Long Term Liabilities 0 0 0 0 0 0 0
TOTAL LIABILITIES 10,334,682 10,196,277 10,132,040 10,066,897 9,188,917 9,048,481 7,869,248
Fund BalanceUnrestricted Fund Balance 32,230,643 32,230,643 32,182,080 32,182,080 32,182,080 32,182,080 24,871,960Temporarily Restricted Fund Balance 0 0 0Equity Transfer from FRHG 0 0 0Net Revenue/(Expenses) 247,038 538,521 923,398 1,120,549 1,138,075 1,724,157 7,310,120
TOTAL FUND BALANCE 32,477,681 32,769,164 33,105,478 33,302,629 33,320,154 33,906,237 32,182,080
TOTAL LIABILITIES & FUND BALANCE 42,812,363 42,965,441 43,237,518 43,369,526 42,509,072 42,954,717 40,051,328
BVCHD Financial Packet - December 2019 - page 15 of 17

Units of ServiceFor the period ending: December 31, 2019
31 184
Current Month Bear Valley Community Hospital Year-To-Date
Dec-18 Act.-Act. Dec-18 Act.-Act.
Actual Budget Actual Variance Var % Var % Actual Budget Actual Variance Var % Var %
16 31 56 (15) -48.4% -71.4% Med Surg Patient Days 197 158 152 39 24.7% 29.6%
45 19 33 26 136.8% 36.4% Swing Patient Days 110 100 91 10 10.0% 20.9%
432 500 474 (68) -13.6% -8.9% SNF Patient Days 2,835 3,066 2,981 (231) -7.5% -4.9%
493 550 563 (57) -10.4% -12.4% Total Patient Days 3,142 3,324 3,224 (182) -5.5% -2.5%
10 14 21 (4) -28.6% -52.4% Acute Admissions 48 84 66 (36) -42.9% -27.3%
6 14 20 (8) -57.1% -70.0% Acute Discharges 45 84 65 (39) -46.4% -30.8%
2.7 2.2 2.8 0.5 20.4% -4.8% Acute Average Length of Stay 4.4 1.9 2.3 2.5 132.7% 87.2%
0.5 1.0 1.8 (0.5) -48.4% -71.4% Acute Average Daily Census 1.1 1 0.8 0.2 24.7% 29.6%
15.4 16.7 16.4 (1.4) -8.1% -5.9% SNF/Swing Avg Daily Census 16.0 17 16.7 (1.2) -7.0% -4.1%
15.9 17.7 18.2 (1.8) -10.4% -12.4% Total Avg. Daily Census 17.1 18 17.5 (1.0) -5.5% -2.5%
35% 39% 40% -4% -10.4% -12.4% % Occupancy 38% 40% 39% -2% -5.5% -2.5%
6 13 13 (7) -53.8% -53.8% Emergency Room Admitted 32 78 51 (46) -59.0% -37.3%
1,230 1,272 5,770 (42) -3.3% -78.7% Emergency Room Discharged 5,844 6,075 5,770 (231) -3.8% 1.3%
1,236 1,285 5,783 (49) -3.8% -78.6% Emergency Room Total 5,876 6,153 5,821 (277) -4.5% 0.9%
40 41 187 (2) -3.8% -78.6% ER visits per calendar day 32 33 32 (2) -4.5% 0.9%
60% 93% 62% 57% 61.5% -3.1% % Admits from ER 67% 93% 77% 78% 84.3% -13.7%
- - - - 0.0% #DIV/0! Surgical Procedures I/P 1 - - 1 0.0% #DIV/0!
15 12 12 3 25.0% 25.0% Surgical Procedures O/P 56 76 77 (20) -26.3% -27.3%
15 12 12 3 25.0% 25.0% TOTAL Procedures 57 76 77 (19) -25.0% -26.0%
826 1,047 751 (221) -21.1% 10.0% Surgical Minutes Total 4,838 6,214 4,018 (1,376) -22.1% 20.4%
Actual -BudgetActual -BudgetDec-19 Dec-19
BVCHD Financial Packet - December 2019 - page 16 of 17

Units of ServiceFor the period ending: December 31, 2019
31 184
Current Month Bear Valley Community Hospital Year-To-Date
Dec-18 Act.-Act. Dec-18 Act.-Act.
Actual Budget Actual Variance Var % Var % Actual Budget Actual Variance Var % Var %
5,955 5,742 5,742 213 3.7% 3.7% Lab Procedures 38,407 36,823 4,919 1,584 4.3% 680.8%
999 1,043 1,039 (44) -4.2% -3.8% X-Ray Procedures 4,909 5,072 4,178 (163) -3.2% 17.5%
378 350 336 28 8.0% 12.5% C.T. Scan Procedures 1,907 1,635 1,664 272 16.6% 14.6%
170 180 163 (10) -5.6% 4.3% Ultrasound Procedures 1,202 1,252 1,289 (50) -4.0% -6.7%
43 62 36 (19) -30.6% 19.4% Mammography Procedures 323 372 328 (49) -13.2% -1.5%
353 288 262 65 22.6% 34.7% EKG Procedures 1,760 1,658 1,537 102 6.2% 14.5%
146 135 107 11 8.1% 36.4% Respiratory Procedures 643 584 588 59 10.1% 9.4%
1,052 1,078 1,176 (26) -2.4% -10.5% Physical Therapy Procedures 9,111 8,484 8,357 627 7.4% 9.0%
1,665 1,892 1,593 (227) -12.0% 4.5% Primary Care Clinic Visits 10,911 11,995 10,418 (1,084) -9.0% 4.7%
281 250 245 31 12.4% 14.7% Specialty Clinic Visits 1,558 1,500 1,901 58 3.9% -18.0%
1,946 2,142 1,838 (196) -9.2% 5.9% Clinic 12,469 13,495 12,319 (1,026) -7.6% 1.2%
75 82 71 (8) -9.2% 5.9% Clinic visits per work day 69 74 68 (6) -7.6% 1.2%
15.5% 20.00% 16.70% -4.50% -22.50% -7.19% % Medicare Revenue 18.48% 20.00% 19.37% -1.52% -7.58% -4.56%
33.30% 39.00% 34.20% -5.70% -14.62% -2.63% % Medi-Cal Revenue 38.48% 39.00% 37.57% -0.52% -1.32% 2.44%
45.00% 36.00% 42.90% 9.00% 25.00% 4.90% % Insurance Revenue 38.47% 36.00% 37.95% 2.47% 6.85% 1.36%
6.20% 5.00% 6.20% 1.20% 24.00% 0.00% % Self-Pay Revenue 4.57% 5.00% 5.12% -0.43% -8.67% -10.75%
140.2 152.0 150.6 (11.9) -7.8% -6.9% Productive FTE's 144.13 150.4 142.9 (6.3) -4.2% 0.8%
158.7 168.6 164.1 (9.9) -5.9% -3.3% Total FTE's 162.95 167.0 164.1 (4.0) -2.4% -0.7%
Dec-19 Actual -Budget Dec-19 Actual -Budget
BVCHD Financial Packet - December 2019 - page 17 of 17

CFO REPORT for
February 2020 Finance Committee and Board Meetings
FY 2021 (July 1, 2020 through June 30, 2021) Budget Preparation Plan
Attached is a plan for budget preparation over the next several months.
District Credit Card – Limit
The limit on the district credit card was established in 1999 at $5,000. There are times
when we need to make purchases of large amounts or when a number of purchases
combine to near the limit purchases need tio be delayed unto q payment is made. We
propose that the limit be raised to as much as $10,00.
Purchasing Assessment by QHR
Two consultants from Quorum Health Resources were on-site on January 27 and 28th to
work with our new Purchasing Coordinator.
CMS Proposed Rule
CMS has proposed a rule regarding Medicaid (the Medicaid Fiscal Accountability Regulation – MFAR). The proposal would impact virtually every state. Concerns are that - The proposed changes would have a devastating effect on the health care safety net in California and on the lives of many patients. State flexibility in funding the non-federal share of Medicaid is essential in making the Medi-Cal program work. Without it, the Medi-Cal program would not be able to provide coverage to 13 million Californians. A concern is CMS should not adopt a one-size-fits-all approach and restrict the legitimate use of local governmental funds, health-care related taxes, or provider-related donations in a manner that gives the agency unrestrained authority, using overly broad standards that could lead to arbitrary decisions and an uneven application across state Medicaid programs.

Pricing Transparency Issue – Update
We continue to monitor the issue of Pricing Transparency. Originally this was scheduled
to be in place by January 2020. During the fall the effective date was moved to January
2021. I have included some key points from a recent presentation by QHR relative to this
topic.
The Call from President Trump:
“Hospitals will be required to publish prices that reflect what people actually pay for
services in a way that is clear, straightforward and accessible to all, and you will be able
to price it among many different potential providers, and you will get great pricing. Prices
will come down by numbers that you wouldn’t believe… and the cost of healthcare will go
way, way down.” “We should also require drug companies, insurance companies, and
hospitals to disclose real prices to foster competition and bring costs down.”
In November 2019, following the publishing of final regulations the effective date was
changed to January 2021
“The Administration had previously proposed plans to force only hospitals to reveal
pricing information. This goes one step further and requires the same information from
insurers.” – CMS Administrator Seema Verma
Definition of Shoppable Services
• A service that can be scheduled in advance.
• Commonly provided by the hospital to its patient population.
• Includes all ancillary/supporting services associated with the designated primary
shoppable service.
• Minimum of 300 Shoppable Services, 70 of which are specified by CMS Regulation. If
hospital does not provide one or more of the 70 noted by CMS, the hospital must select
additional shoppable services required to meet the total 300 minimum threshold
Definition of “Standard Charges”
• The Gross Charge (the charge for an individual item or service that is reflected on a
hospital’s chargemaster).

• The discounted cash price (the charge that applies toan individual who pays cash for a
hospital item or service).
• The Payer-specific negotiated charge ( the charge that a hospital has negotiated with a
third-party payer for an item or service).
• The de-identified minimum negotiated charges (the lowest charge that hospital has
negotiated with all third-party payers).
• The de-identified maximum negotiated charges (the highest charge that a hospital has
negotiated with all third-party payers)
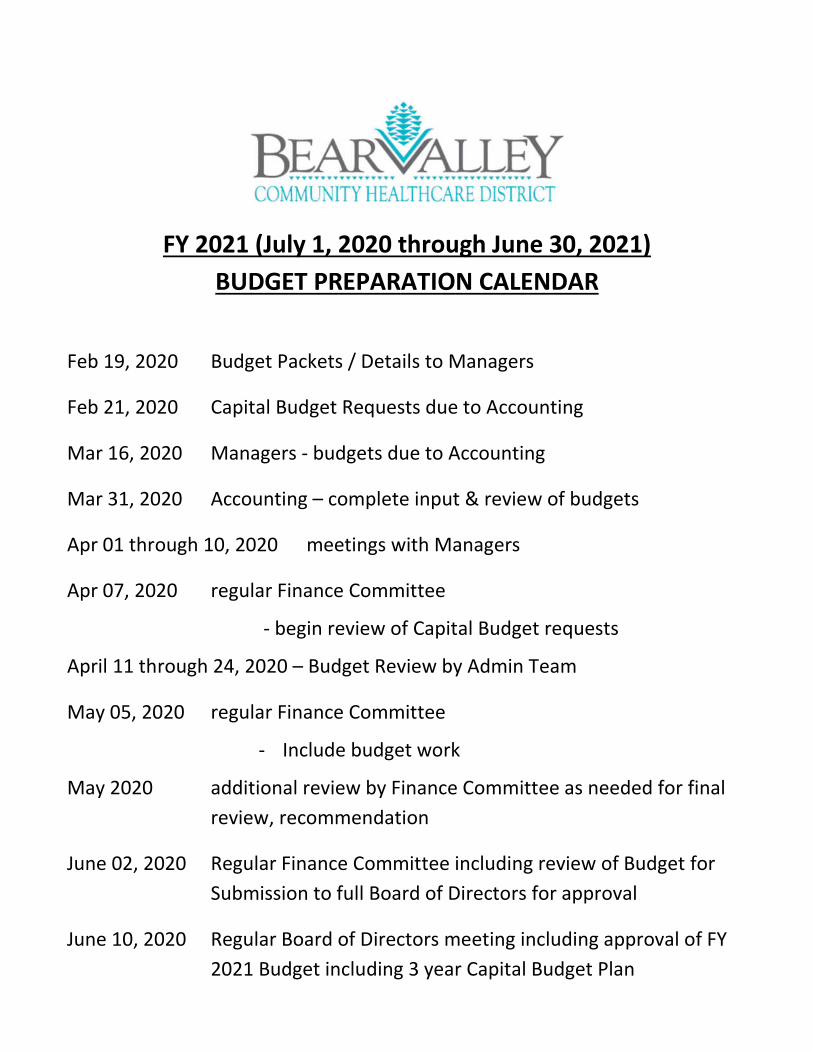
FY 2021 (July 1, 2020 through June 30, 2021)
BUDGET PREPARATION CALENDAR
Feb 19, 2020 Budget Packets / Details to Managers
Feb 21, 2020 Capital Budget Requests due to Accounting
Mar 16, 2020 Managers - budgets due to Accounting
Mar 31, 2020 Accounting – complete input & review of budgets
Apr 01 through 10, 2020 meetings with Managers
Apr 07, 2020 regular Finance Committee
- begin review of Capital Budget requests
April 11 through 24, 2020 – Budget Review by Admin Team
May 05, 2020 regular Finance Committee
- Include budget work
May 2020 additional review by Finance Committee as needed for final
review, recommendation
June 02, 2020 Regular Finance Committee including review of Budget for
Submission to full Board of Directors for approval
June 10, 2020 Regular Board of Directors meeting including approval of FY
2021 Budget including 3 year Capital Budget Plan