Embed Size (px)
Citation preview

NOTES TO THE CONSOLIDATED FINANCIAL STATEMENTS FOR THE NINE MONTHS ENDED
30 SEPTEMBER 2006
(in millions of euros)
7 December 2006

NOTES TO THE CONSOLIDATED FINANCIAL STATEMENTS
CONTENTS
(Figures in millions of euros) NOTES
1. Significant events of the period (page 3)
2. IFRS accounting policies (page 6)
3. Non-current assets (page 9)
4. Consolidated shareholders’ equity (page 11)
5. Non-current and current provisions (page 12)
6. Non-current tax assets and liabilities (page 14)
7. Non-current and current debt (page 15)
8. Main components of change in net debt (page 16)
9. Analysis of sales and other revenues from operations (page 17)
10. Operating profit (page 18)
11. Cost of net debt (page 19)
12. Income tax expense (page 20)
13. Segment information (page 21)
14. Off balance sheet commitments (page 22)
15. Changes in scope of consolidation: discontinued and held-for-sale operations (page 23)
16. Principal exchange rates (page 24)
1

• The consolidated financial statements of the Bouygues group are prepared using the principles and
methods defined in International Financial Reporting Standards (IFRS) as adopted by the European Union (European Council Regulation 1606/2002 of 19 July 2002).
• They have been prepared in millions of euros, and comprise:
the balance sheet and income statement;
the statement of changes in shareholders’ equity;
the cash flow statement;
the notes to the financial statements.
The comparatives presented are taken from the consolidated financial statements prepared at 31 December 2005 and 30 September 2005. In addition, nine-month comparatives are provided for the income statement, in accordance with the relevant recommendations.
2

NOTE 1
SIGNIFICANT EVENTS OF THE PERIOD 1.1. SCOPE OF CONSOLIDATION AS AT 30 SEPTEMBER 2006 • Main changes in scope of consolidation:
1,005 companies consolidated as at 30 September 2006 (compared with 983 as at 31 December 2005). The net change during the first nine months of 2006 relates primarily to:
a) Bouygues Construction: acquisitions of subsidiaries by ETDE (Thermal Transfer/UK, etc) and
various construction project joint ventures set up or deconsolidated on project completion.
b) Various acquisitions (net of divestments) by Colas. • Sale of Novasaur:
At 31 December 2005, the Bouygues group held a 9.88% interest in Novasaur, the holding company of the Saur group. This entire interest (shares, and bonds redeemable for cash or shares) was sold for €41 million during the first quarter of 2006, generating a net gain of €27 million.
• Sale of TPS:
On 17 March 2006 Vivendi notified the DGCCRF (the French government department with responsibility for competition matters) of the agreement reached with TF1 and M6 on 6 January 2006 with a view to the merger of TPS and CanalSatellite, involving the acquisition by Vivendi of exclusive control over TPS. The parties were informed on 31 August 2006 that the French Ministry of the Economy and Finance had authorised the merger of TPS and the pay-TV content production and distribution activities of the Canal+ Group in France.
Under the agreements governing the transitional period until final completion of the merger, TF1 ceased to govern the operating and financial policies of TPS with effect from 1 September 2006, and hence ceased to exercise control over TPS.
Because some parameters used in determining the gain on disposal have not yet been finalised, no gain on disposal was recognised in the consolidated financial statements as at 30 September 2006. As at this date, TPS is therefore reported as a held-for-sale operation, with its net profit recognised for the period to 31 August 2006 inclusive.
1.2. SUPPLEMENTARY BOND ISSUE OF €250 MILLION On 31 January 2006, Bouygues carried out a bond issue of €250 million, supplementary to the initial July 2005 issue of €750 million. The issue matures in 2020, was priced at 97.203%, and bears interest at 4.25%. This issue extends the average maturity of the Group’s debt.
3

1.3. SALE OF BOUYGUES TELECOM CARAÏBE (BTC) On 28 April 2006, following fulfilment of all the sale conditions, Bouygues Telecom sold its wholly-owned subsidiary BTC to Digicel Limited (Jamaica) for €155.4 million. The sale generated a gain of €110.2 million, reported in “Net profit of discontinued and held-for-sale operations” in the income statement. 1.4. ACQUISITION OF ALSTOM SHARES On 26 April 2006, Alstom and Bouygues signed a cooperation agreement approved by the Board of Directors of the two groups. On 26 June 2006, the European Commission authorised the acquisition by Bouygues of the interest held by the French government in Alstom (29,051,244 shares, representing 21.01% of the capital). At 30 September 2006, after purchasing further shares in the market, Bouygues held 24.37% of the capital and voting rights of Alstom. The investment in Alstom is accounted for by the equity method, and is carried at net acquisition cost of €2,294 million under “Investments in associates”. This amount includes Bouygues’ share of Alstom’s consolidated shareholders’ equity, plus all identifiable assets and liabilities at fair value (in process of valuation at 30 September 2006) and goodwill. • The valuation process ongoing at 30 September 2006 involves:
a) comparing the accounting policies of the two groups (in particular elective treatments under IFRS) so as to ensure consistency of treatment in the Alstom opening balance sheet as at 26 June 2006;
b) measuring the fair value of identifiable assets and liabilities (together with the related depreciation
and amortisation), and determining the amount of goodwill.
This process is due to be finalised in time for the preparation of the 31 December 2006 consolidated financial statements.
• Because the valuation process is ongoing, Bouygues’ share of the consolidated net profit of the Alstom
Group for the three months to 30 September 2006 has not been recognised in the financial statements as of that date, because certain components of Alstom’s profit contribution are incomplete at this stage.
• A figure for Alstom’s net contribution to Bouygues’ consolidated net profit, approved by the auditors, is
due to be included in the consolidated income statement for the year ended 31 December 2006. 1.5. OTHER BOND ISSUES • In order to secure long-term refinancing for part of the investment in Alstom, Bouygues carried out a
euro-denominated bond issue in May 2006, in two tranches:
a) €1,150 million maturing 2013, priced at 99.812% and bearing interest at 4.50%.
b) €600 million maturing 2016, priced at 99.657% and bearing interest at 4.75%.
4

1.6. SIGNIFICANT EVENTS AND CHANGES IN SCOPE OF CONSOLIDATION SUBSEQUENT TO 30 SEPTEMBER 2006 In early October 2006, Bouygues carried out a £400 million 20-year bond issue on the sterling market, paying interest in sterling at 5.5%. Standard & Poors have confirmed that the issue has the same A- rating as the Bouygues group generally. This issue is being used to refinance the euro-denominated acquisition of Alstom. Consequently, Bouygues has contracted a swap with the bankers who acted as lead managers on the issue. The swap has the same maturity as the bond issue, and converts the sterling debt into euro debt at a euro equivalent interest rate of 5.01%.
5

NOTE 2
IFRS ACCOUNTING POLICIES 2.1. As required by European Council Regulation 1606/2002, adopted 19 July 2002, the Bouygues group has
prepared its consolidated financial statements in accordance with the accounting standards issued by the International Accounting Standards Board (IASB) as adopted by the European Union.
These standards, collectively referred to as International Financial Reporting Standards (IFRS), also include International Accounting Standards (IAS) and interpretations issued by the Standing Interpretations Committee (SIC) and the International Financial Reporting Interpretations Committee (IFRIC). • The accounting policies applied in the interim consolidated financial statements are the same as
those applied in the consolidated financial statements as at 31 December 2005 (except as indicated below), and consequently are not reproduced in detail in note 2.
Roadbuilding (Colas) is a seasonal business. The depreciation charge for this business recognised in the income statement for the nine months ended 30 September 2006 is proportional to monthly sales, as computed on the basis of annual forecasts.
Basis of preparation
- In accordance with IAS 34, “Interim Financial Reporting”. - Measurement at historical cost, except for certain items (in particular financial assets and financial
liabilities) which are measured at fair value. Preparing financial statements to comply with IFRS requires the use of estimates and assumptions which may have affected the amounts reported for assets, liabilities and contingent liabilities at the balance sheet date, and the amounts of income and expenses reported for the financial year. These estimates and assumptions have been applied consistently on the basis of past experience and of various other factors regarded as reasonable forming the basis of assessments of the valuations of assets and liabilities for accounting purposes. Actual results may differ materially from these estimates if different assumptions or conditions apply. Where no standard or interpretation applies to a specific transaction, Group management has exercised its judgement to define and apply accounting policies that will provide relevant and reliable financial information, such that the financial statements:
- give a true and fair view of the financial position, financial performance and cash flows of the Group; - reflect the economic reality of the underlying transactions; - are impartial, prudent, and complete in all material respects.
6

2.2. CONSOLIDATION METHODS • Companies over which Bouygues exercises control are consolidated using the full consolidation method. • Exclusive control over TF1:
- Under French law (Article 39 of law no. 86-1067 of 30 September 1986), no single individual or corporation (acting alone or in concert) may directly or indirectly own more than 49% of the capital or voting rights of a company with a nationwide terrestrial television broadcasting licence.
- Bouygues holds 42.89% of the capital and 42.94% of the voting rights of TF1.
- Exclusive control by Bouygues over TF1 is demonstrated by the fact that:
Bouygues has consistently and regularly held a substantial majority of the voting rights exercised at TF1 shareholders’ meetings, and no other shareholder directly or indirectly controls a higher share of voting rights than Bouygues.
Bouygues has clearly had exclusive power to determine decisions at TF1 shareholders’ meetings during at least two consecutive financial years (article L233-16 II of the Commercial Code).
Other factors indicating the existence of exclusive control include:
- the large number of seats on the TF1 Board of Directors allocated to Bouygues; - the role of Bouygues in appointing key executives of TF1.
All these factors clearly establish that Bouygues exercises exclusive control over TF1.
The relationship between Bouygues and TF1 also meets the criteria stipulated in articles L233-3 I & II of the Commercial Code relating to de facto control by one company over another.
• Companies under the joint control of more than one shareholder are consolidated by the proportionate
consolidation method, based on the percentage of control held. Companies over which Bouygues exercises significant influence (associates) are consolidated using the equity method Alstom.
Cofiroute:
Although less than 20% owned (16.7%), Cofiroute is consolidated using the equity method, as Bouygues exercises significant influence through its seats on the Board of Directors.
In accordance with IAS 39 on financial instruments, investments in non-consolidated companies are recognised at fair value and are subject to impairment tests.
Changes in scope of consolidation:
30 September 2006 31 December 2005
Fully consolidated 777 760
Proportionately consolidated 199 197
Equity method 29 26 1,005 983
The main changes during the first nine months of 2006 are described in “Significant Events”.
7

2.3. FINANCIAL INDICATORS Definitions of key financial indicators: 2.3.1. EBITDA Current operating profit plus net amortisation expense plus net charges to provisions and depreciation expense minus reversals of provisions no longer required minus investment grants released to income. 2.3.2. Free cash flow Cash flow minus cost of net debt minus income tax expense for the period minus net capital expenditure for the period. 2.3.3. Net debt This represents the aggregate of:
- cash and equivalents; - overdrafts and short-term bank borrowings; - non-current and current debt; - financial instruments (used to hedge financial liabilities measured at fair value).
2.4. OTHER INFORMATION Comparability of the financial statements for the nine months ended 30 September 2006: • As explained in note 2.1, the accounting policies applied at 30 September 2006 do not impair
comparability of balance sheet, income statement and cash flow statement items with 2005. • In accordance with IFRS 5, TPS, which is in process of divestment, is shown on the separate lines used
to report held-for-sale assets and operations in the consolidated balance sheet and income statement.
The gain arising on the disposal of Bouygues Telecom Caraïbe, sold in April 2006, is reported in “Net profit of discontinued and held-for-sale operations” in the consolidated income statement.
• The impact of changes in the scope of consolidation during the nine months ended 30 September 2006
does not affect the comparability of the financial statements with the restated 2005 figures.
8

NOTE 3 13,962
3.1. PROPERTY, PLANT AND EQUIPMENT
31 December 2005 949 2,975 539 152 4,615of which finance leases 20 29 48 97
30 September 2006 1,050 2,865 591 294 4,800of which finance leases 18 30 32 80
Analyses of the carrying amount and net acquisitions of intangible assets and property, plant and equipment by business segment are providedin Note 13, "Segment information".
3.2. INTANGIBLE ASSETS
Carrying amount Concessions, patents and Other intangible Totalsimilar rights assets
31 December 2005 807 249 1,056
30 September 2006 770 258 1,028
3.3. OTHER NON-CURRENT FINANCIAL ASSETS AND NON-CURRENT TAX ASSETS
Carrying amount Associates Investments in non-consolidated companies
Other non-current assets
Non-current tax assets
Total
31 December 2005 497 114 169 375 1,155
30 September 2006 2,840 106 179 262 3,387
(1) Acquisition of 24.37% of Alstom: effect +€2,294 million; see "Significant events".(2) Including goodwill on associates.(3) See Note 6 for details.
Carrying amount TotalLand and buildings
Industrial plant and equipment
Other property, plant and
equipment
PP&E under construction and
advance payments
NON-CURRENT ASSETS
(1)(2)
(3)
9

3.4. GOODWILL
3.4.1. Movement in the carrying amount of goodwill in the nine months to 30 September 2006
Gross value Impairment Carrying amount
1 January 2006 4,641 (23) 4,618Change in scope of consolidation 125 125Impairment lossesTranslation and other movements 4 4
30 September 2006 4,770 (23) 4,747
(1) The main movements in the first nine months of 2006 relate to acquisitions by Bouygues Construction (ETDE subsidiaries, etc) and Colas.
3.4.2. Split of goodwill by cash generating unit (CGU) (excluding goodwill on associates)
00/01/1900Segment 30 September 2006 31 December 2005
Total % of parent Total % of parentBouygues Construction 213 99.97% 106 99.97%Colas 829 96.49% 805 96.42%TF1 1,056 42.81% 1,047 42.93%Bouygues Telecom 2,645 89.55% 2,655 89.55%Other activities 4 5
TOTAL 4,747 4,618
(1) Includes segment level goodwill on subsidiaries.
3.5. CONSOLIDATED PURCHASE PRICE OF LISTED SHARES (TF1 AND COLAS)
Consolidated Average quotedpurchase share priceprice per 30 September 2006share (1) (2)
TF1 10.89 24.85
Colas 69.35 207.97
(1) Carrying amount per share in the consolidated financial statements.(2) Average of quoted share prices between 1 September 2006 and 30 September 2006.
(1)
(1)
10

NOTE 4 6,151
4.1. SHARE CAPITAL OF BOUYGUES SA (IN EUROS) €339,784,223
As at 30 September 2006, the share capital of Bouygues SA consisted of 339,784,223 shares.Movements in the nine months ended 30 September 2006 were as follows:
1 January 2006 Movements during the periodReductions Increases
Shares 336,289,029 3,495,194Investment certificates 473,867 (473,867)
Number of shares and certificates 336,762,896 (473,867) 3,495,194
Par value € 1 - -
Share capital (in euros) 336,762,896 (473,867) 3,495,194
4.2. STATEMENT OF CHANGES IN SHAREHOLDERS' EQUITY FOR THE NINE MONTHS ENDED 30 SEPTEMBER 2006 (AMOUNTS ATTRIBUTABLE TO THE GROUP AND MINORITY INTERESTS)
Share capital and share premium
Reserves related to
capital and retained earnings
Translation reserve
Consolidated reserves and
profit for period
Treasury shares
Items recognised directly in
equity
Total 30/09/06
Attributable to the Group 2,305 1,040 15 1,911 (167) 64 5,168Minority interests 930 53 983
Total shareholders' equity 2,305 1,040 15 2,841 (167) 117 6,151
4.2.1. Change in shareholders' equity attributable to the Group and minority interests
An analysis of movements during the period is presented in the 30 September 2006 consolidated financial statements.
4.3. ANALYSIS OF MOVEMENTS IN ITEMS RECOGNISED DIRECTLY IN EQUITY IN THE NINE MONTHS ENDED 30 SEPTEMBER 2006 (AMOUNTS ATTRIBUTABLE TO THE GROUP) (included in "Share premium and reserves" or "Translation reserve" in the balance sheet)
Note 9 months to 30/09/06
Translation reserve 4.3.1. (29)Financial instruments (changes in fair value) 66Share-based payment 8Other movements (1) (37)
Total 8
(1) Includes network dismantling and depreciation: impact -€8.6 million (Bouygues Telecom: prior-year impact)
4.3.1. Translation reserve
Principal translation differences at 30 September 2006 on companies reporting in:
31/12/05 Movements in the period 30/09/06
US dollar 18 (1)Canadian dollar 14 11Other 12 5
Total 44 15
(19)(3)(7)
(29)
Position at 30 September 2006
30 September 2006
339,784,223
339,784,223
€ 1
339,784,223
CONSOLIDATED SHAREHOLDERS' EQUITY
11

1,286NOTE 5
656
5.1. NON-CURRENT PROVISIONS = 1,286
Long-term employee benefits
Litigation and claims
Guarantees given
Other non-current
provisionsTOTAL
(1) (2) (3) (4)
1 January 2006 368 309 232 356 1,265
Translation adjustments (1) (1) (2)
Transfers between items and other 2 (6) 6 2
Changes in scope of consolidation (1) 4 18 21
Charges to provisions 32 52 44 40 168
Provisions utilised (8) (19) (25) (48) (100)
Provisions no longer required (1) (49) (6) (12) (68)
30 September 2006 392 287 248 359 1,286
(1) Long-term employee benefits:● Lump-sum retirement benefits and long-service awards 369● Other long-term employee benefits 23
NB: The Bouygues group makes only very limited use of defined-benefit pension plans in France and other countries (Colas/USA-UK, etc).
(2) Litigation and claims:● Provisions for customer disputes and subcontractor claims 149● Other litigation and claims 138
(3) Guarantees given:● Provisions for additional building and civil works guarantees 41● Provisions for other guarantees given 207
(4) Other non-current provisions:● Risks related to tax and other official inspections 109● Provisions for subsidiaries and associates 56● Provisions for site remediation costs 83● Other provisions for non-current risks 111
NON-CURRENT AND CURRENT PROVISIONS
12

5.2. CURRENT PROVISIONS = 656
Provisions related to the operating cycle
Provisions for
customer warranties
Provisions for project risks and project
completion
Provisions for losses
to completion
Provisions for customer
loyalty programmes
Other current
provisionsTotal
1 January 2006 31 153 132 174 186 676
Translation adjustments (2) (1) (3)
Transfers between items and other 2 5 7
Changes in scope of consolidation (1) (5) 3 (5) (3) (11)
Charges to provisions 11 36 29 103 50 229
Provisions utilised (10) (21) (54) (89) (46) (220)
Provisions no longer required (1) (11) (5) (1) (4) (22)
30 September 2006 30 150 106 182 188 656
(1) including:- provisions for project completion costs 73- provisions for project risks (works/branches) 77
(2) Provisions relating to the construction business segment
(3) including:- provisions for excess on insurance claims 46- other provisions for current risks 142
(1) (2) (3)
13

NOTE 6 NON-CURRENT TAX ASSETS AND LIABILITIES 262 76
6.1. NON-CURRENT TAX ASSETS = 262
31/12/05 Change 30/09/06
Deferred tax assets 375 (134) 241
- Bouygues Telecom 203 (155) 48- Other business segments 172 21 193
Other non-current tax assets 0 21 21
Total non-current tax assets 375 (113) 262
6.2. NON-CURRENT TAX LIABILITIES = 76
31/12/05 Change 30/09/06
Deferred tax liabilities 89 (13) 76
Other non-current tax liabilities 0 0 0
Total non-current tax liabilities 89 (13) 76
(1) Relating primarily to Colas
(1)
14

NOTE 7
7.1. DEBT BY MATURITY
Current Non-current debt Total Totaldebt non-current non-current
<1 year 1-2 years 2-3 years 3-4 years 4-5 years 5-6 years 6 years Other debt debtor more 30/09/06 31/12/05
- Bond issues 118 1,006 1,247 3,721 5,974 4,008
- Bank borrowings 191 69 45 85 9 7 45 260 176
- Finance lease obligations 26 16 12 10 5 4 4 51 57
- Other debt 7 59 20 2 5 1 1 88 20
Total interest-bearing debt 342 144 1,083 97 1,266 12 3,771 6,373 4,261
Call option over 6.5% of Bouygues Telecom 451 451 460
Total incl. Bouygues Telecom call option 342 595 1,083 97 1,266 12 3,771 6,824 4,721
Comparative: 31 December 2005 694 549 35 1,036 526 782 1,793 4,721
7.2. COVENANTS AND TRIGGER EVENTS
The bank loans contracted by Bouygues and its subsidiaries do not include any covenants or trigger events.
The 10-year bond issue maturing May 2016 and the 7-year bond issue maturing 2013 include a change of control clause relating to Bouygues SA.
NON-CURRENT AND CURRENT DEBT 6,824 / 342
15

NOTE 8 MAIN COMPONENTS OF CHANGE IN NET DEBT (4,563)
8.1. CHANGE IN NET DEBT
Movement in31/12/05 the period 30/09/06
Cash and equivalents 3,215 (277) 2,938Overdrafts and short-term bank borrowings (178) (172) (350)
Net cash and equivalents 3,037 (449) 2,588
Non-current debt (4,721) (2,103) (6,824)Current debt (694) 352 (342)Financial instruments, net 26 (11) 15
Gross debt (5,389) (1,762) (7,151)
Net debt (2,352) (2,211) (4,563)
(1) Cash and equivalents as analysed in the cash flow statement for the period (net cash flows + non-monetary movements)
8.2. PRINCIPAL TRANSACTIONS IN THE PERIOD
Net debt at 31 December 2005 (2,352)
Dividends paid (437)Capital increases (Bouygues Confiance 3, etc.) 115Purchase of treasury shares (165)Sale of BTC 121Principal acquisitions and disposals of investments involving third parties (excl. BTC and Alstom) (143)Operating and other items 592
Net debt at 30 September 2006 before acquisition of Alstom shares (2,269)
Acquisition of Alstom shares, net (2,294)
Net debt at 30 September 2006 (4,563)
(1)
16

NOTE 9 ANALYSIS OF SALES AND OTHER REVENUESFROM OPERATIONS
125
9.1. ANALYSIS BY ACCOUNTING CLASSIFICATION
Sales of goods 1,802 1,617Sales of services 7,350 7,255Construction contracts 9,975 8,627
Sales 19,127 17,499
Other revenues from operations 125 107
Total 19,252 17,606
9.2. ANALYSIS BY BUSINESS SEGMENT
2006 9-month sales 2005 9-month salesBUSINESS SEGMENT France International Total % France International Total %
Construction 2,957 1,844 4,801 25 2,377 1,827 4,204 24Property 924 152 1,076 6 1,008 117 1,125 6Roads 4,513 3,310 7,823 41 3,994 2,897 6,891 40Media 1,669 206 1,875 10 1,588 180 1,768 10Telecoms 3,349 3,349 17 3,289 3,289 19Bouygues SA & other activities 3 200 203 1 19 203 222 1
Consolidated sales 13,415 5,712 19,127 100 12,275 5,224 17,499 100% year-on-year change 9% 9% 9%
9.3. ANALYSIS BY GEOGRAPHICAL SEGMENT
2006 9-month sales 2005 9-month salesTotal % Total %
France 13,415 70 12,275 70European Union 1,981 10 1,930 11Rest of Europe 718 4 553 3Africa 759 4 788 5Middle East 39 15United States and Canada 1,600 8 1,313 7Central and South America 112 1 88 1Asia-Pacific 503 3 537 3
Total 19,127 100 17,499 100
19,127
9 months ended
30/09/05
9 months ended
30/09/06
17

NOTE 10 1,470
30/09/06 30/09/05
Sales 19,127 17,499
Other revenues from operations 125 107
Purchases used in production and external charges (13,002) (11,490)
Taxes other than income tax (437) (390)
Personnel costs (3,881) (3,550)
Net depreciation, amortisation, provisions and impairment losses- Depreciation and amortisation (881) (854)- Provisions and impairment losses (139) (229)
Changes in production and property development inventories 203 26
Other income and expenses from operations 341 271- Reversals of unused provisions and impairment losses 136 122- Investment grants released to income in the period 1- Gains on disposals of non-current assets 86 41- Other income and expenses 118 108
Current operating profit 1,456 1,390
Other operating income and expenses 14 (58)
Operating profit 1,470 1,332
No impairment losses were taken in the period ended 30 September 2006 against assets with indefiniteuseful lives, as there was no evidence of impairment.
(1) Net reversal of provisions for fines for anti-competitive practices (Ile-de-France building market/Drapo)
(2) Charge to provisions for fines for anti-competitive practices by telecom operators (Bouygues Telecom)
(See Note 13 for a split by business segment)
Period ended:
OPERATING PROFIT
(1) (2)
18

NOTE 11 (144)
ANALYSIS OF COST OF NET DEBT
Period ended: 30/09/06 30/09/05
- Net debt (137) (141)
- Finance leases (4) (5)
- Financial instruments (3) 4
Total (144) (142)
COST OF NET DEBT
19
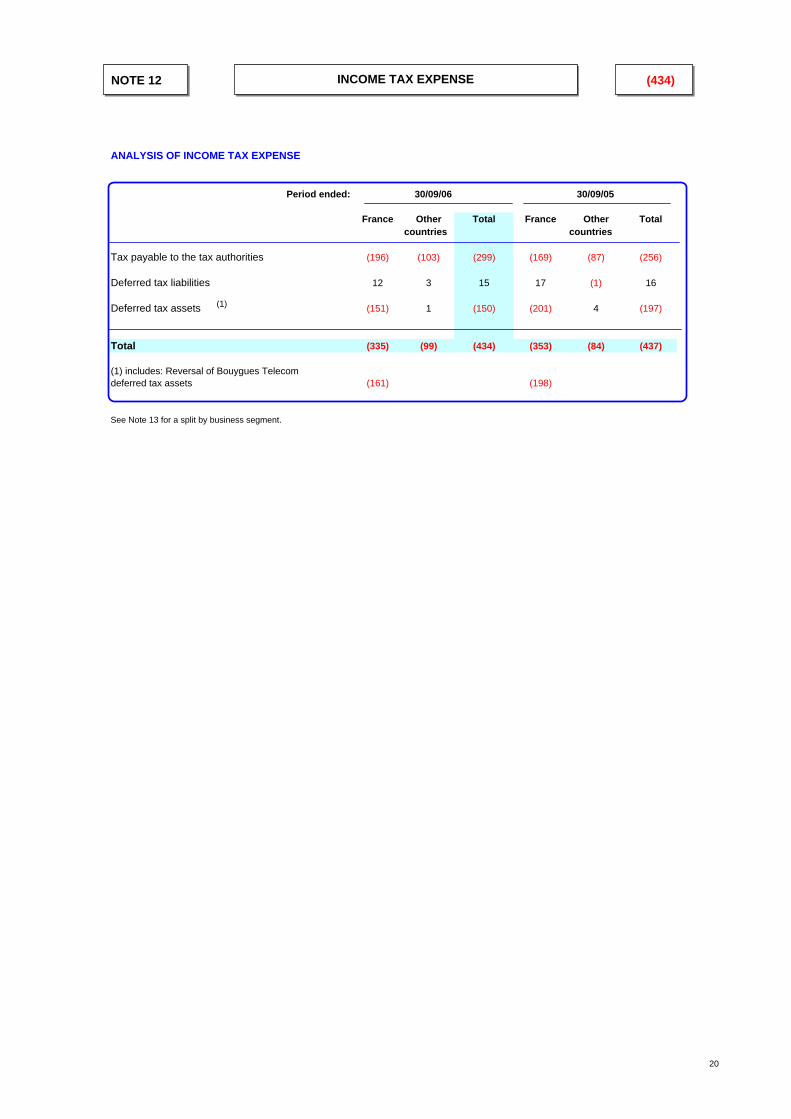
NOTE 12 (434)
ANALYSIS OF INCOME TAX EXPENSE
Period ended:
France Other Total France Other Totalcountries countries
Tax payable to the tax authorities (196) (103) (299) (169) (87) (256)
Deferred tax liabilities 12 3 15 17 (1) 16
Deferred tax assets (151) 1 (150) (201) 4 (197)
Total (335) (99) (434) (353) (84) (437)
(1) includes: Reversal of Bouygues Telecom deferred tax assets (161) (198)
See Note 13 for a split by business segment.
30/09/0530/09/06
(1)
INCOME TAX EXPENSE
20

NOTE 13
Segment information is presented by business segment: . Construction (Bouygues Construction) . Property (Bouygues Immobilier) . Roads (Colas) . Media (TF1) . Telecoms (Bouygues Telecom) . Bouygues SA and other activitiesInter-segment sales are usually conducted on an arm's-length basis.
13.1. ANALYSIS BY BUSINESS SEGMENT: NINE MONTHS ENDED 30 SEPTEMBER 2006
Construction Property Roads Media TelecomsBouygues SA
& other activities
TOTAL
Income statement for the nine months ended 30 September 2006
Total sales 4,959 1,076 7,856 1,886 3,359 440 19,576
Inter-segment sales (158) (33) (11) (10) (237) (449)
Third-party sales 4,801 1,076 7,823 1,875 3,349 203 19,127
Operating profit 222 110 386 195 497 60 1,470
Cost of net debt 34 (11) (9) (8) (150) (144)
Net profit attributable to the Group 178 69 282 74 388 (68) 923
Balance sheet as at 30 September 2006
Property, plant and equipment 393 10 1,720 157 2,132 388 4,800
Goodwill 213 829 1,056 2,645 4 4,747
Investments in associates 65 431 50 2,294 2,840
Cash and equivalents 291 43 239 346 18 2,001 2,938
Non-current debt 38 68 189 546 20 5,963 6,824
Non-current provisions 544 80 463 45 57 97 1,286
Current debt 3 50 32 124 8 125 342
Cash flow statement for the nine months ended 30 September 2006
Net acquisitions of property, plant and equipment and intangible assets 153 1 305 74 326 161 1,020
(after deducting investment grants)
Net acquisitions of investments in consolidated companies and other investments 151 (11) 45 19 (121) 2,234 2,317
Other indicators for the nine months ended 30 September 2006 09/2006
EBITDA 310 100 637 255 962 75 2,339
(1) See analysis in Note 3(2) Including Alstom: €2,294 million(3) Including acquisition of shares in Alstom: €2,294 million
(1)
(2)
SEGMENT INFORMATION
(3)
21

NOTE 14
TOTAL Construction Property Roads Media Telecoms Bouygues SA Maturity& other under 1 to 5 over 5 Total
activities 1 year years years
Total commitments given 30/09/06 3,211 167 685 262 707 1,341 49 1,266 1,404 541 3,211
Comparative: 31/12/05 2,754 154 614 172 556 1,190 68 917 1,359 478 2,754
Total commitments received 30/09/06 2,318 20 669 164 449 984 32 846 1,073 399 2,318
Comparative: 31/12/05 2,132 20 579 93 515 901 24 675 1110 347 2,132
(1) comprising: Commitments given Commitments received30/09/06 31/12/05 30/09/06 31/12/05
Image transmission 273 387 273 387 Operating leases 1,218 1,040 1,218 1,040 Irrevocable purchase obligations 726 645 751 605 Collateral 17 34 Other 977 648 76 100
Total 3,211 2,754 2,318 2,132
OFF BALANCE SHEET COMMITMENTS
(1)
22

NOTE 15 CHANGES IN SCOPE OF CONSOLIDATION:DISCONTINUED AND HELD-FOR-SALE OPERATIONS
Impact on the balance sheet and income statement
1. Assets and liabilities of discontinued and held-for-sale operations TPS:Note: Bouygues Telecom Caraïbe (BTC) was deconsolidated following its sale in April 2006.
30/09/06 31/12/05TPS TPS
Non-current assetsProperty, plant and equipment and intangible assets 65 53Goodwill 420 420Other non-current assets 4 4
Current assetsCash and equivalents 3 (57)Other current assets 152 144
Total assets of discontinued and held-for-sale operations 644 564
Non-current liabilitiesNon-current debt 7 10Other non-current liabilities 2 1
Current liabilitiesCurrent debt 98 38Other current liabilities 280 301
Total liabilities of discontinued and held-for-sale operations 387 350
Net assets of discontinued and held-for-sale operations 257 214
2. Income and expenses generated by discontinued and held-for-sale operations during the period, excluded from income statement items, comprised:
Period ended: 30/09/06 30/09/05 (Proforma)TPS BTC Total TPS BTC Total
SALES (235) (32) (267) (274) (67) (341)
OPERATING PROFIT (45) (116) (161) (22) (3) (25)
COST OF NET DEBT 1 1 3 1 4
Other financial income and expenses 1 1 (2) (2)
Income tax expense 1 6 7 6 6
NET PROFIT OF DISCONTINUED AND HELD-FOR-SALE OPERATIONS (2) 42 110 152 15 2 17
(1) BTC: Net gain on disposal(2) Reported on a separate line in the income statement
152
(1)
23

NOTE 16 PRINCIPAL EXCHANGE RATES
Convention: 1 local currency unit = x euros
Closing rate Average ratefor the period
Country Currency 30/09/06 31/12/05 30/09/06 31/12/05
EUROPE
Denmark Danish krone 0.134091 0.134039 0.134040 0.134183 United Kingdom Pound sterling 1.475579 1.459215 1.459002 1.464040 Hungary Hungarian forint 0.003663 0.003955 0.003748 0.004023 Poland Polish zloty 0.251807 0.259067 0.255107 0.248636 Czech Republic Czech koruna 0.035303 0.034483 0.035223 0.033563 Romania Romanian leu 0.282789 0.271724 0.282913 0.275932 Switzerland Swiss franc 0.629683 0.643045 0.636767 0.646064
NORTH AMERICA
United States US dollar 0.789889 0.847673 0.800050 0.807765 Canada Canadian dollar 0.707414 0.728597 0.711271 0.666800
REST OF THE WORLD
Morocco Moroccan dirham 0.090440 0.091672 0.090652 0.090819 Thailand Thai baht 0.021021 0.020645 0.020950 0.020027 Hong Kong Hong Kong dollar 0.101379 0.109321 0.103019 0.103872 African Financial Community CFA franc 0.001524 0.001524 0.001524 0.001524 South Africa South African rand 0.101753 0.133973 0.119287 0.126888
24