Embed Size (px)
Citation preview
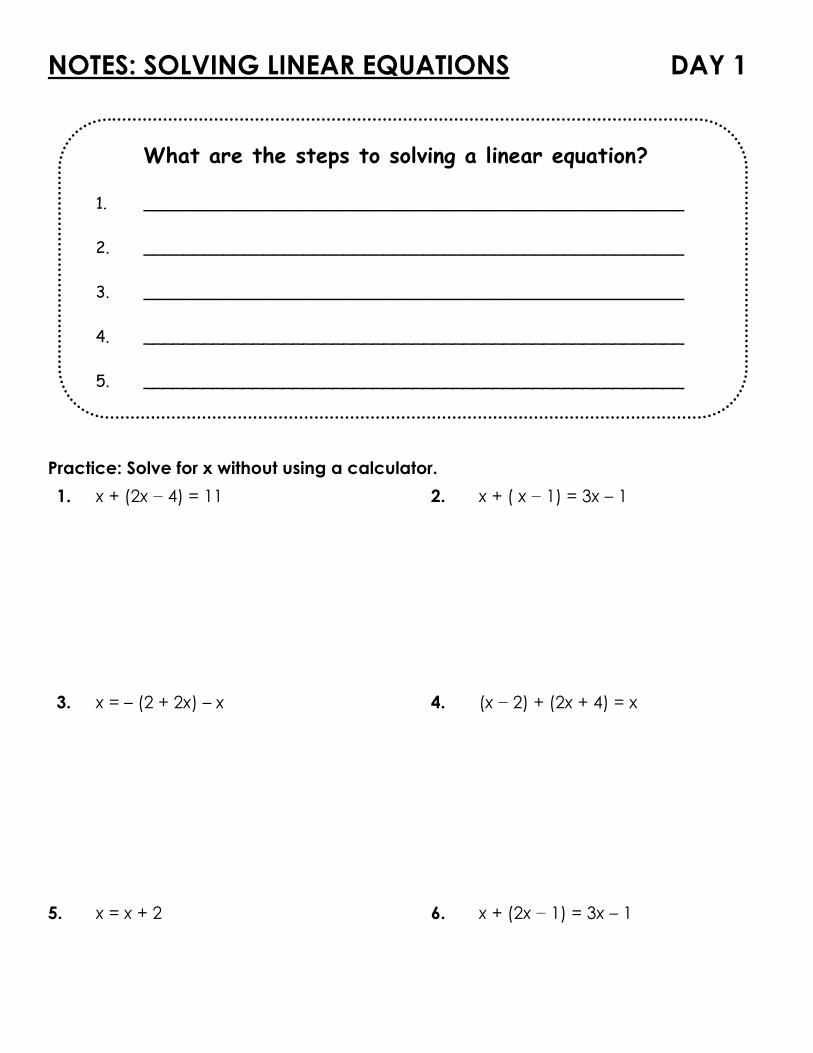
NOTES: SOLVING LINEAR EQUATIONS DAY 1 What are the steps to solving a linear equation?
1. ______________________________________________________ 2. ______________________________________________________ 3. ______________________________________________________ 4. ______________________________________________________
5. ______________________________________________________
Practice: Solve for x without using a calculator.
1. x + (2x − 4) = 11 2. x + ( x − 1) = 3x – 1
3. x = – (2 + 2x) – x 4. (x − 2) + (2x + 4) = x
5. x = x + 2 6. x + (2x − 1) = 3x – 1

TYPES OF SOLUTIONS No Solution: __________________________________________________________ All real numbers: _____________________________________________________ One Solution: For each equation, classify the equation as No Solution, All Real Number Solutions, or One Solution.
7. x + 2 = x + 3 8. 2x = 3x
9. 2x + 8 = 6 – x 10. 2x − 4 + 3x = 8x – 5
11. 2x + 5 = 5 + 2x 12. (x + 3) − (x − 3) = 3

NOTES: FUNCTION DEFINITION DAY 2 I. Vocabulary Domain: The set ( ) of all inputs (x-values) of a function. Range: The set ( ) of all outputs (y-values) of a function. Relation: Every two sets has some kind of relationship. That relationship is called a relation.
Function – A function is a type of relation that has the following property: Every element of the domain is paired up with exactly one element of the range. (for every input there is one and only one output!)
How do we find the domain and range of a function?
1. Analytically – find reasonable values for the independent variable and will produce reasonable values for the dependent variable.
2. Look at a graph. Domain: smoosh the graph onto the x-axis to find all the x-values Range: smoosh the graph onto the y-axis to find all the y-values
3. Use a table of ordered pairs. 1. Domain: __________________ Range:____________________
2. Domain: __________________ Range:____________________
3. Domain: __________________ Range:____________________

NOTES: RULE OF FOUR DAY 2 Below are four ways to represent relations. Determine if the relation is a function or not and explain. 1. Mapping Diagram Is f a function or not? ________________ Why?
2. Table
Is g a function or not? ________________ Why?
2. Ordered Pairs Diagram h : {(-3, 5), (0, 8), (2, -3), (6,-4), (8, 5)} Is h a function or not? ________________ Why? i: {(-7, 6), (-4, 2), (-4, -5), (1,3), (2, 6)} Is i a function or not? ________________ Why?
4. Graph
Is l a function or not? Why?
Repeating Vertical Line Test
Input (x) Output (y) -4 -1 -2 3 0 -5 1 -1 5 0 7 0

NOTES: EQUATION OF A LINE DAY 4
Vocabulary:
y=mx+b
Slope (m):______________________________________________________________ y-intercept (b):_________________________________________________________
Practice: Identify the slope and y-intercept of each equation.
1) slope: _____________ y-intercept ( ___,___)
2) slope: _____________ y-intercept ( ___,___)
3) slope: _____________ y-intercept ( ___,___)
4) slope: _____________ y-intercept ( ___,___)
5) slope: _____________ y-intercept ( ___,___)
Practice: Identify whether the graph of the equation will be linear growth or linear decay. 1) linear growth/linear decay
2) linear growth/linear decay
3) linear growth/linear decay
4) linear growth/linear decay
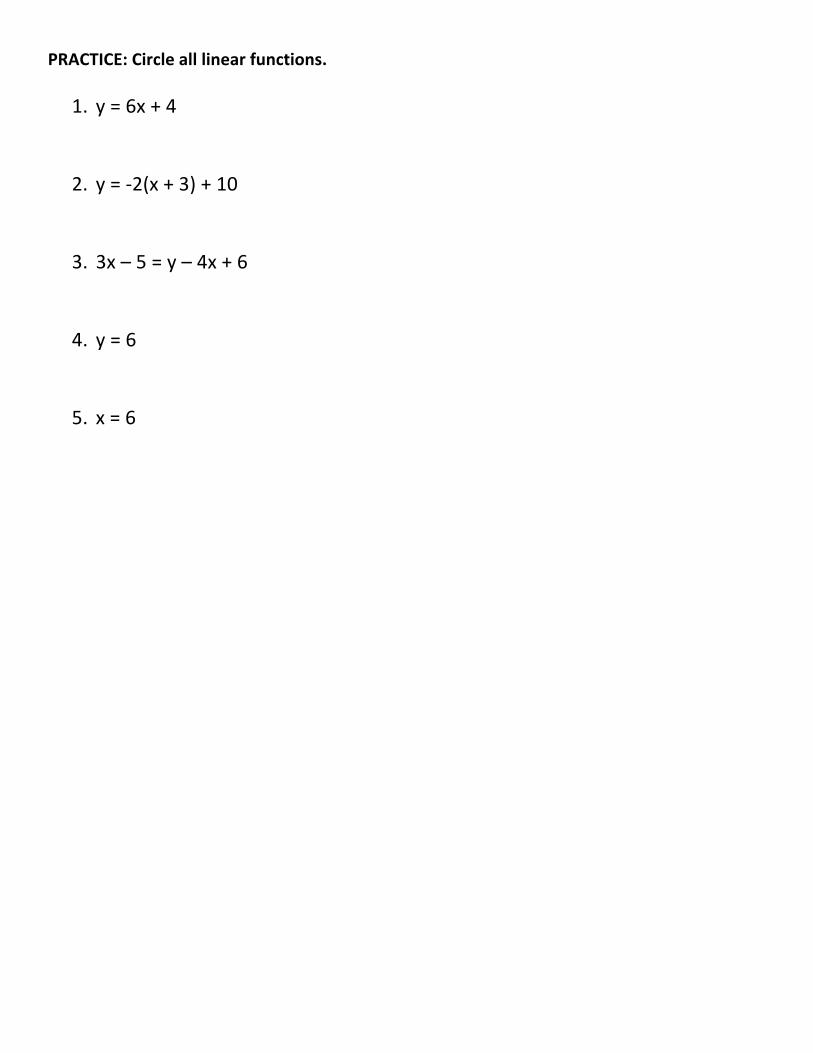
PRACTICE:Circlealllinearfunctions.
1. y=6x+4
2. y=‐2(x+3)+10
3. 3x–5=y–4x+6
4. y=6
5. x=6

NOTES: GRAPHING LINEAR FUNCTIONS DAY 4 Guitar Lessons. Mrs. Ausel is interested in finding guitar lessons. A local music studio has told him that for 6 hours of instruction the cost will be $159. For 10 hours of instruction the cost will be $255. Let x represent the number of instructional hours and y represent the cumulative cost ($). Write an equation of a line to represent how much he will pay, y, for the number of hours of guitar lessons, x. Hint: write the given information as two ordered pairs.
Y=mx+b

Look at each graph. Find the slope of the line (m) by counting rise and run. Find the y intercept (b). Use this information to write the equation of the line. 1. 2. 3.
Slope = Y intercept =
EQUATION:
Slope = Y intercept =
EQUATION:
Slope = Y intercept =
EQUATION:

NOTES: WRITING EQUATIONS OF LINES DAY 5 Therearefourwayswecouldaskyoutocreatealinearequation…
TYPE I: Write the equation of the line that passes through the given y-intercept and given slope. 1. m = 3 b = -3 2. m =
b = 15
TYPE II: Write the equation of the line that passes through the given point and given slope. 1. Passes through (2, 3) and slope is 5. 2. Passes through (6, -5) and slope is
Type III: Write the equation of a line given two points. 4. Passes through (4, -3) and (3, -6) 5. Passes through (4, 2) and (7,-4)

NOTES: PARALLEL AND PERPENDICULAR LINES DAY 8
Steps/Information Practice/Examples
#1. DetermineifTwoLinesare ParallelStep1:Twolinesareparalleliftheyhavethe sameslope.Step2:Findtheslopesofthetwolinesand compare.
#17.Determineifeachpairoflinesisparallelornot.a.y=5x+1 b.y=‐2x–3y=5x–3 y=2x+1
#2.FindtheSlopeofaParallelLineIfyouknowtheequationofoneline,youcaneasilyfindtheslopeofalineparallel.Step1:Usetheequationtofindtheslope(m)of theline.Step2:Aparallellinemusthavethesameslope.
#18a.Findtheslopeofalineparalleltoy=10x.#18b.Findtheslopeofalineparalleltoy=x.
#3. DetermineifTwoLinesare PerpendicularTwolinesareperpendiculariftheirslopesarenegative(opposite)reciprocals.Step1:Ifonelinehasaslopeofm,theperpendicularline’sslopemustbetheopposite(negative)andflippedupsidedown(reciprocal).
Examples: and
3and
#19.Determineifthelinesareperpendicularornot.
a.y=‐4x+2 b.
y=‐3x
#4. DeterminetheSlopeofa PerpendicularLine.Step1:Usetheequationtofindtheslope(m)of theline.Writeitasafraction.Step2:Calculatethenegative(opposite) reciprocalofthatslope.Thatistheslope ofalineperpendicular.
#20a.Findtheslopeofalineperpendiculartoy=
#20b.Findtheslopeofalineperpendiculartoy=7x
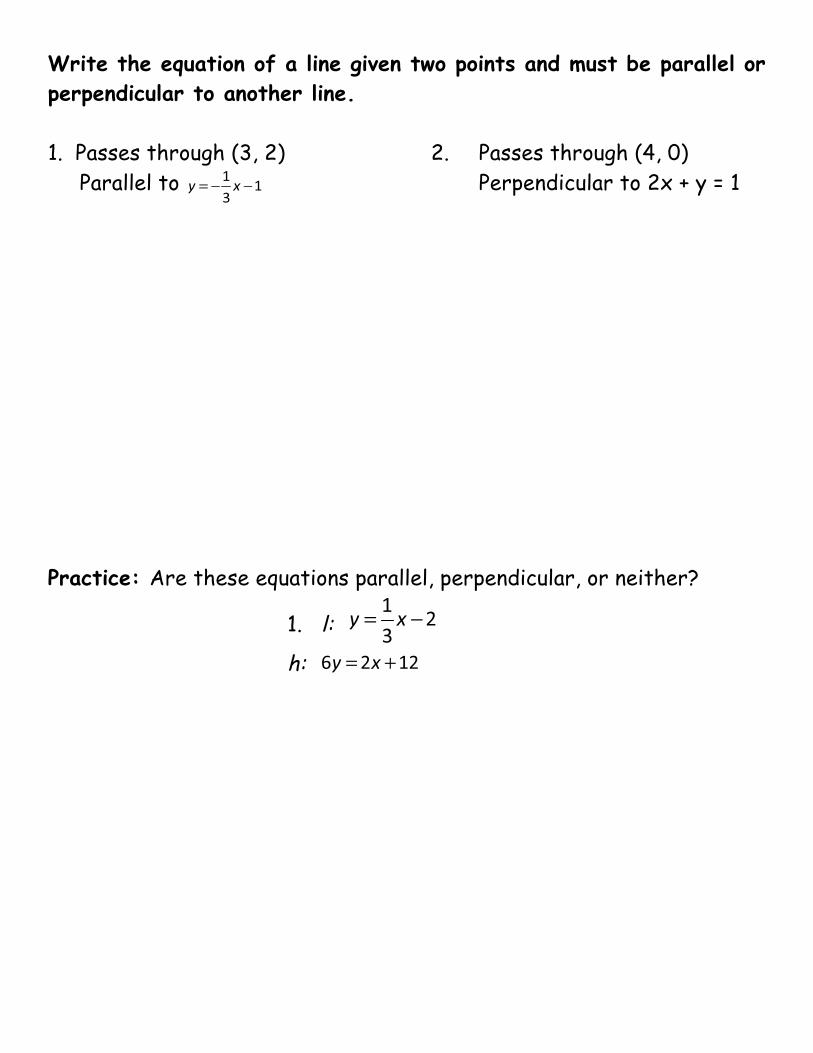
Write the equation of a line given two points and must be parallel or perpendicular to another line.
1. Passes through (3, 2) 2. Passes through (4, 0) Parallel to Perpendicular to 2x + y = 1
Practice: Are these equations parallel, perpendicular, or neither?
1. l:
h:

NOTES: SYSTEMS OF EQUATIONS (GRAPHING) DAY 9
Happy Birthday! For your birthday you are buying yourself a new cell phone. You have identified two plans that work for you. The first plan is through AT&T and the second plan is through Verizon Wireless. AT&T charges $40 for 1000 minutes and 200 text messages. You will be charged $0.25 per extra text. Verizon charges $64 for 1000 minutes and 200 text messages, with an additional fee of $0.10 per extra text. You will likely use more than 200 text messages you are concerned about the extra fees. Determine how many extra texts you would need to use a month in order for Verizon to be worth it. We can represent this information mathematically by a system of equations.
1. Choose a variable to represent your monthly cost: 2. Choose a variable to represent your # of texts per month: 3. Write an equation for your monthly cost of the Verizon plan: Write an equation for your monthly cost of the AT&T plan:

Using your calculator, graph these lines. Then draw both on the following graph:
You will need to change the windows on your calculator to see the graphs. Why?
1. What does your x-axis represent?
2. What does your y-axis represent?
3. Use the TRACE function to investigate the intersection of the 2 graphs.
4. Use 2nd->TRACE->5:intersect to find the exact (x,y) value . To do this move your cursor to the left of the intersection on the “First curve” prompt. Move your cursor to the right of the intersection on the “Second curve” prompt. Then hit ENTER at the “Guess” prompt. Note your (x,y) value.
5. What does this ordered pair represent?
An ordered pair that makes one linear equation TRUE is called a ________________ To solve a system of linear equations, you have to find an ordered pair that ________________________________________________.
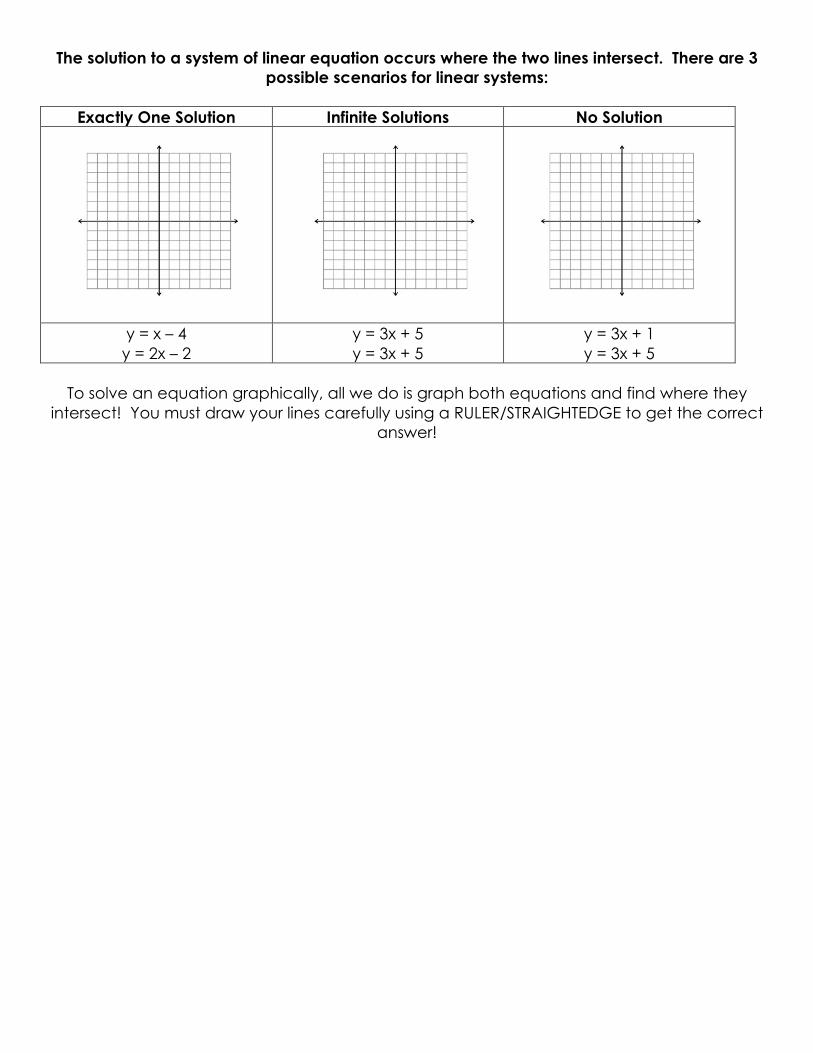
The solution to a system of linear equation occurs where the two lines intersect. There are 3 possible scenarios for linear systems:
Exactly One Solution Infinite Solutions No Solution
y = x – 4 y = 2x – 2
y = 3x + 5 y = 3x + 5
y = 3x + 1 y = 3x + 5
To solve an equation graphically, all we do is graph both equations and find where they
intersect! You must draw your lines carefully using a RULER/STRAIGHTEDGE to get the correct answer!

NOTES: SYSTEMS OF EQ. (ALGEBRAICALLY) DAY 10
Another way to solve systems of linear equations is by SUBSTITUTION. Substitution is easiest to use when one of the equations is already solved for either x or y
(says x = or y = ) EXAMPLE ONE Solve by substitution
2x + 5y = – 5 y = –x – 5 x = – 3y + 3 5x – 9y = 3
Steps to Solving by Substitution: Step One Solve one equation for either x or y Step Two Substitute the expression from step one into the 2nd equation Step Three Solve the second equation for the given variable Step Four Plug you solution back into the first equation Step Five Write your solution as a point.
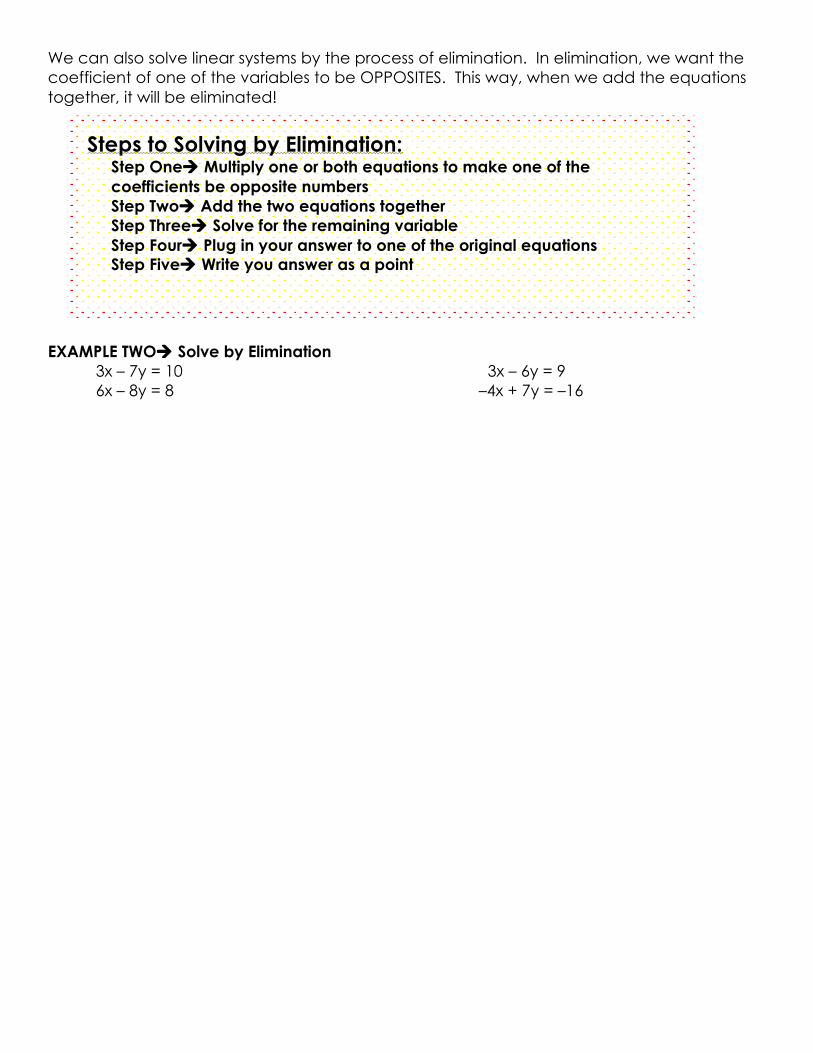
We can also solve linear systems by the process of elimination. In elimination, we want the coefficient of one of the variables to be OPPOSITES. This way, when we add the equations together, it will be eliminated! EXAMPLE TWO Solve by Elimination 3x – 7y = 10 3x – 6y = 9 6x – 8y = 8 –4x + 7y = –16
Steps to Solving by Elimination: Step One Multiply one or both equations to make one of the coefficients be opposite numbers Step Two Add the two equations together Step Three Solve for the remaining variable Step Four Plug in your answer to one of the original equations Step Five Write you answer as a point
You Try Solve the system by substitution OR elimination 8x + 9y = 15 5x – 2y = 9 EXAMPLE THREE Special Solutions 6x + 15y = –12 12x – 3y = –9 –2x – 5y = 9 –4x + y = 3
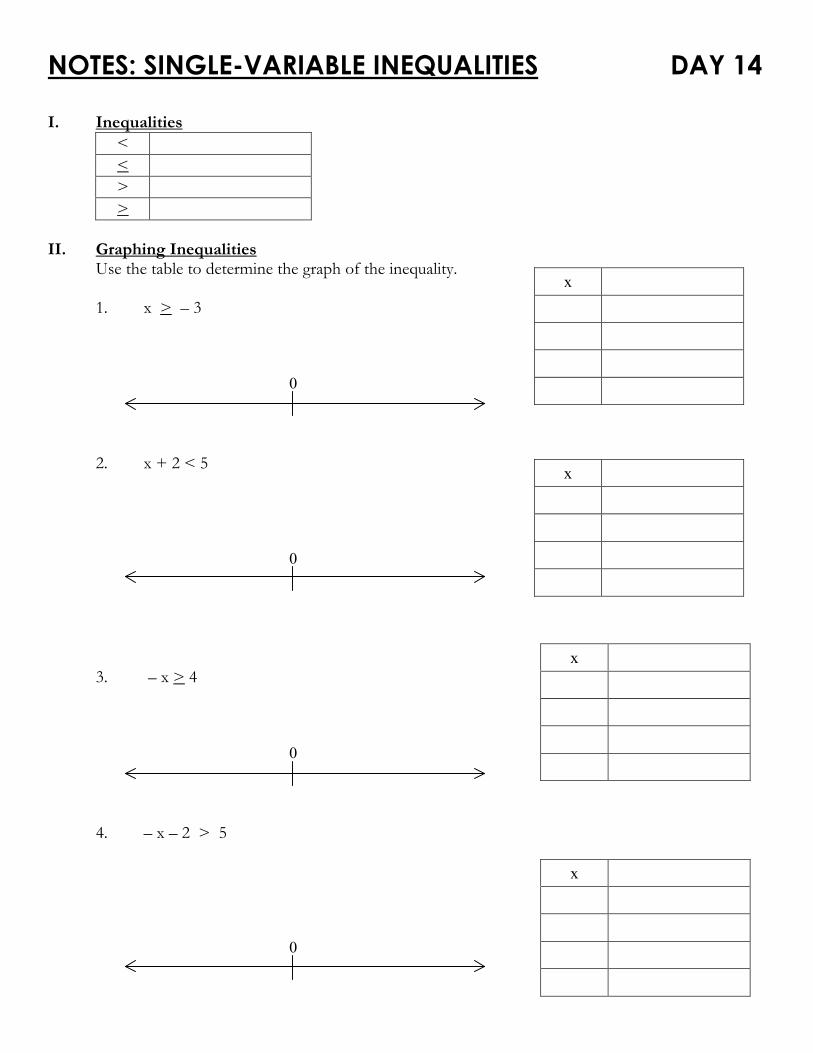
NOTES: SINGLE-VARIABLE INEQUALITIES DAY 14
I. Inequalities
< < > >
II. Graphing Inequalities Use the table to determine the graph of the inequality. 1. x > – 3 2. x + 2 < 5 3. – x > 4 4. – x – 2 > 5
x
0
x
0
0
x
0
x

III. Method As with ANY equation, you solve an inequality in the variable x by finding all values of x for which the equality is true! How do you do this? 1. 2. 3. 4.
Practice. 1. x + 3 < 7 2. 3x – 4 < – 16 3. – 3 (x + 2) < 15 4. – 4 < x 5. 2 < x – 3
0
0
0
0
0

Compound Inequality ( ): 1. a. Create a situation with a range of possibilities (for example: my commute takes between 7 to 12 minutes, depending on traffic). Then graph your inequality. b. Write the situation as an inequality: ________________________________________ Disjoint Inequality ( ): 2. a. Graph all the values that you did not graph on the number line above.
b. Write your graph as one or more inequalities: ____________________________________ c. What does x represent? d. What would happen if you overlapped both of your number lines? SUMMARY: How are compound and disjoint inequalities similar and different?

NOTES: LINEAR INEQUALITIES DAY 15
I. Linear Inequalities in Two-Variables: _____________________________________________ _____________________________________________________________________________ a. b. c. d. II. An ____________________ is a solution to the inequality if _____________________________ _____________________________________________________________________________ Example (solution): III. The _________________ of a linear inequality in two-variables is _________________________ _____________________________________________________________________________ Example Graph:
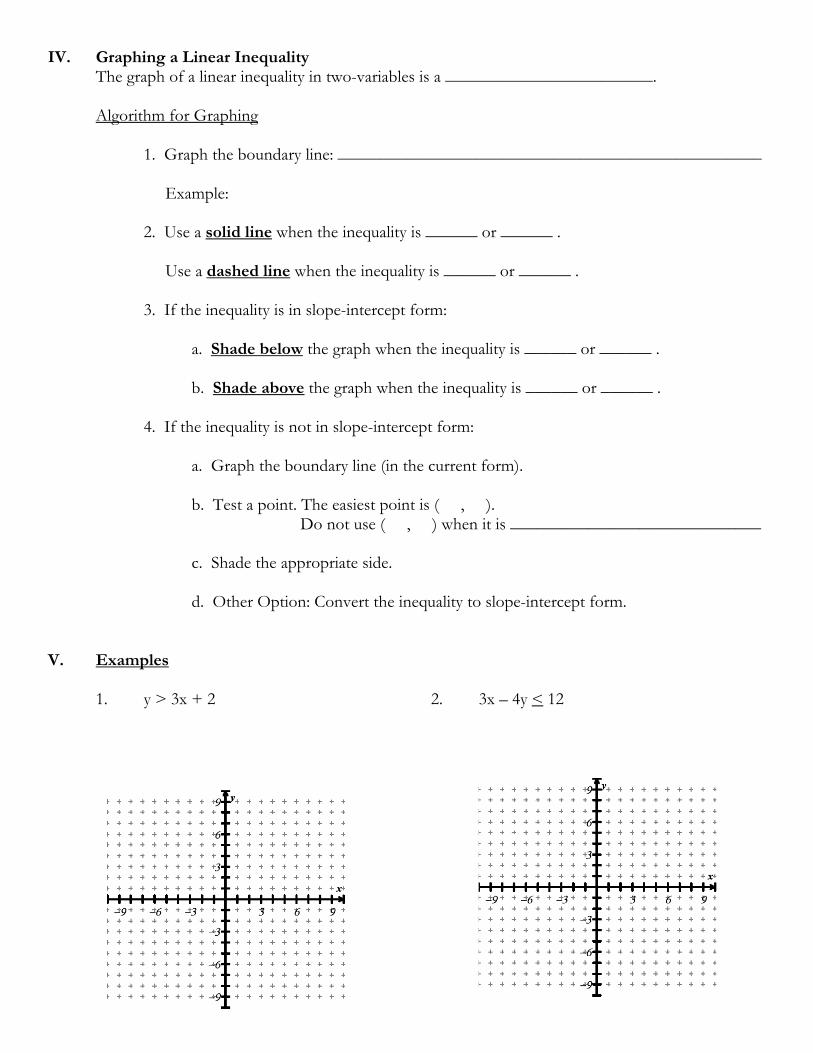
IV. Graphing a Linear Inequality The graph of a linear inequality in two-variables is a ________________________. Algorithm for Graphing 1. Graph the boundary line: _________________________________________________ Example: 2. Use a solid line when the inequality is ______ or ______ . Use a dashed line when the inequality is ______ or ______ . 3. If the inequality is in slope-intercept form: a. Shade below the graph when the inequality is ______ or ______ . b. Shade above the graph when the inequality is ______ or ______ . 4. If the inequality is not in slope-intercept form: a. Graph the boundary line (in the current form). b. Test a point. The easiest point is ( , ). Do not use ( , ) when it is _____________________________ c. Shade the appropriate side. d. Other Option: Convert the inequality to slope-intercept form. V. Examples 1. y > 3x + 2 2. 3x – 4y < 12

DAY 1: FUNCTION DEFINITION DEFINITION
Relation: A pairing of input and output values.. Function: A relation in which there is exactly one output for each input. (x cannot repeat) Domain: the set of input values (x-coordinates) Range: the set of output values (y-coordinates)
VERTICAL LINE TEST
MAPPING DIAGRAM
LINEAR EQUATION
y = mx + b
TABLE
x y 2 3 4 5 6 6 8 7
GRAPH Continuous: no breaks Point Discontinuity: Discontinuous at a single point. Jump Discontinuity: The function approaches two different values from either side of the discontinuity
-1 2 5
4 8

DAY 3: DOMAIN AND RANGE (GRAPHICALLY) Graphically
Domain: Left to Right
Range: Lowest to Highest Inequality Notation: lowest < x < highest
Interval Notation: (lowest, highest) Domain: ___________ Range: ____________
DAY 3: DOMAIN AND RANGE (ANALYTICALLY) DOMAIN WHEN X IS IN THE DENOMINATOR
If in the form:
1x
The denominator cannot equal 0. Set up an equation with the denominator equal to zero and solve. Domain: ℜ, x ≠ 0
f (x )= 3
4x −1
DOMAIN OF A RADICAL FUNCTION If in the form: y = x The radicand is always positive. Set the radicand > 0 and solve. Domain: x > 0
y = 3x +5
WHEN A RADICAL IS IN THE DENOMINATOR
If in the form:
1x
The denominator cannot equal 0. Set up an equation with the denominator equal to zero and solve. Domain: ℜ, x ≠ 0
y = 4
2x −1
LINEAREQUATIONS:PlottingPointsandSlopeSteps/Information Practice/Examples
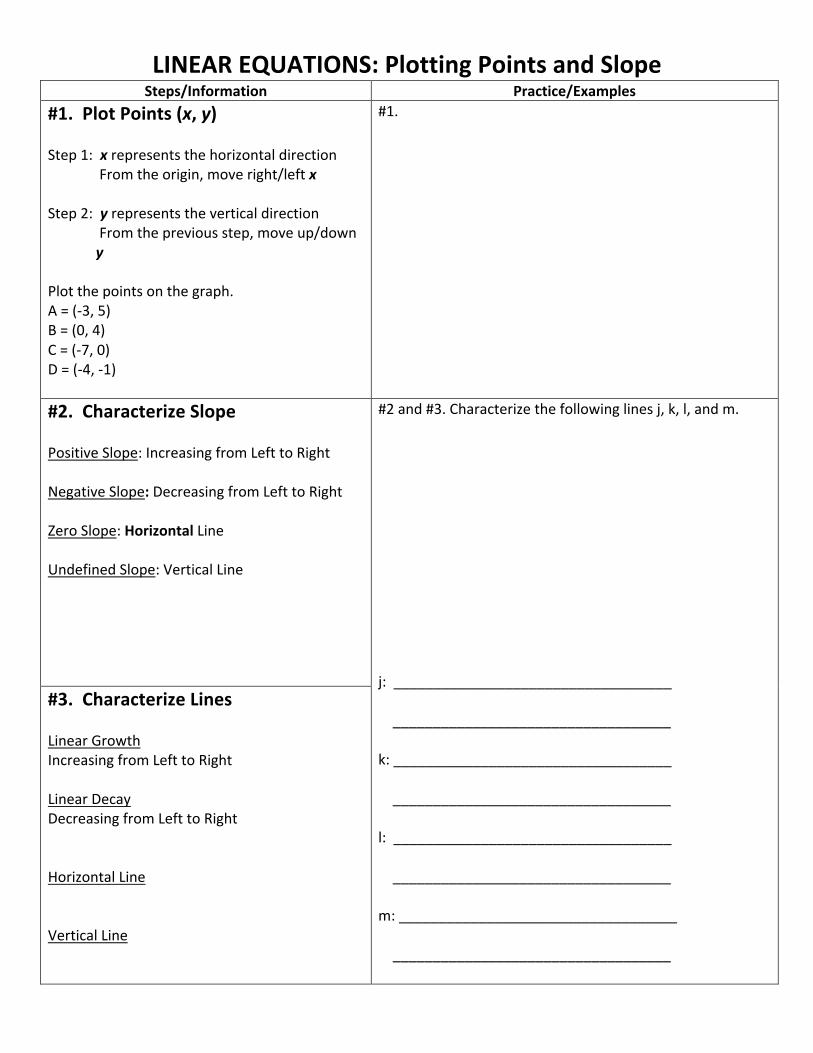
#1.PlotPoints(x,y)Step1:xrepresentsthehorizontaldirection Fromtheorigin,moveright/leftxStep2:yrepresentstheverticaldirection Fromthepreviousstep,moveup/down yPlotthepointsonthegraph.A=(‐3,5)B=(0,4)C=(‐7,0)D=(‐4,‐1)
#1.
#2.CharacterizeSlopePositiveSlope:IncreasingfromLefttoRightNegativeSlope:DecreasingfromLefttoRightZeroSlope:HorizontalLineUndefinedSlope:VerticalLine
#3.CharacterizeLinesLinearGrowthIncreasingfromLefttoRightLinearDecayDecreasingfromLefttoRightHorizontalLineVerticalLine
#2and#3.Characterizethefollowinglinesj,k,l,andm.j:______________________________________________________________________k:______________________________________________________________________l:______________________________________________________________________m:______________________________________________________________________

LINEAREQUATIONS:FindingSlopeSteps/Information Practice/Examples
#4.CalculateSlopeStep1:Labeleachpoint(x1,y1)and(x2,y2). Itdoesn’tmatterwhichpointiswhich.Step2:Plugeachcoordinatepointintothe formula.
Step3:Reducethefraction.Step4:Negativesshouldgoinfrontofthe fraction.
#4a.(8,‐9)and(5,6)#4b.(‐8,6)and(0,‐4)
#5. CalculateSlope 0inNumerator/DenominatorStep1:Calculatethesloperegularlyusingthe formula.Step2:Ifyouendupwithzerointhenumerator, theslopeiszero. (0dividedbyanythingis0)Step3:Ifyouendupwithzerointhe denominator,theslopeisundefined. (youcannotdivideby0)
#5a.(‐4,5)and(‐4,‐1) #5b.(‐6,2)and(1,2)
#6.FindtheSlopeofaLine(GRAPH)Step1:Findtwo“nice”(integer)points.Step2:Beginatoneofthepoints(chooseone)Step3:Firstcountupordowntogettothe otherpoint(Up=Positive,Down= Negative)Step4:Nextcountrightorlefttogettothe otherpoint. (Right=Positive,Left=Negative)
Step6:Writetheslopeas .
#6.Findtheslopeoftheline.

LINEAREQUATIONS:Slope‐InterceptForm
y=mx+b
Steps/Information Practice/Examples
#7.Slopeandy‐InterceptSlope:Themeasureofsteepness(m).Y‐intercept:Wherethelinecrossesthey‐axis.Alwaysintheform(0,b),since(0,anynumber)willbeonthey‐axis.#9.PutanEquationintheformy=mx+b.Step1:Ifthereisnom,itis1or‐1.Step2:Ifthereisnob,itis0.
#8.Determinetheslopeandthey‐intercept.
a.y=‐3x+5 b.
#9.Writetheequationiny=mx+b.a.y=‐x b.y=5x
#8.GraphingUsingy=mx+bStep1:Plotthey‐interceptfirst(onthey‐axis).Step2:Makesurethattheslopeisinfraction form.Ifitisn’tputitover1.Step3:Iftheslopehasanegativeinfront,putit onthenumerator,orthedenominator, butnotboth.Step4:Usetheslope(riseoverrun)tofinda fewotherpointsontheline. Thenumeratorrepresentsvertical change(up+/down‐). Thedenominatorrepresentshorizontal change(right+/left‐).
#10.Graph
a.y=–4x+1 b.

LINEAREQUATIONS:WritetheEquationsofLines
#9.WritetheEquationGivenTwo PointsStep1:Plotbothpoints.Step2:Counttheslope(m)betweenthetwo pointsusingthegraph.Step3:Usetheslopetofindotherexactpoints onthegraph.Locatethey‐intercept(b).Step4:Witharuler,drawthelinebetweenthe points.Step5:Plugtheslope(m)andthey‐intercept(b) intotheequationy=mx+b.
#11.(4,4)and(‐6,0)
#10.WritetheEquationGiventhe GraphStep1:Findthey‐intercept(b).Step2:Findtwo“nice”(integer)points.Step3:Counttheslopebetweenthepoints(rise overrun).Step4:Writetheslope(m)asafractionand reduce.Writenegativesinfrontofthe fraction.Step5:Plugtheslope(m)andthey‐intercept(b) intotheequationy=mx+b.
#12.
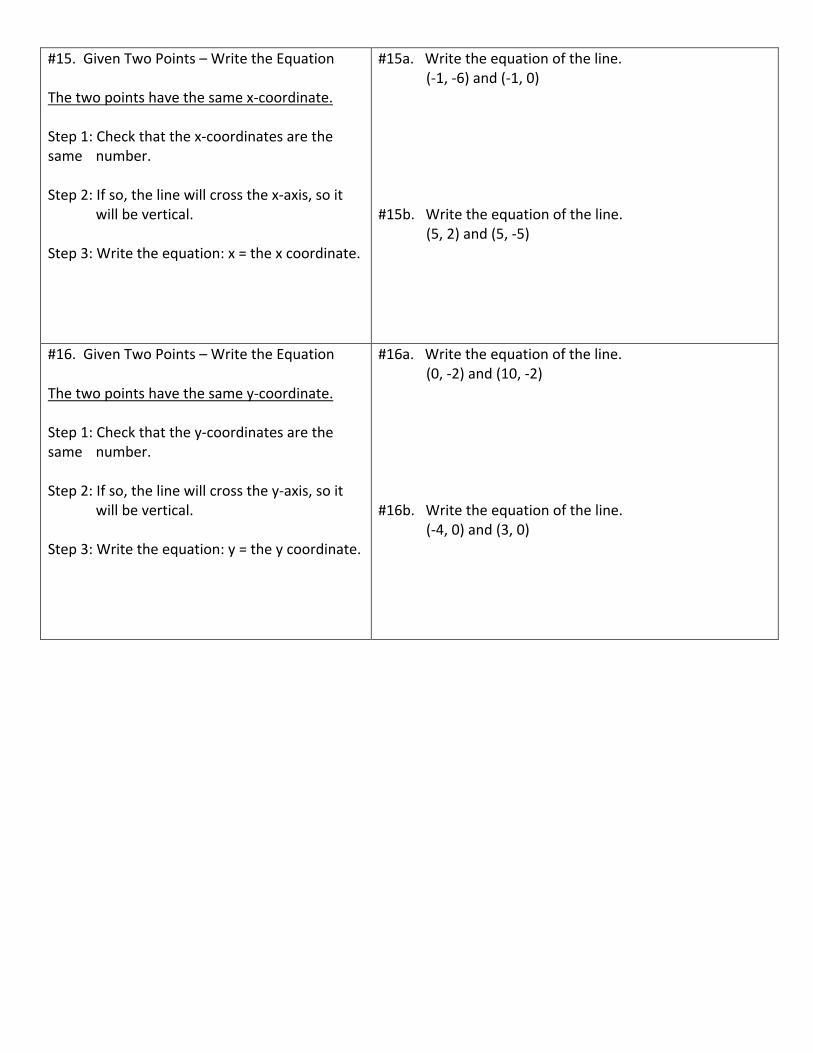
#15.GivenTwoPoints–WritetheEquationThetwopointshavethesamex‐coordinate.Step1:Checkthatthex‐coordinatesarethesame number.Step2:Ifso,thelinewillcrossthex‐axis,soit willbevertical.Step3:Writetheequation:x=thexcoordinate.
#15a.Writetheequationoftheline. (‐1,‐6)and(‐1,0)#15b.Writetheequationoftheline. (5,2)and(5,‐5)
#16.GivenTwoPoints–WritetheEquationThetwopointshavethesamey‐coordinate.Step1:Checkthatthey‐coordinatesarethesame number.Step2:Ifso,thelinewillcrossthey‐axis,soit willbevertical.Step3:Writetheequation:y=theycoordinate.
#16a.Writetheequationoftheline. (0,‐2)and(10,‐2)#16b.Writetheequationoftheline. (‐4,0)and(3,0)

LINEAREQUATIONS:Vertical and Horizontal Lines
Steps/Information Practice/Examples#13.GraphingHorizontalLines:y=numberGotothenumberonthey‐axisanddrawahorizontalline.VerticalLines:x=numberGotothenumberonthex‐axisanddrawaverticalline.
#13.Graphy=‐3andx=5.
#14.WritingtheEquationStep1:Isthelineverticalorhorizontal?Step2:Ifthelinecrossesthex‐axis(vertical),itwillhaveanequationx=Step3:Findthepointwherethelinecrossesthex‐axis.Writetheequationasx=thatpoint.Step4:Ifthelinecrossesthey‐axis(horizontal)itwillhavetheequationy=Step5:Findthepointwherethelinecrossesthey‐axis.Writetheequationasy=thatpoint.
#14.Writetheequationsofthelines.

DAY 1: SOLVING SYSTEMS (GRAPHICALLY) System of Equations: A system of equations is a group of 2 or more equations Solution to a System: The solution(s) are the intersection points of the graphs!
SOLVE A SYSTEM GRAPHICALLY
1. Rewrite all functions so that y is isolated.
–3x + y = –2 y = − 1
3x + 2 + 2
2. Graph all functions. 3. Find the intersection points!
DAY 2: SOLVING SYSTEMS (ALGEBRAICALLY) SOLVE A SYSTEM WITH SUBSTITUTION
1. Rewrite all functions so that y is isolated. 2. Set both equations equal to each other. 3. Solve!
y = x2 – 2x – 1 y = –x2 + 4x – 1

DAY 2: SOLVE LINEAR INEQUALITIES SOLVE INEQUALITIES
1. Solve the inequality like an equation. 2. If you multiply or divide by a negative, flip the inequality!
3x – 5 > 10
SOLVE COMPOUND INEQUALITIES 1. Isolate the variable by doing the same operation to all sides. 2. If you multiply or divide by a negative, flip the inequality!
1 < –2x +3 < 4
0
0