Embed Size (px)
Citation preview
NOTE TO POTENTIAL INVESTORS
As of October 2013
Valentin ROUSSEL for Professor MOSCATO
1
Table of contents
Abstract ................................................................................................................................................... 2
Company overview .................................................................................................................................. 2
Industry overview .................................................................................................................................... 7
Valuation using the Dividend Discount Model ...................................................................................... 13
Valuation using the Relative Valuation ................................................................................................. 18
Recommendations ................................................................................................................................ 20
References ............................................................................................................................................. 21
2
Abstract
This paper gives a valuation of Volkswagen AG using the dividend discount model and the relative valuation. The goal is to provide to investors a precise and truthful valuation of the company. We will mainly use quantitative data to assess if Volkswagen is a good stock to buy.
Company overview
Brief history
Volkswagen is a German car manufacturer born in the beginning of last century. The first chassis was introduced in 1925 as a platform for a “people’s car”. The idea was inspired an American pioneer, Ford.
Under the British Military Government after WWII, the company continued its activity providing Europe with engines and cars. VW starts its internationalization after 1950 thanks to its mass production. The Beetle will be a key success car brining recognition to the company.
An M&A strategy allows the group to take advantages of opportunities offered in emerging and mature markets in the mid-1980s. A global production network is built.
The Volkswagen group is still operating thought the same strategy: acquiring brands and lowering production costs to increase its market share. It is now the biggest carmaker in Europe.1
Constitution
Company’s culture
Volkswagen AG is the parent company of the Volkswagen Group. Volkswagen AG holds interests in companies as Volkswagen Financial Services, AUDI AG, Porsche AG, Skoda Auto and others. VW AG board of directors is responsible for managing the group. The actual CEO is Prof. Martin Winterkorn, since 2007. He was before Chairman of the Board of management of AUDI AG and spent twenty years in the group in total.
The group is expanding its brands (last year with the consolidation of Porsche AG, Man and Scania), which represents now a complete pool of companies. It is able to satisfy consumers looking for urban, compact, sedan, family, premium, luxury and sport cars. It is also able to finance such purchases.
This portfolio is more relevant because every brand respects its own culture. A neophyte will not notice that a Seat or Bentley is under a German management. If platforms and engines can be shared for some
1 http://www.volkswagenag.com/content/vwcorp/content/en/the_group/history.html
3
cars, most of them are conserving initial engines, just optimised. Moreover, design is also personal to the brand. As opposed to Fiat-Chrysler which is “rebadging” its cars in North America with Chrysler and in Europe with Fiat, providing Fiat vehicles which are in fact disguised Chrysler ones2.
Brands
Volkswagen group is diversified in products (Cars, motorcycles, trucks) and segmentation (accessible range, middle class, premium, luxury and sport).
Key figures
Main figures3
2008 2009 2010 2011 2012
Sales (in million €) 113,808 105,187 126,875 159,337 192,676
Profits (in million €) 4,753 960 6,835 15,409 21,717
Market capitalisation (in million €) 80,220 45,983 49,263 48,221 77,315
Employees (000' employees) 357 367 400 502 550
Financial ratios
2008 2009 2010 2011 2012
Return on Equity 11.89% 2.57% 15.87% 27.50% 29.92%
Price-to-Earnings 20.94 32.10 6.97 3.13 3.50
Price-to-Sales 0.87 0.29 0.38 0.30 0.39
Price-to-Book value 2.84 0.87 1.04 0.84 0.98
Dividend Yield 0.77% 2.08% 2.08% 2.89% 2.15%
2 http://www.volkswagenag.com/content/vwcorp/info_center/en/publications/publications.acq.html/archive-
on/icr-financial_publications!annual_reports/index.html 3 Same source
4
Market capitalisation almost reached its pre-crisis level, but the strong increase last year (60%) is questionable compared to growth in sales (20%) and profits (40%). It can be a hint for an increase in intangible assets, book value (P/B ratio) or an overvaluation, what we will investigate in the valuation part.
The dividend yield is constant, while sales and profits are increasing: it is a proof of the implementation of Volkswagen strategy. Value is created but shareholders may require an increase in dividend pay-out.
Market shares
4
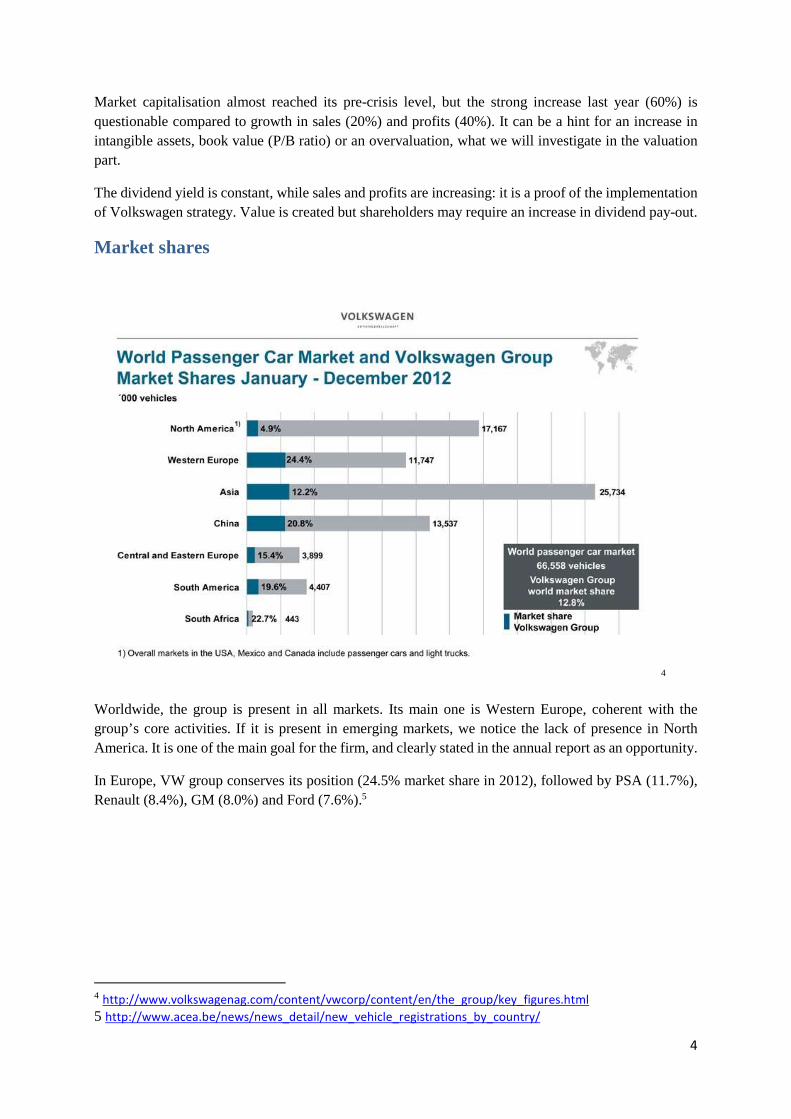
Worldwide, the group is present in all markets. Its main one is Western Europe, coherent with the group’s core activities. If it is present in emerging markets, we notice the lack of presence in North America. It is one of the main goal for the firm, and clearly stated in the annual report as an opportunity.
In Europe, VW group conserves its position (24.5% market share in 2012), followed by PSA (11.7%), Renault (8.4%), GM (8.0%) and Ford (7.6%).5
4 http://www.volkswagenag.com/content/vwcorp/content/en/the_group/key_figures.html 5 http://www.acea.be/news/news_detail/new_vehicle_registrations_by_country/
5
Strategy
General
“Our pursuit of innovation and perfection and our responsible approach will help to make us the world’s leading automaker by 2018 – both economically and ecologically.”6
Through this quote, the group wants to increase unit sales by more than 10 million vehicles per year. An increase production capacity can help Volkswagen to reduce its cost per unit, increase their margin or sell at slightly lower price, which will increase sales or/and their profit. The investment plan (€50.2 billion between 2013 and 2015) is concerning purchase of property, plant and equipment and an increase in production capacity. Overall, the group will base its development on core values as:
- Improving quality through acquired brands. - Developing new models on common platforms - Increasing R&D in environmental and technologic
Key success factors
Volkswagen group can rely on its core competitive advantages as7:
- Price competitivity: same platforms used, control of production and research and development costs,
- Efficient segmentation: range diversification while keeping brands culture, - Management internationalization, shared culture and knowledge, - Investment capacity due to M&A, - Quality standards and rigor: brand culture and recognition.
6 http://www.volkswagenag.com/content/vwcorp/info_center/en/publications/publications.acq.html/archive-
on/icr-financial_publications!annual_reports/index.html 7 http://www.volkswagenag.com/content/vwcorp/content/en/the_group/strategy.html
6
SWOT Analysis
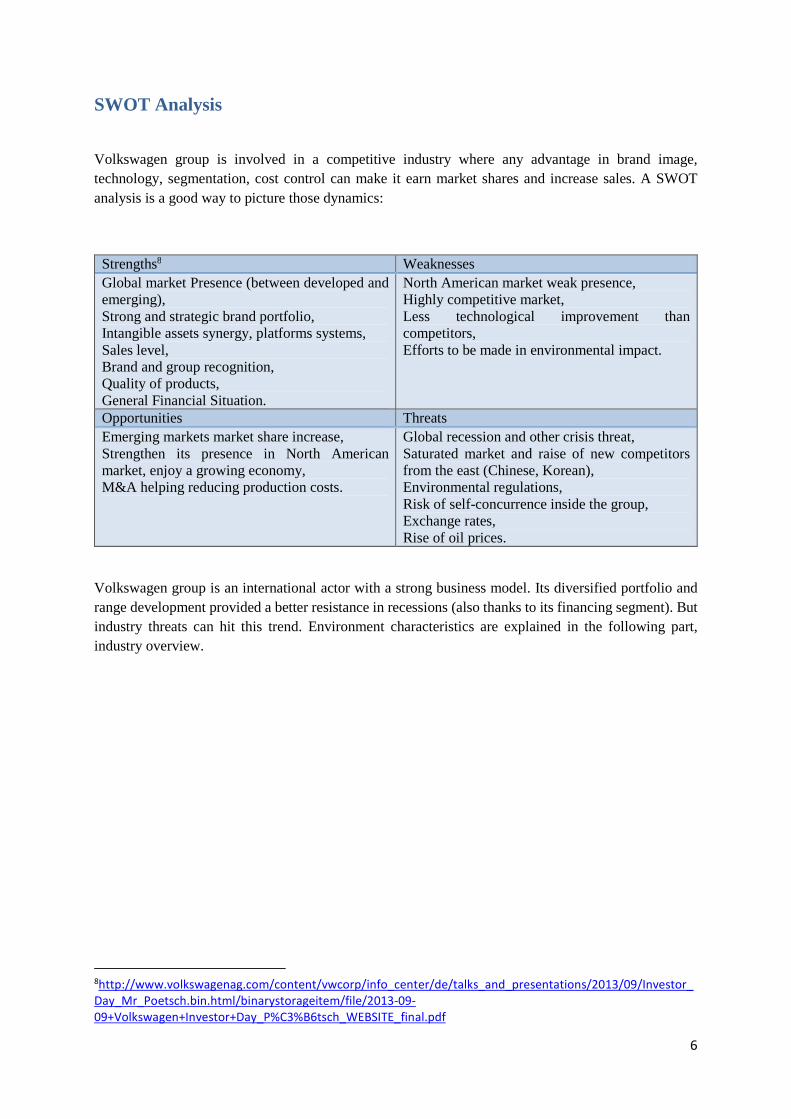
Volkswagen group is involved in a competitive industry where any advantage in brand image, technology, segmentation, cost control can make it earn market shares and increase sales. A SWOT analysis is a good way to picture those dynamics:
Strengths8 Weaknesses Global market Presence (between developed and emerging), Strong and strategic brand portfolio, Intangible assets synergy, platforms systems, Sales level, Brand and group recognition, Quality of products, General Financial Situation.
North American market weak presence, Highly competitive market, Less technological improvement than competitors, Efforts to be made in environmental impact.
Opportunities Threats Emerging markets market share increase, Strengthen its presence in North American market, enjoy a growing economy, M&A helping reducing production costs.
Global recession and other crisis threat, Saturated market and raise of new competitors from the east (Chinese, Korean), Environmental regulations, Risk of self-concurrence inside the group, Exchange rates, Rise of oil prices.
Volkswagen group is an international actor with a strong business model. Its diversified portfolio and range development provided a better resistance in recessions (also thanks to its financing segment). But industry threats can hit this trend. Environment characteristics are explained in the following part, industry overview.
8http://www.volkswagenag.com/content/vwcorp/info_center/de/talks_and_presentations/2013/09/Investor_
Day_Mr_Poetsch.bin.html/binarystorageitem/file/2013-09-
09+Volkswagen+Investor+Day_P%C3%B6tsch_WEBSITE_final.pdf
7
Industry overview
Brief presentation
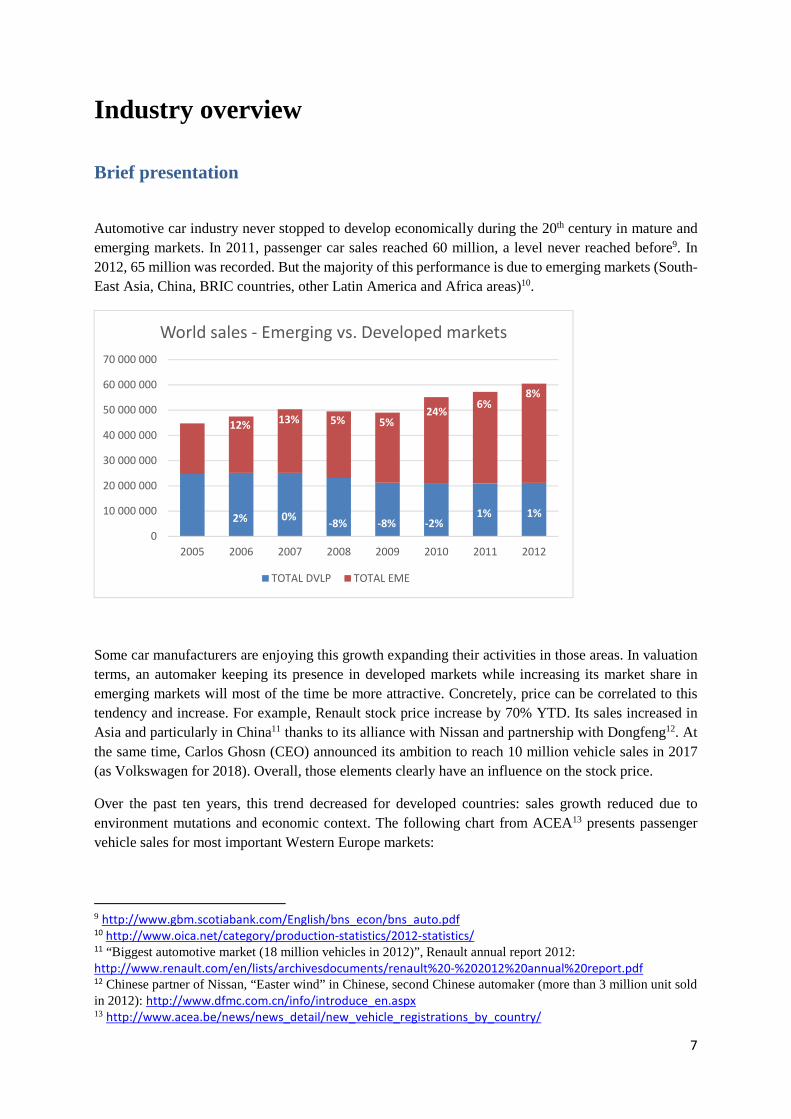
Automotive car industry never stopped to develop economically during the 20th century in mature and emerging markets. In 2011, passenger car sales reached 60 million, a level never reached before9. In 2012, 65 million was recorded. But the majority of this performance is due to emerging markets (South-East Asia, China, BRIC countries, other Latin America and Africa areas)10.
Some car manufacturers are enjoying this growth expanding their activities in those areas. In valuation terms, an automaker keeping its presence in developed markets while increasing its market share in emerging markets will most of the time be more attractive. Concretely, price can be correlated to this tendency and increase. For example, Renault stock price increase by 70% YTD. Its sales increased in Asia and particularly in China11 thanks to its alliance with Nissan and partnership with Dongfeng12. At the same time, Carlos Ghosn (CEO) announced its ambition to reach 10 million vehicle sales in 2017 (as Volkswagen for 2018). Overall, those elements clearly have an influence on the stock price.
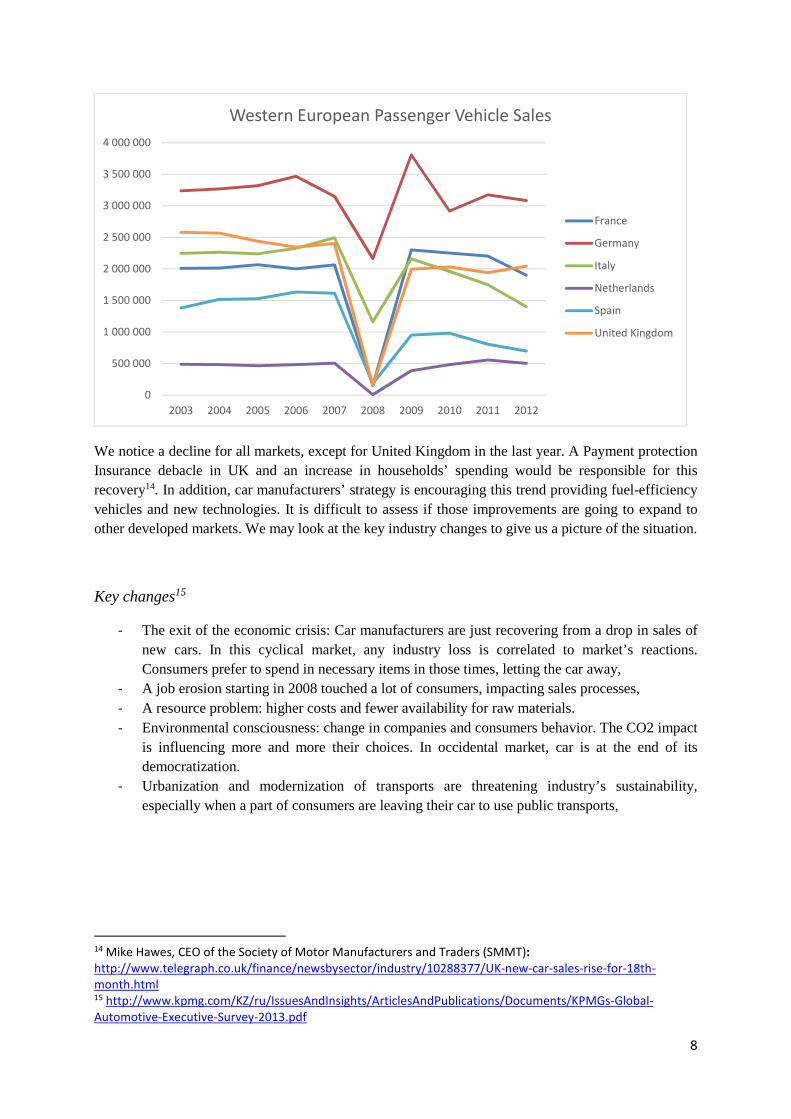
Over the past ten years, this trend decreased for developed countries: sales growth reduced due to environment mutations and economic context. The following chart from ACEA13 presents passenger vehicle sales for most important Western Europe markets:
9 http://www.gbm.scotiabank.com/English/bns_econ/bns_auto.pdf 10 http://www.oica.net/category/production-statistics/2012-statistics/ 11 “Biggest automotive market (18 million vehicles in 2012)”, Renault annual report 2012: http://www.renault.com/en/lists/archivesdocuments/renault%20-%202012%20annual%20report.pdf 12 Chinese partner of Nissan, “Easter wind” in Chinese, second Chinese automaker (more than 3 million unit sold in 2012): http://www.dfmc.com.cn/info/introduce_en.aspx 13 http://www.acea.be/news/news_detail/new_vehicle_registrations_by_country/
2% 0%-8% -8% -2%
1% 1%
12%13% 5% 5%
24%6%
8%
0
10 000 000
20 000 000
30 000 000
40 000 000
50 000 000
60 000 000
70 000 000
2005 2006 2007 2008 2009 2010 2011 2012
World sales - Emerging vs. Developed markets
TOTAL DVLP TOTAL EME
8
We notice a decline for all markets, except for United Kingdom in the last year. A Payment protection Insurance debacle in UK and an increase in households’ spending would be responsible for this recovery14. In addition, car manufacturers’ strategy is encouraging this trend providing fuel-efficiency vehicles and new technologies. It is difficult to assess if those improvements are going to expand to other developed markets. We may look at the key industry changes to give us a picture of the situation.
Key changes15
- The exit of the economic crisis: Car manufacturers are just recovering from a drop in sales of new cars. In this cyclical market, any industry loss is correlated to market’s reactions. Consumers prefer to spend in necessary items in those times, letting the car away,
- A job erosion starting in 2008 touched a lot of consumers, impacting sales processes, - A resource problem: higher costs and fewer availability for raw materials. - Environmental consciousness: change in companies and consumers behavior. The CO2 impact
is influencing more and more their choices. In occidental market, car is at the end of its democratization.
- Urbanization and modernization of transports are threatening industry’s sustainability, especially when a part of consumers are leaving their car to use public transports,
14 Mike Hawes, CEO of the Society of Motor Manufacturers and Traders (SMMT):
http://www.telegraph.co.uk/finance/newsbysector/industry/10288377/UK-new-car-sales-rise-for-18th-
month.html 15 http://www.kpmg.com/KZ/ru/IssuesAndInsights/ArticlesAndPublications/Documents/KPMGs-Global-
Automotive-Executive-Survey-2013.pdf
0
500 000
1 000 000
1 500 000
2 000 000
2 500 000
3 000 000
3 500 000
4 000 000
2003 2004 2005 2006 2007 2008 2009 2010 2011 2012
Western European Passenger Vehicle Sales
France
Germany
Italy
Netherlands
Spain
United Kingdom
9
Production location
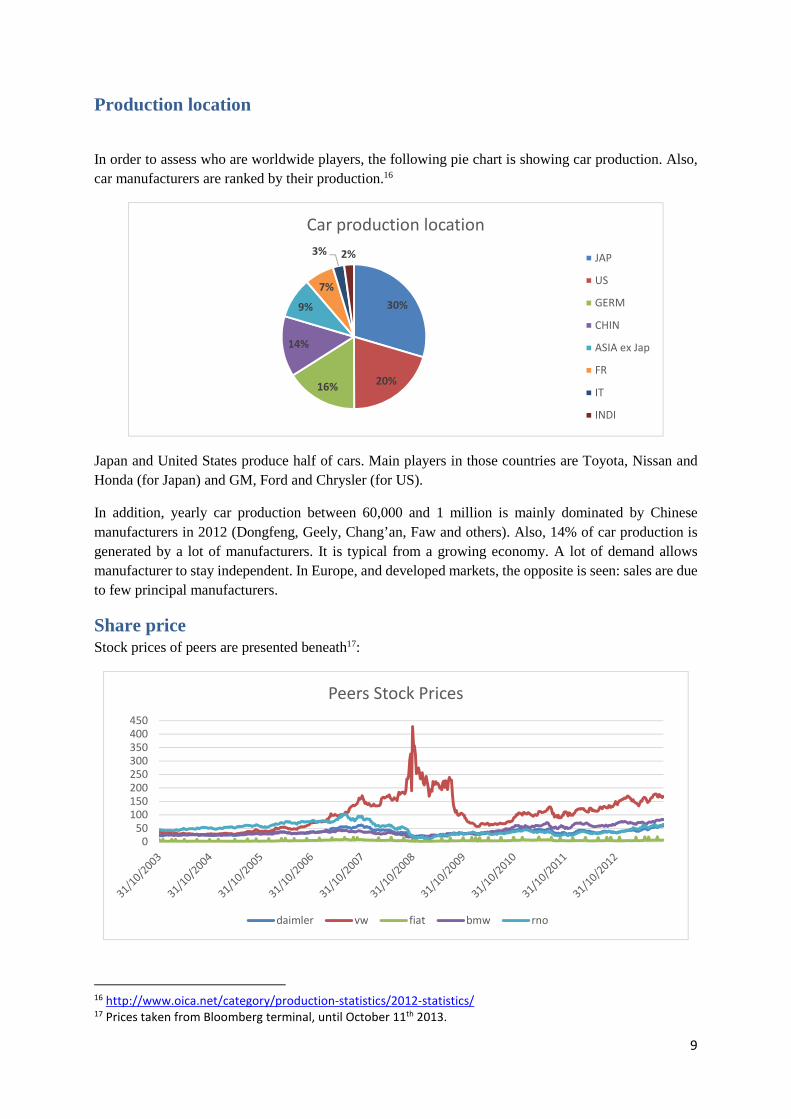
In order to assess who are worldwide players, the following pie chart is showing car production. Also, car manufacturers are ranked by their production.16
Japan and United States produce half of cars. Main players in those countries are Toyota, Nissan and Honda (for Japan) and GM, Ford and Chrysler (for US).
In addition, yearly car production between 60,000 and 1 million is mainly dominated by Chinese manufacturers in 2012 (Dongfeng, Geely, Chang’an, Faw and others). Also, 14% of car production is generated by a lot of manufacturers. It is typical from a growing economy. A lot of demand allows manufacturer to stay independent. In Europe, and developed markets, the opposite is seen: sales are due to few principal manufacturers.
Share price Stock prices of peers are presented beneath17:
16 http://www.oica.net/category/production-statistics/2012-statistics/ 17 Prices taken from Bloomberg terminal, until October 11th 2013.
30%
20%16%
14%
9%
7%
3% 2%
Car production location
JAP
US
GERM
CHIN
ASIA ex Jap
FR
IT
INDI
0
50
100
150
200
250
300
350
400
450
Peers Stock Prices
daimler vw fiat bmw rno
10
An overview on how European automakers performed in the last ten years shows distortions. The cyclical aspect of the sector is seen in 2008-2009. We notice a peak in 2008 due to emerging markets presence, and brand portfolio18. The following drop is explained by Porsche’s desire to execute options on Volkswagen shares and sell them at a higher price and making huge profits. But the share lost value when public felt Porsche will take a “majority control” of Volkswagen19.
Strategy
Main competitors’ strategy is found below:
- Daimler: • Continue efforts made to improve brand image, • Control production costs by developing common platforms, • Improve its presence in emerging markets and electric segment (Allaince with Renault-
Nissan), • Continue to strengthen for cars quality, • Continue to be financially efficient (working capital and cash conversion cycle).
- General Motors:
• Continue efforts in fuel-efficiency vehicles, • Improve its presence in emerging markets, • Build a stronger brand image and group identity, • Cost-cutting by reducing number of brands and models.
- Ford:
• Be recognized for its client’s satisfaction, • Continue efforts made in fuel-efficiency engines (“eco-boost engines”, other R&D plans), • Increase salaried positions, investment in plants to increase sales, • Fill its lack of presence in emerging markets.
- Renault: • Sales objective of 10 million vehicles in 2017, • Strengthen its alliance with Nissan, and its electrical advantage, • Continue its low cost strategy in Europe (Dacia).
- BMW:
• Develop its electric segment, financial segment and niche brand (Mini) by increasing the range of vehicles,
• Be more profitable (asset efficiency, cost reduction) and efficient (cash conversion cycle, working capital).
18 (Boston, W. in TIME and Business Money website),
http://content.time.com/time/business/article/0,8599,1913926,00.html, “the group also saved huge losses
thanks to its weak market shares in US market during this period”. 19 http://www.nytimes.com/2008/10/30/business/worldbusiness/30volkswagen.html?_r=2&
11
- Fiat:
• Find an equilibrium in vehicle range and cost control thanks to its alliance with Chrysler, • “Mass market and premium brands”,
• Invest in R&D to be independent in technology supplies.
In order to achieve those goals, peers are facing market’s dynamics, which can be summed up as follows in the PESTEL analysis.
PESTEL Analysis
Industry’s characteristics are slightly different focusing on emerging and developed markets. Number of potential consumers, political standards, regulations and car perception are proper to one market. That is why we will focus on both with the PESTEL analysis20.
Mature markets
Political Taxes and regulations are a burden for companies (corporate and income tax), Environmental precaution is procognized but costly for automakers (R&D, infrastructure, strategy).
Economic Purchasing power is lower due to economic situation (except for North America, Total cost of owning a car is high (including oil increase).
Social Use of alternative transports, common transports (due to trafic jams), Change in the purchasing reason : from pleasure to utility.
Legal Strict driving standards and safety norms and policy, Autonomous driving laws versus ethics, High workforce protection which limitates strategic relocations.
Environmental Air quality standards, Pollution control.
Technologic Research on new technologies such as new oils or electric engines (R&D), Lack of infrastructure to receive those cars on the roads.
20 http://finance.yahoo.com/news/auto-industry-outlook-review-feb-211459510.html and
http://www.acea.be/collection/industry_and_economy_industry_report/
12
Emerging markets21
Political Political and economical alliances, Foreign automaker companies welcoming (as tax discounts).
Economic Oil price also increased, High sales growth (due to demographic growth and increasing purchasing power).
Social Car recognized as a social position (Maslow pyramid, occidentalization processus), a diferenciation.
Legal Few driving standards and control (even if it is changing), No severe rules on workforce giving more freedom to companies.
Environemental Few pressure on environmental impact.
Technologic Research of new technologies.
As we saw in production location part, new market entrants are common in the industry. A new manufacturer could enjoy European knowledge and experience with Chinese position and presence. For example, Chinese automaker could look for weak industrial players in Europe (Opel or PSA) to build alliances to resist better in the Chinese market with a lot of competitors. Those industry dynamics drive us to sum up into key industry success point.
Key industry success points
Overall, automakers are aware of actual industry dynamics. In developed markets the strength will be to keep its positions (market shares) and develop key success points22:
- Finding an equilibrium between profitability and security to have an investment capacity and prevent from a cyclical market
- Manage the prices’ competitivity, - Diversify its segments logically to keep automotive segment as a core activity, - Segmentation’s pertinence to satisfy a large offer (brand, product and target may correspond), - Use of new technologies to develop efficient engines and cars, - Respect international norms and regulations (especially for safety and pollution).
21 http://www.kpmg.com/KZ/ru/IssuesAndInsights/ArticlesAndPublications/Documents/KPMGs-Global-
Automotive-Executive-Survey-2013.pdf and
http://www.pma.org/apsc/speakers/presentations/2013/IHS%20Vehicle%20Forecast-ASPC13.pdf 22 http://www.yorku.ca/dcohn/consensus-document.pdf and
http://www.pwc.com/en_GX/gx/automotive/industry-publications-and-thought-leadership/assets/pwc-
automotive-m-and-a-insights-mid-year-2013.pdf
13
Valuation using the Dividend Discount Model
After a company overview and assessing its industry, we understand issues and opportunities in this cyclical sector. Strategy choices will represent a competitive advantage for automakers. We now are going to value Volkswagen stock through different methods to know if an investor should go along with it.
Choice of model
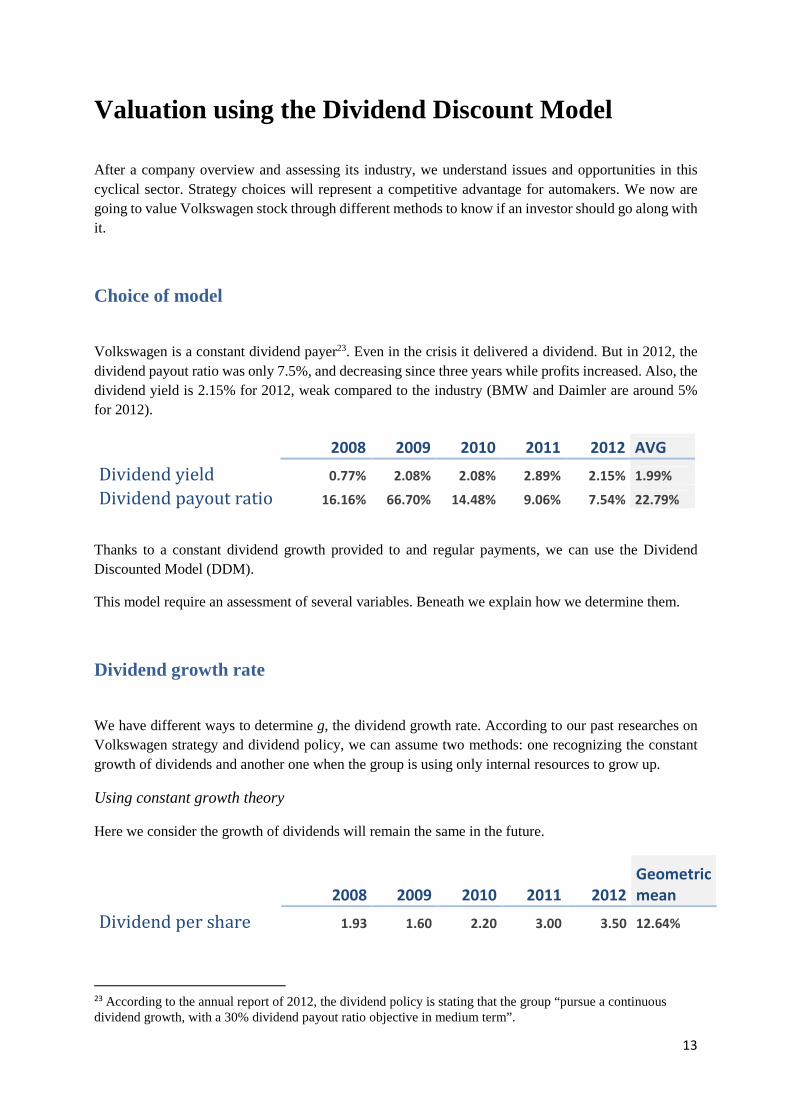
Volkswagen is a constant dividend payer23. Even in the crisis it delivered a dividend. But in 2012, the dividend payout ratio was only 7.5%, and decreasing since three years while profits increased. Also, the dividend yield is 2.15% for 2012, weak compared to the industry (BMW and Daimler are around 5% for 2012).
2008 2009 2010 2011 2012 AVG
Dividend yield 0.77% 2.08% 2.08% 2.89% 2.15% 1.99%
Dividend payout ratio 16.16% 66.70% 14.48% 9.06% 7.54% 22.79%
Thanks to a constant dividend growth provided to and regular payments, we can use the Dividend Discounted Model (DDM).
This model require an assessment of several variables. Beneath we explain how we determine them.
Dividend growth rate
We have different ways to determine g, the dividend growth rate. According to our past researches on Volkswagen strategy and dividend policy, we can assume two methods: one recognizing the constant growth of dividends and another one when the group is using only internal resources to grow up.
Using constant growth theory
Here we consider the growth of dividends will remain the same in the future.
2008 2009 2010 2011 2012
Geometric
mean
Dividend per share 1.93 1.60 2.20 3.00 3.50 12.64%
23 According to the annual report of 2012, the dividend policy is stating that the group “pursue a continuous dividend growth, with a 30% dividend payout ratio objective in medium term”.
14
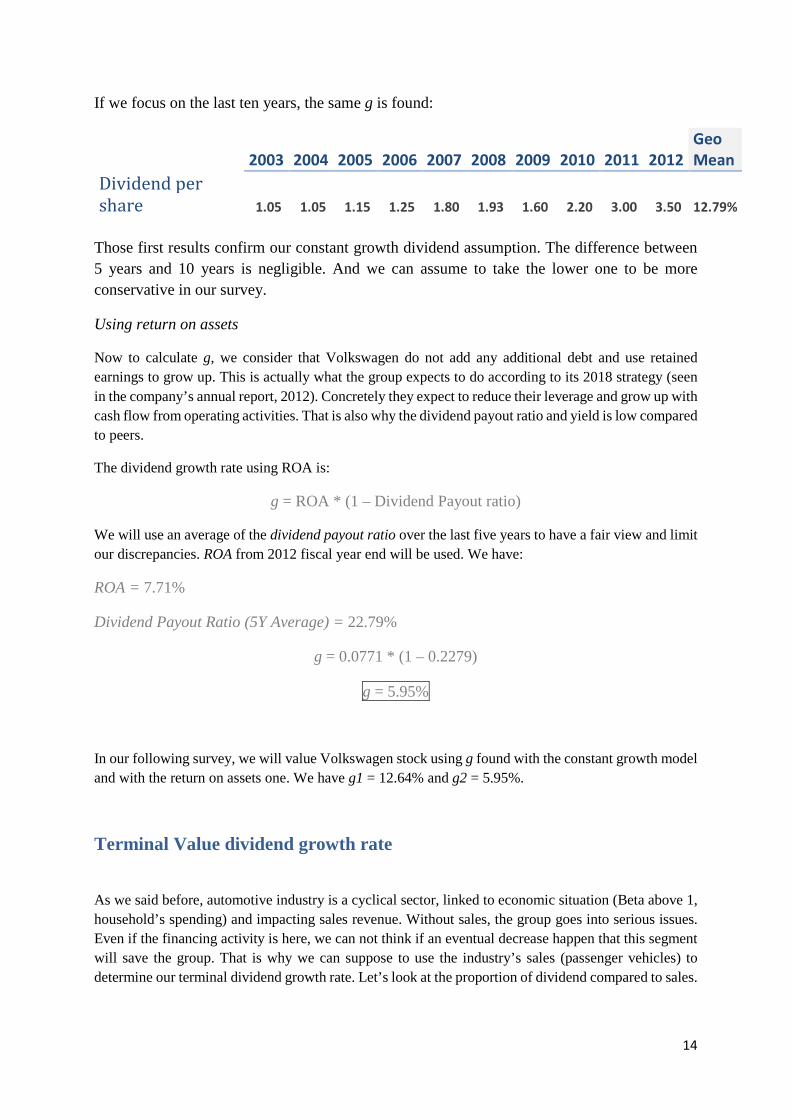
If we focus on the last ten years, the same g is found:
2003 2004 2005 2006 2007 2008 2009 2010 2011 2012
Geo
Mean
Dividend per
share 1.05 1.05 1.15 1.25 1.80 1.93 1.60 2.20 3.00 3.50 12.79%
Those first results confirm our constant growth dividend assumption. The difference between 5 years and 10 years is negligible. And we can assume to take the lower one to be more conservative in our survey.
Using return on assets
Now to calculate g, we consider that Volkswagen do not add any additional debt and use retained earnings to grow up. This is actually what the group expects to do according to its 2018 strategy (seen in the company’s annual report, 2012). Concretely they expect to reduce their leverage and grow up with cash flow from operating activities. That is also why the dividend payout ratio and yield is low compared to peers.
The dividend growth rate using ROA is:
g = ROA * (1 – Dividend Payout ratio)
We will use an average of the dividend payout ratio over the last five years to have a fair view and limit our discrepancies. ROA from 2012 fiscal year end will be used. We have:
ROA = 7.71%
Dividend Payout Ratio (5Y Average) = 22.79%
g = 0.0771 * (1 – 0.2279)
g = 5.95%
In our following survey, we will value Volkswagen stock using g found with the constant growth model and with the return on assets one. We have g1 = 12.64% and g2 = 5.95%.
Terminal Value dividend growth rate
As we said before, automotive industry is a cyclical sector, linked to economic situation (Beta above 1, household’s spending) and impacting sales revenue. Without sales, the group goes into serious issues. Even if the financing activity is here, we can not think if an eventual decrease happen that this segment will save the group. That is why we can suppose to use the industry’s sales (passenger vehicles) to determine our terminal dividend growth rate. Let’s look at the proportion of dividend compared to sales.
15
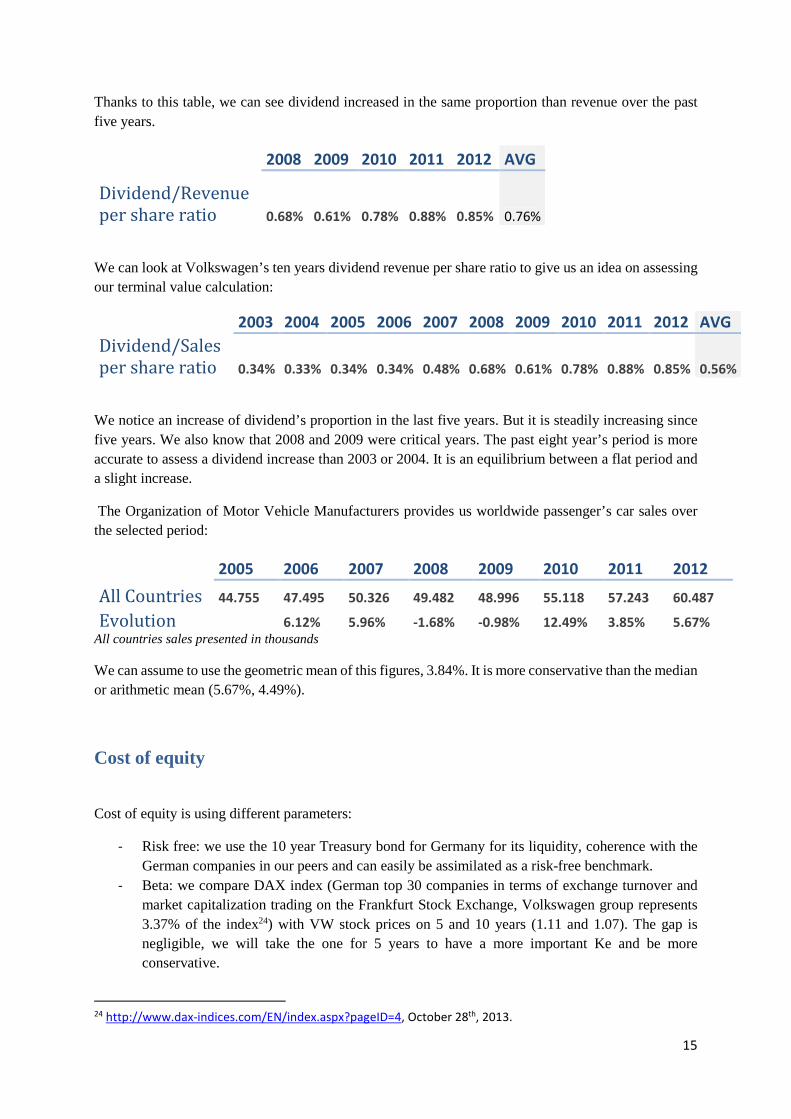
Thanks to this table, we can see dividend increased in the same proportion than revenue over the past five years.
2008 2009 2010 2011 2012 AVG
Dividend/Revenue
per share ratio 0.68% 0.61% 0.78% 0.88% 0.85% 0.76%
We can look at Volkswagen’s ten years dividend revenue per share ratio to give us an idea on assessing our terminal value calculation:
2003 2004 2005 2006 2007 2008 2009 2010 2011 2012 AVG
Dividend/Sales
per share ratio 0.34% 0.33% 0.34% 0.34% 0.48% 0.68% 0.61% 0.78% 0.88% 0.85% 0.56%
We notice an increase of dividend’s proportion in the last five years. But it is steadily increasing since five years. We also know that 2008 and 2009 were critical years. The past eight year’s period is more accurate to assess a dividend increase than 2003 or 2004. It is an equilibrium between a flat period and a slight increase.
The Organization of Motor Vehicle Manufacturers provides us worldwide passenger’s car sales over the selected period:
2005 2006 2007 2008 2009 2010 2011 2012
All Countries 44.755 47.495 50.326 49.482 48.996 55.118 57.243 60.487
Evolution 6.12% 5.96% -1.68% -0.98% 12.49% 3.85% 5.67%
All countries sales presented in thousands
We can assume to use the geometric mean of this figures, 3.84%. It is more conservative than the median or arithmetic mean (5.67%, 4.49%).
Cost of equity
Cost of equity is using different parameters:
- Risk free: we use the 10 year Treasury bond for Germany for its liquidity, coherence with the German companies in our peers and can easily be assimilated as a risk-free benchmark.
- Beta: we compare DAX index (German top 30 companies in terms of exchange turnover and market capitalization trading on the Frankfurt Stock Exchange, Volkswagen group represents 3.37% of the index24) with VW stock prices on 5 and 10 years (1.11 and 1.07). The gap is negligible, we will take the one for 5 years to have a more important Ke and be more conservative.
24 http://www.dax-indices.com/EN/index.aspx?pageID=4, October 28th, 2013.
16
- Market premium is given: 5.8%
Ke = Rf + β * Market Premium
Ke = 8.18 %
Sensitivity analysis
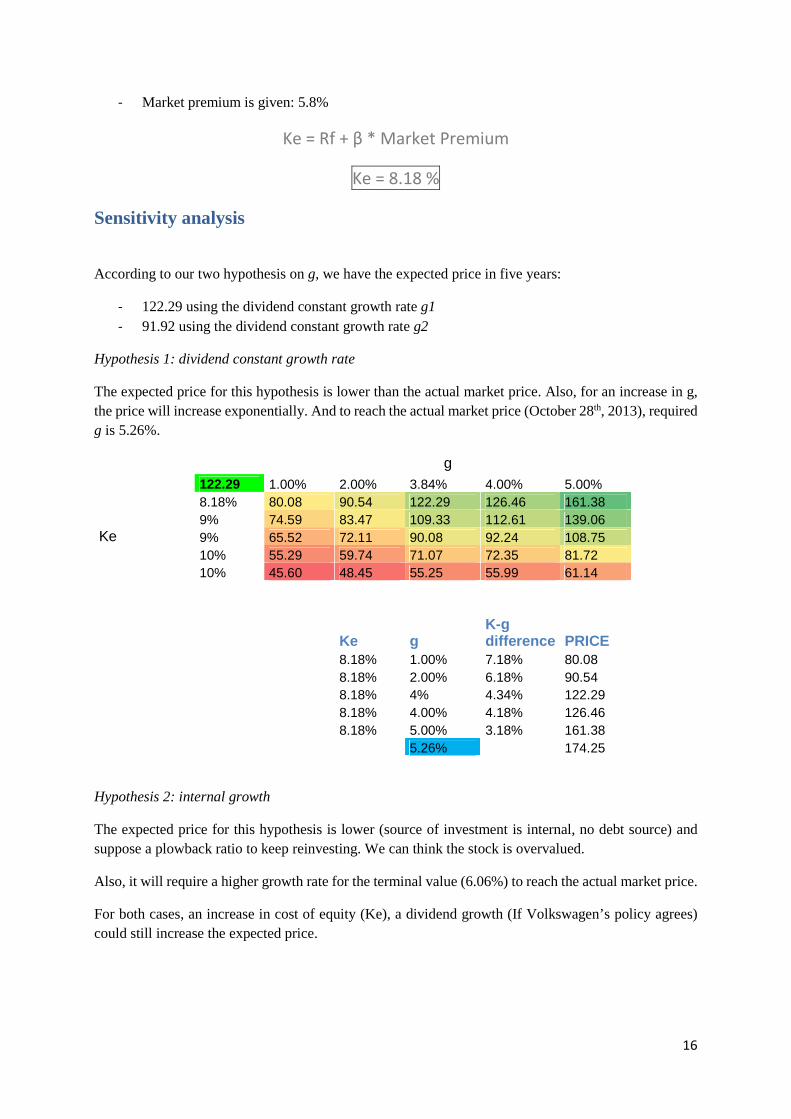
According to our two hypothesis on g, we have the expected price in five years:
- 122.29 using the dividend constant growth rate g1 - 91.92 using the dividend constant growth rate g2
Hypothesis 1: dividend constant growth rate
The expected price for this hypothesis is lower than the actual market price. Also, for an increase in g, the price will increase exponentially. And to reach the actual market price (October 28th, 2013), required g is 5.26%.
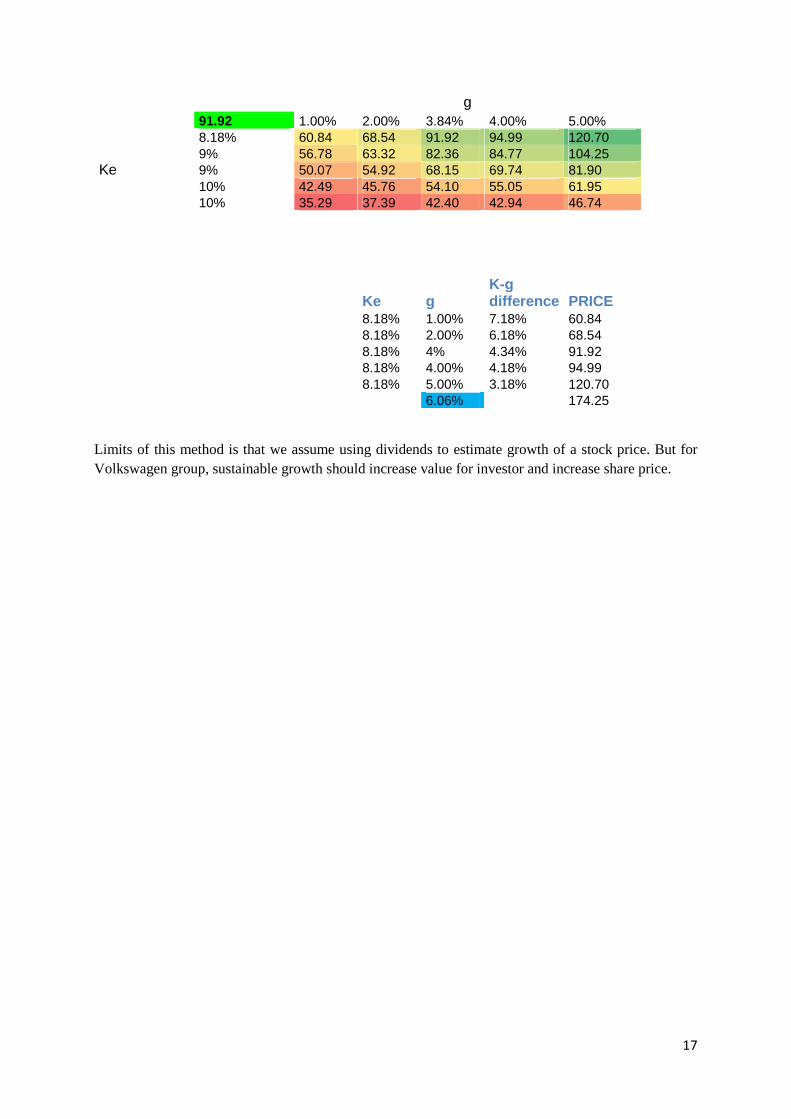
Hypothesis 2: internal growth
The expected price for this hypothesis is lower (source of investment is internal, no debt source) and suppose a plowback ratio to keep reinvesting. We can think the stock is overvalued.
Also, it will require a higher growth rate for the terminal value (6.06%) to reach the actual market price.
For both cases, an increase in cost of equity (Ke), a dividend growth (If Volkswagen’s policy agrees) could still increase the expected price.
g 122.29 1.00% 2.00% 3.84% 4.00% 5.00%
Ke
8.18% 80.08 90.54 122.29 126.46 161.38 9% 74.59 83.47 109.33 112.61 139.06 9% 65.52 72.11 90.08 92.24 108.75 10% 55.29 59.74 71.07 72.35 81.72 10% 45.60 48.45 55.25 55.99 61.14
Ke g K-g difference PRICE
8.18% 1.00% 7.18% 80.08 8.18% 2.00% 6.18% 90.54 8.18% 4% 4.34% 122.29 8.18% 4.00% 4.18% 126.46 8.18% 5.00% 3.18% 161.38 5.26% 174.25
17
g 91.92 1.00% 2.00% 3.84% 4.00% 5.00%
Ke
8.18% 60.84 68.54 91.92 94.99 120.70 9% 56.78 63.32 82.36 84.77 104.25 9% 50.07 54.92 68.15 69.74 81.90 10% 42.49 45.76 54.10 55.05 61.95 10% 35.29 37.39 42.40 42.94 46.74
Ke g K-g difference PRICE
8.18% 1.00% 7.18% 60.84 8.18% 2.00% 6.18% 68.54 8.18% 4% 4.34% 91.92 8.18% 4.00% 4.18% 94.99 8.18% 5.00% 3.18% 120.70 6.06% 174.25
Limits of this method is that we assume using dividends to estimate growth of a stock price. But for Volkswagen group, sustainable growth should increase value for investor and increase share price.
18
Valuation using the Relative Valuation
Choice of competitors
We have chosen ford and gm at first sight, but the lack of information before 2010, the bigger impact during the economic crisis and the different accounting standards (US GAAP) will make our analysis (especially P/E ratio difficult).
We have chosen Daimler, Fiat, Renault, Bmw due to following characteristics:
- European peers, - Same industry, - Similar business model (acquisitions, multi target and globalization) - Even if there is a discrepancy in sales, they have a similar goal to expand their activities in
emerging markets.
Choice of multiples
At first sight, 5 multiples are calculated:
- P/E ratio - Sales multiple - EBIT multiple - EBITDA multiple - P/B ratio
We want to assess why they are relevant to use:
P/E and P/B ratio
P/E is commonly used and shows a clear overvaluation of Volkswagen.
P/B is a nice predictor of share price growth if the company does not have useless assets. If not, it is a value trap for investors. But after reviewing Volkswagen annual report, it seems the high book value comes from M&A (Porsche consolidation lately). In this case, we could consider using it.
But share price growth should come from undervaluation from P/B and P/E and P/B should converge closer (if earnings increases)
As company growth plan is to grow up internally, and tends to develop and increase sales, ROA should increase, to generate net income.
So, P/B ratio let us think Volkswagen share is undervalued.
19
EBIT and EBITDA multiple
Those multiples give an overview of company’s profitability. EBITDA is a good comparable because it eliminates changes in accounting uses. But it is not a good multiple to assess cash flows.
Sales multiple
As Sales is a determinant criteria for the industry, we consider comparing Price-to-sales multiple.
Relative valuation and interpretation
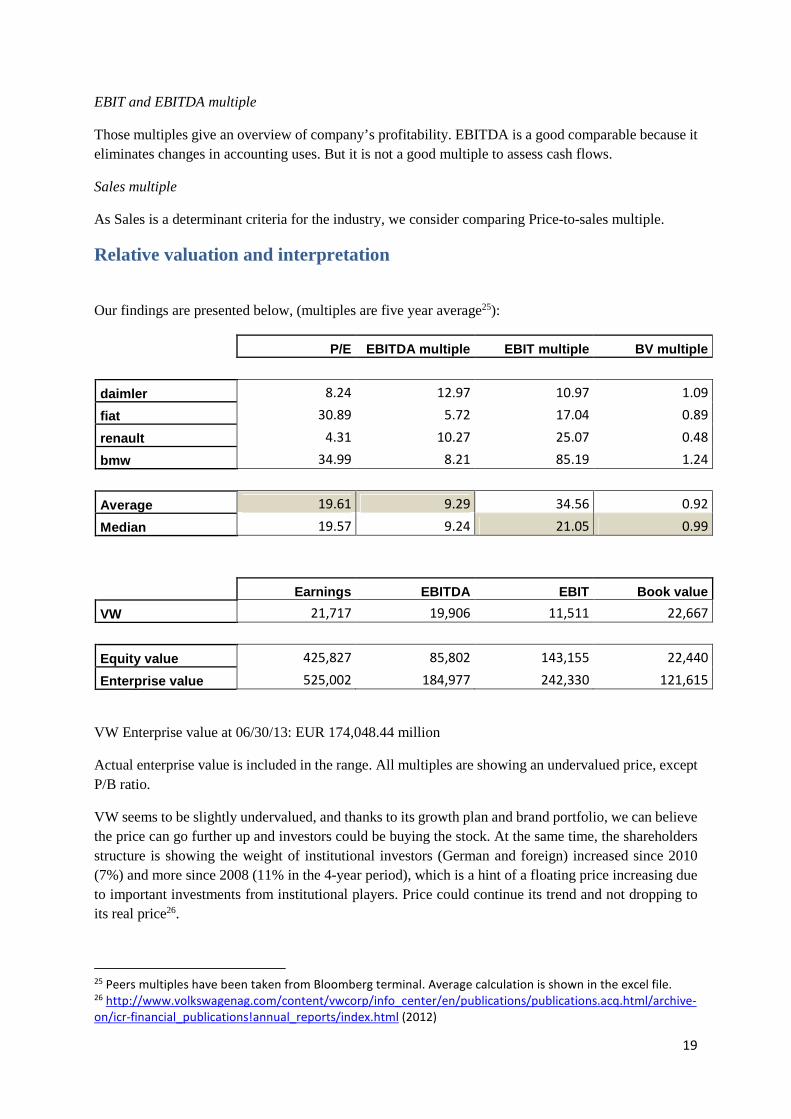
Our findings are presented below, (multiples are five year average25):
P/E EBITDA multiple EBIT multiple BV multiple
daimler 8.24 12.97 10.97 1.09
fiat 30.89 5.72 17.04 0.89
renault 4.31 10.27 25.07 0.48
bmw 34.99 8.21 85.19 1.24
Average 19.61 9.29 34.56 0.92
Median 19.57 9.24 21.05 0.99
Earnings EBITDA EBIT Book value
VW 21,717 19,906 11,511 22,667
Equity value 425,827 85,802 143,155 22,440
Enterprise value 525,002 184,977 242,330 121,615
VW Enterprise value at 06/30/13: EUR 174,048.44 million
Actual enterprise value is included in the range. All multiples are showing an undervalued price, except P/B ratio.
VW seems to be slightly undervalued, and thanks to its growth plan and brand portfolio, we can believe the price can go further up and investors could be buying the stock. At the same time, the shareholders structure is showing the weight of institutional investors (German and foreign) increased since 2010 (7%) and more since 2008 (11% in the 4-year period), which is a hint of a floating price increasing due to important investments from institutional players. Price could continue its trend and not dropping to its real price26.
25 Peers multiples have been taken from Bloomberg terminal. Average calculation is shown in the excel file. 26 http://www.volkswagenag.com/content/vwcorp/info_center/en/publications/publications.acq.html/archive-
on/icr-financial_publications!annual_reports/index.html (2012)
20
Also, Net Net working capital did not showed a buy signal (Graham strategy was to buy stock trading at less than two-thirds of NNWC per share27. We get for 2012 161.5, almost equal to the share price).
At the same time, the sensitivity analysis is showing (with Hypothesis 2, the most relevant for the group) that VW price is overvalued. But we have been really conservative and we focused on the DAX index (remembering VW’s weight is about 3.37% of the index), giving us a high beta and a high cost of equity. Meanwhile we took the geometric mean for the worldwide car sales which was lower than the arithmetic mean and the median.
Recommendations
For an income investor, we can advise him to stay neutral, since the growing strategy is not expecting to increase dividend payout-ratio (even if pressure from shareholders will increase it in the next years).
27 http://deepvalueinvestor.com/net-net-working-capital/
21
References
Company’s official websites and annual reports
Volkswagen official website, history:
http://www.volkswagenag.com/content/vwcorp/content/en/the_group/history.html
Volkswagen group (2012), Annual report. Retrieved from
http://www.volkswagenag.com/content/vwcorp/info_center/en/publications/publications.acq.html/
archive-on/icr-financial_publications!annual_reports/index.html
Dieter Pötsch, H. (September 2013), Financial sustainability on core strengths, Volkswagen group
official website:
http://www.volkswagenag.com/content/vwcorp/info_center/de/talks_and_presentations/2013/09/I
nvestor_Day_Mr_Poetsch.bin.html/binarystorageitem/file/2013-09-
09+Volkswagen+Investor+Day_P%C3%B6tsch_WEBSITE_final.pdf
Peers annual reports (2012) and official websites:
- Renault: http://www.renault.com/en/pages/home.aspx
- Ford: http://corporate.ford.com/microsites/sustainability-report-2012-13/blueprint-strategy
- GM: http://www.gm.com/company/investors/corporate-strategy.html
- BMW:
http://www.bmwgroup.com/e/0_0_www_bmwgroup_com/unternehmen/unternehmenspr
ofil/strategie/strategie.html
- Fiat: http://www.fiatspa.com/en-US/group/Pages/group.aspx
- Daimler: http://www.daimler.com/sustainability and http://www.daimler.com/investor-
relations/en
- Dongfeng : http://www.dfmc.com.cn/info/introduce_en.aspx
Data base
Deutsche borse group (2013), DAX.com website, indexes composition. Retrieved from
http://www.dax-indices.com/EN/index.aspx?pageID=4
22
OICA (International Organization of Motor Vehicle Manufacturers) website, 2012 Statistics. Retreived
from:
http://www.oica.net/category/production-statistics/2012-statistics/
ACEA, European Automotive Manufacturers association, (2012), New vehicles registration. Retreived
from:
http://www.acea.be/news/news_detail/new_vehicle_registrations_by_country/
Bloomberg terminal
Survey
Fischer, R., Thakur, A., Stoll, J. & Barroso, F., (2013), KPMG’s Global Automotive Executive survey
2013, KPMG International.
http://www.kpmg.com/KZ/ru/IssuesAndInsights/ArticlesAndPublications/Documents/KPMGs-Global-
Automotive-Executive-Survey-2013.pdf
Articles
Boston, W. (2009), Why Volkswagen Is Powering Through the Recession, TIME Business and Money.
Retrieved from
http://content.time.com/time/business/article/0,8599,1913926,00.html
Dougherty, C. (October 29th 2010), VW Shares Plunge, a Day After Surge, The New York Times World
Business website. Retrieved from
http://www.nytimes.com/2008/10/30/business/worldbusiness/30volkswagen.html?_r=0
Gomes, C. (October 10th 2013), Global Auto report, Scotiabank, page 2. Retrieved from
http://www.gbm.scotiabank.com/English/bns_econ/bns_auto.pdf
UK new car sales rise for 18th month, (September 5th 2013), The Telegraph. Retrieved from

23
http://www.telegraph.co.uk/finance/newsbysector/industry/10288377/UK-new-car-sales-rise-for-
18th-month.html
(28th July 2011), Siemens, Volkswagen and BASF see shares fall, BBC News Business. Retrieved from http://www.bbc.co.uk/news/business-14322993