Embed Size (px)
Citation preview
“Relationships Between Internal and External Training Load in Team Sport Athletes: Evidence for an Individualised
Approach” by Bartlett JD et al.
International Journal of Sports Physiology and Performance
© 2016 Human Kinetics, Inc.
Note. This article will be published in a forthcoming issue of the
International Journal of Sports Physiology and Performance. The
article appears here in its accepted, peer-reviewed form, as it was
provided by the submitting author. It has not been copyedited,
proofread, or formatted by the publisher.
Section: Original Investigation
Article Title: Relationships Between Internal and External Training Load in Team Sport
Athletes: Evidence for an Individualised Approach
Authors: Jonathan D. Bartlett1,2, Fergus O’Connor, 1,2 Nathan Pitchford1,2, Lorena Torres-
Ronda3, and Samuel J. Robertson1,2
Affiliations: 1Institute of Sport, Exercise and Active Living (ISEAL), Victoria University,
Melbourne, Australia. 2Western Bulldogs Football Club, Melbourne, Australia. 3Department
of Health and Kinesiology, Exercise and Sport Nutrition Lab, Texas A&M University,
College Station, TX.
Journal: International Journal of Sports Physiology and Performance
Acceptance Date: May 2, 2016
©2016 Human Kinetics, Inc.
DOI: http://dx.doi.org/10.1123/ijspp.2015-0791
“Relationships Between Internal and External Training Load in Team Sport Athletes: Evidence for an Individualised
Approach” by Bartlett JD et al.
International Journal of Sports Physiology and Performance
© 2016 Human Kinetics, Inc.
Relationships between internal and external training load in team sport athletes:
evidence for an individualised approach
Bartlett, J.D1,2, O’Connor, F, 1,2 Pitchford, N1,2, Torres-Ronda, L3, Robertson, S1,2.
1Institute of Sport, Exercise and Active Living (ISEAL),
Victoria University,
Melbourne,
Australia.
2Western Bulldogs Football Club,
Melbourne,
Australia.
3Department of Health and Kinesiology,
Exercise and Sport Nutrition Lab,
Texas A&M University,
College Station,
TX, USA.
Running head: Individualising training load monitoring
Address for correspondence:
Jonathan D Bartlett
Institute of Sport, Exercise & Active Living (ISEAL)
College of Sport and Exercise Science
Victoria University
PO Box 14428, Melbourne, Victoria, Australia 8001
Tel: +61 3 9680 6345
Email: [email protected]
Word Count: 3,087
Abstract Word Count: 242
Number of Tables: 1
Number of Figures: 2
“Relationships Between Internal and External Training Load in Team Sport Athletes: Evidence for an Individualised
Approach” by Bartlett JD et al.
International Journal of Sports Physiology and Performance
© 2016 Human Kinetics, Inc.
Abstract
Purpose The aim of this study was to quantify and predict relationships between RPE and
GPS training load variables in professional Australian Football (AF) players using group and
individualised modelling approaches. Methods Training load data (GPS and RPE) for 41
professional AF players was obtained over a period of 27 weeks. A total of 2711 training
observations were analysed with a total of 66 13 sessions per player (range; 39 to 89).
Separate generalised estimating equations (GEE) and artificial neural network analyses
(ANN) were conducted to determine the ability to predict RPE from training load variables
(i.e. session distance, high-speed running (HSR), high-speed running %, m·min-1) on a group
and individual basis. Results Prediction error for the individualised ANN (root mean square
error [RMSE]; 1.24 ±0.41) was lower than the group ANN (RMSE; 1.42 ±0.44),
individualised GEE (RMSE; 1.58 ±0.41) and group GEE (RMSE; 1.85 ±0.49). Both the GEE
and ANN models determined session distance as the most important predictor of RPE.
Further, importance plots generated from the ANN revealed session distance was most
predictive of RPE in 36 of the 41 players, whereas, HSR was predictive of RPE in just 3
players and m.min-1 as predictive as session distance in just 2 players. Conclusions This
study demonstrates that machine learning approaches may outperform more traditional
methodologies with respect to predicting athlete responses to training load. These approaches
enable further individualisation of load monitoring, leading to more accurate training
prescription and evaluation.
Key words: Elite athletes, monitoring, training prescription, RPE, GPS
“Relationships Between Internal and External Training Load in Team Sport Athletes: Evidence for an Individualised
Approach” by Bartlett JD et al.
International Journal of Sports Physiology and Performance
© 2016 Human Kinetics, Inc.
Introduction
Professional team sport athletes experience a wide range of daily and weekly demands
such as training, competition, media and team meetings. Of these demands, training is a
necessary and important activity to maximise athletic performance. However, it is essential
that training is prescribed appropriately in order to avoid overtraining and/or injury. Together,
striking a balance between these demands and ensuring athletes perform at their best has
become a major challenge for coaches and sports professionals. As such, monitoring the
external load (EL) and the internal load (IL), during both training and competition, is
recognized as key in informing the management of athletes. Indeed, a growing body of
literature shows that the management of training load is effective in reducing the risk to
injury1-3 as well as improving athletic performance.4
A variety of training load monitoring tools can be used to measure the perceived load
of an athlete to training.5 One such popular approach in the sports domain consists of
subjectively asking the athlete to rate their perceived exertion (RPE) for a given session.
Indeed, by rating the session on a scale of 1-10 (with 1 rated as ‘very, very easy’ and 10 rated
as ‘maximal’) information on how each athlete perceives the ‘hardness’ of the session can be
obtained. This can be further analysed to evaluate its relationship with other means of
training load monitoring.6-8 Subsequently, the use of RPE, a simple and non-invasive tool,
has become popular in team sports due to its low cost and potential benefits in quantifying
IL.9
Recently the development of reliable athlete wearable technology10 such as Global
Positioning Systems (GPS) have been used to monitor pitch-based training loads (TL),
enabling a better understanding of the work performed (i.e., EL) by the athletes. Ultimately, it
is the IL that determines fitness outcomes, however, training is often prescribed by the EL.
“Relationships Between Internal and External Training Load in Team Sport Athletes: Evidence for an Individualised
Approach” by Bartlett JD et al.
International Journal of Sports Physiology and Performance
© 2016 Human Kinetics, Inc.
Accordingly, there has been heightened interest in uncovering the relationships between EL
and IL. In elite rugby league,8 it has be shown that ~62% of the variance in s-RPE could be
explained by the distance covered in a session, the number of impacts (defined as the sum of
accelerations from 3 planes) and ‘body load’ (a measure of total stress resulting from
accelerations, decelerations, changes of direction and impacts). In the same study, 35% of the
variance in s-RPE was explained by exercise-intensity measures such as peak heart rate %,
m·min-1 and impacts·min-1. Another example in elite soccer showed that s-RPE is reflective
of high-intensity running, accelerations and impacts,7 whilst in semi-professional soccer
players, a large association between s-RPE and total distance covered was observed.11
Together, these studies imply that interpretation of s-RPE is specific to the sport in question
as well as the individual athletes being monitored.
Although there has been interest in identifying the training load variables that effect s-
RPE training load, only one study has attempted to uncover which non-training
characteristics may affect s-RPE. Indeed, Gallo et al.12 reported that in Australian Rules
Footballers, playing experience, playing position and time-trial performance impacted the
relationship between EL variables and s-RPE. Subsequently, the authors determined that for a
given EL, the perceived load for each athlete may be different. Accordingly, it would seem
logical to further understand the relationship between EL and IL at the individual level, so as
to more accurately prescribe and monitor training load.
Despite strong evidence for heterogeneity in the responsiveness to regular physical
activity,13 previous research examining the reliability and relationship between internal and
external measures of training load in team sports have done so using linear analysis
approaches, such as multiple regression.6, 8, 9, 14 Machine learning has experienced an increase
in popularity in sporting and exercise research, with applications such as the prediction of
competition outcome15 and quantification of movement activity types.16, 17 This increase in
“Relationships Between Internal and External Training Load in Team Sport Athletes: Evidence for an Individualised
Approach” by Bartlett JD et al.
International Journal of Sports Physiology and Performance
© 2016 Human Kinetics, Inc.
popularity has stemmed from the potential ability of these approaches to account for non-
linearity within datasets and thus display improved performance.18 Therefore, implementation
of such approaches may help to better understand TL at the individual level, thus increasing
the accuracy in understanding the relationship between internal and external load, and thus,
athlete management.
The first aim of this study was to quantify the relationships between RPE and GPS
training load variables in professional Australian Rules Footballers. The second aim was to
compare the accuracy of separate linear and machine learning analyses to predict RPE, using
both pooled group and individual athlete data.
Methods
Forty-one elite level AFL players (age: 23 ± 4 years; height: 187 ± 8 cm body mass:
86 ± 9 kg) were recruited from the same club competing in the Australian Football League
(AFL). All players and coaches were informed about the research procedures, requirements,
benefits, and risks, and their written consent was obtained before the study began. The study
was conducted according to the requirements of the Declaration of Helsinki and was
approved by the universities research ethics committee.
Training load data was included from November 2014 until May 2015. A total of
2711 training observations were analysed comprising of 66 13 sessions (mean ± SD) per
player (range: 39 to 89). Only field-based AF sessions were included for the purpose of this
study. Recovery and individual extra sessions were not included due to their limited intensity
and focus on technical development, respectively.
Ratings of Perceived Exertion (RPE) were obtained 10-to-30 min after each session
using Borg’s CR-10 scale.19 The RPE was derived by asking each player “How hard was
your session?” with 1 being ‘very, very easy’ and 10 being ‘maximal’ exertion. Players were
“Relationships Between Internal and External Training Load in Team Sport Athletes: Evidence for an Individualised
Approach” by Bartlett JD et al.
International Journal of Sports Physiology and Performance
© 2016 Human Kinetics, Inc.
fully familiarized with the CR1-10 Borg scale prior to commencement of the study. While
some studies have used the product of RPE and duration to form s-RPE, and others have used
both s-RPE TL and RPE alone, for this study RPE was used in isolation.
The players’ physical activity during each training session was monitored using a 10
Hz portable global positioning system (GPS) (Optimeye S5, Catapult Sports. Melbourne).
The devices were placed on the upper back of each player with an appropriate harness and
activated 30 min prior to training commencement so as to allow for acquisition of >8
satellites. If data was collected by fewer than 8 satellites the data was discarded. Players used
the same unit for each training session to decrease measurement error.10 Each players session
duration (min), session distance (m), high-speed running (HSR; >14.4 km/h),20 percentage of
HSR as a proportion of distance covered (HSR%) and session distance per minute (m.min-1)
were calculated for each individual training session. PlayerLoad™ was collected through tri-
axial accelerometers [where the unit of measurement represents the square root of the sum of
the squared instantaneous rate of change in acceleration in the X, Y and Z axes divided by
10021], therefore taking into account player collisions and step impacts during running. The
validity and reliability of measuring team sport movement demands via GPS has been shown
previously.10 Data was downloaded and analysed using specialist GPS software (Openfield,
Catapult Innovations, Australia) before being transferred to a custom built Microsoft Excel
spreadsheet for further analysis.
Prior to the main analyses, a Spearman’s rank correlation coefficient matrix was
constructed to assess the strength of the associations between each of the six GPS load
variables and RPE. The following criteria were followed in order to interpret the magnitude
of correlations: <0.1 trivial, 0.1 to 0.3 small, 0.3 to 0.5 moderate, 0.5 to 0.7 large, 0.7 to 0.9
very large, and 0.9 to 1.0 almost perfect.22 Results showed that session duration (ρ = 0.95, P
<0.001) and PlayerLoad™ (PL) (ρ = 0.98, P <0.001) showed collinearity with session
“Relationships Between Internal and External Training Load in Team Sport Athletes: Evidence for an Individualised
Approach” by Bartlett JD et al.
International Journal of Sports Physiology and Performance
© 2016 Human Kinetics, Inc.
distance. Therefore, session distance was retained for all other analyses so as to be able to
compare with previous literature.
Generalised estimating equations (GEE) models were constructed to determine
whether the RPE response of each participant could be predicted from the external load
metrics. For all GEE models a Gaussian distribution was assumed for the response variable
and an exchangeable correlation structure used. For the first model, all 2711 instances
recorded by the participant group were included. The RPE predictions for each instance were
then obtained and compared with the actual participant responses (predicted vs actual). The
root mean square error (RMSE)23 of these predictions was calculated for both the group and
each player in order to assess the accuracy of the model. Next the data file was split by player
in order to develop an individual GEE model for each. Again, RPE predictions were output
for all 2711 instances and each player individually with RMSE used as a measure of model
accuracy.
For the artificial neural network (ANN), models were constructed using the same data
format as the GEE. RMSE values were again obtained for all models, with the influence of
each of the four variables in predicting RPE represented via importance plots. Importance
plots are expressed in arbitrary, non-directional units and displayed in both normalised (0-
100%) and relative (0.0-1.0) formats. The higher the value of the external load metric in the
plot, the stronger influence it contributes to the prediction of RPE.
Following this, four separate Spearman’s correlation coefficient matrices were
constructed using the RPE predictions from each of the four models and multiple contextual
variables. These included the actual mean player RPE per session, the number of sessions
undertaken by each player, and the player age.
“Relationships Between Internal and External Training Load in Team Sport Athletes: Evidence for an Individualised
Approach” by Bartlett JD et al.
International Journal of Sports Physiology and Performance
© 2016 Human Kinetics, Inc.
Results
The squad mean RPE across all 2711 training observations was 5.26 2.21 a.u.
Descriptive statistics for other load variables were as follows: session duration was 59 ±25
min, session distance was 6389 ±3315 m, HSR was 1631 ±1222 m, session distance per
minute was 106 ±23 m·min-1 and HSR% was 23 ±10 %.
Correlations between GPS load variables and RPE were moderate in magnitude for
HSR% (ρ = 0.40 [95% Confidence interval (CI) = 0.37 – 0.43]; P <0.001) and m·min-1 (ρ =
0.49 [95% CI = 0.46 – 0.52]; P <0.001), and large for HSR (ρ = 0.69 [95% CI = 0.67 – 0.71];
P <0.001) and session distance (ρ = 0.77 [95% CI = 0.75 – 0.79]; P <0.001).
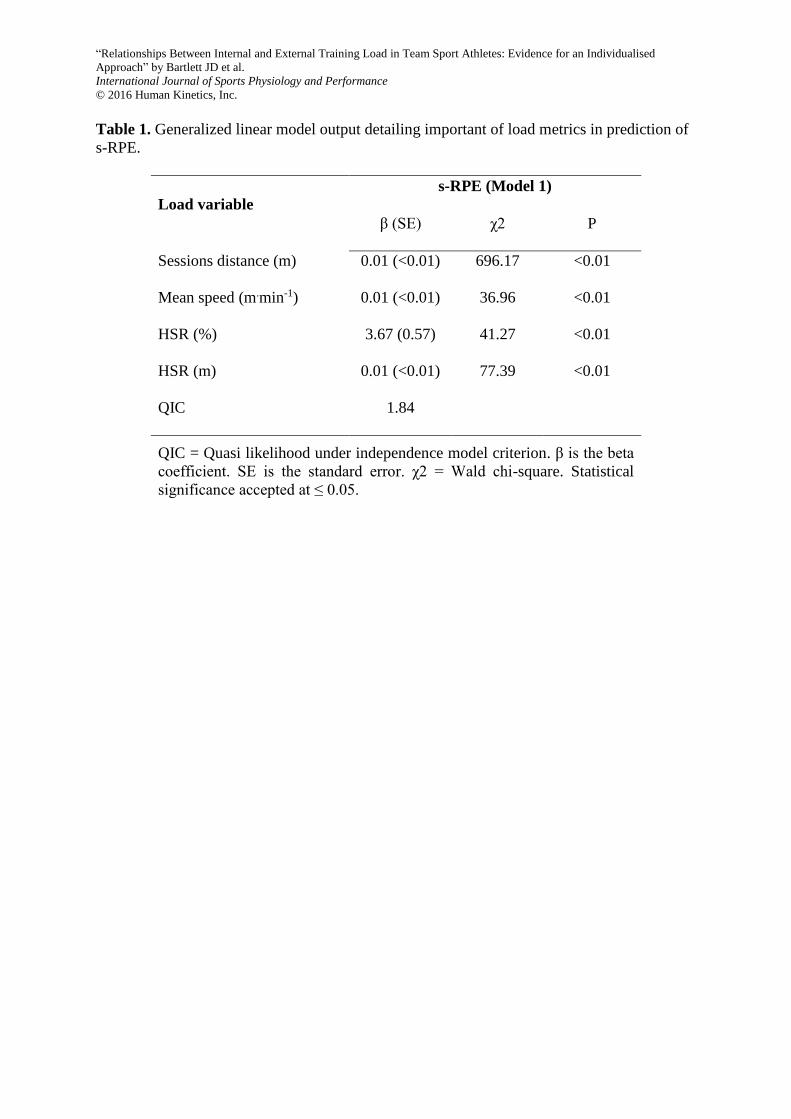
Results from the group GEE model showed that all four load variables significantly
contributed to predicting RPE (P <0.05) (Table 1). Specifically, session distance was the most
influential of the four variables. The group GEE resulted in a prediction error (RMSE) of
1.85 ±0.49. Results from the individual GEE’s (models not shown) revealed a minor
improvement in accuracy comparative to the first model (RMSE =1.58 ±0.41).
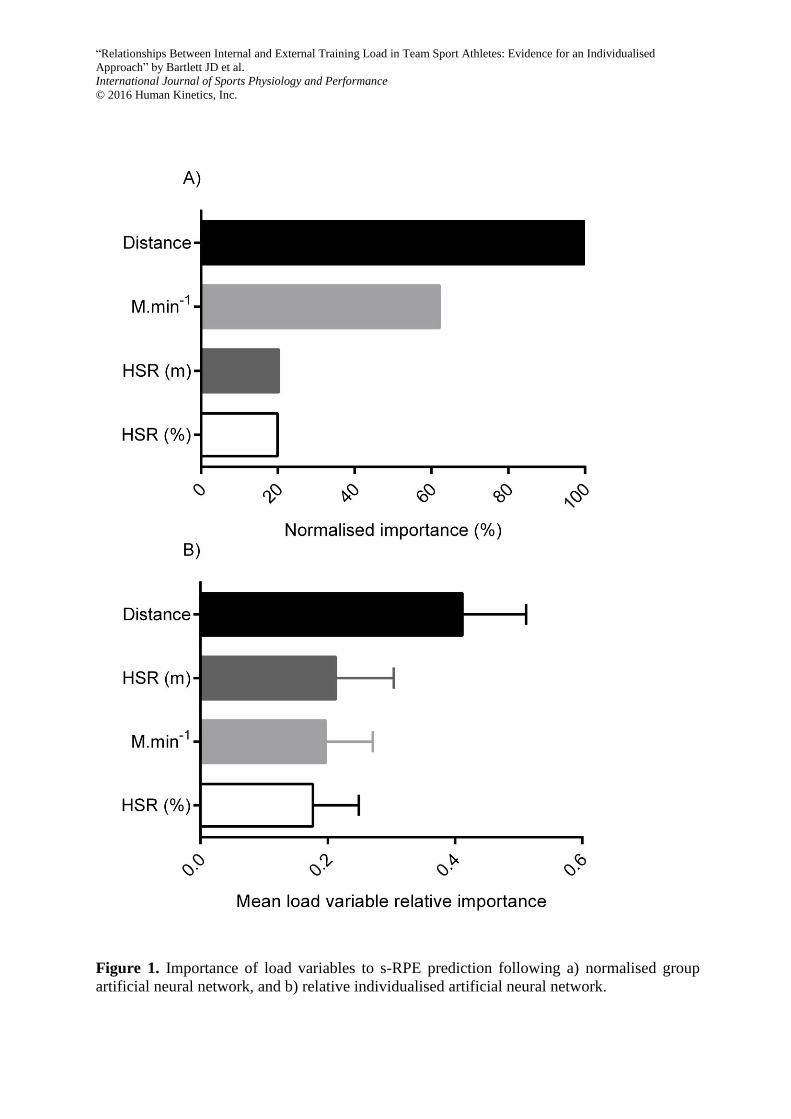
Results from the group ANN are shown in Figure 1a. An importance plot revealed
session distance as the strongest predictor of RPE (relative importance = 0.494), followed by
m·min-1. The remaining two variables both showed relative importance values of lower than
0.1. Model prediction error was lower than both GEE models with an RMSE of 1.42 ±0.44.
For the individual player ANN’s, a further reduction in error was noted (1.24 ±0.41). Mean
relative importance of each load variable across all 41 player models is shown in Figure 1b,
with results showing session distance again the main predictor of RPE.
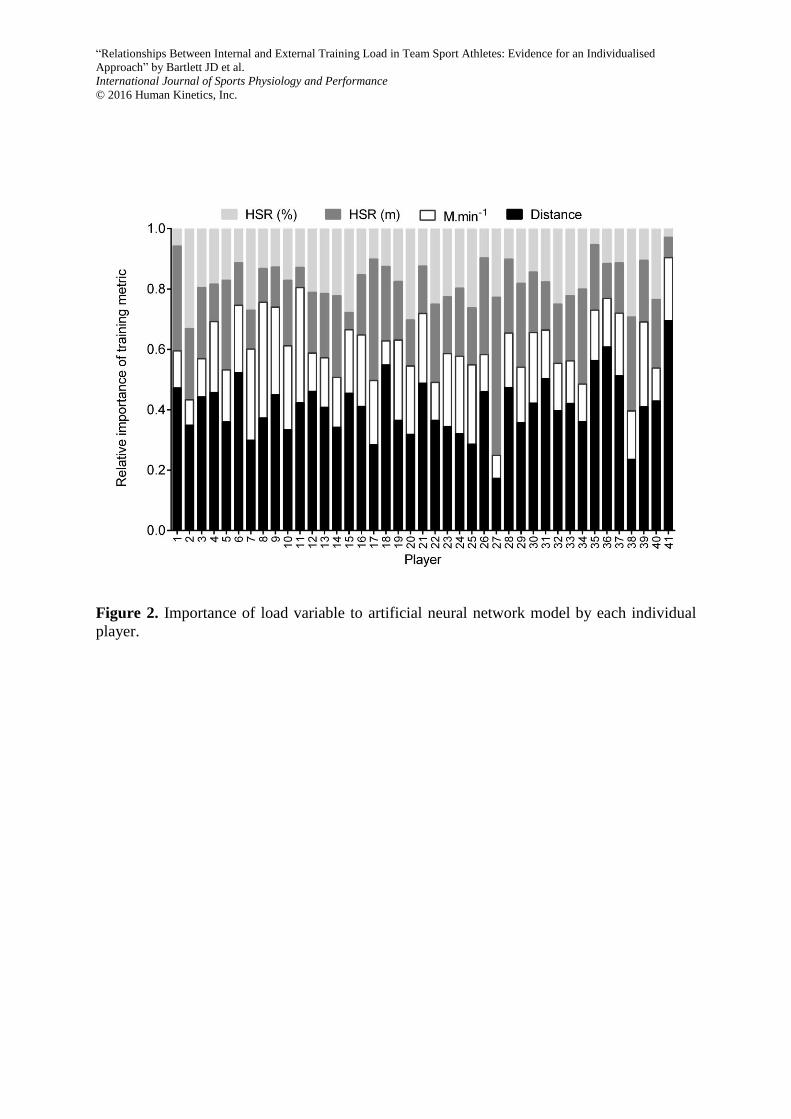
Figure 2 represents the breakdown of each load variable’s relative importance to RPE
prediction for each player. Results show that session distance was the strongest predictor of
RPE in 36 of the 41 players. Just two players (#7 and #8) demonstrated m·min-1 as more
influential than session distance in predicting RPE, whilst a further two (#17 and #27) and
“Relationships Between Internal and External Training Load in Team Sport Athletes: Evidence for an Individualised
Approach” by Bartlett JD et al.
International Journal of Sports Physiology and Performance
© 2016 Human Kinetics, Inc.
one (player 38) demonstrated HSR (m) and HSR (%) as more predictive of RPE,
respectively.
For all four models, small to trivial negative correlations between actual RPE and the
magnitude of prediction error were noted (ρ = -0.22 to -0.07). Similar relationships occurred
for predicted RPE and age (ρ = -0.22 to -0.27). Similarly, there were trivial to small
associations between prediction error of the models and the number of sessions recorded for
each participant (ρ = -0.07 to 0.13).
Discussion
The first aim of this study was to quantify the relationships between RPE and GPS
training load variables in professional Australian Rules Footballers. Secondly, we aimed to
compare the accuracy of separate linear and non-linear (i.e. machine learning) analyses to
predict RPE, using both pooled group and individual athlete data. This study found that,
independent of analysis approach, distance covered each session is most strongly associated
with RPE. Moreover, this study demonstrates lower error in non-linear analysis approaches
when predicting RPE response, therefore, facilitating greater accuracy for prescription and
evaluation of individualised training loads.
The use of RPE as a global measure of training load has become a common entity in
team sports owing to its low cost, ease of implementation and association with a range of
intensity and volume related training parameters9. Indeed, in soccer,7 AFL12, 24 and Rugby
League,8 a variety of load variables, such as distance covered, high-speed running, mean
speed (m·min-1), accelerations and PlayerLoadTM have all been identified to influence RPE
load. Consistent with previous studies, this study shows session distance as the load variable
most strongly associated with RPE. Furthermore, from the initial correlation matrix, this
study identified intensity related parameters (high-speed running, m·min-1 and HSR%) as
“Relationships Between Internal and External Training Load in Team Sport Athletes: Evidence for an Individualised
Approach” by Bartlett JD et al.
International Journal of Sports Physiology and Performance
© 2016 Human Kinetics, Inc.
important in the rating of perceived exertion of a session. However, this work builds on
previous findings through the machine learning approach used, by identifying the load
variables responsible for determining RPE in each individual player. In this context, 87% of
the squad demonstrated session distance as most important in determining RPE, whereas,
m·min-1 was more influential in two players whilst three players determined HSR and HSR%
as more important to their RPE. This is vital information for the practitioner as it may have
relevance for live monitoring of main team based training sessions and/or specific players in
varying return to play rehab models where certain training targets are planned.
The model accuracy for group and individualised GEE performed worse than the
group ANN, with the individual ANN demonstrating the best performance of all models.
Furthermore, with the GEE, the lower the RPE, the greater the overestimation, and the higher
the RPE the greater the underestimation. As many machine learning approaches are able to
take into consideration the between- and within-individual non-linearity inherent in many
datasets, this was not surprising. Specific to ANN’s, by incorporating hidden layers within
the regression structure the variable within-player response to training load can be accounted
for. This places the technique at a distinct advantage over traditional regression approaches
that do not possess this structure.
In the context of team-sport athletes, RPE is beneficial as it provides information
about how the player perceived a particular session. In this sense, it seems plausible that each
player’s responses are considered specific to them. Despite previous data showing
correlations between RPE and various load variables, this study shows that RPE is not linear
in its occurrence suggesting inconsistency in RPE reporting. As such, it is important that each
player is treated individually such that training responses are considered in the context of
previous, current and future loading.1-4 Another consideration for the inconsistency in RPE
reporting might be factors associated with team characteristics. Indeed, Gallo et al.12 reported
“Relationships Between Internal and External Training Load in Team Sport Athletes: Evidence for an Individualised
Approach” by Bartlett JD et al.
International Journal of Sports Physiology and Performance
© 2016 Human Kinetics, Inc.
that RPE load is influenced by position, playing experience and time-trial performance. In the
sense that perceived exertion for a given session may get easier with longer training history,
this study reports trivial to small negative associations between age and predicted RPE,
indicating it may be easier to predict RPE as the players become more experienced.
Unfortunately, this study was unable to quantify the influence of ‘physical fitness’ on IL:EL
relationships due to the lack of a full testing dataset. That said, it cannot be discounted that
physical fitness plays a role in reported perceived exertion of a given session, especially
given that time-trial performance explains 71% of the variance in s-RPE training load.12
Prior to the main analyses, the correlation matrix identified near perfect relationships
between session distance and session duration and session distance and PlayerLoadTM.
Combined with preliminary analyses, where there were no improvements in prediction with
these variables in the models, we removed duration and PlayerLoadTM from the modelling
processes. This is in contrast to previous studies7, 8 where the number of impacts, number of
accelerations and total body load [obtained via the square root of the sum of the squared
instantaneous rate of change in acceleration in each of the 3 vectors (x-, y-, and z-axes)] were
found to be important to a player’s RPE. Possible reasons for this may lie within the pitch
dimensions that AFL (135-185 x 110-155 m) is played compared to soccer (100-110 x 64-75
m) and rugby (100 x 70 m). Indeed, soccer training involves a range of different small-sided
game based training drills where the predominant movement patterns pertain to acceleration-
based movements.25 Likewise, rugby-based training is associated with short distance
acceleration movements combined with a high number of impacts.26 In contrast, AFL training
is characterised by higher amounts of high-speed running,27, 28 supposedly due to the increase
in pitch-size. When taken together, specific movement demands may influence RPE when
comparing between sports.
“Relationships Between Internal and External Training Load in Team Sport Athletes: Evidence for an Individualised
Approach” by Bartlett JD et al.
International Journal of Sports Physiology and Performance
© 2016 Human Kinetics, Inc.
Although there is increasing research into uncovering relationships between EL and
IL, there has been a lack of information pertaining to which individual EL variables are
predictive of RPE within each individual athlete. Often, TL monitoring focuses on post-
evaluation of the response to a given session or block of training29 without prior knowledge
of how they may respond. In accordance with typical periodisation models, each athlete
likely has specific targets to meet for each individual session. By knowing how a given
athlete will respond to a bout will be beneficial for planning of subsequent sessions,
especially when high load training days are planned. As such, these data provide a platform
for researchers to further build upon and understand training load prescription and monitoring
at a more granular level in team-sport athletes.
Practical Application
These data are important for the practitioner as they provide the first evidence of
between athlete differences (within the same team) in load metrics important in determining a
self-perceived rating of effort. Recent attempts have been made to combine internal and
external load so as to arrive at a single load metric defining a given session. However, this
study shows that this should be performed on an individual basis, so as to capture what is
relevant for each player. Indeed, for a player whose total distance is their most important
descriptor of internal load, in another player, it may be m·min-1 or HSR. This is particularly
relevant for training prescription and evaluation. Moreover, training load variables are likely
specific to the sport and may be relative to the pitch size dimensions demonstrating that cross
sport comparisons are difficult.
Conclusion
This study is the first to adopt machine learning techniques in TL monitoring in team
sports. We conclude that this approach is beneficial in team-sport settings as it has capacity in
“Relationships Between Internal and External Training Load in Team Sport Athletes: Evidence for an Individualised
Approach” by Bartlett JD et al.
International Journal of Sports Physiology and Performance
© 2016 Human Kinetics, Inc.
identifying which external load variables are important to each individual players perceptual
session rating. From a practical standpoint this has implications for more precise training
prescription and evaluation. Given the usefulness of training monitoring for reducing injury
risk and maximising performance, better informed decisions can then be made for each
individual athlete.
Acknowledgments
We acknowledge all the players and staff of Western Bulldogs FC who facilitated this study
who without them this would not be possible.
“Relationships Between Internal and External Training Load in Team Sport Athletes: Evidence for an Individualised
Approach” by Bartlett JD et al.
International Journal of Sports Physiology and Performance
© 2016 Human Kinetics, Inc.
References
1. Hulin BT, Gabbett TJ, Lawson DW, Caputi P, Sampson JA. The acute:chronic
workload ratio predicts injury: high chronic workload may decrease injury risk in elite
rugby league players. Br J Sports Med. 2015.
2. Rogalski B, Dawson B, Heasman J, Gabbett TJ. Training and game loads and injury
risk in elite Australian footballers. J Sci Med Sport. 2013; 16(6):499-503.
3. Colby MJ, Dawson B, Heasman J, Rogalski B, Gabbett TJ. Accelerometer and GPS-
derived running loads and injury risk in elite Australian footballers. J Strength Cond
Res. 2014; 28(8):2244-2252.
4. Gabbett TJ, Whyte DG, Hartwig TB, Wescombe H, Naughton GA. The relationship
between workloads, physical performance, injury and illness in adolescent male
football players. Sports Med. 2014; 44(7):989-1003.
5. Borresen J, Lambert MI. Quantifying training load: a comparison of subjective and
objective methods. Int J Sports Physiol Perform. 2008; 3(1):16-30.
6. Wallace LK, Slattery KM, Coutts AJ. A comparison of methods for quantifying
training load: relationships between modelled and actual training responses. Eur J
Appl Physiol. 2014; 114(1):11-20.
7. Gaudino P, Iaia FM, Strudwick AJ, et al. Factors Influencing Perception of Effort
(Session Rating of Perceived Exertion) During Elite Soccer Training. Int J Sports
Physiol Perform. 2015; 10(7):860-864.
8. Lovell TW, Sirotic AC, Impellizzeri FM, Coutts AJ. Factors affecting perception of
effort (session rating of perceived exertion) during rugby league training. Int J Sports
Physiol Perform. 2013; 8(1):62-69.
9. Scott TJ, Black CR, Quinn J, Coutts AJ. Validity and reliability of the session-RPE
method for quantifying training in Australian football: a comparison of the CR10 and
CR100 scales. J Strength Cond Res. 2013; 27(1):270-276.
10. Johnston RJ, Watsford ML, Kelly SJ, Pine MJ, Spurrs RW. Validity and interunit
reliability of 10 Hz and 15 Hz GPS units for assessing athlete movement demands. J
Strength Cond Res. 2014; 28(6):1649-1655.
11. Casamichana D, Castellano J, Calleja-Gonzalez J, San Roman J, Castagna C.
Relationship between indicators of training load in soccer players. J Strength Cond
Res. 2013; 27(2):369-374.
12. Gallo T, Cormack S, Gabbett T, Williams M, Lorenzen C. Characteristics impacting
on session rating of perceived exertion training load in Australian footballers. J Sports
Sci. 2015; 33(5):467-475.
13. Bouchard C, Rankinen T. Individual differences in response to regular physical
activity. Med Sci Sports Exerc. 2001; 33(6 Suppl):S446-451; discussion S452-443.
“Relationships Between Internal and External Training Load in Team Sport Athletes: Evidence for an Individualised
Approach” by Bartlett JD et al.
International Journal of Sports Physiology and Performance
© 2016 Human Kinetics, Inc.
14. Thorpe RT, Strudwick AJ, Buchheit M, Atkinson G, Drust B, Gregson W. Monitoring
Fatigue During the In-Season Competitive Phase in Elite Soccer Players. Int J Sports
Physiol Perform. 2015.
15. Pfeiffer M, Hohmann A. Applications of neural networks in training science. Hum
Mov Sci. 2012; 31(2):344-359.
16. De Vries SI, Garre FG, Engbers LH, Hildebrandt VH, Van Buuren S. Evaluation of
neural networks to identify types of activity using accelerometers. Med Sci Sports
Exerc. 2011; 43(1):101-107.
17. Dutt-Mazumder A, Button C, Robins A, Bartlett R. Neural network modelling and
dynamical system theory: are they relevant to study the governing dynamics of
association football players? Sports Med. 2011; 41(12):1003-1017.
18. Robertson S, Back N, Bartlett JD. Explaining match outcome in elite Australian Rules
football using team performance indicators. J Sports Sci. 2015:1-8.
19. Borg G, Ljunggren G, Ceci R. The increase of perceived exertion, aches and pain in
the legs, heart rate and blood lactate during exercise on a bicycle ergometer. Eur J
Appl Physiol Occup Physiol. 1985; 54(4):343-349.
20. Coutts AJ, Quinn J, Hocking J, Castagna C, Rampinini E. Match running performance
in elite Australian Rules Football. J Sci Med Sport. 2010; 13(5):543-548.
21. Barrett S, Midgley A, Lovell R. PlayerLoad: reliability, convergent validity, and
influence of unit position during treadmill running. Int J Sports Physiol Perform.
2014; 9(6):945-952.
22. Hopkins WG, Marshall SW, Batterham AM, Hanin J. Progressive statistics for studies
in sports medicine and exercise science. Med Sci Sports Exerc. 2009; 41(1):3-13.
23. Chai T, Draxler RR. Root mean square error (RMSE) or mean absolute error (MAE)?
– Arguments against avoiding RMSE in the literature. Geosci. Model Dev. 2014;
7(3):1247-1250.
24. Weston M, Siegler J, Bahnert A, McBrien J, Lovell R. The application of differential
ratings of perceived exertion to Australian Football League matches. J Sci Med Sport.
2015; 18(6):704-708.
25. Gaudino P, Alberti G, Iaia FM. Estimated metabolic and mechanical demands during
different small-sided games in elite soccer players. Hum Mov Sci. 2014; 36:123-133.
26. Bradley WJ, Cavanagh BP, Douglas W, Donovan TF, Morton JP, Close GL.
Quantification of training load, energy intake, and physiological adaptations during a
rugby preseason: a case study from an elite European rugby union squad. J Strength
Cond Res. 2015; 29(2):534-544.
27. Loader J, Montgomery P, Williams M, Lorenzen C, Kemp J. Classifying training
drills based on movement demands in Australian football. International Journal of
Sports Science and Coaching. 2012; 7(1):57-68.

“Relationships Between Internal and External Training Load in Team Sport Athletes: Evidence for an Individualised
Approach” by Bartlett JD et al.
International Journal of Sports Physiology and Performance
© 2016 Human Kinetics, Inc.
28. Ritchie D, Hopkins W, Buchheit M, Cordy J, Bartlett J. Quantification of Training
and Competition Load Across a Season in an Elite Australian Football Club. Int J
Sports Physiol Perform. 2015.
29. Hecksteden A, Kraushaar J, Scharhag-Rosenberger F, Theisen D, Senn S, Meyer T.
Individual response to exercise training - a statistical perspective. J Appl Physiol
(1985). 2015; 118(12):1450-1459.
“Relationships Between Internal and External Training Load in Team Sport Athletes: Evidence for an Individualised
Approach” by Bartlett JD et al.
International Journal of Sports Physiology and Performance
© 2016 Human Kinetics, Inc.
Figure 1. Importance of load variables to s-RPE prediction following a) normalised group
artificial neural network, and b) relative individualised artificial neural network.
“Relationships Between Internal and External Training Load in Team Sport Athletes: Evidence for an Individualised
Approach” by Bartlett JD et al.
International Journal of Sports Physiology and Performance
© 2016 Human Kinetics, Inc.
Figure 2. Importance of load variable to artificial neural network model by each individual
player.
“Relationships Between Internal and External Training Load in Team Sport Athletes: Evidence for an Individualised
Approach” by Bartlett JD et al.
International Journal of Sports Physiology and Performance
© 2016 Human Kinetics, Inc.
Table 1. Generalized linear model output detailing important of load metrics in prediction of
s-RPE.
Load variable
s-RPE (Model 1)
β (SE) χ2 P
Sessions distance (m) 0.01 (<0.01) 696.17 <0.01
Mean speed (m.min-1) 0.01 (<0.01) 36.96 <0.01
HSR (%) 3.67 (0.57) 41.27 <0.01
HSR (m) 0.01 (<0.01) 77.39 <0.01
QIC 1.84
QIC = Quasi likelihood under independence model criterion. β is the beta
coefficient. SE is the standard error. χ2 = Wald chi-square. Statistical
significance accepted at ≤ 0.05.


![[XLS] · Web view0781 THOROUGHFARE BOND 0783 STREET BOND 0790 CUMULATIVE BRIDGE 0791 CUMULATIVE BRIDGE & STREET 0792](https://img.pdfslide.us/doc/110x75/5b025b757f8b9a952f8fc77b/xls-view0781-thoroughfare-bond-0783-street-bond-0790-cumulative-bridge-0791-cumulative.jpg)


![Tel.03-6805-0791 Fax.03-6805-0793 e-mail: info ... · Tel.03-6805-0791 Fax.03-6805-0793 e-mail: info@japancreation.com [Organizer] Japan Fashion Week Organization [Contact] JFW Textile](https://img.pdfslide.us/doc/110x75/5f76975dd3051467a4665d46/tel03-6805-0791-fax03-6805-0793-e-mail-info-tel03-6805-0791-fax03-6805-0793.jpg)