Embed Size (px)
Citation preview

Agenda Item No. 7
Summary of Local Government Ombudsman (LGO) cases where the outcome was upheld and fault was found.
Table of contents:-
1. Section one – details of LGO cases received 2013/2014 2. Section two – three appendices; the LGO 2013/14 annual letter,
the LGO explanatory letter and an email from the LGO in response to my request for detailed case information
3. Section three – statement about new complaints management arrangements for BCC
Section one – details of LGO cases received 2013/2014
NOTE: None of the following cases resulted in the LGO issuing Bristol City Council with a ‘report’. A report is the most serious finding the LGO can find, which has serious reputational and financial implications.
1. Planning complaint - £500 local settlement – no maladministration found. LGO “The Council failed to demonstrate that it had special regard to the impact of a development on a listed building and its setting. The Council has agreed a financial remedy to acknowledge the complainant’s time and trouble in pursuing these matters and, for this reason I am satisfied with the Council’s action.”
2. Planning complaint – maladministration and injustice found. Apology given. LGO “The Council incorrectly validated a planning application submitted without the correct certificate of ownership causing Miss X avoidable frustration.”

3. Planning application complaint – maladministration and injustice found. £300 settlement and apology for distress. LGO “Mr A complains the Council failed to properly consider planning application from his neighbour. There was fault by the Council which has caused Mr A injustice.”
4. Planning application process – maladministration and injustice found. Apology offered no further action. LGO “ The Ombudsman found no fault in the way the Council determined a planning application and in its decision on a planning enforcement complaint. The Council remedied the injustice caused by the way it dealt with a complaint about the matter with an apology. “
5. Planning application process – Apology given and assurance that future work with school is being undertaken. LGO “Mr S was caused an avoidable sense of grievance and frustration by the Council’s failure to ensure compliance with planning conditions affecting a school near his home.”
6. Planning – complainant caused distress, apology given for distress and inconvenience caused. LGO – “Fault in the Council’s handling of a planning application denied Ms X denied her an opportunity to comment on her neighbour’s proposals and caused her avoidable distress and inconvenience. I recommended the Council take action to remedy that injustice.”
7. Planning - complainant caused distress, apology given for distress and inconvenience caused. LGO – “The complaint is that the Council failed to notify the complainants of the date on which the Development Control Committee was due to consider an application for development of land adjacent to residential property they own. The complainants say they had a better chance of achieving a different outcome if they had had an opportunity to speak to the Members direct. The

Council was at fault for not notifying the complainants of the date of the meeting but I do not find either evidence or likelihood of harm as a result. My provisional view is that no worthwhile outcome can possibly be achieved by pursuing the complaint further.”
8. Benefits complaint – £150 compensation paid for council’s delay, which caused complainant the opportunity to appeal against an overpayment resulting in rent arrears. LGO – “Mr A complains the Council’s mishandling of his housing benefit claim, and its subsequent unreasonable delay in dealing with his appeal against an overpayment, led to his eviction for rent arrears. It also failed to return his deposit bond of £650 paid to his landlord. There has been fault by the Council and it has agreed to pay Mr A £150 in recognition of this.”
9. Legal complaint – complaint over many years regarding a housing management company’s ability to operate. Substantial legal costs accrued over many years, the council agreed to contribute £14,000 towards this. LGO – “ The Council accepts it was at fault for issuing a letter which would have seriously affected a property management company being able to operate. It is recommended the Council pays an amount towards the legal expenses the company incurred in defending its position.”
10. Neighbourhood complaint about not lowering the height of a hedge. The council has now done this, apologised and paid £100 compensation. LGO – “Mr A complains the Council based its decision not to take action to reduce the height of a hedge opposite his home on incorrect information and it delayed in responding to his complaint. There was fault by the Council and the complaint will be resolved by the Council cutting the hedge and making a £100 payment to Mr A.”

11. Parking charges complaint – maladministration and injustice found. Refunded penalty charge and paid compensation of £200. LGO – “Mr X complained the Council had issued two parking penalty notices for the same offence and failed to prevent bailiff action. The Ombudsman has found fault with the Council’s handling of Mr X’s penalty charge notices and injustice resulting from that fault. The Ombudsman recommends a financial remedy to redress the injustice to Mr X.”
12. Council Tax complaint. Handling of recovery charges incurred, council agreed to pay these charges and apologise. LGO – “ Ms X says the Council is at fault in its handling of her council tax account. I have found some evidence of fault. The Council has agreed to repay Ms X the recovery charges she incurred between 30 January and 8 April 2014. It has also agreed to apologise to her and clarify the details of direct debit arrangements for her council tax account. I consider this suitably addresses the injustice cause to her.”
13. Noise Pollution complaint – council found guilty of delaying process to resolve complaint, although no additional maladministration or injustice. Apology given no other action. LGO – “ Ms A complains the Council has failed to take adequate action to address noise nuisance caused by her neighbours. While there has been some delay by the Council, there are no grounds on which to base any further investigation of the complaint by the Ombudsman.”
14. Children and Young People’s Services complaint. The Council was found at fault for not making it clear when it issued a statement that if the parent could not meet the child’s travel costs, the parent could challenge this by way of appeal to tribunal, rather than applying for travel to school assistance.

15. Children and Young People’s Services complaints. The Council was found at fault for failing a child in education causing distress and loss of learning opportunity. The Council should pay £500 compensation plus extra educational provision to the value of £3,500.
Section two – three appendices;-
Appendix A - the new look annual LGO letter including a record of upheld Bristol cases in 2012 v 2014
Appendix B – a statement letter from the LGO explaining the changes they’ve made to their annual letter
Appendix C – a copy of an email from the LGO in response to my request for details of cases
Section three
Bristol City Council is improving its complaints handling arrangements and will deliver the following changes:-
• Improve the overall customer experience with a simplified end to end process
• Introduce common processes for managing complaints and feedback and Freedom of Information (FOI) requests
• Establish a single Customer Relations Team to deliver this • Introduce a common technology platform for all these
processes • Proactive publication of FOI responses and Complaints Data • Use complaints data to inform service improvement across the
council • Move from a three stage to a two stage process for non-
statutory complaints

• Provide an updated online user interface with Information, Advice and Guidance
• Provide the ability to log and track a complaint online where the requestor has a citizen account
• Provide a mechanism for members of the public who do not have access to email to continue to make Complaints and Enquiries
• Introduce improved formal reporting to identify key issues / areas for development
• Introduce method for proactively publishing responses to FOI requests

Decisions made (by local authority)
Authority Advice given
Closed after initial
enquiries Incomplete/invalid
Referred back for
local resolution Upheld Not upheld % upheld* Total
Adur DC 0 4 0 5 6 0 100.0% 15Allerdale BC 0 3 1 5 1 5 16.7% 15Amber Valley BC 0 6 3 7 3 7 30.0% 26Arun DC 0 10 2 9 2 2 50.0% 25Ashfield DC 3 10 1 4 3 4 42.9% 25Ashford BC 1 12 1 7 3 3 50.0% 27Aylesbury Vale DC 0 13 1 13 0 8 0.0% 35Babergh DC 1 2 0 3 0 5 0.0% 11Barking & Dagenham 14 36 3 48 11 9 55.0% 121Barnet LB 14 67 3 79 14 10 58.3% 187Barnsley MBC 2 18 6 29 5 14 26.3% 74Barrow BC 3 6 0 5 2 2 50.0% 18Basildon BC 7 8 1 21 1 6 14.3% 44Basingstoke & Deane 1 6 2 5 0 2 0.0% 16Bassetlaw DC 2 8 0 6 3 4 42.9% 23Bath & NE Somerset C 2 12 1 14 1 10 9.1% 40Bedford BC 1 10 4 18 6 4 60.0% 43Bexley LB 0 28 2 38 10 12 45.5% 90Birmingham City C 52 131 22 254 82 43 65.6% 584Blaby DC 0 8 0 1 1 0 100.0% 10Blackburn w/Darwen 2 11 0 21 4 4 50.0% 42Blackpool BC 4 11 2 25 11 5 68.8% 58Bolsover DC 2 6 1 9 1 1 50.0% 20Bolton MBC 2 28 4 36 9 12 42.9% 91Boston BC 0 4 0 4 0 1 0.0% 9Bournemouth BC 4 10 3 29 6 12 33.3% 64Bracknell Forest C 2 9 1 10 0 2 0.0% 24Braintree DC 0 5 1 7 2 4 33.3% 19Breckland DC 1 4 0 7 3 2 60.0% 17Brent LB 10 48 6 77 11 15 42.3% 167

Brentwood BC 2 2 1 10 2 3 40.0% 20Brighton & Hove City 4 33 4 53 12 17 41.4% 123Bristol City C 2014 15 55 4 46 24 16 60.0% 160Bristol City C 2012 10 5 7 9 26 42 38.2% 99Broadland DC 0 7 0 6 4 5 44.4% 22Broads Authority 0 3 0 0 0 0 3Bromley LB 2 42 3 74 14 20 41.2% 155Bromsgrove DC 0 8 0 7 1 4 20.0% 20Broxbourne BC 0 3 0 7 3 0 100.0% 13Broxtowe BC 1 6 1 6 4 2 66.7% 20Buckinghamshire CC 2 56 11 22 7 6 53.8% 104Burnley BC 0 7 0 8 0 2 0.0% 17Bury MBC 0 16 1 16 8 7 53.3% 48Calderdale MBC 3 19 3 19 8 8 50.0% 60Cambridge City C 2 3 1 5 2 2 50.0% 15Cambridgeshire CC 1 15 5 24 9 20 31.0% 74Camden LB 24 66 2 37 20 16 55.6% 165Cannock Chase DC 0 2 0 8 0 1 0.0% 11Canterbury City C 2 6 0 22 1 4 20.0% 35Carlisle City C 0 2 0 0 0 0 2Castle Point BC 1 2 0 3 4 5 44.4% 15Central Bedfordshire 2 23 3 28 4 13 23.5% 73Charnwood BC 2 11 0 9 2 2 50.0% 26Chelmsford City C 0 6 1 7 1 4 20.0% 19Cheltenham BC 1 8 0 6 4 5 44.4% 24Cherwell DC 0 7 0 8 2 4 33.3% 21Cheshire East C 3 37 3 50 17 21 44.7% 131Cheshire W & Chester 1 34 2 39 13 17 43.3% 106Chesterfield BC 0 7 0 7 0 3 0.0% 17Chichester DC 0 8 0 6 1 1 50.0% 16Chiltern DC 0 4 0 5 0 1 0.0% 10Chorley BC 0 2 0 3 1 2 33.3% 8Christchurch BC 0 3 0 6 0 1 0.0% 10City of Bradford MDC 7 37 8 62 14 22 38.9% 150City of London 2 2 0 1 0 1 0.0% 6Colchester BC 4 6 1 8 2 2 50.0% 23Copeland BC 1 7 0 5 1 6 14.3% 20Corby BC 1 2 0 10 4 0 100.0% 17Cornwall Council 3 70 14 67 36 32 52.9% 222Cotswold DC 0 5 0 3 0 4 0.0% 12

County Durham C 6 69 3 48 25 26 49.0% 177Coventry City C 1 25 9 56 10 9 52.6% 110Craven DC 1 3 0 10 0 2 0.0% 16Crawley BC 1 6 1 8 2 4 33.3% 22Croydon LB 10 71 6 121 37 23 61.7% 268Cumbria CC 0 13 3 21 6 5 54.5% 48Dacorum BC 1 4 3 12 1 4 20.0% 25Darlington BC 0 6 2 7 3 5 37.5% 23Dartford BC 0 10 1 7 2 1 66.7% 21Dartmoor NPA 1 2 0 0 0 4 0.0% 7Daventry DC 2 2 0 7 3 4 42.9% 18Derby City C 2 34 1 25 9 10 47.4% 81Derbyshire CC 0 26 2 36 11 8 57.9% 83Derbyshire Dales DC 1 3 1 4 0 1 0.0% 10Devon CC 4 36 4 30 27 40 40.3% 141Doncaster MBC 5 33 1 33 12 10 54.5% 94Dorset CC 1 17 2 19 5 12 29.4% 56Dover DC 2 9 0 11 3 5 37.5% 30Dudley MBC 4 25 1 38 3 16 15.8% 87Ealing LB 12 63 6 86 39 21 65.0% 227East Cambs DC 1 3 0 8 0 2 0.0% 14East Devon DC 0 15 0 11 4 11 26.7% 41East Dorset DC 0 5 1 6 3 1 75.0% 16East Hampshire DC 0 7 0 0 1 3 25.0% 11East Herts DC 0 4 0 6 0 1 0.0% 11East Lindsey DC 0 11 0 14 1 10 9.1% 36East Northants C 1 7 1 3 1 2 33.3% 15East Riding of Yorks 3 29 1 40 10 15 40.0% 98East Staffs BC 0 5 1 3 0 3 0.0% 12East Sussex CC 1 33 6 31 19 21 47.5% 111Eastbourne BC 1 7 1 12 0 0 21Eastleigh BC 0 4 2 6 2 2 50.0% 16Eden DC 0 4 0 2 2 0 100.0% 8Elmbridge BC 0 7 1 17 2 3 40.0% 30Enfield LB 7 36 5 66 23 16 59.0% 153Epping Forest DC 4 5 2 10 0 1 0.0% 22Epsom & Ewell BC 0 8 1 6 3 3 50.0% 21Erewash BC 1 1 0 5 3 2 60.0% 12Essex CC 1 53 7 60 30 16 65.2% 167

Exeter City C 3 6 1 8 3 3 50.0% 24Fareham BC 0 6 0 4 0 3 0.0% 13Fenland DC 1 7 1 7 4 1 80.0% 21Forest Heath DC 0 2 0 1 1 1 50.0% 5Forest of Dean DC 0 2 0 8 0 2 0.0% 12Fylde BC 0 6 1 6 0 2 0.0% 15Gateshead MBC 10 14 3 24 9 9 50.0% 69Gedling BC 0 11 1 5 0 2 0.0% 19Gloucester City C 0 1 0 4 0 0 5Gloucestershire CC 0 18 0 30 7 15 31.8% 70Gosport BC 0 4 0 8 0 1 0.0% 13Gravesham BC 3 4 1 12 1 1 50.0% 22Great Yarmouth BC 2 1 0 9 1 1 50.0% 14Greenwich LB 16 33 6 45 14 11 56.0% 125Guildford BC 3 7 0 8 2 2 50.0% 22Hackney LB 24 47 9 67 31 6 83.8% 184Halton C 0 10 0 10 3 6 33.3% 29Hambleton DC 1 5 0 7 1 1 50.0% 15Hammersmith & Fulham 11 57 4 40 11 12 47.8% 135Hampshire CC 3 32 3 27 10 15 40.0% 90Harborough DC 0 4 0 5 4 5 44.4% 18Haringey LB 17 72 3 83 32 23 58.2% 230Harlow DC 2 4 0 7 1 2 33.3% 16Harrogate BC 1 6 0 8 3 0 100.0% 18Harrow LB 5 56 4 61 21 17 55.3% 164Hart DC 0 1 1 3 0 0 5Hartlepool BC 0 10 2 9 1 3 25.0% 25Hastings BC 0 9 1 8 1 2 33.3% 21Havant BC 0 2 0 5 1 1 50.0% 9Havering LB 6 30 4 60 11 10 52.4% 121Herefordshire C 0 33 3 25 13 9 59.1% 83Hertfordshire CC 1 42 5 44 11 5 68.8% 108Hertsmere BC 1 6 1 13 0 4 0.0% 25High Peak BC 2 5 0 7 2 3 40.0% 19Hillingdon LB 4 26 2 44 5 4 55.6% 85Hinckley & Bosworth BC 0 3 1 5 4 2 66.7% 15Horsham DC 0 7 1 8 5 1 83.3% 22Hounslow LB 8 48 3 100 19 15 55.9% 193Huntingdonshire DC 2 2 0 4 3 4 42.9% 15

Hyndburn BC 0 3 0 5 0 8 0.0% 16Ipswich BC 2 7 1 7 0 0 17Isle of Wight C 0 25 1 22 8 5 61.5% 61Isles of Scilly 0 1 0 2 0 0 3Islington LB 24 41 4 39 18 20 47.4% 146Kensington & Chelsea 1 18 4 33 4 14 22.2% 74Kent CC 1 57 12 44 36 41 46.8% 191Kettering BC 2 6 1 8 3 1 75.0% 21Kings Lynn & W Nor 1 4 0 6 1 0 100.0% 12Kingston upon Hull 3 29 2 36 7 11 38.9% 88Kingston upon Thames 5 21 2 26 8 6 57.1% 68Kirklees MBC 2 41 9 37 13 23 36.1% 125Knowsley MBC 1 12 0 10 4 5 44.4% 32Lake Distict NPA 3 2 5 3 62.5% 13Lambeth LB 41 95 13 104 51 34 60.0% 338Lancashire CC 1 31 8 63 19 41 31.7% 163Lancaster City C 1 9 0 7 3 3 50.0% 23Leeds City C 21 65 5 70 29 42 40.8% 232Leicester City C 6 49 8 25 15 15 50.0% 118Leicestershire CC 1 19 3 36 10 11 47.6% 80Lewes DC 1 3 0 9 1 0 100.0% 14Lewisham LB 8 32 7 62 15 10 60.0% 134Lichfield DC 1 2 1 4 0 2 0.0% 10Lincoln City C 2 5 1 4 2 1 66.7% 15Lincolnshire CC 1 31 3 28 11 18 37.9% 92Liverpool City C 2 50 4 92 21 13 61.8% 182Luton BC 2 31 5 32 6 3 66.7% 79Maidstone BC 0 10 1 5 3 0 100.0% 19Maldon DC 0 6 0 5 2 1 66.7% 14Malvern Hills DC 0 4 0 4 2 2 50.0% 12Manchester City C 8 83 11 78 16 23 41.0% 219Mansfield DC 3 8 0 6 0 3 0.0% 20Medway C 2 44 7 31 6 20 23.1% 110Melton BC 0 2 1 0 0 1 0.0% 4Mendip DC 0 11 4 27 4 3 57.1% 49Merton LB 1 27 4 49 18 11 62.1% 110Mid Devon DC 2 9 1 8 1 2 33.3% 23Mid Suffolk DC 3 5 1 9 1 4 20.0% 23Mid Sussex DC 0 7 0 11 3 1 75.0% 22

Middlesbrough BC 0 8 0 18 1 6 14.3% 33Milton Keynes C 5 19 3 32 6 6 50.0% 71Mole Valley DC 0 4 0 5 1 7 12.5% 17NE Derbyshire DC 0 7 0 5 1 3 25.0% 16New Forest DC 2 10 0 6 2 1 66.7% 21New Forest NPA 1 1 0 1 5 16.7% 8Newark & Sherwood DC 1 11 0 9 3 0 100.0% 24Newcastle City C 4 28 4 13 3 10 23.1% 62Newcastle-under-Lyme 2 8 1 5 5 3 62.5% 24Newham LB 19 90 8 133 28 21 57.1% 299Norfolk CC 1 29 2 23 6 10 37.5% 71North Devon DC 0 11 0 7 2 5 28.6% 25North Dorset DC 0 4 0 8 0 2 0.0% 14North East Lincs DC 1 15 1 24 2 8 20.0% 51North Herts DC 0 8 1 11 2 1 66.7% 23North Kesteven DC 0 5 0 9 1 0 100.0% 15North Lincolnshire C 1 11 3 17 5 4 55.6% 41North Norfolk DC 0 8 2 5 3 2 60.0% 20North Somerset C 0 23 2 16 9 13 40.9% 63North Tyneside MBC 6 21 1 23 3 6 33.3% 60North Warwicks BC 0 3 1 4 0 2 0.0% 10North York Moors NPA 0 0 0 1 0 1 0.0% 2North Yorks CC 0 24 4 24 22 13 62.9% 87Northampton BC 6 13 3 18 5 8 38.5% 53Northants CC 1 22 5 40 12 11 52.2% 91Northumberland C 2 20 0 25 8 8 50.0% 63Northumberland NPA 0 1 0 0 0 0 1Norwich City C 11 11 0 15 2 10 16.7% 49Nottingham City C 7 29 4 40 14 30 31.8% 124Notts CC 0 33 2 33 15 15 50.0% 98Nuneaton & Bedworth BC 5 9 0 6 1 4 20.0% 25NW Leics DC 2 7 0 9 3 5 37.5% 26Oadby & Wigston BC 1 2 0 1 1 0 100.0% 5Oldham MBC 3 24 2 29 7 12 36.8% 77Oxford City C 3 9 2 8 1 4 20.0% 27Oxfordshire CC 2 22 1 14 7 14 33.3% 60Peak District NPA 3 1 2 2 1 66.7% 9Pendle BC 1 10 1 13 1 2 33.3% 28Peterborough City C 0 16 1 20 10 4 71.4% 51

Plymouth City C 2 25 1 33 10 11 47.6% 82Poole BC 1 20 5 14 4 10 28.6% 54Portsmouth City C 7 20 1 24 3 12 20.0% 67Preston City C 2 6 0 6 1 1 50.0% 16Purbeck DC 0 1 0 2 0 2 0.0% 5Reading BC 2 18 0 17 6 6 50.0% 49Redbridge LB 5 52 7 63 30 25 54.5% 182Redcar & Cleveland C 1 9 1 22 1 4 20.0% 38Redditch BC 2 3 2 11 0 1 0.0% 19Reigate & Banstead 0 11 0 13 3 6 33.3% 33Ribble Valley BC 0 2 1 5 4 3 57.1% 15Richmond upon Thames 0 21 3 21 11 10 52.4% 66Richmondshire DC 0 1 0 3 0 0 4Rochdale MBC 1 16 5 26 5 4 55.6% 57Rochford DC 1 6 0 13 0 3 0.0% 23Rossendale BC 0 5 0 8 1 4 20.0% 18Rother DC 0 8 1 5 0 4 0.0% 18Rotherham MBC 1 18 3 28 5 13 27.8% 68Rugby BC 0 3 0 7 2 1 66.7% 13Runnymede BC 3 1 1 5 1 1 50.0% 12Rushcliffe BC 0 4 0 1 3 0 100.0% 8Rushmoor BC 0 3 0 9 0 0 12Rutland CC 0 9 1 6 1 1 50.0% 18Ryedale DC 0 4 0 1 1 1 50.0% 7Salford City C 3 11 1 25 13 10 56.5% 63Sandwell MBC 12 32 3 61 20 10 66.7% 138Scarborough BC 0 7 0 11 1 6 14.3% 25Sedgemoor DC 2 7 0 7 2 6 25.0% 24Sefton MBC 1 24 2 26 6 15 28.6% 74Selby DC 0 3 0 5 5 5 50.0% 18Sevenoaks DC 0 8 1 8 0 3 0.0% 20Sheffield City C 9 48 6 69 16 26 38.1% 174Shepway DC 1 5 1 10 3 4 42.9% 24Shropshire Council 0 28 2 44 19 12 61.3% 105Slough BC 2 12 3 26 4 9 30.8% 56Solihull MBC 3 16 1 25 6 5 54.5% 56Somerset CC 2 12 3 26 6 9 40.0% 58South Bucks DC 0 4 1 4 1 1 50.0% 11South Cambs DC 2 6 1 4 2 2 50.0% 17

South Derbyshire DC 1 4 0 2 1 0 100.0% 8South Downs NPA 0 0 0 1 0 0 1South Glos C 5 15 3 23 7 7 50.0% 60South Hams DC 0 11 2 6 15 10 60.0% 44South Holland DC 0 4 2 2 0 1 0.0% 9South Kesteven DC 1 4 1 7 0 3 0.0% 16South Lakeland DC 0 9 1 2 0 2 0.0% 14South Norfolk DC 1 5 0 2 0 1 0.0% 9South Northants DC 0 3 0 5 2 5 28.6% 15South Oxfordshire DC 1 2 0 4 0 4 0.0% 11South Ribble BC 0 5 1 6 0 2 0.0% 14South Somerset DC 0 13 3 4 2 3 40.0% 25South Staffs DC 1 3 0 4 0 1 0.0% 9South Tyneside MBC 5 23 0 10 1 15 6.3% 54Southampton City C 2 11 1 13 8 10 44.4% 45Southend-on-Sea BC 2 16 1 19 1 7 12.5% 46Southwark LB 47 57 7 69 44 18 71.0% 242Spelthorne BC 1 1 0 7 0 1 0.0% 10St Albans City C 1 11 2 9 3 5 37.5% 31St Edmundsbury BC 1 9 1 4 0 4 0.0% 19St Helens MBC 0 11 0 18 5 8 38.5% 42Stafford BC 0 5 1 6 3 3 50.0% 18Staffordshire CC 1 35 7 35 21 15 58.3% 114Staffs Moorlands DC 1 4 0 2 2 4 33.3% 13Stevenage BC 3 4 1 6 1 3 25.0% 18Stockport MBC 1 20 2 25 3 20 13.0% 71Stockton-on-Tees BC 1 10 1 23 5 5 50.0% 45Stoke-on-Trent City 2 34 6 25 17 11 60.7% 95Stratford-on-Avon DC 1 4 2 1 4 2 66.7% 14Stroud DC 2 7 1 6 0 0 16Suffolk CC 7 25 3 29 14 11 56.0% 89Suffolk Coastal DC 1 3 2 5 2 3 40.0% 16Sunderland City C 2 22 4 20 9 10 47.4% 67Surrey CC 0 45 6 52 17 13 56.7% 133Surrey Heath BC 0 8 0 7 2 0 100.0% 17Sutton LB 3 19 4 30 4 6 40.0% 66Swale BC 0 11 0 10 2 2 50.0% 25Swindon BC 3 21 4 28 2 9 18.2% 67Tameside MBC 1 17 2 33 13 12 52.0% 78

Tamworth BC 7 3 2 11 3 2 60.0% 28Tandridge DC 0 6 2 4 2 4 33.3% 18Taunton Deane BC 2 4 0 6 5 7 41.7% 24Teignbridge DC 1 10 1 11 4 7 36.4% 34Telford & Wrekin BC 3 11 4 14 3 7 30.0% 42Tendring DC 0 8 2 20 0 5 0.0% 35Test Valley BC 0 4 3 4 0 0 11Tewkesbury BC 0 2 1 8 1 1 50.0% 13Thanet DC 3 3 0 13 0 3 0.0% 22Three Rivers DC 1 9 0 7 2 3 40.0% 22Thurrock C 15 21 3 40 18 10 64.3% 107Tonbridge & Malling 0 1 0 6 0 1 0.0% 8Torbay C 0 17 3 26 11 12 47.8% 69Torridge DC 0 14 2 10 9 6 60.0% 41Tower Hamlets LB 11 40 3 51 10 3 76.9% 118Trafford MBC 3 25 1 34 11 16 40.7% 90Tunbridge Wells BC 1 5 1 5 4 4 50.0% 20Uttlesford DC 1 7 1 6 4 3 57.1% 22Vale of White Horse 2 4 0 7 2 2 50.0% 17Wakefield City C 2 40 5 18 7 7 50.0% 79Walsall MBC 2 14 3 28 9 17 34.6% 73Waltham Forest LB 7 52 4 62 27 20 57.4% 172Wandsworth LB 9 37 2 37 6 13 31.6% 104Warrington C 0 19 4 22 12 8 60.0% 65Warwick DC 0 13 1 11 4 2 66.7% 31Warwickshire CC 2 9 3 26 19 13 59.4% 72Watford BC 0 11 1 7 1 0 100.0% 20Waveney DC 3 5 0 14 1 3 25.0% 26Waverley BC 0 11 1 4 1 4 20.0% 21Wealden DC 3 7 1 16 1 6 14.3% 34Wellingborough BC 0 6 0 3 1 1 50.0% 11Welwyn Hatfield BC 2 8 2 15 2 2 50.0% 31West Berkshire C 0 26 1 15 3 8 27.3% 53West Devon BC 0 4 0 4 0 3 0.0% 11West Dorset DC 0 16 0 4 1 3 25.0% 24West Lancs BC 2 5 0 6 0 6 0.0% 19West Lindsey DC 0 8 1 3 2 4 33.3% 18West Oxfordshire DC 0 4 0 6 1 3 25.0% 14West Somerset DC 0 0 0 3 0 2 0.0% 5

West Sussex CC 3 43 4 38 17 25 40.5% 130Westminster City C 9 53 7 77 18 57 24.0% 221Weymouth & Portland 0 2 1 9 2 1 66.7% 15Wigan MBC 5 30 2 37 15 11 57.7% 100Wiltshire Council 3 29 6 40 17 16 51.5% 111Winchester City C 0 6 1 6 1 2 33.3% 16Windsor & Maidenhead 1 8 2 14 8 5 61.5% 38Wirral MBC 2 22 4 41 8 14 36.4% 91Woking BC 0 7 0 6 0 3 0.0% 16Wokingham BC 2 14 4 21 3 5 37.5% 49Wolverhampton City C 8 27 1 32 5 23 17.9% 96Worcester City C 1 2 1 3 1 0 100.0% 8Worcestershire CC 0 17 2 18 14 13 51.9% 64Worthing BC 0 9 0 8 0 1 0.0% 18Wychavon DC 1 6 1 5 2 1 66.7% 16Wycombe DC 0 11 2 19 3 8 27.3% 43Wyre BC 0 3 0 10 3 0 100.0% 16Wyre Forest DC 0 1 0 3 0 1 0.0% 5York City C 4 23 3 19 6 14 30.0% 69Yorkshire Dales NPA 0 1 0 0 0 0 1
Notes
Number of complaints and enquiries received: a number of cases will have been received and decided in different business years, this means the number of complaints and enquiries received will not always match the number of decisions made.
* Percentage of complaints that are investigated in more detail.
For further information on interpreting the statistics click Local Government Ombudsman • Note on interpretation of local authority statistics

APPENDIX C
Thank you for your email regarding this year’s annual report. After receiving a number of queries
from councils, we have decided to share our responses to the common questions.
But before doing so, we wish to refer you to our recent LGO newsletter that set out our approach to
this year’s letters. We hope you have had chance to read it, but it is attached for information. In it,
we explain that we are not in a position to be able to provide any further detailed information on
the statistics on an individual basis. As we explained last year, we do not have the resource
available to divert from our core work of dealing with the public’s complaints to respond to
individual requests for more detailed data.
We know that our statistics will not be the same as those recorded by councils. This is not an error
by either the LGO or the Council. However, we are confident that it is an accurate representation of
the data we hold for the last 12 months and councils may not have recorded their data in the same
way. The newsletter also explains that a portion of our registered complaints will have been
premature complaints that we referred back for a local resolution, but which the complainant may
not have pursued.
Here are some of the other frequent questions:
Why are there different totals for the number of complaints & enquiries registered, and the number
of decisions made?
Not every decision made will relate to a complaint made in that year. There may be complaints
registered in 13/14 that have not yet been decided on, and decisions may have been made in the
year for complaints registered in a previous year.
I cannot match up the decision reasons in the letters to those I have
The LGO Link newsletter provides a detailed note about why the new decision reasons have been
applied to last year’s decisions, and how to cross-reference the two.
Your data shows a complaint or enquiry about a service our council does not provide
We categorise our complaints slightly different to how councils may record their own. For example
we include disabled facilities grant complaints within either Adult Care Services or Education and
Children’s Services depending on the age of the person affected. We also include blue badge
complaints as part of Adult Care Services.
I cannot match up the number of decisions the ombudsman has made to the number I have on file
Because our figures include enquiries, they will not match what your council holds. For example the
ombudsman can offer advice on, or refer complaints back to the council. We classify these as
decisions and because no contact between the ombudsman and local authority has been made, it is
unlikely you will hold a record of them.

We appreciate your feedback, which we will take account of future years, however we may not be
able to respond to all feedback individually.
[email protected] I www.lgo.org.uk

LGO link Keeping Link Officers up-to-date on developments at the LGO
July 2014
Local Government Report/annual letters
As you may know, the publication of this year's annual letters will coincide with publication
of an in-depth report reviewing the last year in local government complaints. This report will
feature some of the statistics in the annual letters. This is the first time we are publishing
such a report and we aim to make it an annual publication.
We will email you a copy of your annual letter around a week before the report is published
- we are expecting to publish the report on 15 July so we will email you a copy of your
annual letter on the 7 July.
As we mentioned in the last edition of link we welcome your feedback on the report.
However, we are not in a position to provide any further detailed information about the data
we present in the report or in your annual letter. We understand that our figures may not
match the data collected by local authorities. Typically the differences between our data
and data held by local authorities reflect that we refer a proportion of recorded complaints
to the council for local resolution but the complainant may not always pursue the
complaint. We are satisfied that the figures we will provide accurately reflect the data we
hold for the financial year 2013-14.
Annual letters emailed to councils

Annual letters - describing our decisions
As you know, we now describe our decisions in terms of upholding and not upholding complaints,
which brings us closer in practice with how other Ombudsman schemes and many local
authorities describe their complaints.
We used these new decision reasons to describe complaint outcomes in our recent Review of
Adult Social Care Complaints 2013 report. The feedback we've received is that the new
descriptions make the information far more accessible, especially for members of the
public. We've therefore decided to publish last year's data against the new decision reasons in
this year's annual letters.
We appreciate that you may have recorded complaint outcomes throughout the year against our
old descriptions: the information and table below should help you match the descriptions across.
• Upheld: These are complaints where we have decided that an authority has been at fault
in how it acted and that this fault may or may not have caused an injustice to the
complainant, or where an authority has accepted that it needs to remedy the complaint
before we make a finding on fault. If we have decided there was fault and it caused an
injustice to the complainant, usually we will have recommended the authority take some
action to address it.
• Not upheld: Where we have investigated a complaint and decided that a council has not
acted with fault, we classify these complaints as not upheld.
• Advice given: These are cases where we give advice about why LGO would not look at
a complaint because the body complained about was not within the LGO’s scope or we
had previously looked at the same complaint from the complainant, or another complaints
handling organisation or advice agency was best placed to help them.
Local Government Report published
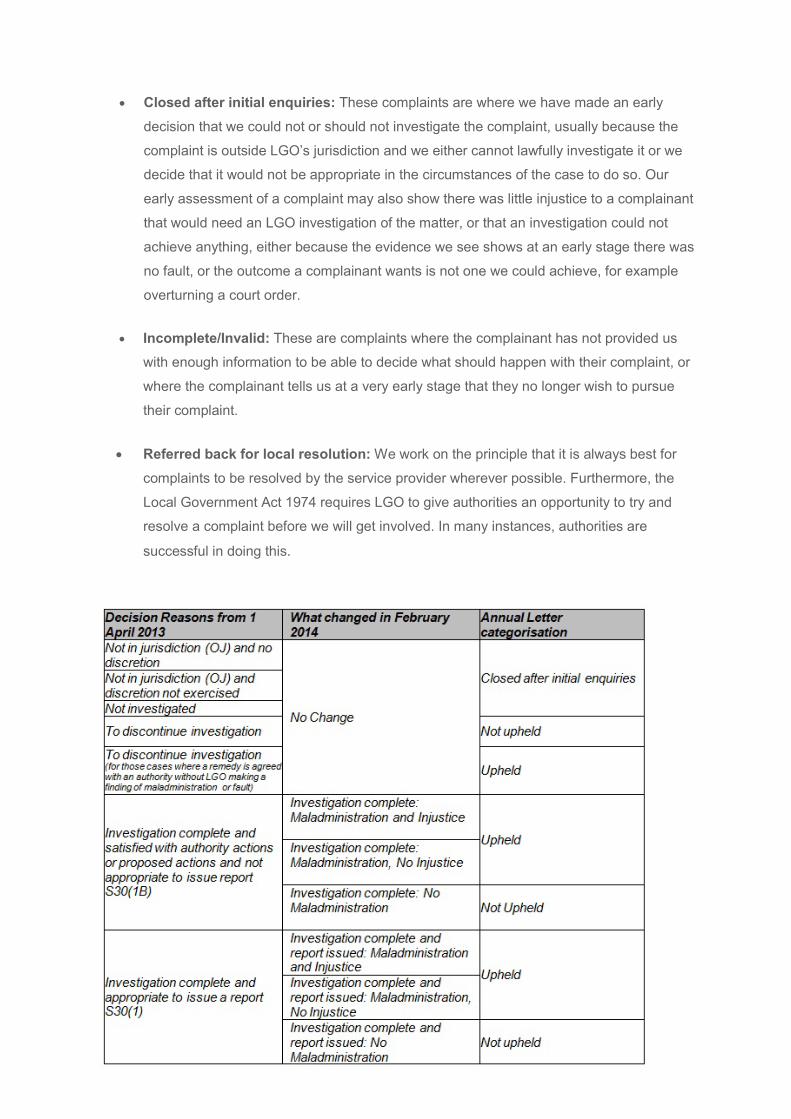
• Closed after initial enquiries: These complaints are where we have made an early
decision that we could not or should not investigate the complaint, usually because the
complaint is outside LGO’s jurisdiction and we either cannot lawfully investigate it or we
decide that it would not be appropriate in the circumstances of the case to do so. Our
early assessment of a complaint may also show there was little injustice to a complainant
that would need an LGO investigation of the matter, or that an investigation could not
achieve anything, either because the evidence we see shows at an early stage there was
no fault, or the outcome a complainant wants is not one we could achieve, for example
overturning a court order.
• Incomplete/Invalid: These are complaints where the complainant has not provided us
with enough information to be able to decide what should happen with their complaint, or
where the complainant tells us at a very early stage that they no longer wish to pursue
their complaint.
• Referred back for local resolution: We work on the principle that it is always best for
complaints to be resolved by the service provider wherever possible. Furthermore, the
Local Government Act 1974 requires LGO to give authorities an opportunity to try and
resolve a complaint before we will get involved. In many instances, authorities are
successful in doing this.

We will also be including the following explanatory note about the statistics on our website:
It must be remembered the bare numbers of complaints against an authority do not prove that it
is a ‘bad’ or ‘good’ council. The larger the population an authority serves, the more likely we will
receive complaints about it. A significant uplift in complaint numbers again does not necessarily
show that a council has become worse at what it does. We may have received several
complaints about the same issue from different residents, for example a controversial planning
decision or application. An authority may have a 50% uplift in complaints against it, but when we
received two complaints against it last year, and four this year, this cannot lead to the conclusion
the service the council provides has significantly worsened.
Consulting contractors
At the end of 2013, we wrote to you and explained how we were changing our processes to
ensure that any individual or contractor who is acting or has acted on a council’s behalf on a
matter is consulted about a complaint.
The processes have been in place for over six months so we have taken the opportunity to
review how they are working. Because of the review we are changing our approach. LGO is keen
to ensure the processes do not place an excessively complicated administrative burden on the
bodies in our jurisdiction while still ensuring that all those individuals or organisations who should
be consulted are. The new approach will also ensure the body in jurisdiction (BinJ) usually has
the opportunity to see the comments being made by an individual or contractor.
Where the Investigator decides that we need to ask for comments from named individuals or
organisations when we make enquiries, the request will be made via the body in jurisdiction with
the following options:
• For the comments to be obtained by the BinJ and sent to LGO with its response to our
enquiries. Here we would normally expect the comments to be on original headed paper
or in the form of an email from the author. It will be open to the BinJ to provide its own
comments on what has been said by the named individual or organisation.
• For those comments to be sent directly to the Investigator and copied to the BinJ. If
the author does not want the BinJ to see the comments, the Investigator will consider
the reasons given in deciding what weight to attach to the comments.

Where the individual or organisation is no longer involved with the Council, the Council should
make reasonable attempts to contact them and secure their comments. If this is not possible, it
should explain this in writing to the investigator.
If we are critical of the actions of an individual or organisation, we will require the BinJ to show
the individual or organisation the provisional view statement and invite their comments, and to
provide LGO with evidence this has been done. The individual or organisation comments can be
returned to us in the same ways as at the enquiry stage.
We will also ask the BinJ to send a copy of our final decision statement to those concerned.
Latest reports
Visit our news page to see all newly published investigation reports.
Recent reports include:
• Bedford Borough Council (direct payments)
• Cornwall Council (planning enforcement)
• Knowsley Metropolitan Borough Council (independent living)
• Lancashire County Council (disabled child)
• Selby District Council (further report - householder planning application) (Sent 2 July 2014)