Embed Size (px)
Citation preview

DOCUMENT RLSUME
ED 093 566 RC 008 029
AUTHORTITLE
SPONS AGENCY
REPORT NOPUB DATENOTE
Ohlendorf, George W.; Smith, Kevin B.Occupational Projections of Rural Louisiana Youth: AHistorical Comparison.Louisiana State Univ.,, Baton Rouge. AgriculturalExperiment Station.LAES-1231; USDA(CSRS)-S-8125 Aug 7423p.; Paper presented at the annual meetings of theRural Sociological Society, Montreal, Canada, August1974
EDRS PRICE MF-$0.75 HC-$1.50 PLUS POSTAGEDESCRIPTORS Anglo Americans; Area Studies; *Comparative Analysis;
Females; *High School Students; Historical Reviews;Males; Negroes: *Occupational Aspiration; *RuralYouth; School Integration; Socioeconomic Background;*Tables (Data)
IDENTIFIERS *Louisiana
ABSTRACTThe paper examined changes in occupational
projections among rural Louisiana high school youths between 1968 and1972. The research design obtained a representative sample of theseyouths through a proportionate, stratified, random cluster samplingtechnique. The 1968 procedures were: (1) the State was stratifiedinto 4 geographical areas which represented its different economicand social groups; (2) within each area, between 4 and 6 schools wererandomly selected frop nonmetropolitan parishes to obtain black andwhite student representative of the nonmetropolitan State enrollment;and (3) senior students were the respondents. In 1972, due tointegration practices, only schools whose racial groupings couldcorrespond to the 1968 schools were sampled. The initial sampleconsisted of 217 black and 325 white respondents; the 1972 sampleincluded 141 black and 312 white respondents. The approximately 20tables give percentage rates for changes, both by sex and race, andby residency and race, for such things as occupational aspirations,aspiration levels, intensity of aspirations, occupatiopalexpectations, and a working table gives frequency distributions ofoccupational orientations. (KM)
UDePARTMENT OF HEALTH
ED...1(010.i &WELFARENATIONAL INSTITUTE OF
eoucATIoNDOCk.NENr ray PEI E pwo
;4.0 ExACTL. .S .41LE,..I.C,
fE PERSON 0,i. 00Ga..-/' %C., .T POINTS Cr s 109 Cv %
,TA/E0 00 NO, K.E(For F.c. /.1....A1.,V.,A_ ',..'E
F.(4.1".0,4 COS,
OCCUPATIONAL PROJECTIONS OF RURAL LOUISIANA YOUTH:
A HISTORICAL COMPARISON
George W. Ohlendorf
Kevin B. Smith
Departments of Sociology and Rural SociologyLouisiana State University
BEST COPY AVAILABLE.
Presented at the Rural Sociological Society annual meeting,Montreal, August, 1974. Development of this paper was supported bythe Louisiana Agricultural Experiment Station as a contribution toProject 1231 and to USDA CSRS Research Project S-81, "Developmentof Human Resource Potentials of Rural Youth in the South and TheirPatterns of Mobility."
BEST COPY AVAILABLE
Purpose
The purpose of this paper is to examine changes in occupationalprojections among rural Louisiana high school youth between 1968 and 1972.It was prepared for a panel presentation of a similar study of ruralsouthern youth.
Sample Selection
1968
The aim of the research design was to obtain a representative sampleof rural high school youth in Louisiana. A proportionate, stratified,random cluster sampling technique was employed for sample selection.
Procedures followed in selecting the sample were as follows:(1) The state was stratified by four geographical areas to represent thefour quadrants of the state which differ somewhat in their social andeconomic characteristics. Moreover, each area is relatively homogeneousin its social and economic traits compared to the others. (2) Clusters(or schools) served as the sampling unit. Within each area, between fourand six schools were selected randomly from nonmetropolican parishes toobtain black and white students proportionate to their enrollment in non-metropolitan schools within the state. A total of 20 schools--13 whiteand seven black--was selected for the entire state. (3) Senior students inthe schools were designated as respondents for the sample to correspondwith the cohort being studied in the other states participating in theproject.
1972
Public. school integration and establishment of private academiesconfounded the opportunity to study historical change in the same schools.In 1972, only four of the original 20 schools--three white and one black-were substantially the same as in 1968 and two had been closed. Conse-quently, these four unchanged schools and the 14 other integrated ones stillopen were selected as the sampling units for studying historical change.The 14 schools (black and white) had been integrated with identifiablepreviously segregated schools (white or black). Although all students inthe schools completed questionnaires in 1972, only the racial groupingcorresponding to the 1968 schools was utilized in this analysis. In addition,private academies had been opened in two places where white schools hadbeen included in 1968. These were added to the sample in 1972 because somestudents who otherwise would have been attending public schools yore attend-ing these academies. Insofar as possible, an attempt was made to involvethe specific respondents who would have been 1972 seniors in the 20 schoolsfrom 1968.
I)ntL
1968
An 18-pae '-e;ion of the 1968 S-61 Southern Youth Study questionnairewas utilized t,j data by means of group interviews in the schoolsduring early April. These interviews were conducted by staff members
1
2
(faculty and graduate assistants) from the Department of Rural Sociology atLouisiana State University, who had been instructed in interview proceduresprior to the field work. Approximately 60 minutes were required for eachadministration. All the seniors present on the day the interview wasscheduled participated, but no attempt was made to contact any who wereabsent. A total of 544 completed questionnaires were obtained--325 fromwhites, 218 from blacks, and one from a Native American. The questionnairefor one black has been lost, leaving the distribution of respondents inTable A available for analysis.
19/2
A slightly modified version of the 1968 questionnaire was utilized.The deleted items were at the back of the questionnaire and were not con-cerned directly with the project objectives. Additions included theOcc'Ipational Aspiration Scale and significant-other influence items. Thesereplaced the deleted Items.
During nay, this questionnaire was administered to the seniorclasses in the schools. Completed questionnaires were obtained from 453seniors in the schools except that a mail questionnaire was utilizc1 forone private academy because the school year had concluded too early toadminister the questionnaire in the school. This academy had 19 graduatesand 17 of them returned their questionnaires. The distribution of respondentsis provided in Table A.
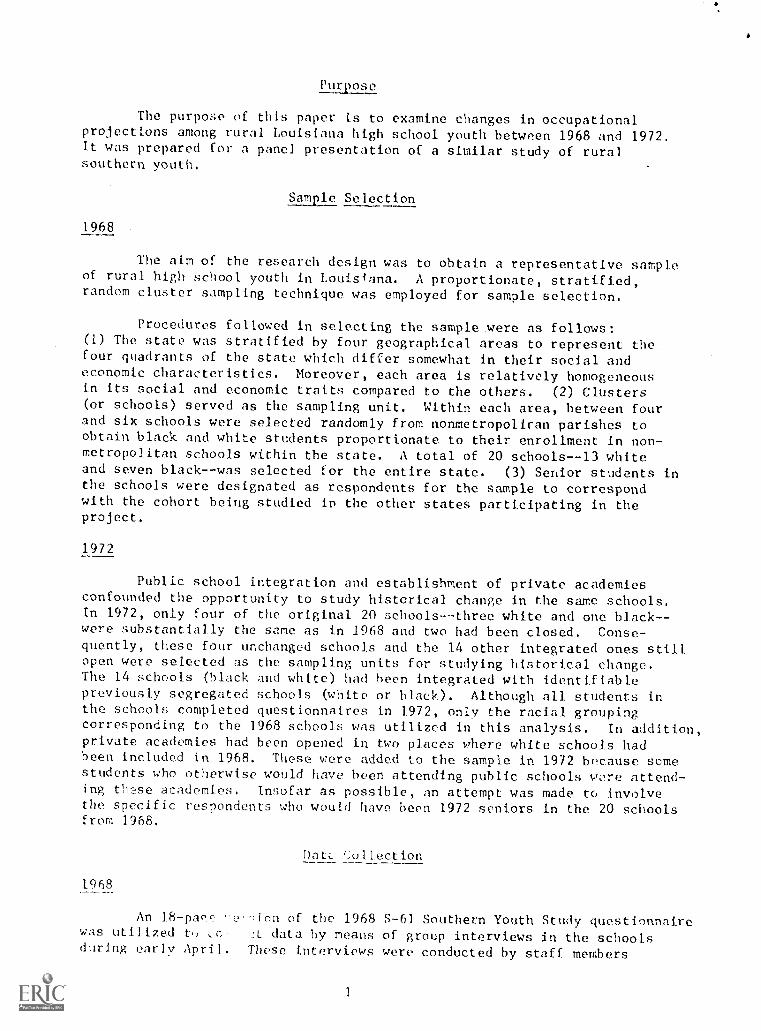
Table A. Distribution of Rural Louisiana Senior Respondents in 1968 and1972, by Race and Sex
____________________________1968 1972Race
___
-1,:i le---
Female Total !la 1 e Female Total-
Black 9Ia 126 217a 64 77 141
White 168a 157 325a 150 162 312
TOTAL 259a 283 542a 214 239 453
a.Excluding 1 Native American and 1 lost questionnaire
(Is
C.,
4
c_.
..
(I)C(C:
(.( 1
(y.
1,1
(.11
I
F.(
.._.
- ..
( (
.........,
I
.i.' 1
(N.1- _4
q)`..1
C )
C)
lit
4-
'-0
C)-4
.4
.7._..
. u
_
(.,4,
CD
C )
N" +
-..
C..1
r." ,
1.0
(NJ..1-
0CisC`J
N-s,
..)
CO
C-.)
CD
0-
tr,
(N
C)
CD
...
(0
C) )(NJ
1
.0r')
.
C_-)
CD
(...,)
CD
)
_ _
C..)
C )C) lr
.._a-)
4
....
c4XI
C '.....---,'
Os
,I....
1
,.
r ,
C` .1
I
N)
CD--4
..._
_
0)
CID
I
1,1-4
0,(1)4
C)
CDI
II
I-)
CT',
r )
tr}f(C
- ,.
r -
N)
C) C )
4.)-
r -.
C)
cm
C.1
(:-.,
C.)C). _
-
co) -,-,..,
c1.11
Uc(7)
E.:
C- 1.- ,,0 ).....
c I
ssz(.-4
WI
a)I
CN
cyN)
ca
IC)-4-
Cs
, .1-
<-7,
14")
c ...;
r-,
r 1I
so
cJ(1'4
( s
0CV_ _
a).
r-14
00
C)
(N
c.1-
I
a)
CO
cc,
C.,-4-
-....----.
c,,
C)
001 ` .444.
\
I
4 1
i
_
.c, , ::: ',r., 1
,.-, 4 Os
, 1
."1)
0- .t' t
4....
C, I- _ _
.
v1, 3' j
....
,
tr
t...1
_ .
C")
re 1 ,,'..'C J
_0-
so
C'
ernagrascAnremsurumatimataimee.
1
I_.
r...
1 1
Cr? IS
r j
1 Ji
-
0,)
4 ,
S..
,
L
r..)
. __
A_
C '
4
.
,73
-
-
4 n
,,
;,)
.._
(.11
ri)
. :,:1
.
1 J-'
11;
a)
.41 S4
Cl
>g:
r
I' 7
c
1.
LO'
=
vz.2
zX
c00d
-0;= zY,
zX J0j.
c5"=_
z-
= -;-P
- 7X
--
95!
151
--
5/
7Z1
--
7*.7i
591
__
,:'
=
--
G-001
0-C./CI
--
C,-.001
4-
:-OC/
--
6-66
0-0',.:I
--
YC'C'i
6,-6t.
i.--
6-11-
61
C.0
1-61-
L"Ci
.9-1
c-c-
'7,-N
ILt-.,
,
r,--9
.1_7
007
7./4-
c'gV
_
6-i_C_
6-,?
Y 97
I'
9-i7
'.=.':-.-
..C.7
Z'Oi-
-4,
7-67
9-65
5'91-
0-77
5.C:9
.
C.D.:2LICD
c.,
P
ZL6i
dP
';961
01")...:PLC
a'rL61
%P
c;c6!
G5u21.4D
cvr
ZL6I
-...
P
6I
,'_:-:i:',..C'yj
'',,
-,
c.-1Lm
..-_-,a-i
G-4-1Li
--7;;=
..
(7':-4"'-'j: :L6i-%_-1
At: L4n0 ,.,
c,e!!:-101
:P_In
4o si_4/\-! ,:i!d
j'uo!=.30
C`4r--.CT
1
CO.0Cr,_
;K,.,UC17,1
Il.)
)....
.r)
..c.
0
ftlL.
(4)
C)-14
--
-.7
L L
-0,
'11
,..)c0
4t
C 4_
> ,.,
L :
1
)
c
ri) ,
' 'i
' 7
-,
.11.__
L.
.
(11
{ 71
01c(,'
.
I
,y,
kf-f
(_1
C
',
f
,,k)
0-4-
,i)
I
k.0
4
0,
4
Cr
-+ I
CO
I----**,-,0,
,Ci,0 /-_
If \
c-
---
(1,(N
(7)
0C , L0
L. )
' 0 0'C.',
11)
COCV
CI,
ONLT
0 )in
U),
ct.",
r'lV(-- \I
c )
00C)
Cv
r-
--_-1---CD c i
Cl, 0
1.1.1
(-`.
CCC
(1 I
-__
'1
(n
C
(._.'
-; 0",II u-). LI -1 C_I.,
r4Th
I I
0 ci ) V) (...." - - - - lf " - - 41 c.t. C ) cl
a)>0 11',C.77
C-)
'0_c-',4
,,.1-r1
(C
--ca .4
CA(7 t
CY,
,..7,
(I,
CD
c.)
C)
r-C`-.1
as
CI .(17
_ ..-
i
.
.
fl)f
s:
(1'Cc
_Cu
0'C-7
I
1.1 -7
-.I
(f- .
-4
---
----+
V)
--
in(NJ--f
r-1.'7--
I
r-Th
C)I
I
I
I
r - t%cc,-(7%
it',
0\cc(-' 4
(..,-,
---
, L.,
C .1- q.)
C ( I
-i/rri
(77
I c-
r-
N "
,....:
( '0 il \N \- .
(..;.,-- , L-.
,I-
(.. )N
c ) If
( / -.--
Utr \
N)
(14( -J
,,c )
(-7/-. 7-1
c;C. )
)_(4t. t
,
.,
, ,/ , t.,.,
C>
,1-,
4 1 )
7. ,
r -
_ .I I
,
r (
f 1.,.
1
1 i
,.,.t 1.
_ _ ,
c.,.1
,
r,
t.,
0. r-
._ .
c)
_
( _, (.,}
--
(:'
.,;.,
, . .
I
rt
"I (
.
L (-
.
t .1
,_
E
1-
' tt'
( '1-_,
(7 / . n( / fi,
- --t_ rn
II(I ,___
ip(1,
>. -4 -(71
L
'7.1
---.. _
_.e
.
,4t -
rI'(.n
A
_ _
,-,
.
r
C.1)
U)
V
C)
(,)
* L:1
7.1
C4
(1.
C'
4
. _
(1)
C.
C)
-.
C )
-
kXC)
e..C)
Ca)
a)(.:,tri
CT"
_C.
4-Li0
>
..7-)
I)
..:1i.....13
C)
_.(1,).
_J
CI.
'',
4
, )
CL
". 7.
1 .
.
1
_
r
a)-
.r_
illC')CI')1.:(.)
(..- )
C)
\I.)
I,)I
tiN
ff.)4 I
i1
(Nr----. t,.+,Cr
(N
cta!
C`,/
iNIS)
ttis\
t4-1
a-
0,0,
1,-1
fl)Cl) III?,G)
CL
kJ,1
Cl)
LC)UM
C)
C)
(1)
C) )c)
fkl
r )
ca)
,
CDC))t.:_
LI?,
(.. )
C-)
C)_I
ret
1.11+
C-
4 I
t -- Irr:
I
r. r' 1
r----
Clli'
i')Ill
r `I
C)C_.
---
I)),L, n,
C-
r,-,
.,...!.
II,.,C
(..sn
()c ,
c-,r ,_
0-,(. )_
...L.nr.OrooJansan
.
r
C))
C)
. ,
0 ,
cmI__.(,.;-,
+
1'C)
_.I
1
i
r-- --,7, 7,
7,,
rrl
, c.,c),,
'...
,,..)
I C
C I
N-'
, ,.,,-
r ..,!.,
C -. ,-
cr,;,--
,C,
Ni
C'
( ) 4.JI
. .
_ .
,..,
..
,....
.
I
.. ;. . ,...
mmogyismown......*,........
-. ' -.
' l ,. I
CO
11 11 H
CU l-;--",:', 4 CI l)
1_,1
U
T )
^,
L I
4-

0.
. - .......
t
.
.. ,........ .....
Ci
(
.
1
.
.1 c
..
. --
c
- .
r.
...............
10.4rtna-e. lars.o..4,
F.....1
. ..--...-
: awe.
.....-
se-
I
sat
. ...
. -
1,9111;11:101,1115t:
1
1
i.. ....... ..
- .
..................
- - ..........
A..- .....
.0
..
fr.) c...Y)NC
N>: n
CI,,C)
Ef II
C3, ,1
0,
lrsisftemrsoorlamimmenwoomosseemsassessriiioN
1,4 -
kr
te ,
--,
CI.
rl ,C)Ceu
Ct_ )
C )
.......
I
kr)
( 1
I
0i_c
C,I
.^t
0.1
',1
CNJ
4
1----
C)I
I
I
i4
r^
Li,
L1,3
.
- .
L13,
Kt
r--
--OJ
3 L.)
(1)
0)
01
c0
if)C`,1 ON
010')
--CO
.------.-
Cr)l CI .(1, .,
cl,
(1,7._.
Cfl,L
CI.)
Nt___
1----
0)+
1---
--ct
V,./..1)
I
--4.-,k2-_
trla.)4
(1)
(N__
CO
If )1
CI)
0
ki..,
<11
4
CNI
141
CO
0I
0',
._
CD
C.1
C.,
C:lC:.
I
I
Lir)LC\
I1
r ,r-- ,..,,,-1
--
C",
N 1
, r
-Lis
1,1
if L3
(.1
LC
r---
0)o.:.,
IN
c..,
(11.1)
cm
0CD--
C '.Ir- -
a ), 0 It-0_ _
( J
,1a)
I--t.c,)
a)1 L)
r( ''.-
.....
U. '1.
,,-..4
ri-)
(')
C )
r)C)0-.
(.1.1
----
r;)4. -1
.
0..,(.1
C
ic'
( ,
C' I
4..1-
I
44
_.1
.4
,L,+
0'-
r.-,i
C`,4
CJI
InCs 4
+
CO
C)+
i
i
I
i
r J
r- - 33,..,
(_"!
,.L. )
r/c 4
c--:
3,1,1
r-_..
,:: rr)
LC)
u-,
r)r-4
0C ',C.)
i.-i)
v.IL- -,.........-.-
L , '33 -'Li_ .
(11)
).-/
,/
LL)
3r-1
3
I1-
C .)-__
-C11_ .
311
t411)
l 1-3
3',1
(,..'r-'1'..-).11
0t.- )r_j)
U.13.))
,
__
.: I
,_
").
,,
_
.
. ,
!I
.
t
I
_
4
L ,
.
I
4
4r
' iI
-- .Li
-4
I
i
II
- -.
._
`^
il r
_
,I C. J- r- -
rirr
_ _ _
r r)
or,Cl,
..-1.-',
1
. *).-
r
e---.
' J
1..1.c)
tc 1.-) C 4
,.0.
1...Th 0C)
CT,
C.7,cIL co')
4
,
1- _--.--::----
cer)
+
-1- '.
,t r,
I
..
(1)
...-4
1
Cr)
4
3'
II
,
C,40\ CO
Csi
.I II
IN
>.<
t. )
'I) te-1
o
(.3
Jr1.)
cl
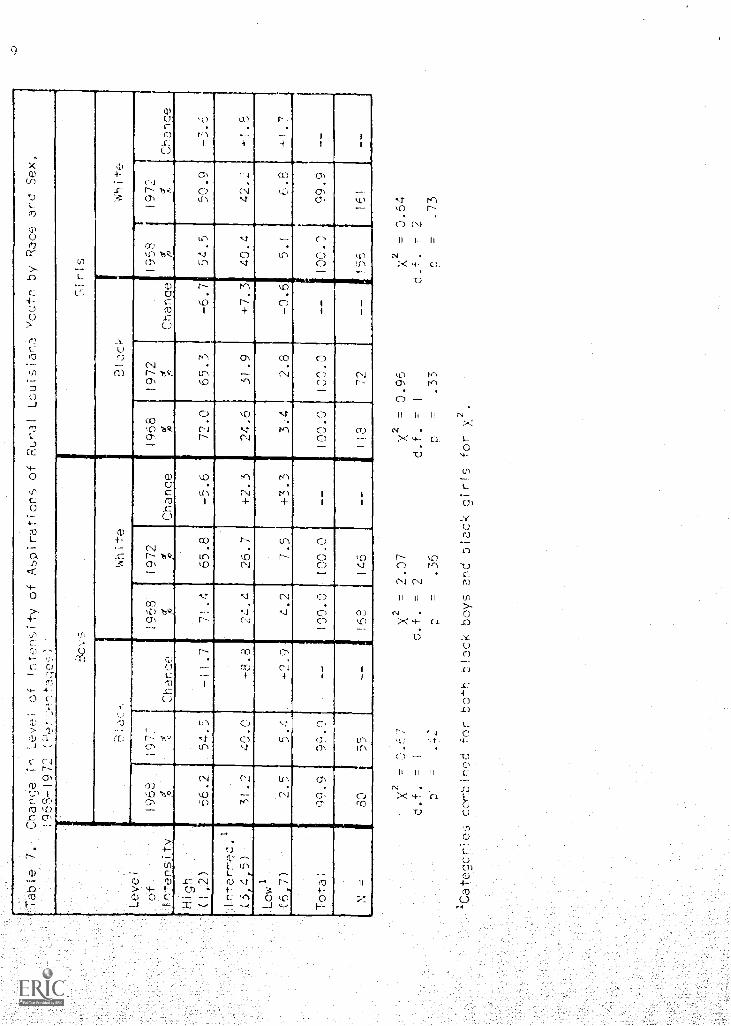
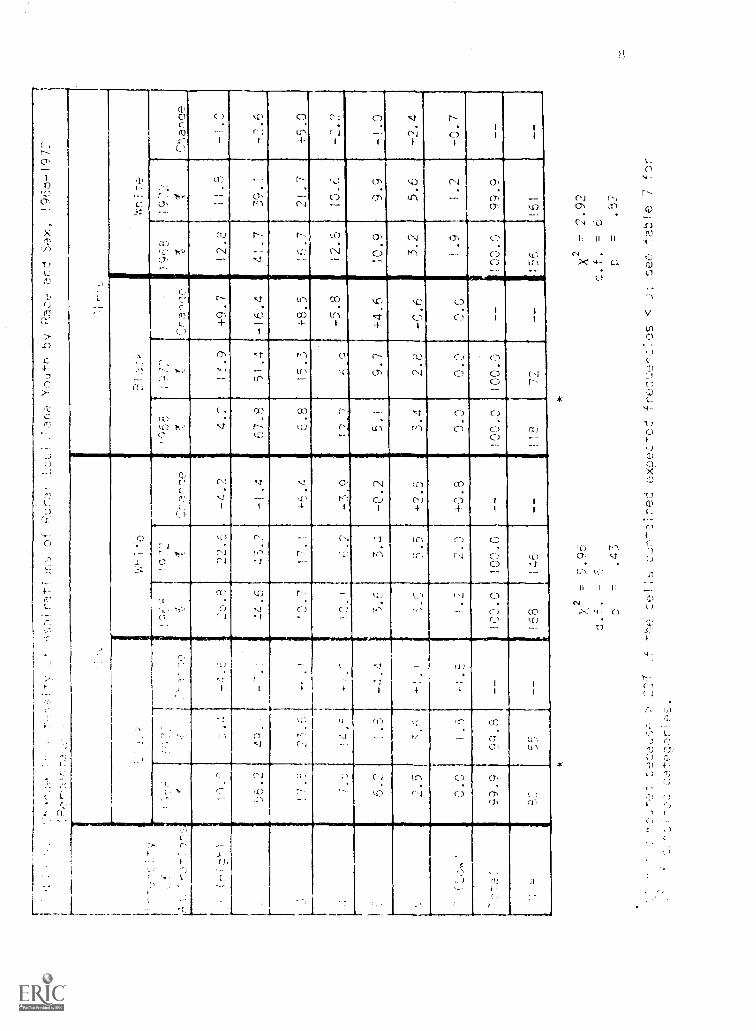
,able 7.
Chance in Leve; of !ntonsity of Aspirations of Rural Louisiana Youth by Race and Sex,
1968-1972 (;-'rcnta:_;e,:,)
Level
nf
1
tensity
L,o\s
r..7,1r1s
:S;a:',..
White
Slack
White
1968
.1.
1972
Chance
1968
d1972
9 .,
Chance
1968
a ?
1972
a ?Chance
1968
9 0
T-
1972
,h,hca,
High
(1,2)
66.2
54.5
-11.7
7!.4
65.8
-5.6
72.0
65.3
-6.7
54.5
50.9
-3.6
!,ered.
(3 4 5)
31.2
40.0
+8.8
22.4
26.,
+2.3
24.6
31.9
+7.3
40.4
42.2
-Le
Low'
(6,7)
2.5
_,.-,
4.2
7.5
+3.3
3.4
2.8
-0.6
5.!
6.8
-1.7
Tota:
99.9
9'7,.9
--
100.0
100.0
--
100.0
100.0
--
100.0
00 a
.......
--
1111
x =
30
...55
-,
--
H8
146
.....
118
72
--
161
X2 = 0--7
d.f. = =
X2 = 2.07
-"
f
=.36
X2= 0.96
C.f. =
1
=.33
1Ca,ecories co
ned for both black boys and black cir1s for
X2 = 3.64
d.f. = 2
=.73
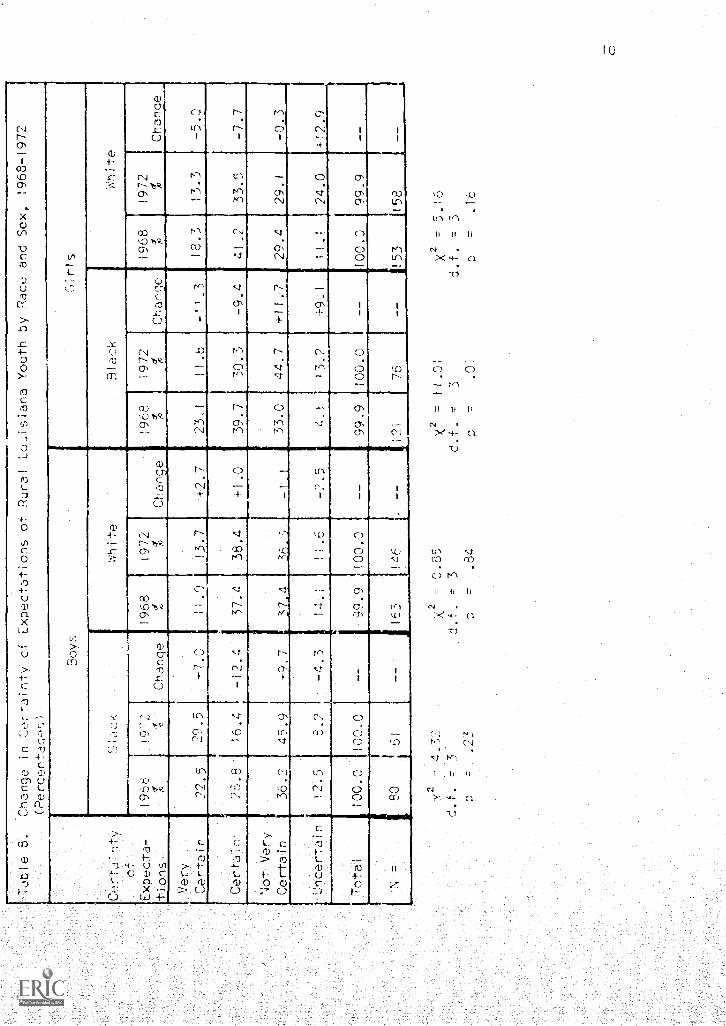
able 8.
Change in Certainty cf Expectations of Rural Lajsiana Youth by Race and Sex, :968-1972
(Percentace!:.)
Ctr
-ra
1 nt
y(-'
EXpecta-
-Mons
boys
Girls
5;,::
!ck
White
Black
White
1968
d ,,,
1972
.,
Change
1958
4t972
fa%
Chance
1968
4 ,,,
1972
d xChange
1968
%P
1972
a PChance
Very
Certain
22.5
2 °-5
-7.0
10
13.7
+2.7
1.,
..!1.3
18.3
:3.3
-9.0
Certain
25.5
18.4
-12.4
37.4
38.4
+1.0
39.7
30.3
-9.4
41.2
33.2
-7.7
Not Very
Certain
36.2
45.9
.-
-33.0
44.7
+11.7
29.4
29.1
-0.3
incertain
12.9
5.2
-4.3
IL^
-2.5
13.2
+9.1
11.1
24.0
+12.
octal
100.0
100.0
99.9
100.0
99.9
100.0
--
100.0
99.9
=80
51
--
163
145
--
121
75
--
153
158
__
4.32
= = =
3
.84
X2
d.f.
p
= = =
11.01
3
.0:
X2
d.f.
= -7-- =
5.15
3
.15
81ac
k
White
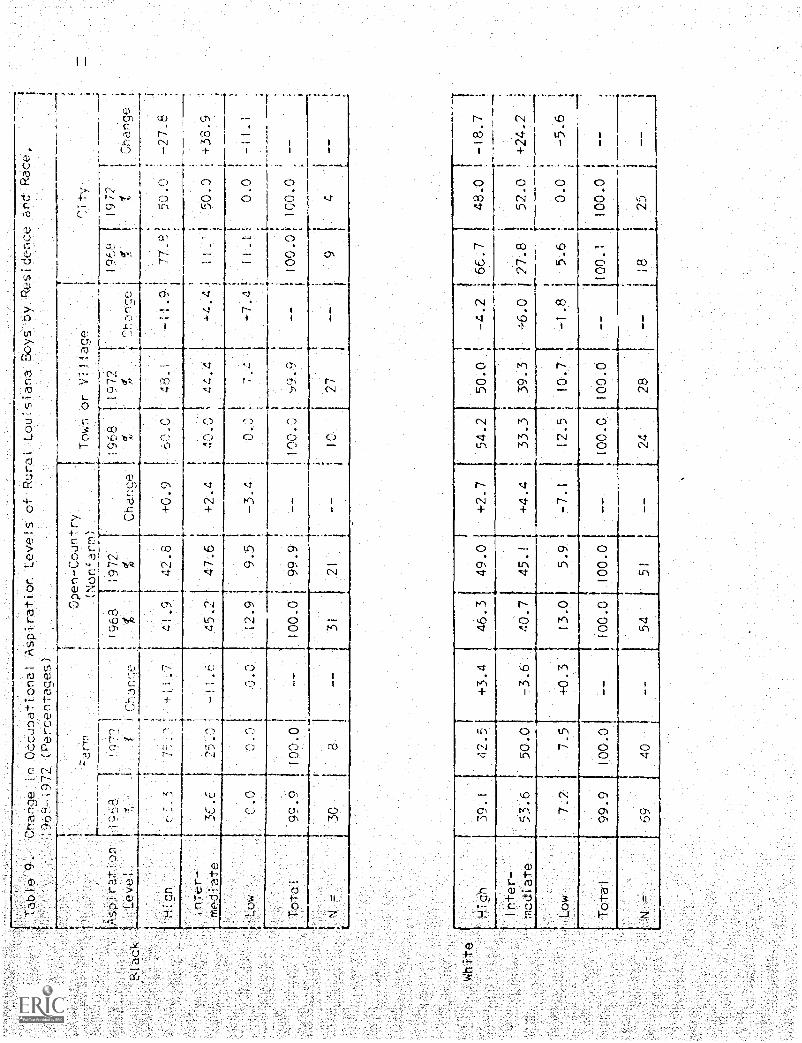
Tabie 9.
panne
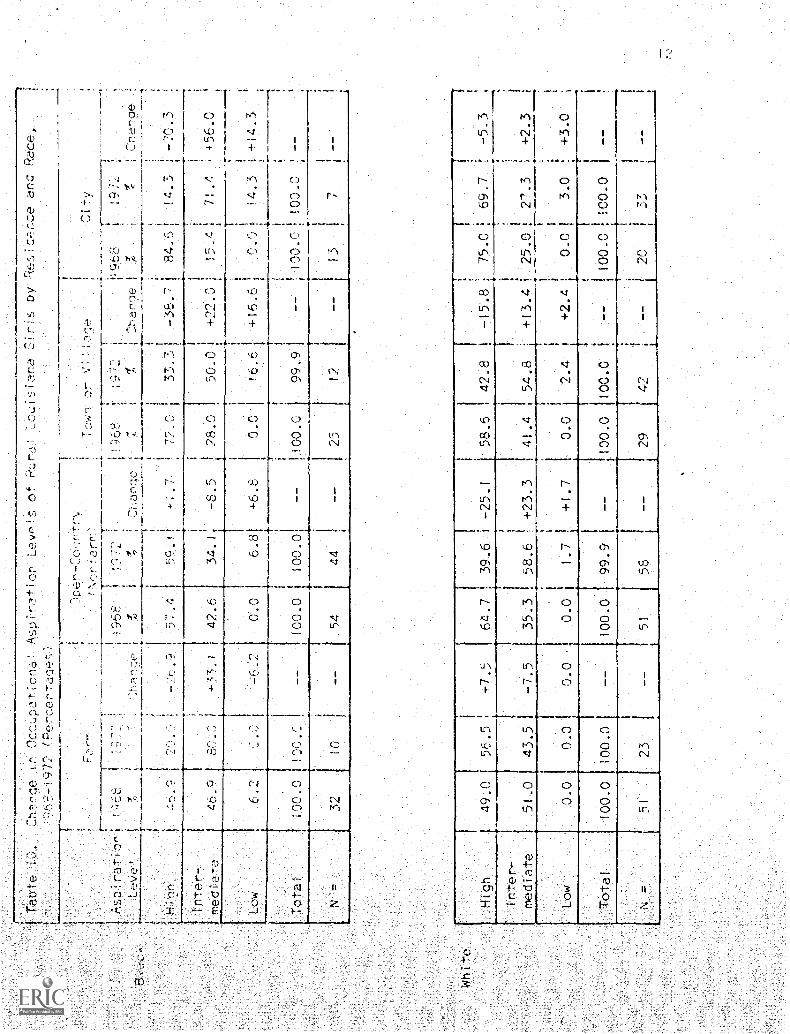
Occubationa; Aspiration levels cb..
6,;4-1972 .(Percentages )
1OpenCountry
(NonJarm)
-bira't,)r
levet
1 Chan,w
1
25.
1
-.1
0.0
01
Tota!
1
99.9
100.01
!968
1972
41.9
42.8
45.2
47.6
12.9
9.5
100.0
99.9
=30
3--
3!
Rural Louisiana Boys by Residence and Race,
loWn or Villaoe
jcity
1968
1972
1972
1-a
1d
a1
Cha
nf
+0.9
n
+2.4
40.0
- 3.4
0.0
- -
`100.0
i50.0
:
1
AA
A
21
'
IC
t27
+4.4i
+7.4t
11.1:
0.0
.,.
-11.1
100.0!. 100.0
!_77-1
1-38.9
High
39.1
42.5
+3.4
46.3
49.0
+2.7
54.2
t
!
50.0:!
-4.2
i66.7
I
I48.0
1
-1
-13.7
_ _ ____
Inte
r-t
11
mediate
53.6
50.0
-3.6
40.7
45.1
f
+4.4
33.3
39.3
1+6.0
1 27.8
52.0
'
+24.2
t,
Low
7.2
7.5
+0.3
13.0
5.9
-7.1
12.5
10.7
-1.8
5.6
0.0
:-5.6
1
t
Total
99.9
100.0
1100.0
100.0
100.0
100.0
i--
100.1
100.0
i
--
N =
69
I
54
i51
--
I24
28
1--
1825
t1--
11
E
White
Taote
qe
t n 0ccpa!-.7.c.na!
Aspi.r,?
LevP1s
1912
(7'
C1,0i-,r-roirur-ry
!968
T-I272
'
I
L3k:isla.ra Giri1 Oy Res.
Race.
Tow-, or V;
Ci:ango
' 1f
Cra
rOe
'...""r1
'-?
- '.
-2?-.''-'
,57.4
5.
+,./
I 1
33.7,1
.
7
-.5E.7
i84.51
!4.3
!-70.''
Inter-
Ttedia-
4o.c4
ar-
+33.1
42.6
34.1
-8.5
I78.0
1 1
I50.0 1
i1
+22.0 ;
15.,:i
71.4
+56.0
,
Low
6.2
W.,
I
-6.2
0.0
. vn
6.81
+6.8
i
i
10.0
16.61
1
t
+16.6
1 10.0i
+4.3
i -14.3
i
Total
100.0
100.9
I
100.0
t
100.01
;
--
1100.0
t
1
99.9
--
/
1DO.r.!
t
-
:
100.0
' --
N =
32
10
1
54
44
1
1 125
t 1
12
i
--
I13
1
-,
1 1i
High
49.0
56.5
,+7.5
64.7
39.6
1
I-25.1
158.6
2.8
r
.
[ t-15.8 :
75.0 !
69.7
-3-3
i 1
Inter-
mediata51..043.51-T.5.35.3,58.61+23.3I41.4541-.8*+13.4
I
,
125.0 !
27.3
;
!
+2.3
Low
0-0
0.0
0.0
0.0
1.7
!+1.7
0.0
2.4
I+2.
1
0.0 1
3.0
: ;-
+3.0
t i
Totaj
100.0
100.0
--
100.0
99.9
i
--
100.0
100.0
t.
1100 r'
)ICO 0
1-,-,
---
i '
N =
51
23
--
51
56
--
29
i
T1-
7---
-,
4f
--
)2C
i33
-
1.
1 ! -
Black
White
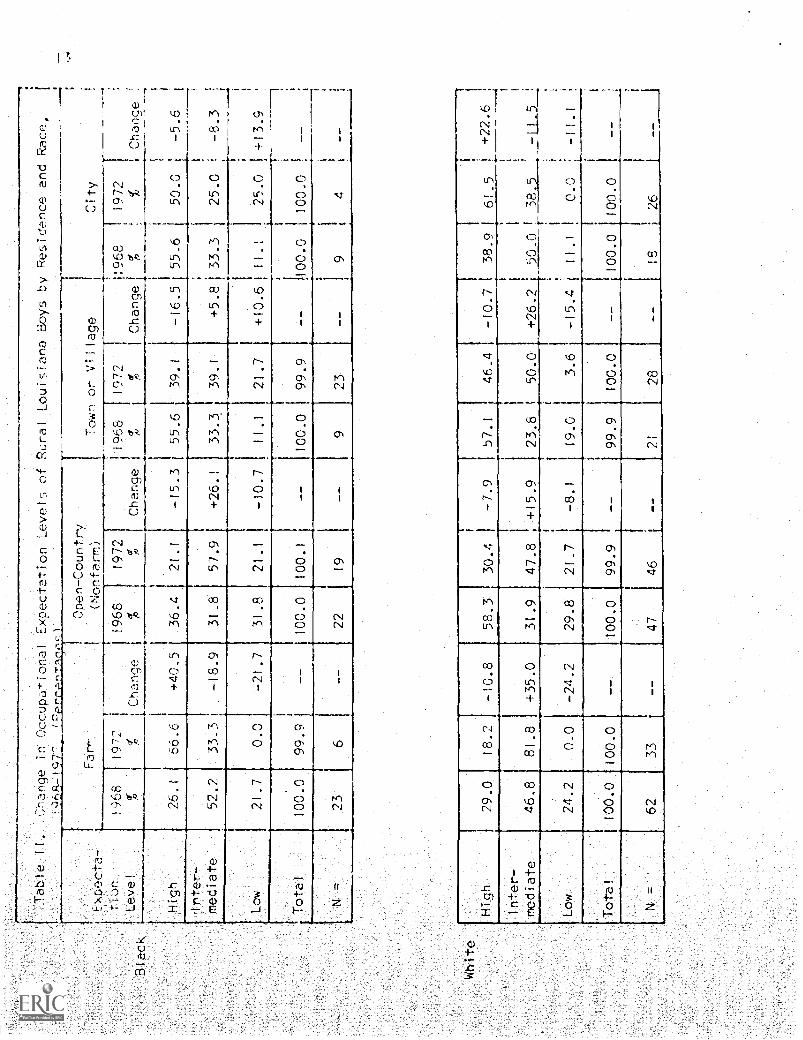
11.
Change in Occupational Expectation Levels of Rural Louisiana Boys by Residence and Race,
A-I
Open-Country
1;
Farm
Town or Village
City
1:xpec
_(Nonfarm)
(tion
1968
1972
1968
1972
1968
J1977
11968
11972
Level
cr P
1,
Change
%i
%Change
%1
%Changer
%'
%Chance
1 I
,
1 1
High
26.i
56.6
+40.5
36.4
21.1
-15.3
55.6
39.1
-16.51 55.6
50.0
i-5.6
1
----
Inter,
I
mediate
52.2
33.3
-18.9
31.8
57.9
+26.!
33.3
39.1
+5.81 33.3
25.0
!-8.3
,
:,
,--
r1
11
Low
21.7
O.
-21.7
31.8
21.1
-10.7
11.1
21.7
+10.6 1
11.1
25.0
I +13.9
.--1
i
Total
100.0
99.9
--
100.0
100.1
100.0
99.9
--
100.0
100.0
!
N =
23
6--
22
19
923
19
4i
--
11
1
High
29.0
1 8. 2
-10.8
58.3
30.4
1-7.9
57.1
146.4
-10.7
38.9 I
61.5
I+22.6
,
!
inter-
i
I
i
I
mediate
46.8
81.8
+35.0
31.9
47.8
+15.9
23.8
50.0
+26.2 i 50_0 It_ 38.5
1-11.5
!
i
Low
24.2
0.0
-24.2
29.8
21.7
-8.1
19.0
3.6
-15.4
t11.1
I0-0
-11.1
1
Ili
Total
100.0
100.0
100.0
99.9
99.9
100.0
--
1100.0
100.0
1
I
62
33
47
46
128
I
1 1
26
1
r whi
te
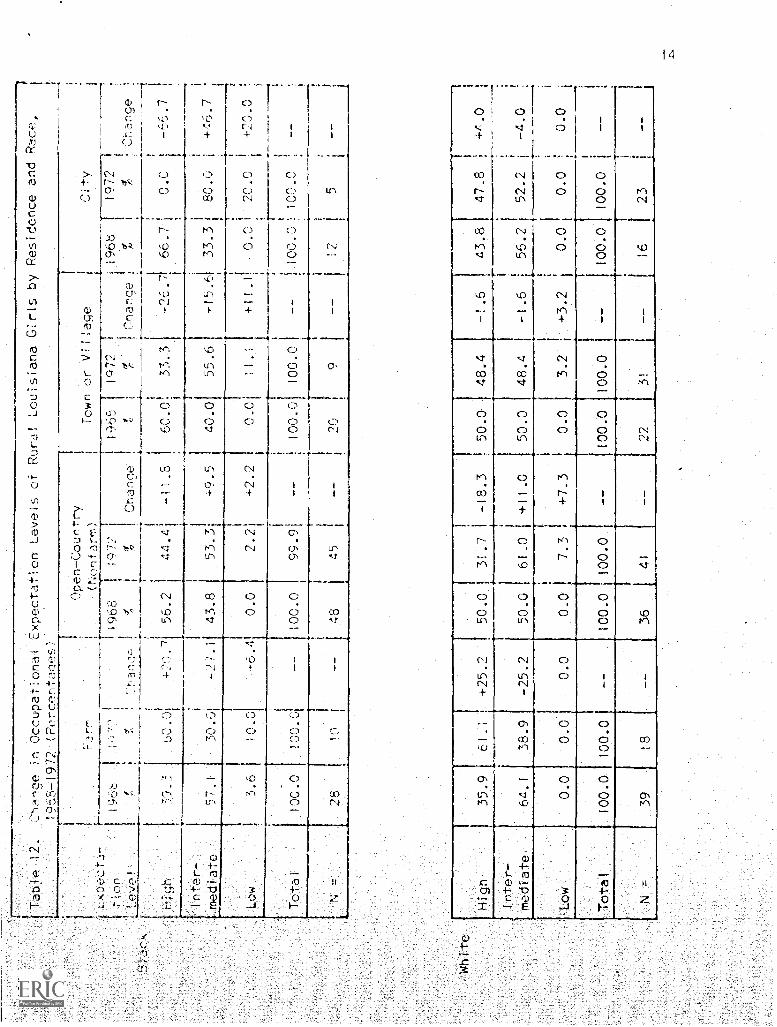
Table 12. Lge i
Occupational Expectation Levels of Rural Louisiana
Girls by Residence and Race,
1972 (Fercentao.es
on
eve!
.19- 71
.,
_.,
_",..._.
Open-Courstry
Farf-
(Nonfarm)
1968
11972
r'igh
Intert"
mediato
Cnance
ir
___ ,
Town or Village
iCity
i
i
;968j
072 I
i1968
i1972
I
1 i
,a,
:.,
%1 cna-,-.e
P,Lar,ge
4-;
--
-4
,. Je
60.
56.2
44.4
-41.8
it0.0
33.3
-26.71
66.7
C.C.
!
1,
!
0.
+20.7
57.1
30.3
-21.1
43.8
53.3
+9.5
I40.0
55.6
+15.61
33-3!
80.0
1+46.7
!
!
1
, 1i
0.0
2.21
+2.2
,0_0
11.1
+11.1
1
,,J
r..,,--,
t t20.0
!+70.0
1i
,1
1
!1
Z
II
-- ---.
100.0
100.0
99.91
1100.0
100.0 1
1 100.0 i
100.0
i
T!
.
/
1 11
i
28
10
48
45
20
912
Low
3.6
10.0
-6.4
Total.
100.0
15
1
High
35.9
61.1
+25.2
50.0
31.7
-18.3
,50.0
48.4
-1.6
143.8
47.8
i+1.0
,
Inter-
t,
i
mediate
64.1
38.9
-25.2
50.0
161.0
.
+11.0
50.0
48.4
-1.6
55.2
52.2
i-4.0
;-
,4
Low
0.0
0.0
0.0
0.0
7.3
+7.3
0.0
3.2
+3.2
0.0
0.0
'
0.0
i
Total
100.0
100.0
100.0
100.0
--
100.0
100.0
--
100.0
100.0
1
--
1N .-
39
18
--
36
I41
22
31
--
16
23
1

Black
White
Table 13.
Change in Anticipatory Deflection from Occupation& Aspirations
of Rural Louisiana
Boys by Resilience and Race, 1968 -1972 (Percentages)
1
Open-Country
i
---1'
f:arrl
(Nonfarm)
Town or Village
City
Anticipa7
- -s
tory
1968
f1972
1968
1972
1968
1972
i
1968
1972j
%t
Change
%%
Charlge I
%%
iC
//
Change
PhL.ng
Rt
I
iI
1-
None
52.2
66.7
+14.5
40.9
50.0
!+9.1
37.5
87.r.7,
+45.1
77.8
50.0
:-27.2
Upward
1
(+)
11111
16.
+12.4
13.6
11.1
-2_5
37.5
0.0
-37.5
0.0
25.0
;+25.0
Downward
r-,-
---t--
(_)
43.5
16.7
-26.8
45.4
38.9
-6_5
25.0
17.4
-7.6
22.2
25.0
i+2.2
;
t--i
otal
100.0
100.1
--
99.9
100.0
--
1100.0
100.0
--
100.0
100.0
i
--
111.1
23
6--
22
18
--
81
23
--
94
--
1
i--
-iNone
54.8
28.6! -26.2
65.9
65_2
-0.7
47.6
174.1
+26.5
1 44.4
6C.9
+16.5
;
---___
Upward
i-------
(+)
(1.3
57.!
+45.8
0.0
2.2
+2.2
19.0
14.8
-4.2
r1
11.1
21.7
+10.6
Downward
1
(_)
33.9
(4.3
-19.6
34.0
32.6
i-1.4
33.3
11.1
-22.2
'
44.4
17.4
-27.0
1
Total
100.0
100.0
--
99.9
100.0
--
99.9
100.0
1 99.9
100.0
--
(
1
N =
62
35
47
46
21
27
i
18
93
--
i I
Black
White
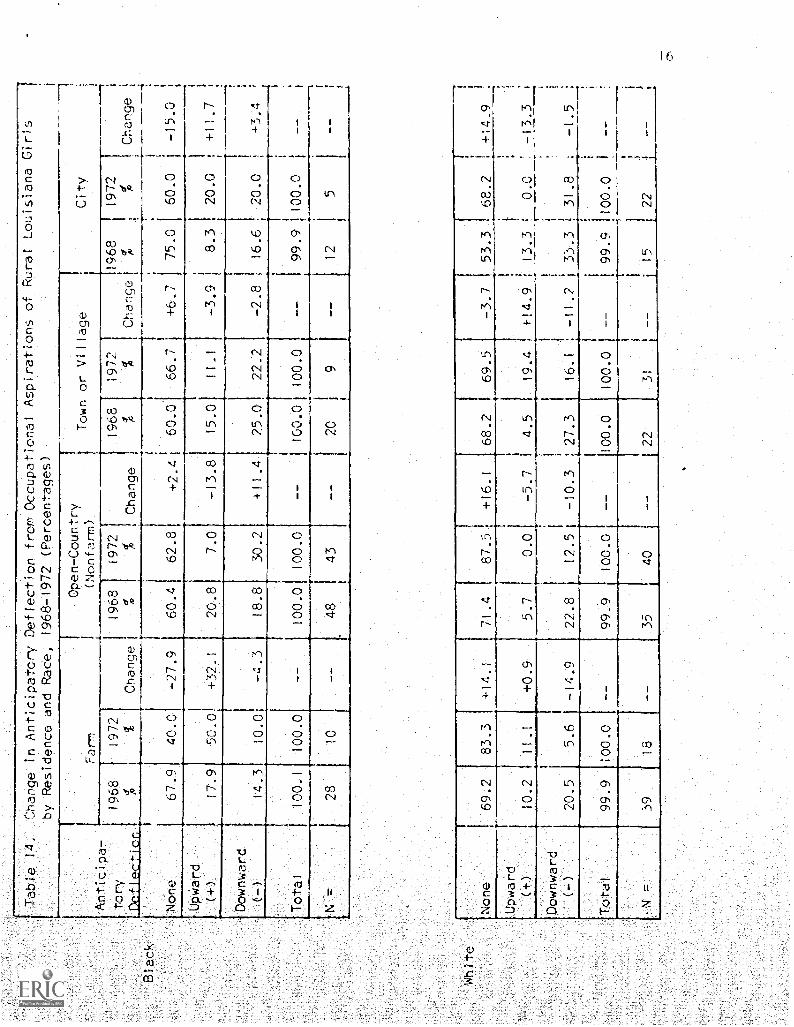
Table 14.
Change in Anticipatory Deflection from Occupational Aspiratjons of Ryral Louisiana
Girls
1
by Residence and Race, 1968-1972 (Percentages)
1
Open-Country
arm
(Nonfarm)
-1
Town or Village
City
1
Anticipa-
----;
tory:
1968
1972
1968
1972
1968
1972
11968
1972
1.-
%I
Change
%%
Change
a ,o
%Change!
%e
fChange
--f.
None
67.9
40.0
-27.9
60.4
62.8
+2.4
60.0
66.7
+6.7
1
75.0
60.0
1
-15.0
t 1
Upward
1
--I
(+)
17.9
50.0
+32.1
20.8
7.0
-13.8
15.0
11.1
-3.9
1
8.3
20.0
i
.
t+11.7
1
-
:
Downward
1
(-)
14.3
10.0
-4.3
18.8
30.2
+11.4
25.0
22.2
-2.8
16.6
20.0
i+3.4
4----
---4
Total
100.1
100.0
100.0
100.0
--
100.0
100.0
--
99.9
100.0
j
--
1
----1
=.-
28
10
--
48
43
--
20
9--
12
5!
--
1 1
None
69.2
83.3
+14.1
71.4
87.
1+16.1
68.2
69.5
-3.7
53.3
68.2
i+14.9
!
Upward
11
!
;
(+)
10.2
11.1
+0.9
5.7
0.01
-5.7
I4.5
S19.4
i+14.9
13.3
0.0:
-13.3
tr
Downward
!
.
;
( -)
20.5
5.6
-14.9
22.8
12.5
-10.3
27.3
16.1
-11.2
133-3
,31.8
-1.5
1
1
Total
99.9
100.0
--
99_9
100.0
--
100.0
100.0
--
199.9 1100.0
1--
1
,
39
18
35
40
22
31
1
-1
-j
15
122
1
Bla
ck
Whi
te
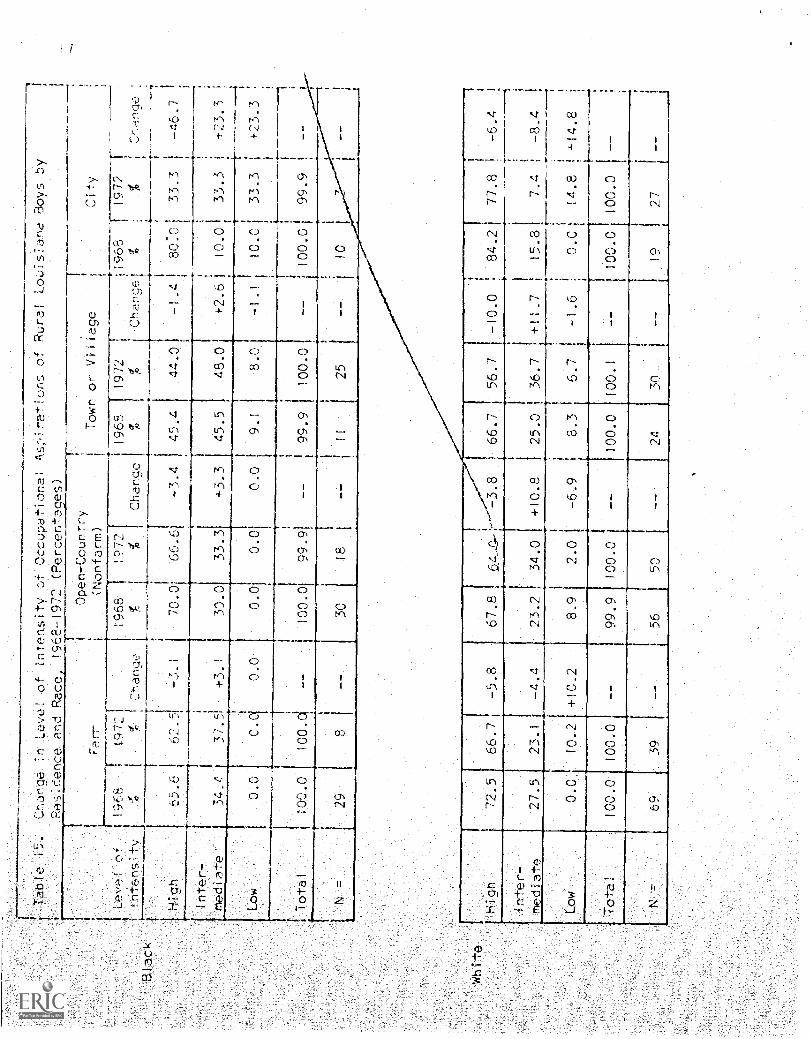
Table 1.,
Cnange in .Level of tntensity of Occupationa: Asirations of Rural Louisiana Boys by
Ridence and Race
1968-1972 (Percentages)
r---
Race
1-------7
Open-Country
I
Ran-
(Nonfarm)
Town or Vil age
-..,
Leye1
,.,7f
1968
.19721
1968 T
1972
1968
1972
ii968
F1972
Intensity
Y AO
1%
Change
%%1
,
Change
CI A
cf/..
Change!
%
Hich
65.6
I
-3.1
62.5
i
70.0
66.6!
-3.4
45.4
44.0
4-
--
J1
-1-4 i
80.01
33.3
-45.7
i!
Inter-
iI
. i
1! ,
.
mediate
34.4
77.d
+3.1
30.0
33.3
+3.3
45.5
48.0
+2.61
10.01
33.3
i+23.3
,:t.,_
t
Low
0:0
0.9
0.0
0.0
0.0
0.0
9.1
8.0
-1_1
1
10.01
33.3
i+23.3
.1
.
t
i I
--
I
---,
1;
Iota!
100.0
100.
100.0
99.9
--
99.9
100.0
--
f100.01
99.9
!
1, i
1
N =
29
8--
30
1
18
1
--
11
25
--
i
Hig
h72.5
66.7
-5.8
67.8
6L_- -3.8
166.7
56.7
-10.0
1
84.2!
77.8
!-6.4
Inter-
11
ii
mediat4,
27.5
23.1
-4.4
23.2
34.0
+10.8
125.0
36.7
+11.7
115.81
7.4
:-8.4
!
----
'.
Low
0.0
10.2
+10.2
8.9
2.0
-6.9
18.3
6.7
-1.6
,0.0
14.8
1 +14.8
i
i-
...
Total
100.0
100.0
--
99.9
100.0
--
100.0
100.1
--
100.01
100.0
1
--
1 i
N =
69
39
--
56
50
30
--
19
27
atack
White
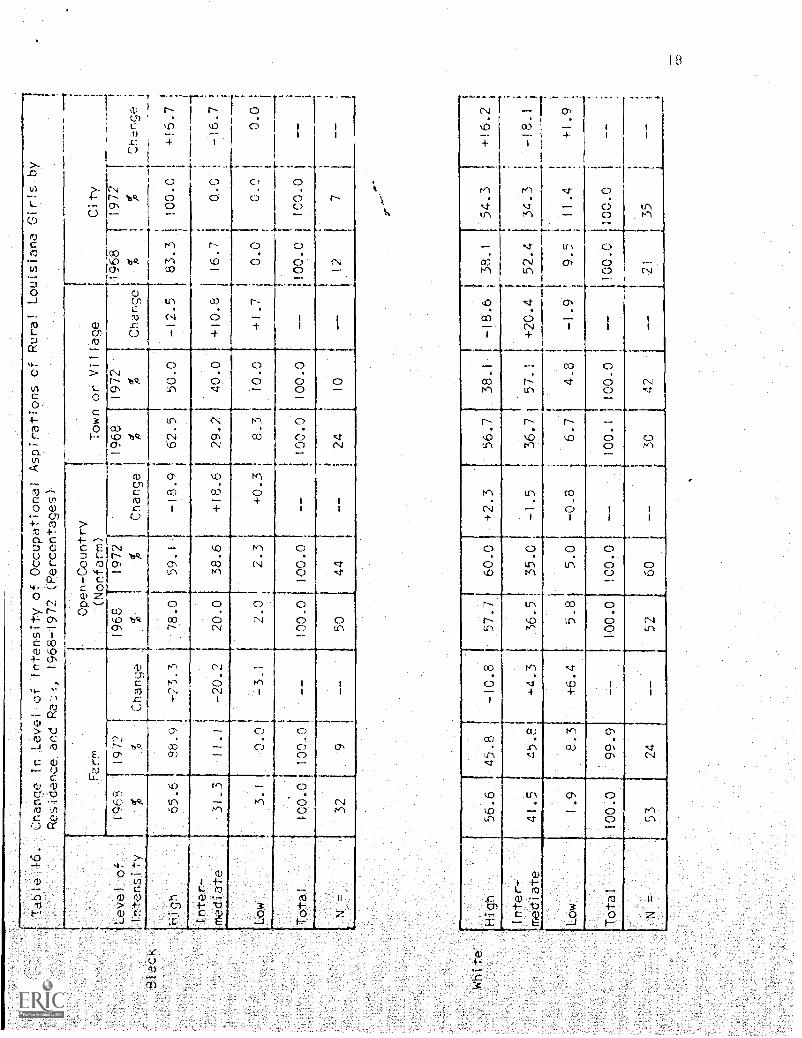
Table 16.
Cnange.in ,Leyelcf Intensity of Occupational Aspirations
of Rura! Louisiana Girls by
Residence, and Rait, 1968 -1972 (Percentages).
Level of
Intensit
19?"-.:8
107?
d
65.6
88.9
Change
Open-Country
(Nonfarm)
1968
1972
P%
Change
ti
Town or Village
City
1968
1968
1972
1972
I
AChange
%1
%
-23.3
78.0
59.1
-18.9
62.5
50.0
4
i
. 1
-12.5
83.3
1100.0
!+16.7
1
+10.8
16.7
10.0
i-16.7 i
1;
-1-
+1.7
0.0
10.0
!0.0 `
ir
s
100.0
1
100.0
i
1
38.6
12
7
High
56.6
45.8
-10.8
57.7
60.0
+2.3
56.7
38.1
1-18.6
;38.1
54.3
i
t t
+16.2
Inter-
mediate
41.5
45.81
+4.3
1
36.5
35.0
-1.5
36.7
57.1
+20.4
-,.;52.4
i :
9.5
-
134.3
r!
11.4
'
-18.1
i 1
+1.9
'
Low
1.9
8.3
+6.4
5.8
5.0
-0.8
6.7
4.8
-1.9
Total
100.0
99.9
100.0
100.0
100.1
1 100.0
--
1100.0
21
1100.0
i
35
__
__.
N =
53
24
--
52
60
--
30
42
--
---I--
BtacK
White
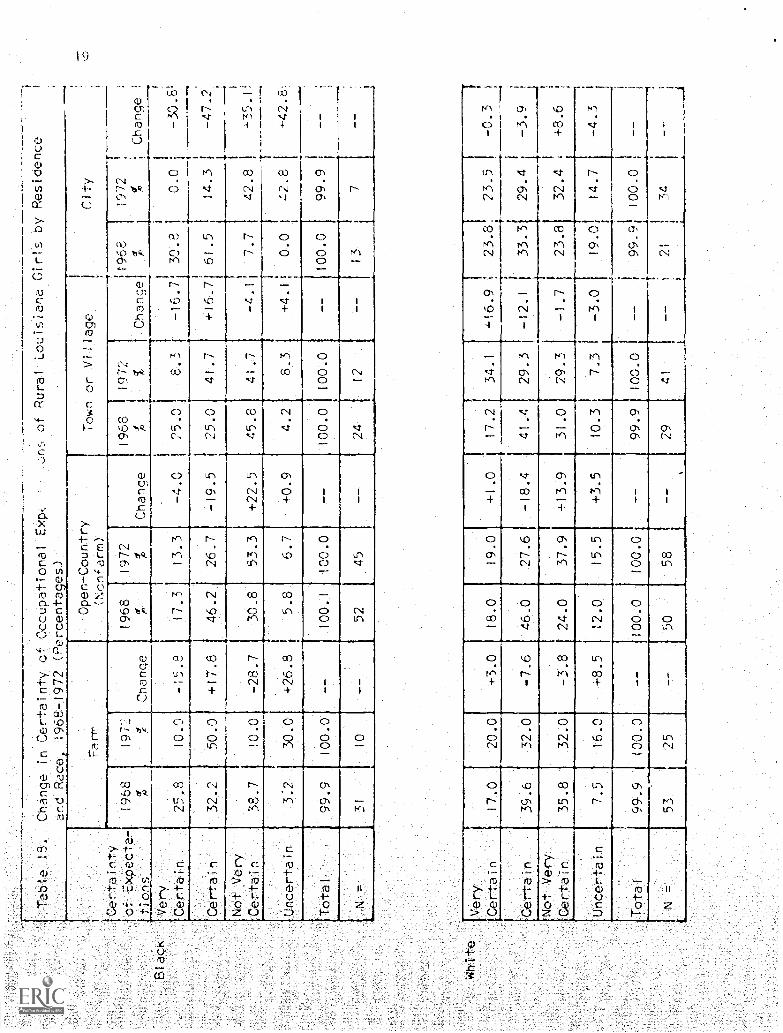
Table 13,
.Change in Certainty. otOccupational
.
and Race. 1968 -1972 (Percenta es)
.,:m5 of Rural Louisiana Girls by
Residence
Certainty
of Exbeete7
tionS
Farr,.
Open-Country
(Ncnfarm)
Town or Village
City
1968
0 P
197 %
Change
1968
/1972
4Change
1968
/ p
1972
%
11968
dIChange;
p
I1912
%;
Change
Very
Certain
25.8
10.0
-15.8
17.3
13.3
-4.0
25.0
8.3
-16.7. I
30.5
0.0
I
--I
i-30.8!
i-47.2.
ICertain
32.2
50.0
+17.8
46.2
26.7
-19.5
25.0
41.7
+16.7
61.5
14.3
Not Very
Certalh!
38.7
10.0
-28.7
30.8
53.3
+22.5
45.8
41.7
-4.!
7.7
42.8
1
--.. !
I-,-35.1
I+42.8:
Uncertain
3.2
30.0
+26.8
5.8
6.7
+0.9
4.2
8,3
---t
+4.1
1
0.0
42.8
Total
99.9
100.0
100.1
100.0
--
100.0
100.0
--
100.0
99.9
i ! 1 JN =
31
10
--
52
45
24
12
13
7
Very
I
Ir
Certain
17.0
20.0
+3.0
18.0
19.0
+1.0
17.2
34.1
416.9
i23.8/
23.5
-0.3
-i-
Certain
39.6
32.0
-7.6
46.0
27.6
-18.4
41.4
29.3
-12.1
I33.3
29.4
'29.4
-3 9
-3.9
Not Very
tI
Certain
35.8
32.0
-3.8
24.0
37.9
+13.9
31.0
29.3
-1.7
123.8
32.4
,+8.6
Uncertain
7.5
16.0
+8.5
12.0
15.5
+3.5
10.3
7.3
1--
-3.0
119.0
14.7
-4.3
Total
99.9
100.0
--
100.0
100.0
99.9
100.0
i
--
199 9
100.0
53
25
50
58
--
29
41
--
i21
34
.
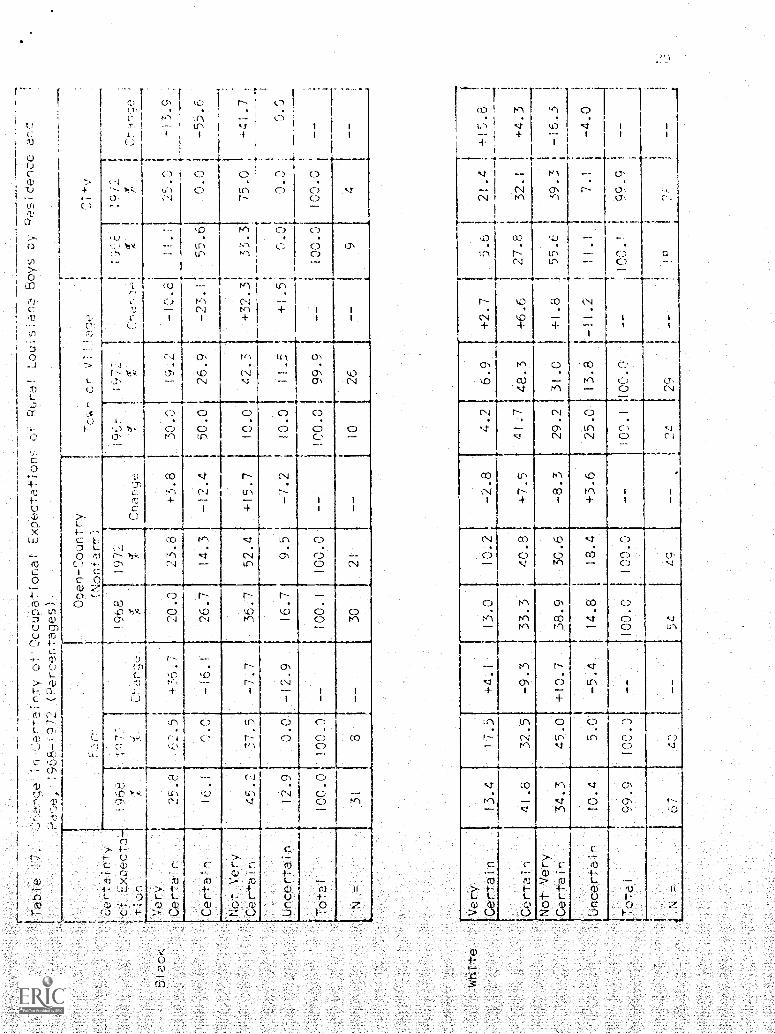
Tabit,
ncle
CerTainTy
Occupationa1 Expectations
Louis ar,L, Boys Dy P,-?s.:(4$.nce a!
:968-1972 (Percrtaqps)
Certa;rr'y
EYDeci-3
I-
Open-Country
CN.onfarrr
I1968
197.2
0`-anoe
1%
Town or
r
1:972
1I
Change
X
31acK
Very
Cer-ar
Whi
te
Certain
16.1
62'.5
+36.7
reN
-16.1
20.0
23.8
26.7
14.3
37.5
-7.7
,
1972
1
+3.8
30.0
19.2
I-10.81
11.1
-13.9
-12.4
150.0
26.9
1-27.11
55.5
-55.6
1
+15.7
10.01
42.3
+32.3:
35.3
75.0
+41.7
Uncer -ain
12.9
0.0
-12.9
16.7
9.5
-7.2
10.01
11.5
r--
o ar
100.0
100.0
100.1
100.0
I100.0!
99.9
+1.5;
0.01
0.0
0.0
-----t
f-
i_
I
,,Ir.,
r,
fr,s
0t,,
.."'..
...-,
..;1
-...
i
I9
1
1
--
Very
Certain
13.4
17.5
+4.i
13.0
-2.8
4.2
6.9
1+2.7
15.6
i21.4
, !+15.8
Certain'
41.8
32.5
-9.3
33.3
_10.2
40.8
+7.5
41-7
48.3
+6.6
2,-,7,
4
; i32.1
1i
1+
4.3
Not
,
Certain
Very
34.3
45.0
+10.7
38.9
30.6
-8.3
29.2
31.0
+1.8
55.6
4
i
39.3
1 $-16.3
!
!
Uncertain
10.4
5.0
-5.4
14.8
18.4
+3.6
25.0
13.8
-!1.2
11
7.1
i-4.0
,otal
99.9
100.0
100.0
100.0
--
I00.1
100.0
--
10.1
1
--
iN =
367
-e-,
-,
--
54
cc
--
7)4
29
t .
1 IS
--.,
rr
i--
____
_4
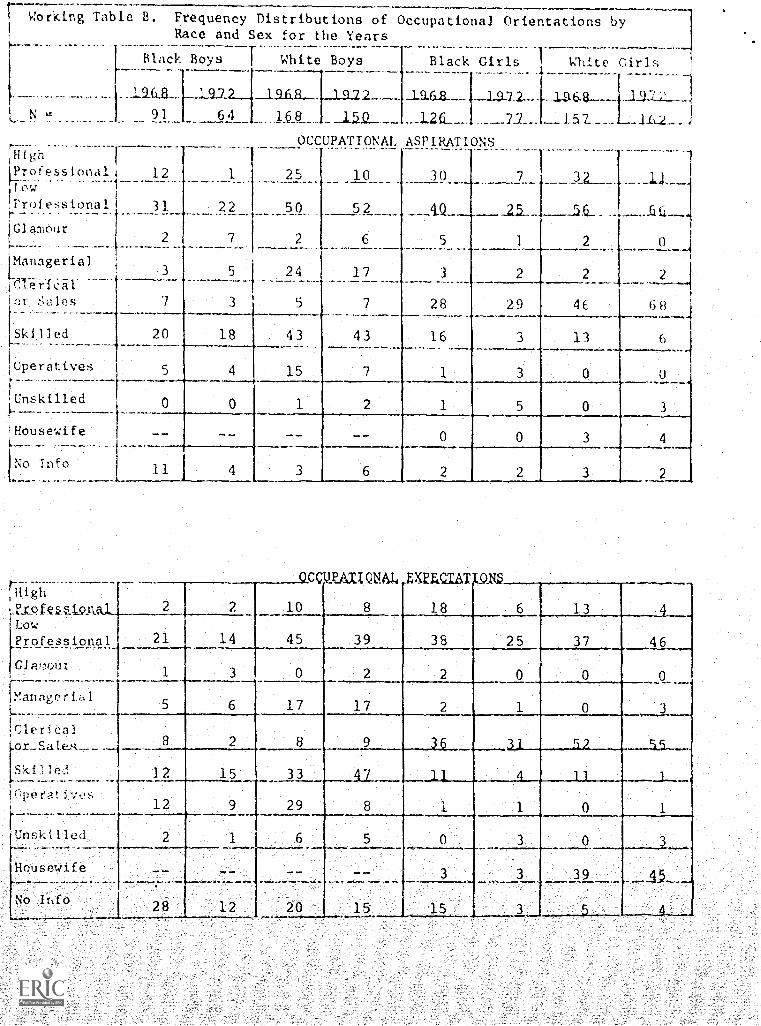
r Working Table B. Frequency Distributions of Occupational Orientations byRace and Sex for the Years
Black Boys|
White Boys Black Girls White Girls1 .
La 19E8 1972 a.9-6.a. __.1..9.3 2_ _La6..s.._. ..u.:,?2..... ,
OCCUPATIONAL ASPIRATIONS__iHigh
I11)rofess 1 onal 4 12 1 25 10 30 7 32 ...1._j___iLoW
ftrofessional 31 _....22_. __ ._50_ _ 5 ......1Q____25._. __.5__ _ ,_ .__...j ii____
i c ianour2 7 2 6
[Managerial
(1.iirlil-----3 5 1 24 17
ot Sales 3 5 7
20 18 43 43 16 3 13 6
15 7 1 3 0 0- , ,.
Skilled
Operatives
Unskilled
'Housewife
INo Info
3 2 2 2
28 29 4 -
11
riligh
.e_rOfignal.._ 2
LowProfesional 21
GfaT:4)ur______
Managerial
Clericalox_Sate,s__
Skilld
Operativs
Unskf lied
Housewife
' o Info
1
0
2
5
0
2
ccutAII4NAL XEECIAI 05
10 8 18
45 39 38 25
0 3
3 4
3 2
13
0 2
17
8 9
15 33 47
9 29 8
37
0
4
0 1
O 3
39
1
1 6 5 0
3
28 I 12 20 15 15 3 5
c on t inued
e 13 (')-5:1-i C NJ,,96 19 7 2 | 1968_ 19.7.2 ._1968 j. _1972 _196 (
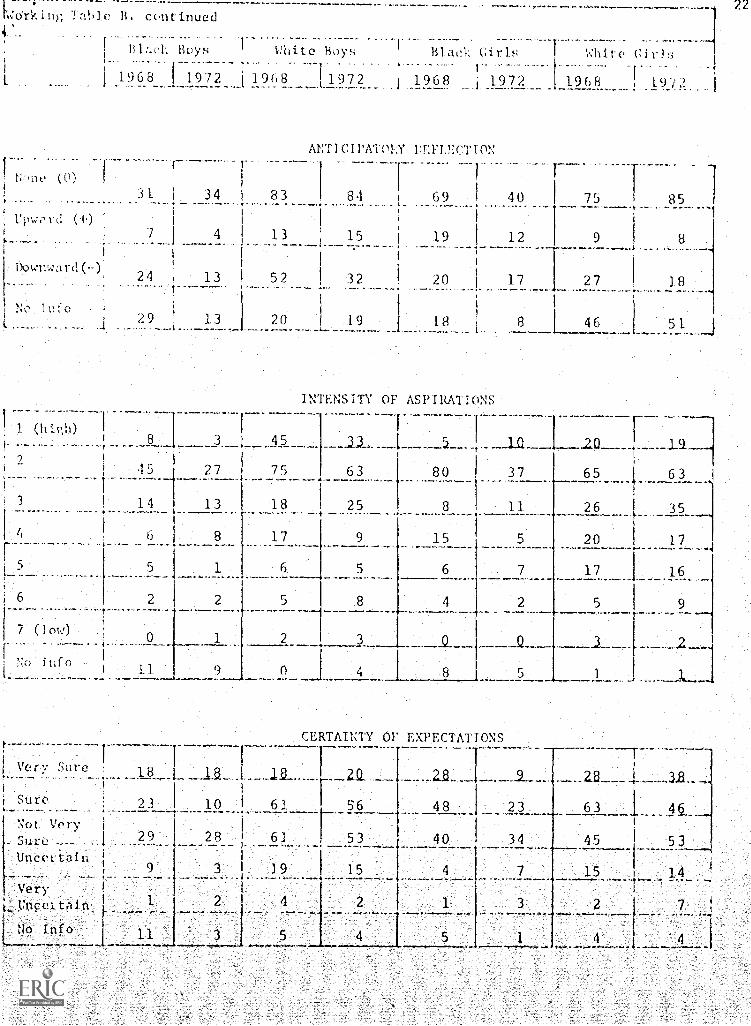
ANTI C I PATOIN ION
0,)31 34 83 84I
69 40 7b
f
i i I
I1..pwo rd (-4.) '1
; , 7 4 I 13 15 19I
12 9 I 8i
1 I
1 Wk.:y:43 rd (--), 1
i 11
24 i 13 ! 52 32 20!
17 27 18
1, ,,,o i
i,: tilio i
29 : 13 20 1
119 18__ 8 I.46 51 j
INTENSITY OF ASPIRATIONS
1 (1-1 ip,11)..1 8 3 1 45 3 1
1 1
i 4 i5 27 75 63
3 14
- y - - I -5_ - ._ 1_9_
80 37 65 1 63
13 | 18 25 8 11
4 6 8 17
s
6
7 (1ow)
No iof n11
5 1 6
2 2 5
9
9
5
8
2 3
Very Sure 18 1.8''Sure
Not VerysureUncer tain
23 | 1.9
29 28
9
Verypncei t 1 n,
t No Info
2
3
4
26 35
20 17
17 16
5 9
19
4
5 4
2 1
CERTAINTY OF FUECTATIONS
_1 2
56 48 23
61 .53 40 34
15 4 7
3
5 1
63
45 53
15 14
2 7
4 4 I
22


![[XLS]static.springer.comstatic.springer.com/sgw/documents/1372031/application/... · Web view0 1972 1973 1973 1973 1973 1974 1974 1974 1974 1974 1974 1974 1974 1974 1974 1974 1974](https://img.pdfslide.us/doc/110x75/5ae3d8767f8b9a5d648e7b9b/xls-view0-1972-1973-1973-1973-1973-1974-1974-1974-1974-1974-1974-1974-1974-1974.jpg)