Embed Size (px)
Citation preview

Notch-RBP-J Signaling Regulates IRF8 to Promote Inflammatory Macrophage PolarizationHaixia Xu, Jimmy Zhu, Sinead Smith, Julia Foldi, Baohong Zhao, Allen Y. Chung, Hasina Outtz, Jan Kitajewski, Chao Shi, SilvioWeber, Paul Saftig, Yueming Li, Keiko Ozato, Carl P. Blobel, Lionel B. Ivashkiv & Xiaoyu Hu.
Nature Immunology doi:10.1038/ni.2304

3 60LPS (h)
40
20
60
0
Il10
mR
NA
(rel
ativ
e)
RBP-J-KOWT
Supplementary Figure 1 Characterization of RBP-J-deficient macrophages. (a) Quantitative PCR of Rbpj mRNA expression in BMDMs from Rbpjflox/flox, Mx1-Cre (RBP-J-KO) mice and Rbpj+/+, Mx1-Cre (wild-type; WT) littermate controls. Results are averaged from 8 independent experiments. (b) Immunoblot analysis of RBP-J expression in whole cell lysates of BMDMs from Rbpj+/+, Mx1-Cre (WT) and Rbpjflox/flox, Mx1-Cre (RBP-J-KO) mice, stimulated with LPS for 1 h. Data are representative of 2 experiments (c) Quantitative PCR of Il10 mRNA expression in BMDMs from Rbpj+/+, Mx1-Cre (WT) and Rbpjflox/flox, Mx1-Cre (RBP-J-KO) mice, stimulated with LPS for 3 or 6 h. Means + SD of triplicate determinants are shown. One representative experiment out of at least three performed is shown. (d) Quantitative PCR of mRNA expression of the indicated genes in Rbpj+/+, Mx1-Cre (WT) and Rbpjflox/flox, Mx1-Cre (RBP-J-KO) mice, stimulated with LPS for 3 or 6 h. Data are graphed as percentage of mRNA expression in WT cells. Cumulative data from 7 independent experiments is shown. *P <0.01 (Student’s t test). Jmjd3 (Jumonji domain containing 3) encodes a histone demethylase that is essential for M2 polarization. Siglece (sialic acid binding Ig-like lectin E) encodes a receptor that negatively regulates TLR-induced inflammatory responses. Pilra (paired Ig-like type 2 receptor alpha) encodes an inhibitory receptor that recruits phosphatases.
80
c
RBP-J-KO
b
– + – +
WT
LPS:
RBP-J
p38
1.00
0.19
0
0.2
0.4
0.6
0.8
1
1.2
aRBP-J-KOWT
Rbp
jmR
NA
Jmjd
3 m
RN
A (%
of W
T)
*
500
250
0
750
1000
*
Pilr
am
RN
A (%
of W
T)
600
300
0
900
RBP-J-KOWT
800
400
0
*
Sig
lece
mR
NA
(% o
f WT)
d
RBP-J-KOWTRBP-J-KOWT
Nature Immunology doi:10.1038/ni.2304

Supplementary Figure 2 Involvement of upstream Notch signaling components in the expression of RBP-J-dependent M1 genes. (a) Quantitative PCR for Il12b mRNA expression in BMDMs from wild-type (WT) and ADAM17-deficient (ADAM17-KO) mice, stimulated with LPS for 3 h. (b) Quantitative PCR for Notch1 mRNA expression in BMDMs from wild-type (WT) and Notch1+/- mice. (c) Quantitative PCR for Il12b mRNA expression in BMDMs from Notch1+/- mice and wild-type (WT) controls, transfected with control (ctrl) non-targeting or Notch2specific siRNA and treated with LPS for 3 h at 4 d post-transfection. Means + SD of triplicate determinants are shown. Data are representative at least two independent experiments
0
250
500
750
- 1 ng/ml
Il12b
mR
NA
LPS–
a
750
500
250
0
ADAM17-KOWT
c
0
25
50
75
- 6 Hr
25
0
50
75
LPS
Il12b
mR
NA
WT + ctrl siRNAWT + Notch2 siRNANotch1+/– + ctrl siRNANotch1+/– + Notch2 siRNA
0.0
0.6
1 .2
1 .8
1
Not
ch1
mR
NA
0
0.6
1.2
1.8
bNotch1+/–WT
–
Nature Immunology doi:10.1038/ni.2304

Supplementary Figure 3 Phenotypes of NICD1M macrophages. (a) Cells counts of adherent BMDMs from wild-type (WT) and NICD1M paired littermates, following culture of bone marrow cells in conditioned medium containing M-CSF for 5 d. Cell counts from two independent experiments are shown. (b) Morphology of BMDMs at day 5 of culture from wild-type (WT) and NICD1M mice is shown. (c) Flow cytometry analysis of cell surface expression of CD11b and F4/80 in BMDMs from wild-type (WT) and NICD1M mice. (d) Quantitative PCR assays of Hes1 mRNA expression in resting BMDMs from wild-type (WT) and NICD1M mice. Data are representative of at least 2 independent experiments
d
010203040506070
NICD1MWT
Hes
1 m
RN
A
0
10
20
30
40
a
WT NICD1M
Cel
l num
ber (
x106
)
b
c
WT NICD1M
Exp. 1
Exp. 2
100 101 102 103 104
F4/80-PE
100
101
102
103
104
CD
11b-
APC
0.815
64.422.6
12.2
100 101 102 103 104
F4/80-PE
100
101
102
103
104
CD
11b-
APC
0.654
66.523.2
9.62
WT NICD1M
Nature Immunology doi:10.1038/ni.2304
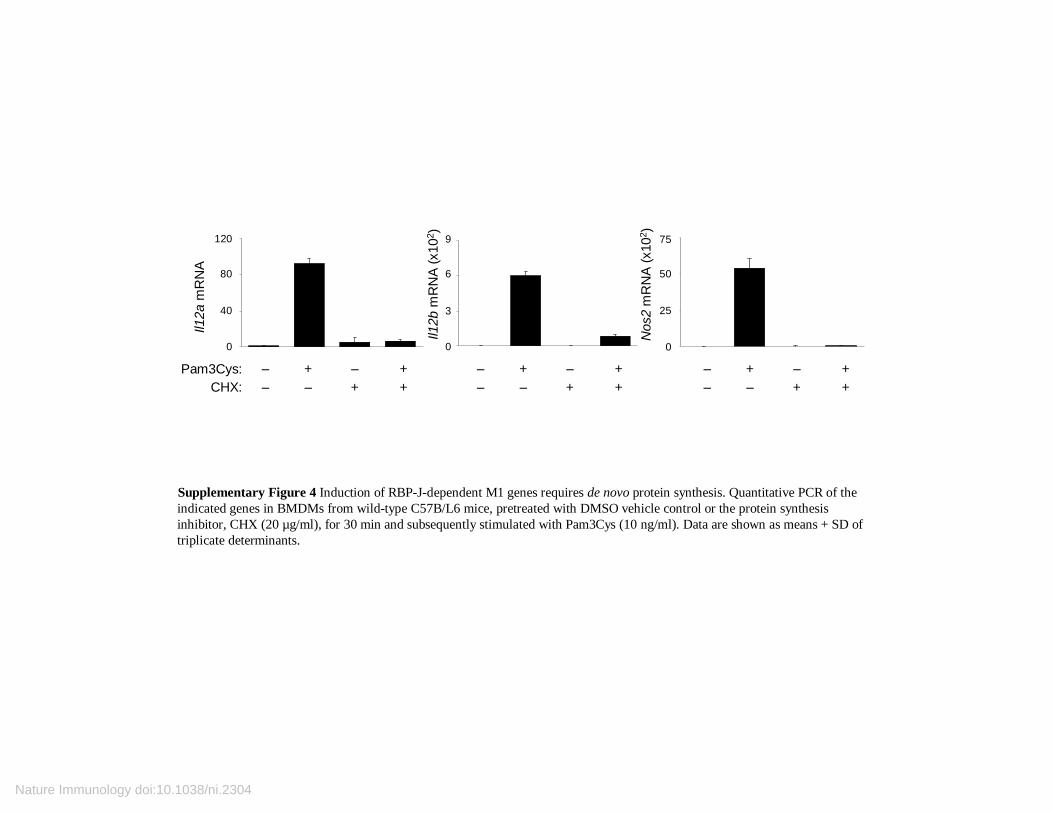
Supplementary Figure 4 Induction of RBP-J-dependent M1 genes requires de novo protein synthesis. Quantitative PCR of the indicated genes in BMDMs from wild-type C57B/L6 mice, pretreated with DMSO vehicle control or the protein synthesis inhibitor, CHX (20 µg/ml), for 30 min and subsequently stimulated with Pam3Cys (10 ng/ml). Data are shown as means + SD of triplicate determinants.
– + –CHX: – – +
0.00
40.00
80.00
120.00120
80
40
0
Il12a
mR
NA
0.00
300.00
600.00
900.00
- DMSO + Pam CHX CHX + Pam
9
6
3
0
Il12b
mR
NA
(x10
2 )
0.00
2500.00
5000.00
7500.00
- DMSO + Pam CHX CHX + Pam
50
25
0
Nos
2 m
RN
A (x
102 ) 75
Pam3Cys: ++
– + –– – +
++
– + –– – +
++
Nature Immunology doi:10.1038/ni.2304

–0
5
10
15
20
Supplementary Figure 5 Expression of IRFs in macrophages. (a) Immunoblot of IRF8 expression in BMDMs from wild-type (WT) and IRF8-deficient (Irf8-/-) mice, treated with LPS. (b) Immunoblot of IRF4 and IRF5 expression in BMDMs from Rbpj+/+, Mx1-Cre (wild type; WT) and Rbpjflox/flox, Mx1-Cre (RBP-J-KO) mice, stimulated with LPS. (c) Quantitative PCR of Nos2 mRNA expression in BMDMs from Rbpj+/+, Mx1-Cre (WT) and Rbpjflox/flox, Mx1-Cre (RBP-J-KO) mice, transducedwith an IRF8-expressing retrovirus or a control (ctrl) virus and stimulated for 6 h with LPS at 48 h post-transduction. (d) Quantitative PCR or Tnf mRNA expression in BMDMs from wild-type C57B/L6 mice, treated with LPS. (e) Quantitative PCR of Irf8 mRNA expression in BMDMs from wild-type mice, incubated with or without IFN-γ (10 ng/ml) for 24 h and subsequently stimulated with LPS. (f) Immunoblot of IRF8 protein expression in BMDMs from Rbpj+/+, Mx1-Cre (WT) and Rbpjflox/flox, Mx1-Cre (RBP-J-KO) mice, stimulated with LPS for 1 h and subsequently treated with CHX (20 µg/ml) for the indicated periods. Protein extracts from WT and RBP-J-KO cells were run on the same gel for comparison. However, due to diminished expression of IRF8 in the RBP-J-KO cells, the signals on the right half of the gel are weak. An image with prolonged exposure where IRF8 expression and the kinetics of IRF8 protein decay can be clearly appreciated in RBP-J-KO cells is shown in Fig. 5b.
p38
IRF8
LPS (min): 0 30 60 90 0 30 60 90WT Irf8 –/ –
a
b– 5 15 30 60180 – 5 15 30 60 180
WT RBP-J-KOLPS (min):
p38
IRF5
IRF4
c
RBP-J-KO + ctrl virusWT + ctrl virus
RBP-J-KO + IRF8 virus
Nos
2 m
RN
A (x
102 )
LPS–
d
Tnfm
RN
A
LPS (min)0 15 30 60 180
0.00
2.00
4.00
6.00
- LPS LPS + IFNLPS IFN-+LPS
Irf8
mR
NA
6
4
2
0
e
–
fWT
0 40 80 120 160180 200CHX (min):RBP-J-KO
0 40 80 120160180 200
p38
IRF8
20
10
5
0
15
Nature Immunology doi:10.1038/ni.2304

5 15 30 60180
p38
WT RBP-J-KOLPS (min):
p-JNK
5 15 30 60 180
c
IRAK1
MKK3
LPS (min): 0 5 15 30 60 180 0 5 15 30 60 180WT RBP-J-KO
d
Irak2
mR
NA
(rel
ativ
e)
0.5
1.0
1.5
WT NICD1M
a
– – siRNA: Ctrl IRAK2
e
IRAK2
p38
p-MKK3-MKK6
p-p38
p38
LPS (min): 0 15 30 0 15 30Ctrl siRNA
f
p-MEK1-MEK2
p-Erk1-Erk2
Erk1-Erk2
IRAK2 siRNA
p-JNK
JNK
g
LPS (min): 0 15 30 0 15 30Ctrl siRNA IRAK2 siRNA
b
WT RBP-J-KO
p-p3
8 (r
elat
ive)
*
p-E
rk1-
Erk
2 (r
elat
ive)
0.4
0
0.8
1.2
WT RBP-J-KO
*
0.4
0
0.8
1.2
Supplementary Figure 6 Expression and activation of signaling molecules in RBP-J-deficient and NICD1M macrophages. (a) Immunoblot analysis of p-JNK in whole cell lysates of BMDMs from Rbpj+/+, Mx1-Cre (wild-type; WT) and Rbpjflox/flox, Mx1-Cre (RBP-J-KO) mice, treated with LPS. p38 expression serves as a loading control. (b) Quantitation of band intensities of p-Erk1-Erk2 (Fig. 6c) and p-p38 (Fig 6d) expression in BMDMs from Rbpj+/+, Mx1-Cre (WT) and Rbpjflox/flox, Mx1-Cre (RBP-J-KO) mice using Image J software.*P<0.01 (Student’s t test). (c) Immunoblot analysis of IRAK1 in whole cell lysates of BMDMs from Rbpj+/+, Mx1-Cre (WT) and Rbpjflox/flox, Mx1-Cre (RBP-J-KO) mice treated with LPS. MKK3 expression serves as a loading control. (d) Quantitative PCR for Irak2 mRNA expression in BMDMs from wild-type (WT) and NICD1M mice. (e) Immunoblot analysis of IRAK2 expression in wild-type BMDMs, transfected with control (ctrl) non-targeting or IRAK2specific siRNA at 2 d post-transfection. (f, g) Immunoblot analysis of the indicated proteins in wild-type BMDMs, transfected with control (ctrl) non-targeting or IRAK2specific siRNA and stimulated with LPS for the indicated periods at 2 d post-transfection. One representative experiment out of three performed is shown.
Nature Immunology doi:10.1038/ni.2304

Supplementary Figure 7 The effects of MAPK and MNK inhibition on gene expression. (a) ELISA analysis of IL-12p40 expression in the supernatants from wild-type BMDMs, pretreated with MAPK inhibitors and stimulated with LPS for 6 h. One representative experiment out of three performed is shown. (b) Quantification of IRF8 band intensities (Fig. 8d) using ImageJ software, relative to loading controls, in LPS-stimulated conditions (as in lane 3 versus lane 4) from five independent experiments. *P<0.01 (Student’s t test). (c) Quantitative PCR for Irf8 and Mnk1 mRNA expression in wild-type BMDMs, transfected with control non-targeting (ctrl) or MNK1-specific siRNA at 2 d post-transfection. (d) Quantitative PCR for Il10 mRNA expression in wild-type WT BMDMs, pretreated with increasing doses of the MNK inhibitor CGP57380 for 30 min and stimulated with LPS for 3 h. Results are representative of at least two independent experiments.
Irf8
mR
NA
Mnk
1 m
RN
A
0.4
0
0.8
1.2
0.5
0
1.0
1.5
Ctrl MNK1siRNA
c
d
DMSOCGP57380
LPS
45
30
15
0
Il10
mR
NA
IL-1
2p40
(ng/
ml)
12
8
4
0
U0126:SB203580:SP600125:
++ + ++ ++ +
++ + +
a
–
–––
–
–––
–
–––
––
–
–
b
0.4
0
0.8
1.2
Ctrl MNK1siRNA
IRF8
pro
tein
(rel
ativ
e)
*
Ctrl MNK1siRNA
Nature Immunology doi:10.1038/ni.2304

Notch1
NIC
D1-secretase
RBP-J
TLR4
Prot
ein
synt
hesi
s
ADAM10
IRF8
M1-associated genes(Il12a, Il12b, Nos2)
MNK1
eIF4E
IRAK2
MAPK
M2-associated genes(Jmjd3 et al.)
Supplementary Figure 8 A model of coordinated regulation of M1 versus M2 transcription programs by RBP-J. In macrophages, Notch1-RBP-J signaling via ADAM10 and γ-secretase is essential for TLR4-induced expression of a subset of prototypical M1 genes. RBP-J targets TLR4 signaling components IRAK2 and MAPKs to augment activity of the MNK1-eIF4E axis that promotes TLR4-induced IRF8 protein synthesis. Subsequently, RBP-J enhances recruitment of IRF8 to the target gene promoters and promotes induction of M1 genes such as Il12a, Il12b, and Nos2, whose expression is IRF8-dependent. In addition, RBP-J also suppresses expression of genes essential for M2 polarization such as Jmjd3. Thus, RBP-J regulates the balance between alternative macrophage differentiation programs by supporting the M1 phenotype while blocking M2 polarization.
Nature Immunology doi:10.1038/ni.2304
![Notch Signaling Pathway - adipogen.com · coordinate activation of this signaling pathway [3]. FIGURE 1: Notch Receptors and their Ligands. Mammals possess four Notch receptors (Notch1–4)](https://img.pdfslide.us/doc/110x75/5d4b2a7688c99342638ba60b/notch-signaling-pathway-coordinate-activation-of-this-signaling-pathway-3.jpg)