Embed Size (px)
Citation preview
Cell Reports
Supplemental Information
Notch Is Required for Inflammatory
Cytokine-Driven Goblet Cell Metaplasia in the Lung
Henry Danahay, Angelica D. Pessotti, Julie Coote, Brooke E. Montgomery, Donghui Xia, Aaron Wilson,
Haidi Yang, Zhao Wang, Luke Bevan, Chris Thomas, Stephanie Petit, Anne London, Peter LeMotte, Arno
Doelemeyer, Germán L. Vélez-Reyes, Paula Bernasconi, Christy J. Fryer, Matt Edwards, Paola Capodieci,
Amy Chen, Marc Hild, and Aron B. Jaffe
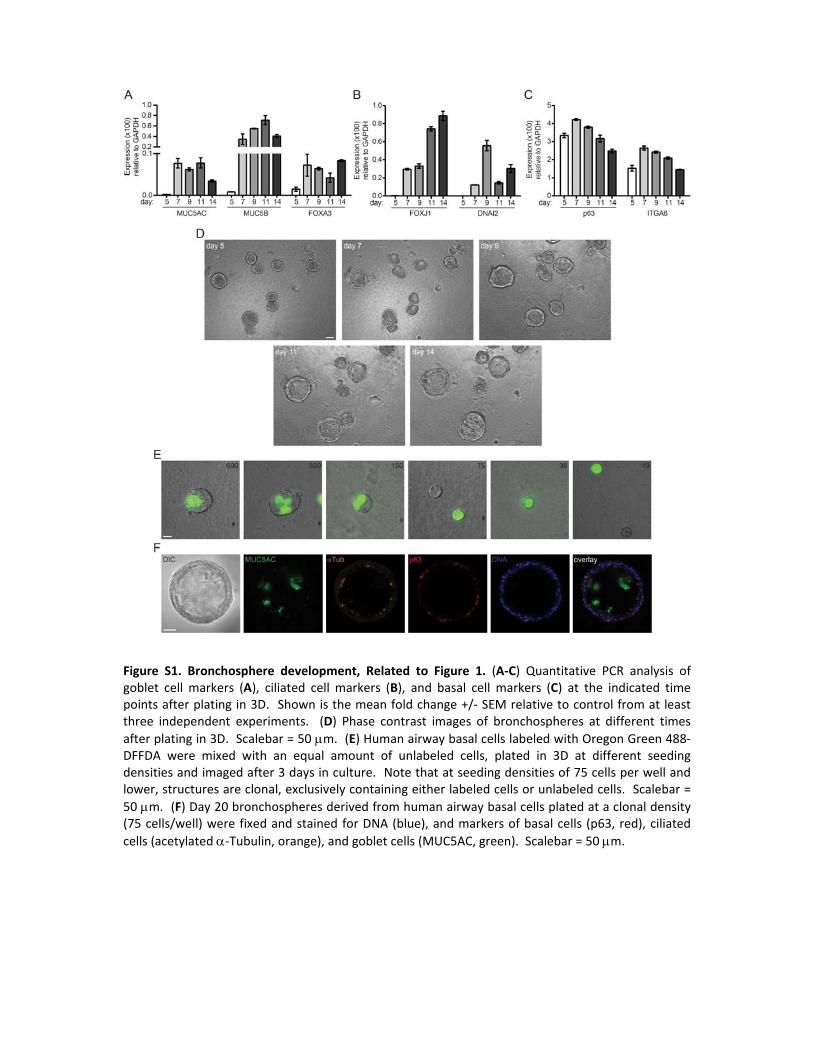
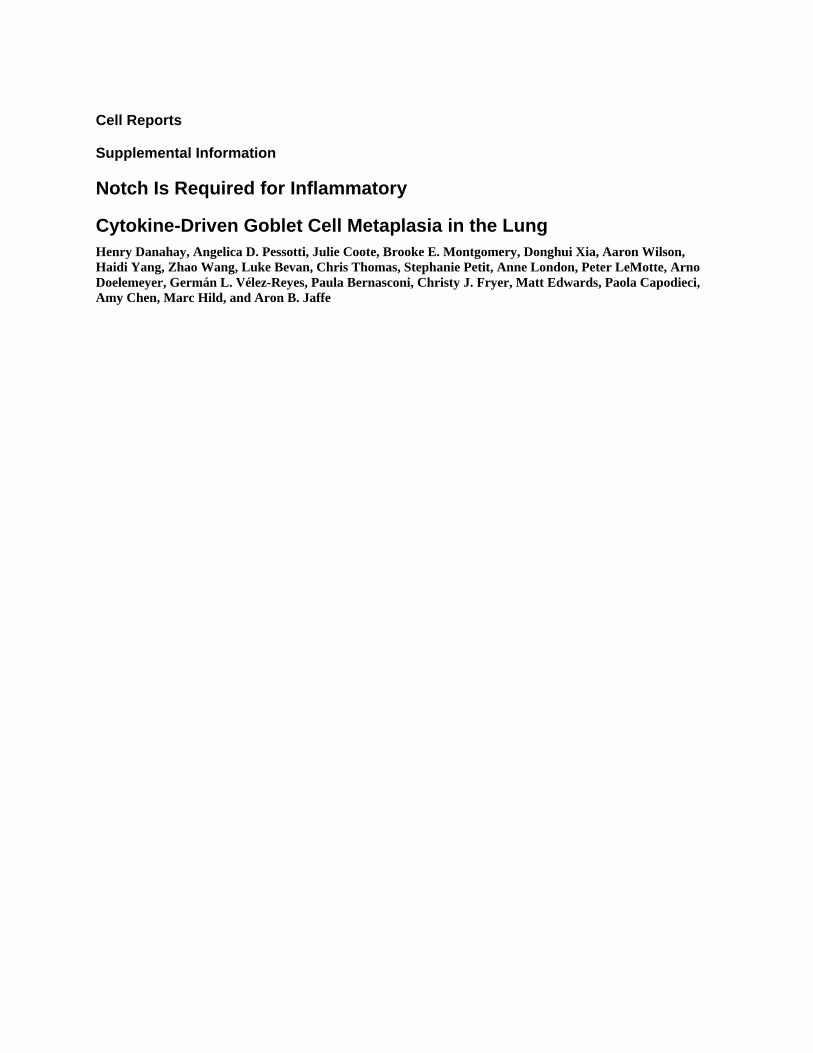
Figure S1. Bronchosphere development, Related to Figure 1. (A‐C) Quantitative PCR analysis of goblet cell markers (A), ciliated cell markers (B), and basal cell markers (C) at the indicated time points after plating in 3D. Shown is the mean fold change +/‐ SEM relative to control from at least three independent experiments. (D) Phase contrast images of bronchospheres at different times
after plating in 3D. Scalebar = 50 m. (E) Human airway basal cells labeled with Oregon Green 488‐DFFDA were mixed with an equal amount of unlabeled cells, plated in 3D at different seeding densities and imaged after 3 days in culture. Note that at seeding densities of 75 cells per well and lower, structures are clonal, exclusively containing either labeled cells or unlabeled cells. Scalebar =
50 m. (F) Day 20 bronchospheres derived from human airway basal cells plated at a clonal density (75 cells/well) were fixed and stained for DNA (blue), and markers of basal cells (p63, red), ciliated
cells (acetylated ‐Tubulin, orange), and goblet cells (MUC5AC, green). Scalebar = 50 m.
Figure S2. Effect of IL‐13 on basal cell fate during bronchosphere development, Related to Figure 2. IL‐13 treatment promotes goblet cell formation at the expense of ciliated cells. (A) Human airway basal cells were grown in 3D in the presence of increasing concentrations of IL‐13, and analyzed for expression levels of the indicated goblet cell markers (top row), ciliated cell markers (middle row), and basal cell markers (bottom row). Shown is the average fold change +/‐ SEM relative to control from five independent experiments. *p<0.05; **p<0.01; ****p<0.0001. One‐way ANOVA and Dunnett’s Multiple Comparison Test. (B,C) Day 14 bronchospheres grown in the presence of 1 ng/ml
IL‐13 (C) or vehicle control (B), and stained for DNA (blue), acetylated ‐Tubulin (orange), MUC5AC
(green), and actin (red). Scalebar = 25 m.
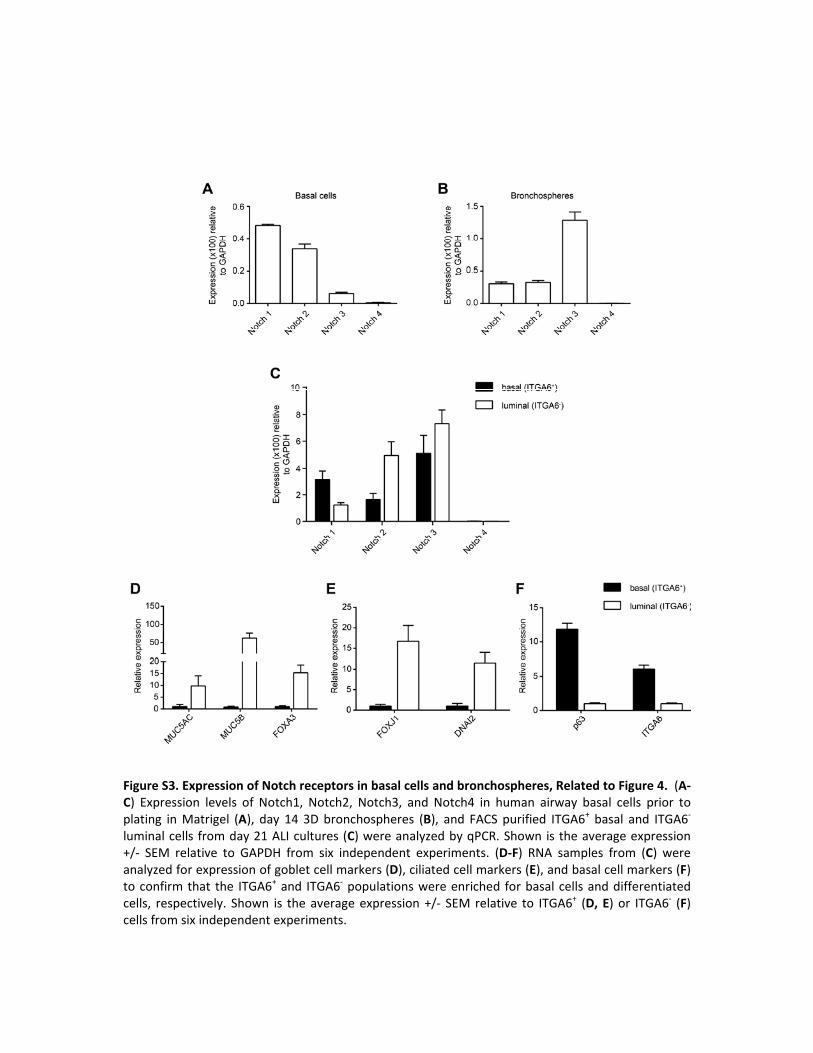
Figure S3. Expression of Notch receptors in basal cells and bronchospheres, Related to Figure 4. (A‐C) Expression levels of Notch1, Notch2, Notch3, and Notch4 in human airway basal cells prior to plating in Matrigel (A), day 14 3D bronchospheres (B), and FACS purified ITGA6+ basal and ITGA6‐ luminal cells from day 21 ALI cultures (C) were analyzed by qPCR. Shown is the average expression +/‐ SEM relative to GAPDH from six independent experiments. (D‐F) RNA samples from (C) were analyzed for expression of goblet cell markers (D), ciliated cell markers (E), and basal cell markers (F) to confirm that the ITGA6+ and ITGA6‐ populations were enriched for basal cells and differentiated cells, respectively. Shown is the average expression +/‐ SEM relative to ITGA6+ (D, E) or ITGA6‐ (F) cells from six independent experiments.
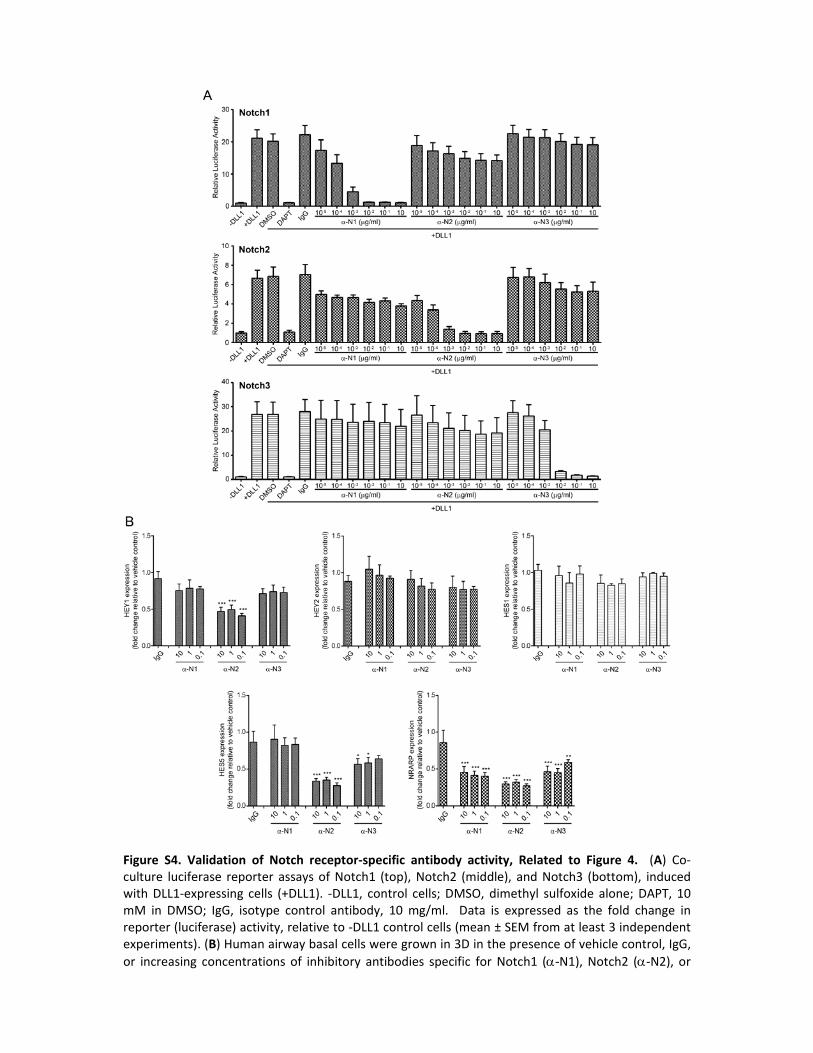
Figure S4. Validation of Notch receptor‐specific antibody activity, Related to Figure 4. (A) Co‐culture luciferase reporter assays of Notch1 (top), Notch2 (middle), and Notch3 (bottom), induced with DLL1‐expressing cells (+DLL1). ‐DLL1, control cells; DMSO, dimethyl sulfoxide alone; DAPT, 10 mM in DMSO; IgG, isotype control antibody, 10 mg/ml. Data is expressed as the fold change in reporter (luciferase) activity, relative to ‐DLL1 control cells (mean ± SEM from at least 3 independent experiments). (B) Human airway basal cells were grown in 3D in the presence of vehicle control, IgG,
or increasing concentrations of inhibitory antibodies specific for Notch1 (‐N1), Notch2 (‐N2), or

Notch3 (‐N3), and analyzed for the expression levels of the Notch target genes HEY1, HEY2, HES1, HES5, and NRARP. Shown is the mean fold change +/‐ SEM relative to control from at least three independent experiments. *p<0.05; ***p<0.001. One‐way ANOVA and Dunnett’s Multiple Comparison Test.
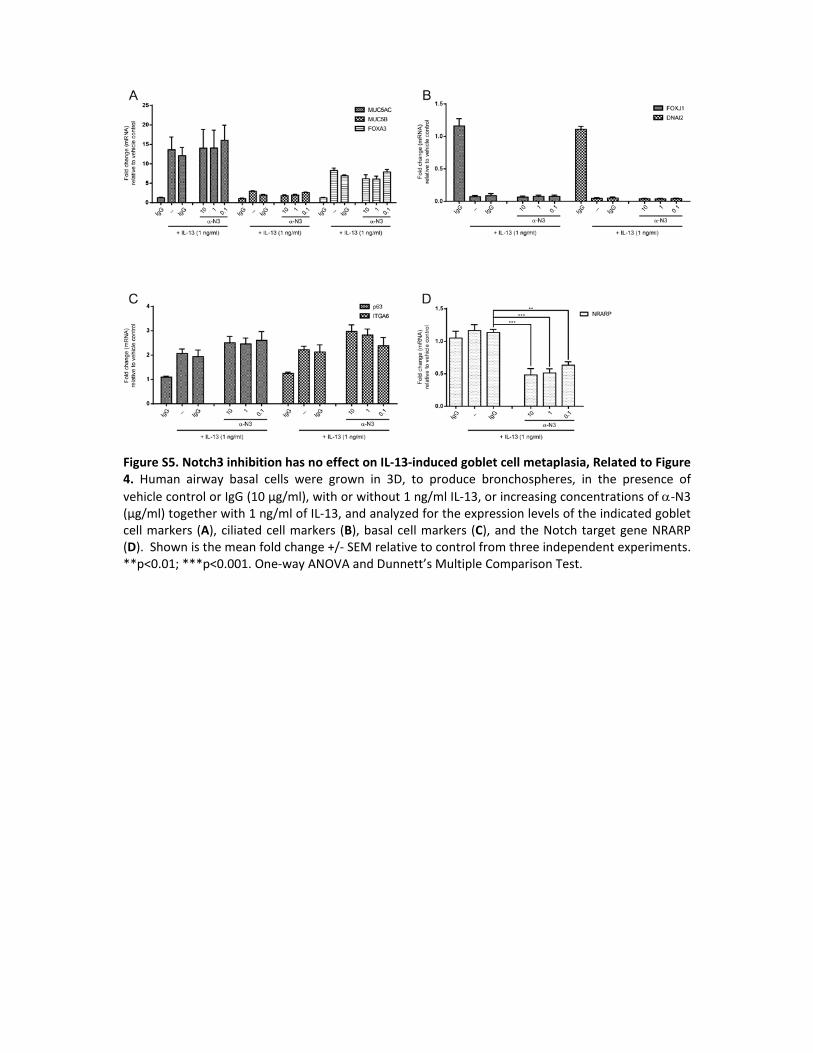
Figure S5. Notch3 inhibition has no effect on IL‐13‐induced goblet cell metaplasia, Related to Figure 4. Human airway basal cells were grown in 3D, to produce bronchospheres, in the presence of
vehicle control or IgG (10 μg/ml), with or without 1 ng/ml IL‐13, or increasing concentrations of ‐N3 (μg/ml) together with 1 ng/ml of IL‐13, and analyzed for the expression levels of the indicated goblet cell markers (A), ciliated cell markers (B), basal cell markers (C), and the Notch target gene NRARP (D). Shown is the mean fold change +/‐ SEM relative to control from three independent experiments. **p<0.01; ***p<0.001. One‐way ANOVA and Dunnett’s Multiple Comparison Test.
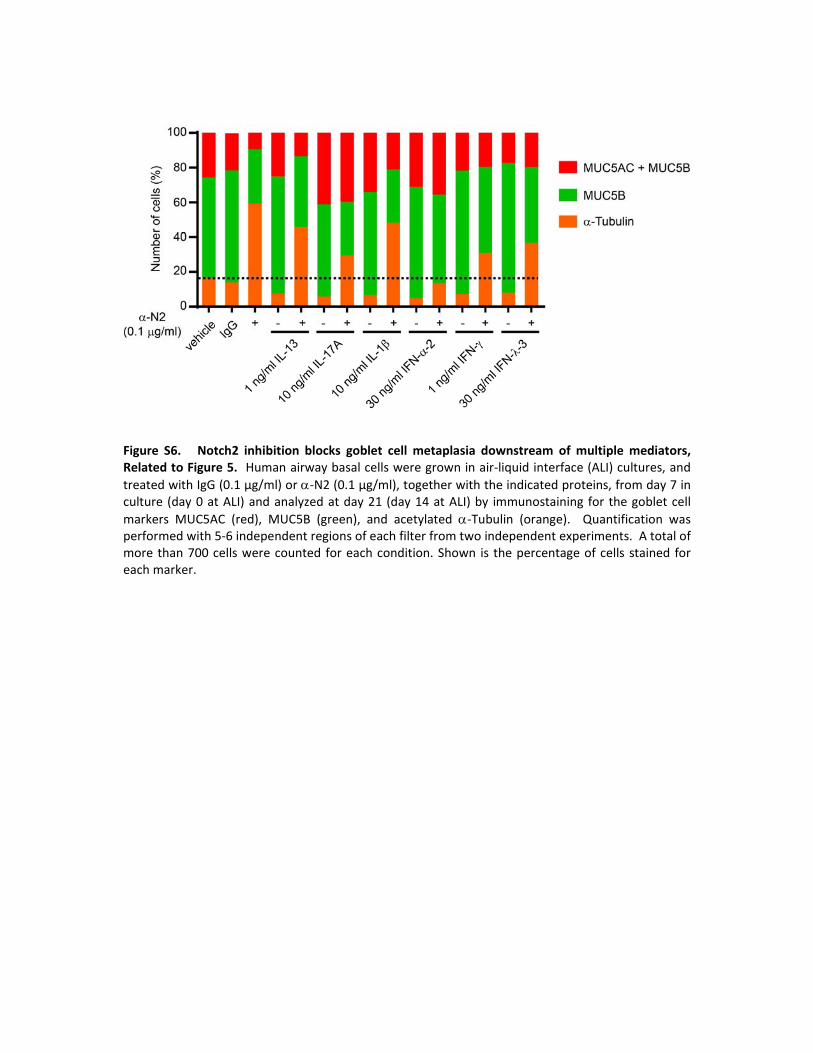
Figure S6. Notch2 inhibition blocks goblet cell metaplasia downstream of multiple mediators, Related to Figure 5. Human airway basal cells were grown in air‐liquid interface (ALI) cultures, and
treated with IgG (0.1 μg/ml) or ‐N2 (0.1 μg/ml), together with the indicated proteins, from day 7 in culture (day 0 at ALI) and analyzed at day 21 (day 14 at ALI) by immunostaining for the goblet cell
markers MUC5AC (red), MUC5B (green), and acetylated ‐Tubulin (orange). Quantification was performed with 5‐6 independent regions of each filter from two independent experiments. A total of more than 700 cells were counted for each condition. Shown is the percentage of cells stained for each marker.
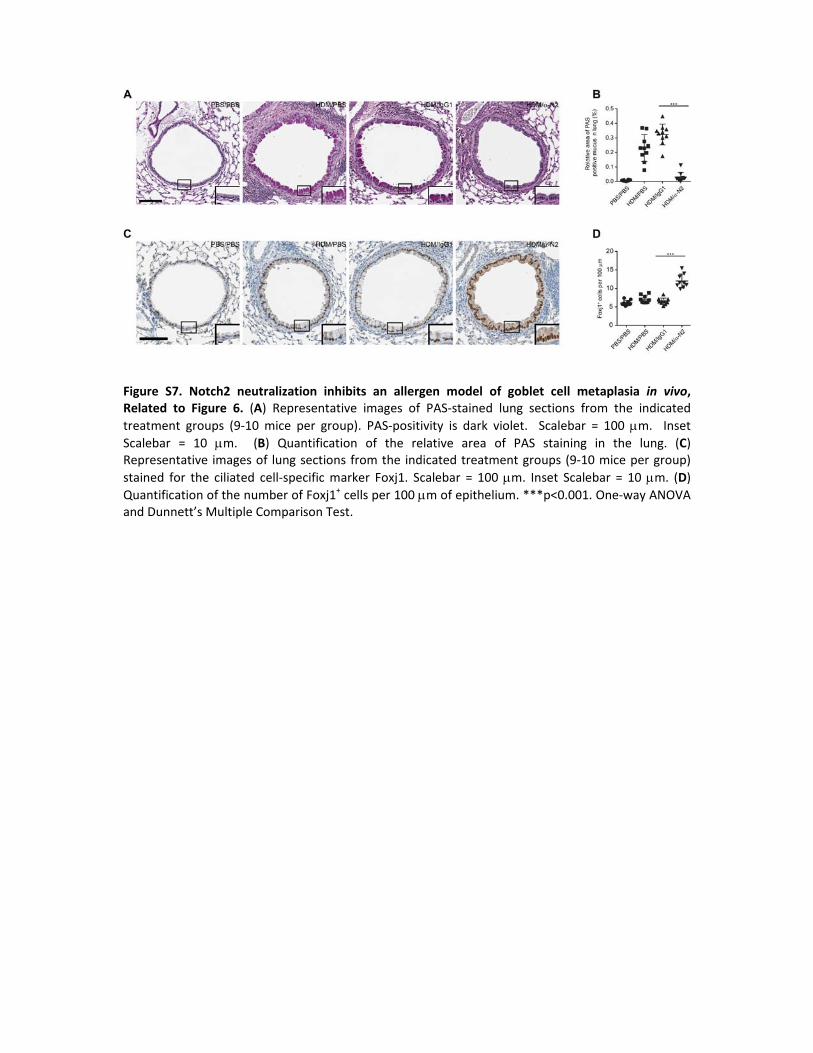
Figure S7. Notch2 neutralization inhibits an allergen model of goblet cell metaplasia in vivo, Related to Figure 6. (A) Representative images of PAS‐stained lung sections from the indicated
treatment groups (9‐10 mice per group). PAS‐positivity is dark violet. Scalebar = 100 m. Inset
Scalebar = 10 m. (B) Quantification of the relative area of PAS staining in the lung. (C) Representative images of lung sections from the indicated treatment groups (9‐10 mice per group)
stained for the ciliated cell‐specific marker Foxj1. Scalebar = 100 m. Inset Scalebar = 10 m. (D)
Quantification of the number of Foxj1+ cells per 100 m of epithelium. ***p<0.001. One‐way ANOVA and Dunnett’s Multiple Comparison Test.

Table S1. Screening hits that modulated expression of one or more cell type‐specific markers by 2‐
fold or greater, Related to Figure 2. Provided as a separate Excel file.
Movie S1. Timelapse video of human airway basal cells after plating in 3D Matrigel, Related to
Figure 1.
Movie S2. Timelapse video of day 9‐14 of bronchosphere development in 3D, Related to Figure 1.
Movie S3. Timelapse video of beating cilia in fully formed bronchospheres, Related to Figure 1.
Movie S4. High magnification timelapse video of beating cilia in fully formed bronchospheres,
Related to Figure 1.
Supplemental Experimental Procedures
Antibodies
For production of anti‐Notch1 (A2), anti‐Notch2 (D3) and anti‐Notch3 (A4) antibodies, DNA synthesis
was carried out (Invitrogen) for light and heavy chains to correspond to published amino acid
sequences (Fung et al., 2008; Siebel and Wu, 2008, 2010). Synthetic products were subcloned into a
dual CMV promoter vector (pRS5a derivative containing dhfr and neomycin resistance markers).
Stable cell lines expressing the antibodies were made by transfection of CHOK1 PD cells followed by
selection for methotrexate and G418 resistance. CHO pools were maintained in selection media and
expanded for protein production. The conditioned medium was clarified using a filter train of 1.2 µm
filter, 0.45 + 0.2 µm filter, and a final 0.2 µm (Sartorius Corporation, Edgewood, NY). The conditioned
medium was then concentrated five‐ to ten‐fold (Tangential Flow Filtration Device, Tangenx
Corporation, Shrewsbury, MA) and applied to MabSelect SuRe (GE Healthcare, USA) equilibrated in
phosphate buffered saline (PBS). The IgG1 antibody molecules were eluted using 50mM citrate pH
3.0, fractions were immediately neutralized by dialysis into 1X dPBS (Slide‐A‐Lyzer Dialysis Cassette,
Pierce Corporation) into PBS. Protein aggregation was measured by HPLC (Shimadzu) on an
analytical sizing column (Tosoh 3000SWXL) and further polished on a Superdex 200 column (GE
Healthcare, USA) if necessary. Antibodies were concentrated using centrifugation spin columns
(Vivaspin, GE Healthcare, USA) and tested for endotoxin values using an Endosafe PTS reader
(Charlesriver, USA) prior to use.
Generation of Notch‐Gal4‐NLS‐VP16 retroviral vectors
To determine the capacity of anti‐Notch antibodies to inhibit Notch ligand‐induced signaling,
reporter gene assays (RGA) using double stable reporter cell lines expressing HLR‐huNotch‐Gal4‐NLS‐
VP16 / Gal4‐UA‐Luciferase were developed.
Human Notch1, Notch2 and Notch3 extracellular and trans‐membrane portions followed by Gal4
DNA binding domain, VP16 and a nuclear localization sequence (NLS) were cloned into the retroviral
vector pLNCX2 (Clontech, cat# 631503). Generation of these chimeric Notch receptors and
corresponding reporter gene assays allowed for examination of the effects of Notch antibodies of
Notch receptor specific signaling.
The coding sequence for Gal4‐VP16 was gene synthesized and cloned into the SalI‐ClaI sites of the
vector pLNXC2 (Clontech) to make pLNXC2‐Gal4‐VP16. The extracellular (ECD) and transmembrane
domains of human Notch3 (amino acids 1‐1669), human Notch1 (amino acids 1‐1762) and human
Notch 2 (1‐1704) were gene synthesized and cloned into the HindIII‐SalI sites of pLNXC2‐Gal4‐VP16
to produce fusions of the respective Notch proteins to Gal4‐VP16.
Retrovirus was produced by transfecting 293‐GP2 Packaging Cell Line (Clontech, cat# 631458) with
the appropriate retroviral vector (pLNCX2_hNotch1_Gal4‐VP16, pLNCX2_hNotch2_Gal4‐VP16 or
pLNCX2_hNotch3_Gal4‐VP16). Promega’s Fugene6 was used as the lipid‐based transfection reagent.
Transfection was carried out according to manufacturer’s instructions. Virus was collected at 48 h
after transfection and immediately used to transduce HLR cells (HLR‐PathDetect, Stratagene).
Transduced cells were under selection for at least two weeks, before they were tested in a co‐culture
assay. Clonal populations for each cell line were selected by standard protocols.
Notch‐Gal4‐NLS‐VP16‐UA‐luciferase ligand‐induced reporter gene assay
HLR‐Notch‐Gal4‐NLS‐VP16 / Gal4‐UA‐TATA‐Luciferase (HLR‐N) cells are activated by co‐culture with L
cells stably expressing Delta1 (DLL1‐19) (Hicks et al., 2000). Co‐culture with ligand expressing cells
results in activation of Notch signaling and proteolytic cleavage of the Notch chimeric receptors to
release the Gal4‐NLS‐VP16. This Gal4‐NLS‐VP16 translocates to the nuclease where it binds to the
Gal4‐luciferase reporter resulting in production of luciferase. At 90% confluency HLR‐N cells were
detached using Trypsin‐EDTA and diluted in assay medium (DMEM, High glucose, L‐Glu, Invitrogen,
Cat# 11995‐065; supplemented with 10% FBS, 1% P/S) to a concentration of 2x10⁵ cells/ml. 50 µl
HLR‐N cells per well (= 1x10⁴ cells) were seeded into white flat‐bottomed 96‐well plates (Costar, Cat
#3917) and incubated at 37 °C and 5% CO2 overnight.
The next day, the Notch antibodies (IgGs) were diluted at the desired concentrations in assay media.
5 µl of antibody dilution were added to the seeded cells and incubated for 2 h at 37°C and 5% CO2.
Next, Jagged1 and Delta1 ligand expressing mouse L‐cells were detached using Trypsin‐EDTA and
diluted in assay media to a concentration of 8x10⁵ cells/ml. In each well, 50 µl mouse L‐cells (= 4x10⁴
cells/ well) were added to the cultured HLR‐N cells (50 µl HLR cells + 5 µl antibody + 50 µl mouse cells
= 105 µl final volume) and incubated overnight at 37°C and 5% CO2. As a control 50 µl mouse parental
L‐cells were added for the ligand independent setting.
After overnight incubation, freshly prepared Bright‐Glo reagent was warmed to room temperature
(Promega, Cat #E2610) and 100 l was added to each well. After 5 min incubation time, the
luminescence was read in a luminometer (GeniosPro, Tecan).
Supplemental references
Fung, S.C., Li, K., Li, Y., Singh, S., and Zhou, B.‐B.S. (2008). Antagonist anti‐Notch3 antibodies and their use in the prevention and treatment of Notch3‐related diseases. US 2008/0226621 A1.
Hicks, C., Johnston, S.H., diSibio, G., Collazo, A., Vogt, T.F., and Weinmaster, G. (2000). Fringe differentially modulates Jagged1 and Delta1 signalling through Notch1 and Notch2. Nat Cell Biol 2, 515‐520.
Siebel, C.W., and Wu, Y. (2008). Anti‐Notch1 NRR antibodies and methods using same field of the invention. WO 2008/15025 A1.
Siebel, C.W., and Wu, Y. (2010). Anti‐Notch2 antibodies and methods of use. US 2010/0080808 A1.