Embed Size (px)
Citation preview
What Drives the International Transfer of Climate Change Mitigation Technologies? Empirical Evidence from Patent Data
NOTA DILAVORO12.2010
By Antoine Dechezleprêtre, Matthieu Glachant and Yann Ménière, Mines Paris Tech, CERNA
The opinions expressed in this paper do not necessarily reflect the position of Fondazione Eni Enrico Mattei
Corso Magenta, 63, 20123 Milano (I), web site: www.feem.it, e-mail: [email protected]
SUSTAINABLE DEVELOPMENT Series Editor: Carlo Carraro
What Drives the International Transfer of Climate Change Mitigation Technologies? Empirical Evidence from Patent Data By Antoine Dechezleprêtre, Matthieu Glachant and Yann Ménière, Mines Paris Tech, CERNA Summary Using patent data from 66 countries for the period 1990–2003, we characterize the factors which promote or hinder the international diffusion of climate-friendly technologies on a global scale. Regression results show that technology-specific capabilities of the recipient countries are determinant factors. In contrast, the general level of education is less important. We also show that restrictions to international trade—e.g., high tariff rates—and lax intellectual property regimes negatively influence the international diffusion of patented knowledge. A counter-intuitive result is that barriers to foreign direct investments can promote transfers. We discuss different possible interpretations. Keywords: Climate Change, Technology Diffusion, Technology Transfer JEL Classification: O33, O34, Q54 Address for correspondence: Matthieu Glachant CERNA, Mines ParisTech 60, Boulevard Saint Michel 75272 Paris Cedex 06 France Phone: + 33 1 40 51 92 29 Fax: + 33 1 40 51 91 45 E-mail : [email protected]
1
What Drives the International Transfer of Climate Change Mitigation
Technologies? Empirical Evidence from Patent Data
Antoine Dechezleprêtre*, Matthieu Glachant*, Yann Ménière*
* Mines ParisTech, CERNA
Correspondence to: Matthieu Glachant, CERNA, Mines ParisTech; 60, Boulevard Saint Michel ;
75272 Paris Cedex 06, France ; ph: + 33 1 40 51 92 29, fax: + 33 1 40 51 91 45, glachant@mines-
paristech.fr
2
Abstract
Using patent data from 66 countries for the period 1990–2003, we characterize the factors which
promote or hinder the international diffusion of climate-friendly technologies on a global scale.
Regression results show that technology-specific capabilities of the recipient countries are determinant
factors. In contrast, the general level of education is less important. We also show that restrictions to
international trade—e.g., high tariff rates—and lax intellectual property regimes negatively influence
the international diffusion of patented knowledge. A counter-intuitive result is that barriers to foreign
direct investments can promote transfers. We discuss different possible interpretations.
Key words: Climate change, technology diffusion, technology transfer.
JEL Code: O33, O34, Q54
3
1 Introduction
The international diffusion of technologies for mitigating climate change is at the core of
current discussions surrounding the post-Kyoto agreement. Technology development and diffusion are
considered strategic objectives in the 2007 Bali Road Map. North-to-south technology transfer is of
particular interest since technologies have been developed mostly in industrialized countries and that
technologies are urgently required to mitigate GHG emissions in fast-growing emerging economies. A
recent study looking at patents filed in thirteen climate change mitigation technologies shows that
two-thirds of the inventions patented worldwide between 1998 and 2003 have been developed in only
three countries: Japan, the USA, and Germany (Dechezleprêtre et al., 2009).
However, enhancing technology transfer involves considerable policy and economic
challenges because developing countries are reluctant to bear the financial costs of catching up alone,
while firms in industrialized countries refuse to give away strategic intellectual assets. This has led to
an intense debate on policies that affect technology diffusion, with a particular focus on the role of
intellectual property rights (IPRs) that developing countries view as barriers to technology diffusion.
By contrast, industrialized countries advocate that IPRs provide innovators with incentives to
disseminate their inventions through market channels, such as foreign direct investment and the
international trade of equipment goods. In their view, every developing country could actually
promote transfers by developing its capability to absorb new technologies.
This paper examines these issues by identifying the factors that promote or hinder the
international diffusion of climate-friendly technologies. We focus the analysis on the most relevant
questions in current policy discussions. First, is the capacity of countries to absorb foreign
technologies important? If the answer is in the affirmative, this implies that capacity building is a
powerful lever to technology transfer. Do strict IPRs induce more transfers? Do barriers to trade or to
foreign direct investment significantly reduce the import of technologies? Has the Kyoto Protocol—
and the related domestic policies—accelerated technology diffusion?
4
We address these questions using a data set of climate-related patents filed in 66 countries
from 1990 to 2003. The data come from the World Patent Statistical Database (PATSTAT). We focus
the analysis on twelve technologies: six renewable energy technologies (wind, solar, geothermal,
ocean energy, biomass, and hydropower), waste-to-energy, methane destruction, energy conservation
in buildings, climate-friendly cement, motor vehicle fuel injection, and energy-efficient lighting.
Although not all climate-friendly technologies are covered—they represent around 33% of all GHG
abatement opportunities up to 2030, excluding forestry (McKinsey and Vattenfall, 2007)—they
concern very diverse sectors such as electricity and heat production, the manufacturing industry, and
the residential sector.
The literature dealing with the international diffusion of environment-related technology is
limited but is growing rapidly1. Unlike the present work, this literature is mostly descriptive. Lanjouw
and Mody (1996) presented the first patent-based empirical evidence for the international diffusion of
environmentally responsive technology. Based on data from Japan, Germany, the USA, and fourteen
developing countries, the paper identifies the leaders in environmental patenting and finds that
significant transfers occur to developing countries. Focusing on chlorine-free technology in the pulp
and paper industry, Popp et al. (2007) provide evidence that environmental regulation may promote
international technology transfer. They observe for instance an increase in the number of patents filed
by US inventors in Finland and Sweden after passage of tighter regulations in these countries. Several
case studies discuss whether stricter patent protection promotes or hinders the transfer of climate-
related technology to developing countries (see, for example, Barton, 2007; Ockwell et al., 2008).
Finally, we recently used PATSTAT data to describe the geography of innovation and international
technology diffusion (Dechezleprêtre et al., 2009).
To the best of our knowledge, our work is one of the first econometric studies in this area.
Another very recent work is by Dekker et al. (2009) who study how sulfur protocols trigger invention
and diffusion of technologies for reducing SO2 emissions. A paper by Hascic and Johnstone (2009) is
the most closely related to our work. They use the same data to study the impact of the Kyoto
protocol. Our focus is different since we deal with a broader set of policy variables (including trade
5
barriers, FDI control, etc.). Moreover, we develop a theoretical model to cope with simultaneity
problems neglected in the other papers.
As a measure of diffusion, our approach is similar to that of Lanjouw and Mody (1996), Eaton
and Kortum (1999), or Hascic and Johnstone (2009). We count the number of patent applications in
recipient countries for technologies invented abroad. Because patent data include the inventor’s
country of residence, we know precisely the geography of technology flows and we can run
regressions to understand what drives cross-border technology exchanges. This indicator is a proxy of
technology transfer because holding a patent in a country gives the holder the exclusive right in that
country to exploit the technology commercially. This does not necessarily mean that the inventor will
actually use the technology there. Yet, as patenting is both costly and risky, it implies that the inventor
definitely plans to do so.
This approach appears similar to the method based on patent citation analysis used in many
studies seeking to measure the extent of international knowledge flows (see Jaffe et al., 1993; Peri,
2005). But there is an important difference. Inventors obviously patent abroad to reap private benefits.
Therefore, while citations made by inventors to previous patents are an indicator of knowledge
spillovers, our indicator is a proxy for market-driven knowledge flows.
The study is organized as follows: Section 2 discusses the use of patents as indicators of
technology transfer. The data set is presented in Section 3 along with data issues. In Section 4 we
develop a theoretical model that describes the diffusion of inventions between countries. The model is
estimated in Section 5. A final section summarizes the main results.
2 Patents as indicators of technology transfer
In the empirical literature, scholars have proposed a number of solutions for the measurement
of international technology transfers. Because major transmission channels of knowledge across
countries include international trade and foreign direct investments (FDI), many studies use the import
flows of intermediate goods or FDI as a proxy variable for international transfer (for example, Coe
and Helpman, 1995; Lichtenberg and van Pottelsberghe de la Potterie, 2001). Data on trade and FDI
6
are easily available from a large number of countries, thereby allowing a very broad geographical
coverage. However, such data are highly aggregated, which prevents their use in measuring the flows
of climate-friendly technologies. More generally, that data are only indirect vehicles of knowledge
transfer.
This is why more recent papers tend to rely on patent data.2 Patent data focus on outputs of the
inventive process (Griliches, 1990). They provide a wealth of information on the nature of the
invention and the applicant. Most important, they can be disaggregated to specific technological areas.
Finally, they indicate not only the countries where inventions are made, but also where these new
technologies are used. These features make our study of climate change mitigation technologies
possible. Of course, patent data also present drawbacks, which will be discussed below.
To accurately explain how we use patent data in this paper, we must briefly recall how the
patent system works. Consider a simplified innovative process. In the first stage, an inventor from
country i develops a new technology. He then decides to patent the new technology in certain
countries. A patent in country j grants him the exclusive right to commercially exploit the innovation
in that country. Accordingly, the inventor patents his invention in country j if he plans to use it there.
The set of patents protecting the same invention in several countries is called a patent family.
In this paper we use the number of patents invented in country i and filed in country j as an
indicator of the number of innovations transferred from country i to country j. As mentioned in the
introduction, this indicator has already been used in previous work (see, for instance, Lanjouw and
Mody, 1996; Eaton and Kortum, 1999). It differs, however, from those indicators that are based on
backward patent citation and are used in the literature measuring knowledge spillovers (see Jaffe et al.,
1993).3
Our approach is obviously imperfect. The first limitation is that for protecting innovations,
patents are only one of several means, along with lead time, industrial secrecy, or purposefully
complex specifications (Cohen et al., 2000; Frietsch and Schmoch, 2006). In fact, inventors may
prefer secrecy to avoid the public disclosure of the invention imposed by patent law, or to save the
significant fees attached to patent filing. However, there are very few examples of economically
7
significant inventions that have not been patented (Dernis and Guellec, 2001), although the propensity
to patent differs between sectors, depending on the nature of the technology (Cohen et al., 2000) and
the risk of imitation in a country. These factors behind the propensity to patent have a significant
effect on our data, because patenting is more likely in countries that have strong technological
capabilities and that strictly enforce intellectual property rights. However, we will see that the
econometric models developed below partly control for this problem.
More generally, certain forms of knowledge are not patentable. Know-how or learning-by-
doing, for example, cannot be easily codified, particularly because these are skills incorporated in
individuals. The nature of such knowledge limits the accuracy of our data. Nevertheless, research
shows that flows of patented knowledge and of tacit knowledge are positively correlated (Cohen et al.,
2000; Arora et al., 2008).
A further limitation is that a patent grants the exclusive right to use the technology only in a
given country; it does not mean that the patent owner will actually do so. This could significantly bias
our results if applying for protection did not cost anything, so that inventors might patent widely and
indiscriminately. But this is not the case in practice. Dechezleprêtre et al. (2009) show that the average
invention is patented in two countries.4 Patenting is costly, in both the preparation of the application
and the administration associated with the approval procedure (see Helfgott, 1993; and Berger, 2005,
for EPO applications). In addition, possessing a patent in a country is not always in the inventor’s
interest if that country’s enforcement is weak, since the publication of the patent in the local language
can increase vulnerability to imitation (see Eaton and Kortum, 1996 and 1999). Therefore, inventors
are unlikely to apply for patent protection in a country unless they are relatively certain of the
potential market for the technology covered. Finally, because patenting protects an invention only in
the country where the patent is filed, inventors are less likely to engage in strategic behavior to protect
their inventions abroad and prevent the use of their technology in the production of goods imported by
foreign competitors in their domestic markets.
In addition to the above limitations, the value of individual patents is heterogeneous and its
distribution is skewed: Since many patents have very little value, the number of patents does not
perfectly reflect the value of innovations. This problem is probably less acute in this paper than in
8
other works, as we focus on international diffusion. Exported technologies are of the highest value and
make up only about a quarter of all inventions (Lanjouw et al., 1998).
3 Data description
Over the past several years, the European Patent Office (EPO), along with the OECD’s
Directorate for Science, Technology and Industry, have developed a worldwide patent database—the
EPO/OECD World Patent Statistical Database (PATSTAT). PATSTAT is unique in that it covers
more than 80 patent offices and contains over 70 million patent documents. PATSTAT data have not
been exploited much until now because they became available only recently. Our study is the first to
use PATSTAT data to explain the diffusion of climate change mitigation technologies.
We extracted all the patents filed from 1990 to 2003 in 12 climate-mitigation fields: six
renewable energy technologies (wind, solar, geothermal, ocean energy, biomass, and hydropower),
waste use and recovery, methane destruction, climate-friendly cement, energy conservation in
buildings, motor vehicle fuel injection, and energy-efficient lighting. The precise description of the
fields covered by the study can be found in Table 1. This represents 186,660 patent applications filed
in 76 countries.5 On average, climate-related patents included in our data set represent 1% of the total
annual number of patents filed worldwide. Since our interest is on technology diffusion, we only
consider inventions that are patented in several countries, leaving us with 110,170 patents.
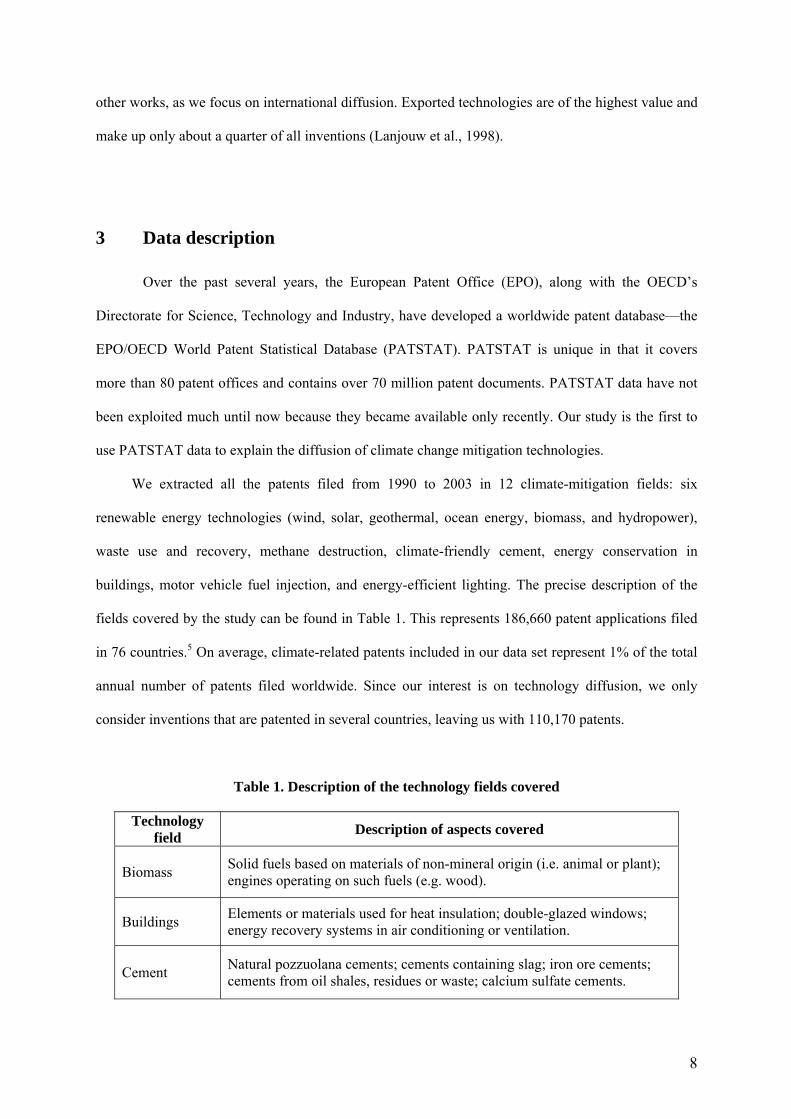
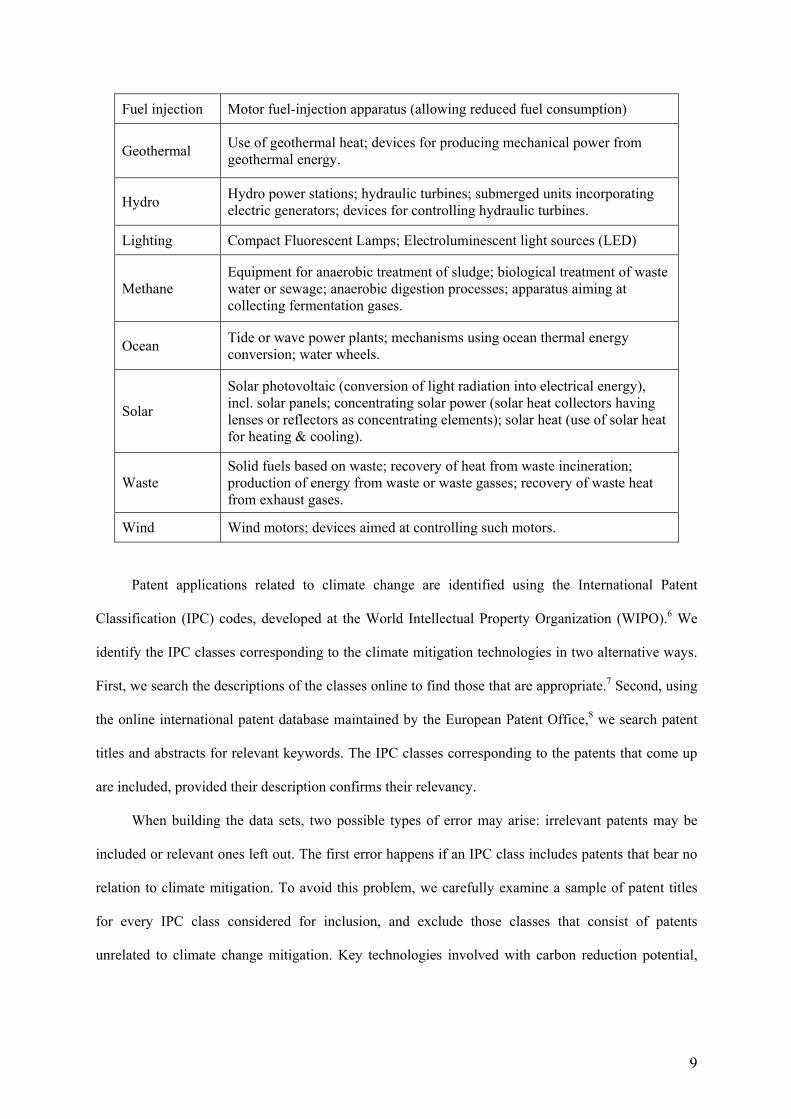
Table 1. Description of the technology fields covered
Technology field Description of aspects covered
Biomass Solid fuels based on materials of non-mineral origin (i.e. animal or plant); engines operating on such fuels (e.g. wood).
Buildings Elements or materials used for heat insulation; double-glazed windows; energy recovery systems in air conditioning or ventilation.
Cement Natural pozzuolana cements; cements containing slag; iron ore cements; cements from oil shales, residues or waste; calcium sulfate cements.
9
Fuel injection Motor fuel-injection apparatus (allowing reduced fuel consumption)
Geothermal Use of geothermal heat; devices for producing mechanical power from geothermal energy.
Hydro Hydro power stations; hydraulic turbines; submerged units incorporating electric generators; devices for controlling hydraulic turbines.
Lighting Compact Fluorescent Lamps; Electroluminescent light sources (LED)
Methane Equipment for anaerobic treatment of sludge; biological treatment of waste water or sewage; anaerobic digestion processes; apparatus aiming at collecting fermentation gases.
Ocean Tide or wave power plants; mechanisms using ocean thermal energy conversion; water wheels.
Solar Solar photovoltaic (conversion of light radiation into electrical energy), incl. solar panels; concentrating solar power (solar heat collectors having lenses or reflectors as concentrating elements); solar heat (use of solar heat for heating & cooling).
Waste Solid fuels based on waste; recovery of heat from waste incineration; production of energy from waste or waste gasses; recovery of waste heat from exhaust gases.
Wind Wind motors; devices aimed at controlling such motors.
Patent applications related to climate change are identified using the International Patent
Classification (IPC) codes, developed at the World Intellectual Property Organization (WIPO).6 We
identify the IPC classes corresponding to the climate mitigation technologies in two alternative ways.
First, we search the descriptions of the classes online to find those that are appropriate.7 Second, using
the online international patent database maintained by the European Patent Office,8 we search patent
titles and abstracts for relevant keywords. The IPC classes corresponding to the patents that come up
are included, provided their description confirms their relevancy.
When building the data sets, two possible types of error may arise: irrelevant patents may be
included or relevant ones left out. The first error happens if an IPC class includes patents that bear no
relation to climate mitigation. To avoid this problem, we carefully examine a sample of patent titles
for every IPC class considered for inclusion, and exclude those classes that consist of patents
unrelated to climate change mitigation. Key technologies involved with carbon reduction potential,
10
therefore, are outside the scope of this study, which means that electric vehicles, energy efficient
technologies in industry, or clean coal technologies are not part of our study.
The second error—relevant inventions are left out—is less problematic. We can reasonably
assume that all innovations in a given field behave in a similar way and hence our data sets can be
seen at worst as good representations of innovative activity in the field considered. Overall innovative
activity may be underestimated, however, and may thus be less reliable than trends.
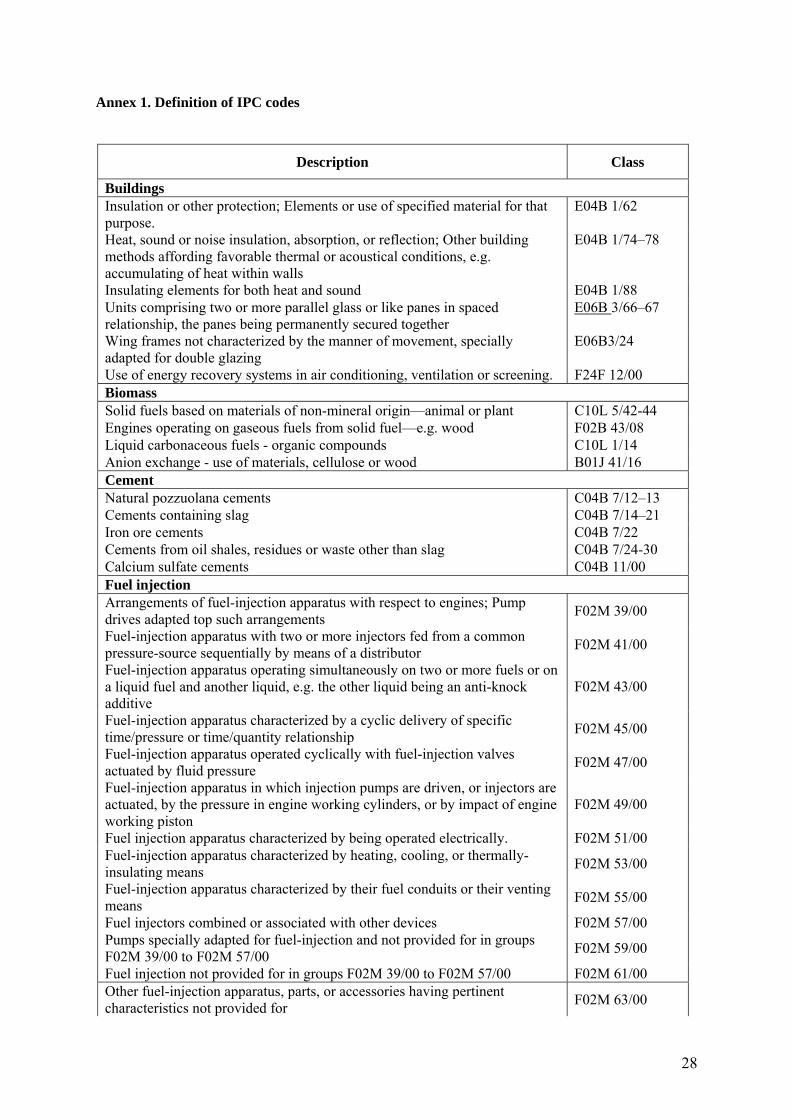
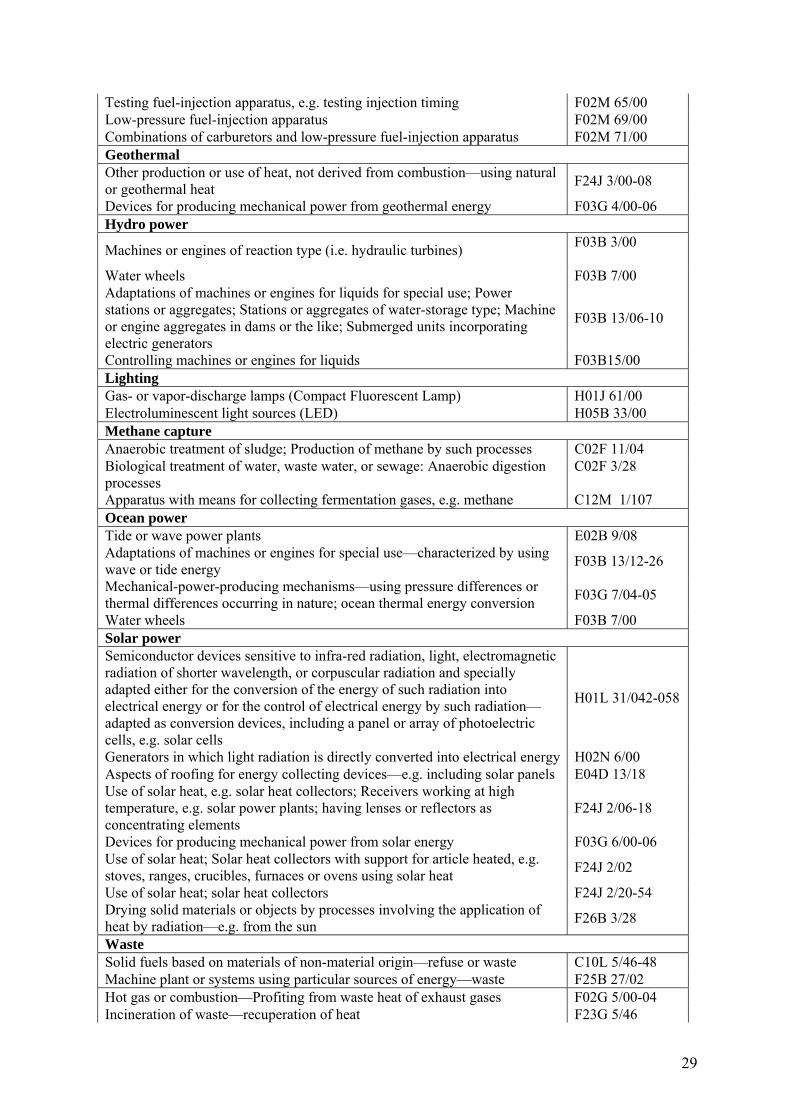
The definitions of the IPC codes used to build the data sets can be found in Annex 1. Further details
on data construction can be found in Dechezleprêtre et al. (2009). In addition to climate-friendly
patents, other data are also used, in particular in order to describe the demand for technology. These
data are described in section 5.
4 Theoretical framework
We now present a model that we use to specify estimation equations in the next section. We seek to
explain cross-border knowledge flows. The ideal structural model would therefore account for the
interplay between inventors and technology adopters as well as for the dynamics of innovation and
diffusion, since inventors arguably anticipate diffusion outcomes when they define their innovation
strategy. The model could then simultaneously determine innovation and diffusion outcomes. Such a
comprehensive approach was developed, for instance, by Eaton and Kortum (1999). But econometric
estimation requires much data—for instance, on R&D expenditures—that are not available in our case
given the broad geographical scope of our study and its focus on climate technologies.
Alternatively, we could estimate gravity-like models such as those frequently used in the
literature about knowledge spillovers. The micro-foundations of this approach are weak, however.
This is probably not a serious limitation when dealing with the spillover type of knowledge flows: The
mechanisms through which diffusion occurs—e.g., labour mobility—are not driven by the market for
technologies, and inventors who own the technologies do not play an active role, as they derive no
profits from diffusion. But using a gravity model is more problematic in our case because we seek to
explain intentional technology transfer through the market.
11
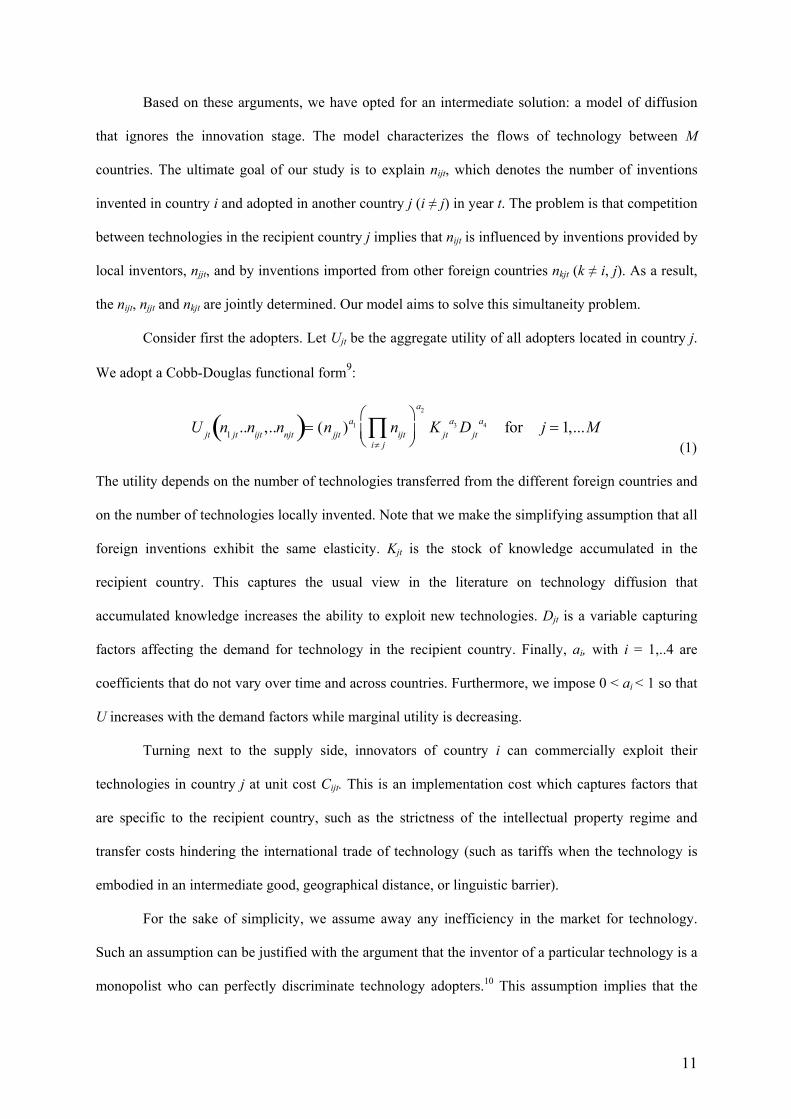
Based on these arguments, we have opted for an intermediate solution: a model of diffusion
that ignores the innovation stage. The model characterizes the flows of technology between M
countries. The ultimate goal of our study is to explain nijt, which denotes the number of inventions
invented in country i and adopted in another country j (i ≠ j) in year t. The problem is that competition
between technologies in the recipient country j implies that nijt is influenced by inventions provided by
local inventors, njjt, and by inventions imported from other foreign countries nkjt (k ≠ i, j). As a result,
the nijt, njjt and nkjt are jointly determined. Our model aims to solve this simultaneity problem.
Consider first the adopters. Let Ujt be the aggregate utility of all adopters located in country j.
We adopt a Cobb-Douglas functional form9:
U jt n1 jt ..nijt ,..nnjt( )= (njjt )
a1 nijti≠ j∏⎛
⎝⎜⎞
⎠⎟
a2
K jta3 Djt
a4 for j = 1,...M (1)
The utility depends on the number of technologies transferred from the different foreign countries and
on the number of technologies locally invented. Note that we make the simplifying assumption that all
foreign inventions exhibit the same elasticity. Kjt is the stock of knowledge accumulated in the
recipient country. This captures the usual view in the literature on technology diffusion that
accumulated knowledge increases the ability to exploit new technologies. Djt is a variable capturing
factors affecting the demand for technology in the recipient country. Finally, ai, with i = 1,..4 are
coefficients that do not vary over time and across countries. Furthermore, we impose 0 < ai < 1 so that
U increases with the demand factors while marginal utility is decreasing.
Turning next to the supply side, innovators of country i can commercially exploit their
technologies in country j at unit cost Cijt. This is an implementation cost which captures factors that
are specific to the recipient country, such as the strictness of the intellectual property regime and
transfer costs hindering the international trade of technology (such as tariffs when the technology is
embodied in an intermediate good, geographical distance, or linguistic barrier).
For the sake of simplicity, we assume away any inefficiency in the market for technology.
Such an assumption can be justified with the argument that the inventor of a particular technology is a
monopolist who can perfectly discriminate technology adopters.10 This assumption implies that the
12
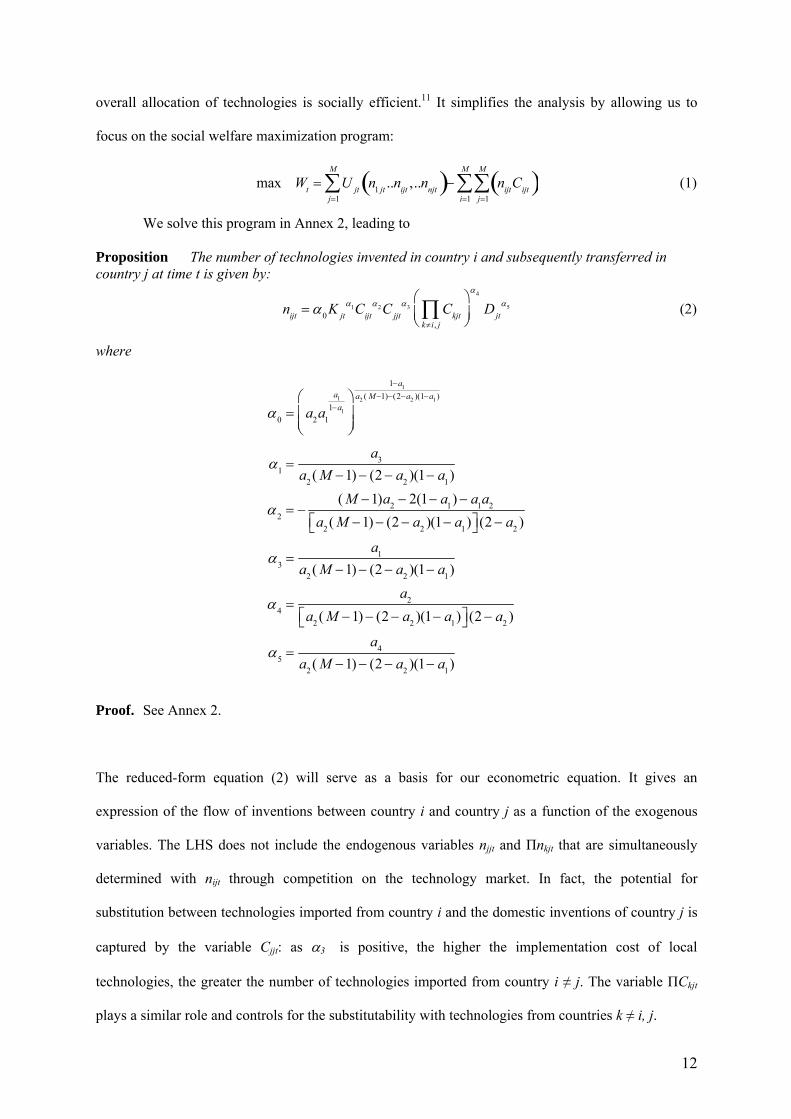
overall allocation of technologies is socially efficient.11 It simplifies the analysis by allowing us to
focus on the social welfare maximization program:
max Wt = U jt n1 jt ..nijt ,..nnjt( )
j=1
M
∑ − nijtCijt( )j=1
M
∑i=1
M
∑ (1)
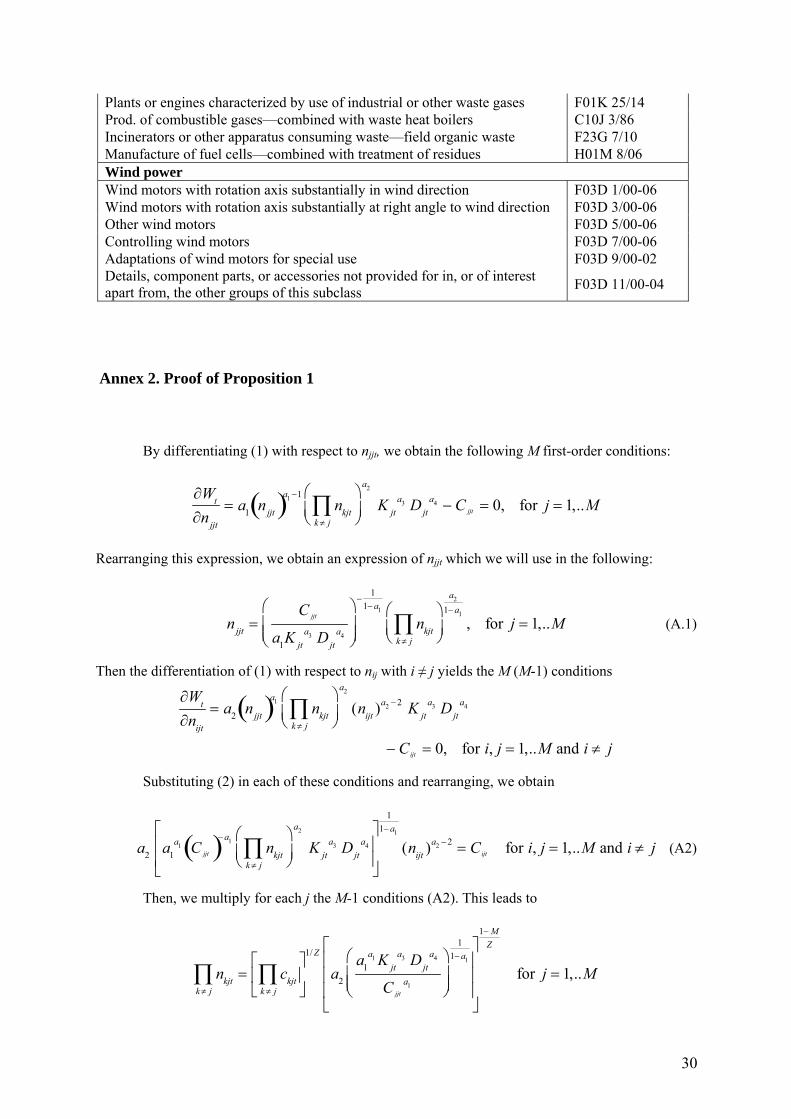
We solve this program in Annex 2, leading to
Proposition The number of technologies invented in country i and subsequently transferred in country j at time t is given by:
nijt = α0 K jt
α1Cijtα2C jjt
α3 Ckjtk≠i, j∏
⎛
⎝⎜⎞
⎠⎟
α4
Djtα5 (2)
where
α0 = a2a1
a11−a1
⎛
⎝⎜⎜
⎞
⎠⎟⎟
1−a1a2 ( M−1)−(2−a2 )(1−a1 )
α1 =a3
a2 ( M −1)− (2 − a2 )(1− a1)
α2 = −( M −1)a2 − 2(1− a1)− a1a2
a2 ( M −1)− (2 − a2 )(1− a1)⎡⎣ ⎤⎦ (2 − a2 )
α3 =a1
a2 ( M −1)− (2 − a2 )(1− a1)
α4 =a2
a2 ( M −1)− (2− a2 )(1− a1)⎡⎣ ⎤⎦ (2− a2 )
α5 =a4
a2 ( M −1)− (2 − a2 )(1− a1)
Proof. See Annex 2.
The reduced-form equation (2) will serve as a basis for our econometric equation. It gives an
expression of the flow of inventions between country i and country j as a function of the exogenous
variables. The LHS does not include the endogenous variables njjt and Πnkjt that are simultaneously
determined with nijt through competition on the technology market. In fact, the potential for
substitution between technologies imported from country i and the domestic inventions of country j is
captured by the variable Cjjt: as α3 is positive, the higher the implementation cost of local
technologies, the greater the number of technologies imported from country i ≠ j. The variable ΠCkjt
plays a similar role and controls for the substitutability with technologies from countries k ≠ i, j.
13
5 Empirical issues
We have constructed a panel data set for each of the 12 technology fields described in Section 3.
This is a strong point of our study: Estimating the model on each field allows us to control for
technology-specific factors. The panels extend over 14 years, from 1990 to 2003. The final samples
include between 2,176 and 3,181 country pairs over that period.
5.1 Estimation equations
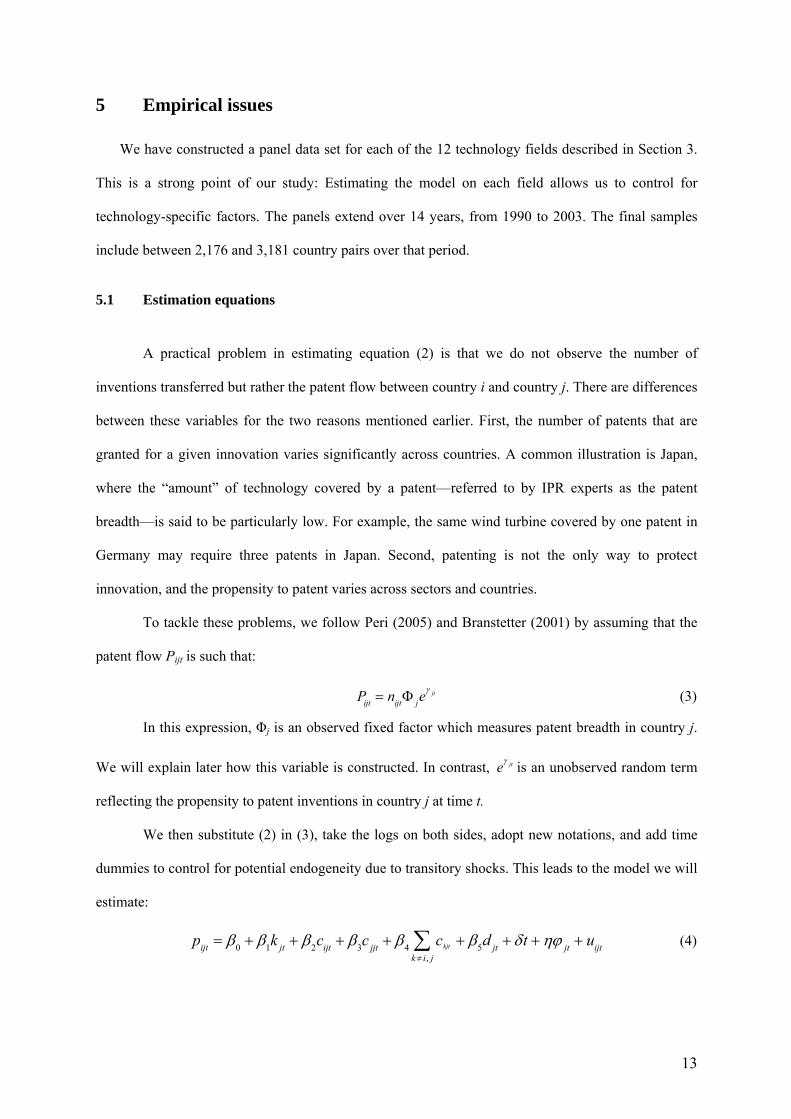
A practical problem in estimating equation (2) is that we do not observe the number of
inventions transferred but rather the patent flow between country i and country j. There are differences
between these variables for the two reasons mentioned earlier. First, the number of patents that are
granted for a given innovation varies significantly across countries. A common illustration is Japan,
where the “amount” of technology covered by a patent—referred to by IPR experts as the patent
breadth—is said to be particularly low. For example, the same wind turbine covered by one patent in
Germany may require three patents in Japan. Second, patenting is not the only way to protect
innovation, and the propensity to patent varies across sectors and countries.
To tackle these problems, we follow Peri (2005) and Branstetter (2001) by assuming that the
patent flow Pijt is such that:
Pijt = nijtΦ jeγ jt (3)
In this expression, Φj is an observed fixed factor which measures patent breadth in country j.
We will explain later how this variable is constructed. In contrast, eγ jt is an unobserved random term
reflecting the propensity to patent inventions in country j at time t.
We then substitute (2) in (3), take the logs on both sides, adopt new notations, and add time
dummies to control for potential endogeneity due to transitory shocks. This leads to the model we will
estimate:
pijt = β0 + β1k jt + β2cijt + β3c jjt + β4 ckjt
k≠ i, j∑ + β5d jt + δt +ηϕ jt + uijt (4)
14
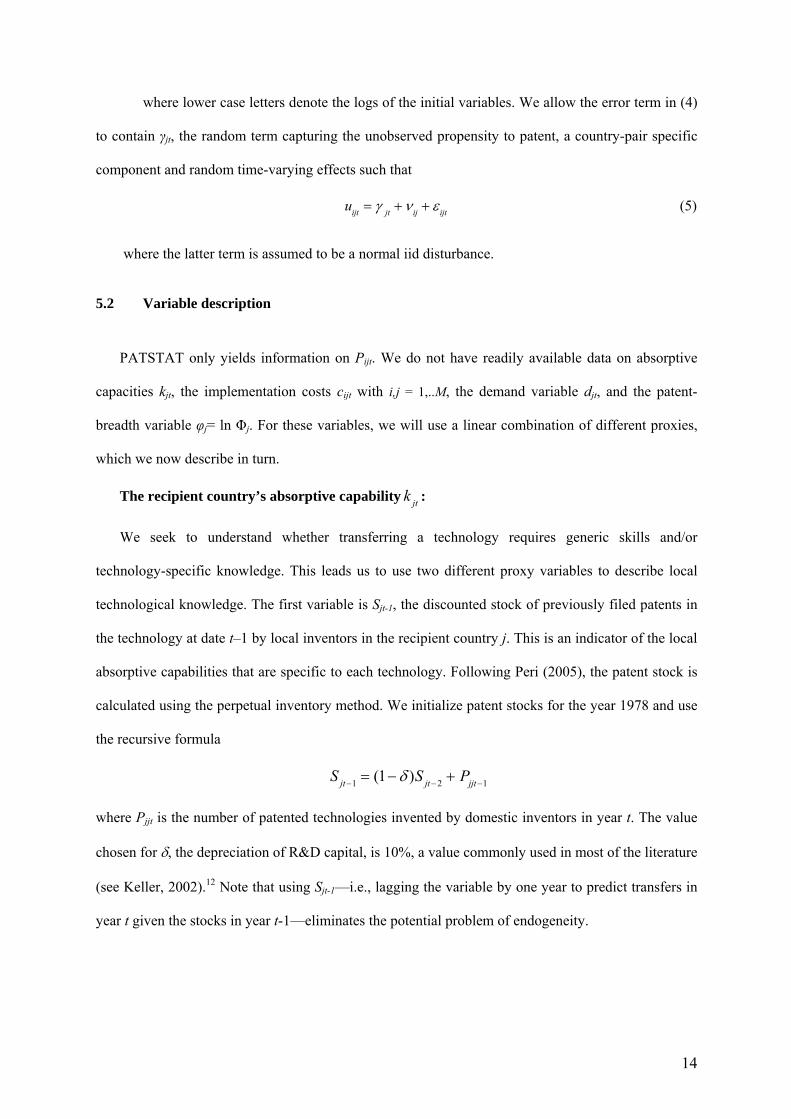
where lower case letters denote the logs of the initial variables. We allow the error term in (4)
to contain γjt, the random term capturing the unobserved propensity to patent, a country-pair specific
component and random time-varying effects such that
uijt = γ jt +ν ij + ε ijt (5)
where the latter term is assumed to be a normal iid disturbance.
5.2 Variable description
PATSTAT only yields information on Pijt. We do not have readily available data on absorptive
capacities kjt, the implementation costs cijt with i,j = 1,..M, the demand variable djt, and the patent-
breadth variable φj= ln Φj. For these variables, we will use a linear combination of different proxies,
which we now describe in turn.
The recipient country’s absorptive capability k jt :
We seek to understand whether transferring a technology requires generic skills and/or
technology-specific knowledge. This leads us to use two different proxy variables to describe local
technological knowledge. The first variable is Sjt-1, the discounted stock of previously filed patents in
the technology at date t–1 by local inventors in the recipient country j. This is an indicator of the local
absorptive capabilities that are specific to each technology. Following Peri (2005), the patent stock is
calculated using the perpetual inventory method. We initialize patent stocks for the year 1978 and use
the recursive formula
S jt−1 = (1− δ )S jt−2 + Pjjt−1
where Pjjt is the number of patented technologies invented by domestic inventors in year t. The value
chosen for δ, the depreciation of R&D capital, is 10%, a value commonly used in most of the literature
(see Keller, 2002).12 Note that using Sjt-1—i.e., lagging the variable by one year to predict transfers in
year t given the stocks in year t-1—eliminates the potential problem of endogeneity.
15
The second proxy variable is edujt, the tertiary gross enrollment ratio, which is the average
percentage of the population of official school age for tertiary education actually enrolled in this level
over the previous 10 years.
The implementation cost cijt , with i, j = 1,..M
Note that we describe here not only the cost cijt, but also cjjt and ckjt, with k ≠ i j. We use five
variables to measure the cost of adopting a patented invention. A country-specific index built by Park
and Lippoldt (2008), iprjt, measures the strictness of intellectual property rights in the recipient
country. A lax patent system can deter the import of foreign technologies, because of the fear of
counterfeiting (see, for example, Maskus, 2000; Smith, 2001; and Barton, 2007). This issue is hotly
debated in the political arena.
Note that iprjt likely affects the propensity to patent in country j, which may make our results more
difficult to interpret. McCalman (2001) shows that the value of patent rights significantly increased in
those countries that had signed the TRIPS agreement in 1994. That increase in value may have two
consequences. First, the increase in the payoff associated with patenting may result in more transfers
of patented technologies, which is what we want to measure. However, it may also result in additional
patent applications for technologies that would have been transferred anyway through trade or FDI.
Consequently, we can overestimate the effect of iprjt on technology transfer.
The variables tariffjt and trade_blocijt capture the existence of potential barriers to international
trade. More precisely, tariffjt is the recipient country’s mean of tariff rates based on data from the
World Trade Organization and the World Bank. Meanwhile, trade_blocijt is a dummy variable
indicating whether the countries are part of the same trade bloc. Arguably, restrictions to trade may
hinder the transfer of technologies embodied in capital equipment goods.
As is usual in the trade literature, we also include the log of the geographic distance13 between
country i and country j, called distanceij. This distance variable is generally viewed as a proxy for
transportation costs. Empirical evidence shows that knowledge flows are affected by distance (Peri,
2005), though less than trade flows.14
16
Foreign direct investments are another well-known channel of technology diffusion. Accordingly,
we include the variable fdi_controljt, which is an index of international capital market control based on
data from the World Economic Forum and the International Monetary Fund.15
Finally, one can reasonably assume that filing a patent in a country where the same language is
spoken reduces transaction costs. Indeed, the applicant saves translation costs, and national legal
systems are likely to be closer. Therefore, languageij is a dummy variable which equals 1 if both
countries share a common official language and 0 otherwise.
The demand for climate change technologies d jt
We use three variables that are common to all technologies: gdp_per_capitajt, popjt,16 and kyotojt.
17
The first one describes country j’s per capita GDP in PPP USD, the second one is the log of its
population, and the last one is a dummy variable equal to one if t > 1997 and if country j is an Annex
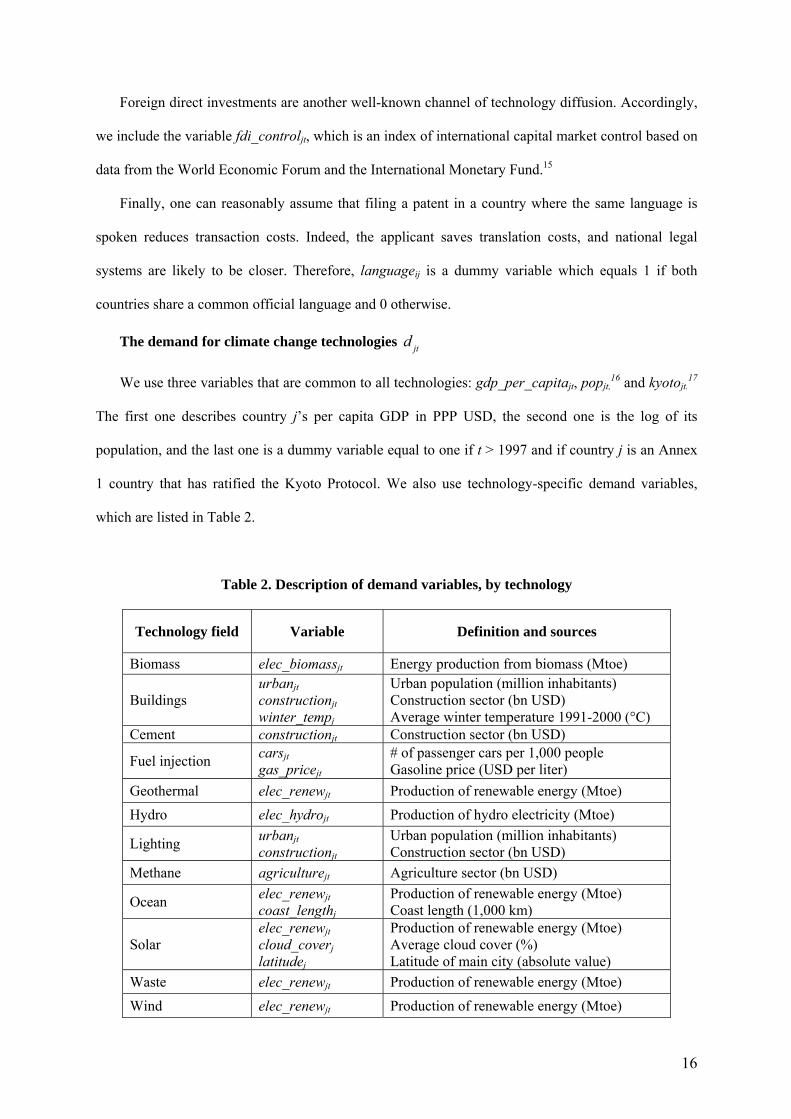
1 country that has ratified the Kyoto Protocol. We also use technology-specific demand variables,
which are listed in Table 2.
Table 2. Description of demand variables, by technology
Technology field Variable Definition and sources
Biomass elec_biomassjt Energy production from biomass (Mtoe)
Buildings urbanjt constructionjt winter_tempj
Urban population (million inhabitants) Construction sector (bn USD) Average winter temperature 1991-2000 (°C)
Cement constructionjt Construction sector (bn USD)
Fuel injection carsjt gas_pricejt
# of passenger cars per 1,000 people Gasoline price (USD per liter)
Geothermal elec_renewjt Production of renewable energy (Mtoe) Hydro elec_hydrojt Production of hydro electricity (Mtoe)
Lighting urbanjt constructionjt
Urban population (million inhabitants) Construction sector (bn USD)
Methane agriculturejt Agriculture sector (bn USD)
Ocean elec_renewjt coast_lengthj
Production of renewable energy (Mtoe) Coast length (1,000 km)
Solar elec_renewjt cloud_coverj latitudej
Production of renewable energy (Mtoe) Average cloud cover (%) Latitude of main city (absolute value)
Waste elec_renewjt Production of renewable energy (Mtoe) Wind elec_renewjt Production of renewable energy (Mtoe)
17
coast_lengthj Coast length (1,000 km)
Sources: International Energy Agency, World Bank 2008, Tyndall Center, World resources Institute, CEPII, United Nations Statistics Division
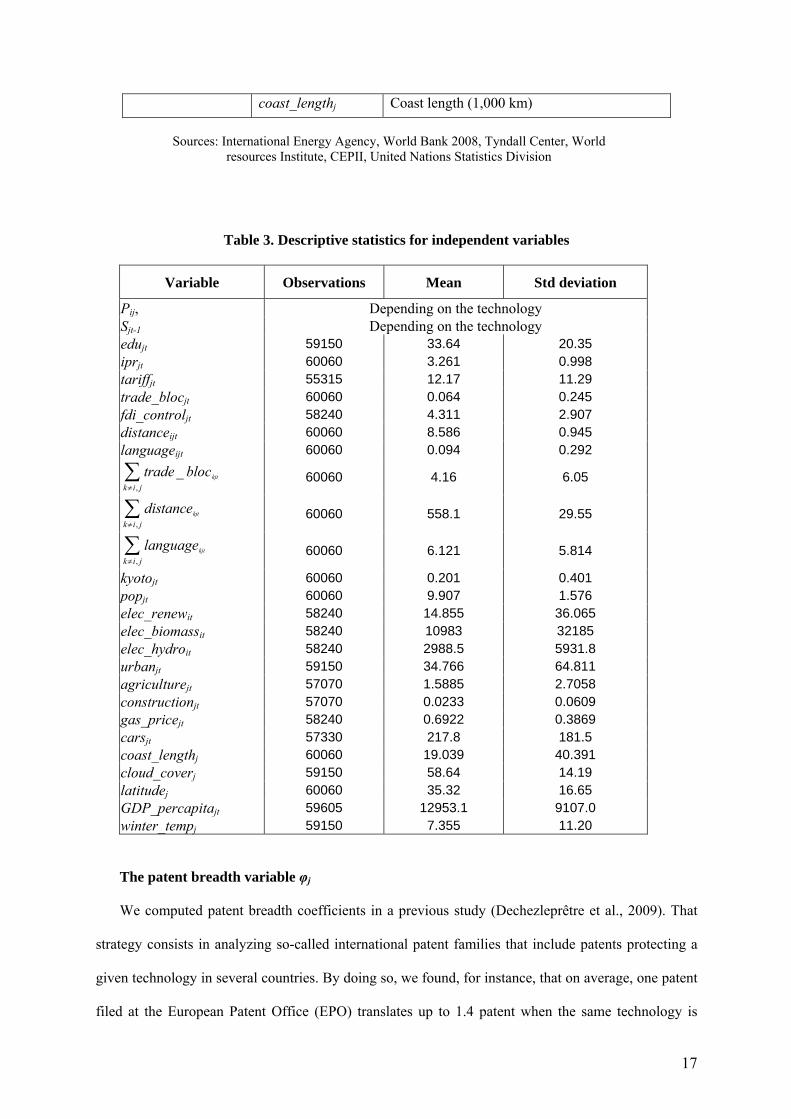
Table 3. Descriptive statistics for independent variables
Variable Observations Mean Std deviation Pij, Depending on the technology Sjt-1 Depending on the technology edujt 59150 33.64 20.35 iprjt 60060 3.261 0.998 tariffjt 55315 12.17 11.29 trade_blocjt 60060 0.064 0.245 fdi_controljt 58240 4.311 2.907 distanceijt 60060 8.586 0.945 languageijt 60060 0.094 0.292
trade _ blockjt
k≠i, j∑ 60060 4.16 6.05
distancekjt
k≠i, j∑ 60060 558.1 29.55
languagekjt
k≠i, j∑ 60060 6.121 5.814
kyotojt 60060 0.201 0.401 popjt 60060 9.907 1.576 elec_renewit 58240 14.855 36.065 elec_biomassit 58240 10983 32185 elec_hydroit 58240 2988.5 5931.8 urbanjt 59150 34.766 64.811 agriculturejt 57070 1.5885 2.7058 constructionjt 57070 0.0233 0.0609 gas_pricejt 58240 0.6922 0.3869 carsjt 57330 217.8 181.5 coast_lengthj 60060 19.039 40.391 cloud_coverj 59150 58.64 14.19 latitudej 60060 35.32 16.65 GDP_percapitajt 59605 12953.1 9107.0 winter_tempj 59150 7.355 11.20
The patent breadth variable φj
We computed patent breadth coefficients in a previous study (Dechezleprêtre et al., 2009). That
strategy consists in analyzing so-called international patent families that include patents protecting a
given technology in several countries. By doing so, we found, for instance, that on average, one patent
filed at the European Patent Office (EPO) translates up to 1.4 patent when the same technology is
18
patented at the Japanese patent office. Setting the weight of applications at the EPO to unity, we
calculated patent breadth coefficients Φj for every patent office included in the PATSTAT database.
These coefficients are available in Dechezleprêtre et al. (2009). We use φj =log Φj in this study.
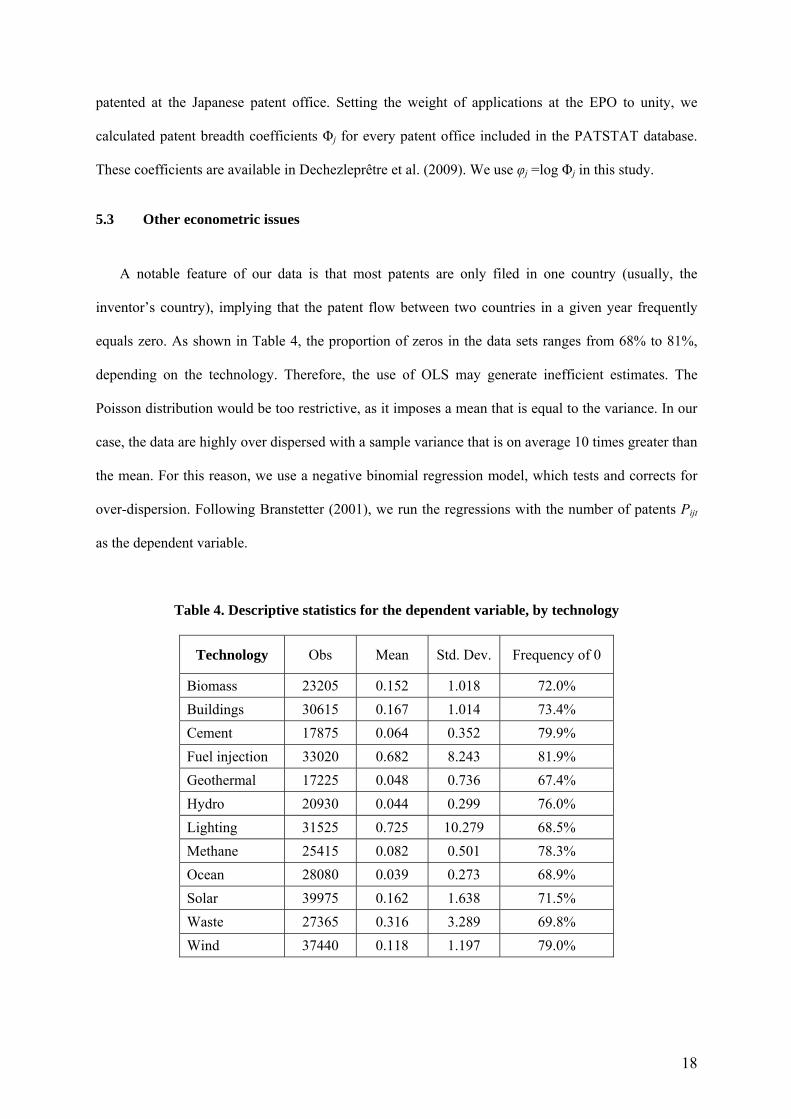
5.3 Other econometric issues
A notable feature of our data is that most patents are only filed in one country (usually, the
inventor’s country), implying that the patent flow between two countries in a given year frequently
equals zero. As shown in Table 4, the proportion of zeros in the data sets ranges from 68% to 81%,
depending on the technology. Therefore, the use of OLS may generate inefficient estimates. The
Poisson distribution would be too restrictive, as it imposes a mean that is equal to the variance. In our
case, the data are highly over dispersed with a sample variance that is on average 10 times greater than
the mean. For this reason, we use a negative binomial regression model, which tests and corrects for
over-dispersion. Following Branstetter (2001), we run the regressions with the number of patents Pijt
as the dependent variable.
Table 4. Descriptive statistics for the dependent variable, by technology
Technology Obs Mean Std. Dev. Frequency of 0
Biomass 23205 0.152 1.018 72.0% Buildings 30615 0.167 1.014 73.4% Cement 17875 0.064 0.352 79.9% Fuel injection 33020 0.682 8.243 81.9% Geothermal 17225 0.048 0.736 67.4% Hydro 20930 0.044 0.299 76.0% Lighting 31525 0.725 10.279 68.5% Methane 25415 0.082 0.501 78.3% Ocean 28080 0.039 0.273 68.9% Solar 39975 0.162 1.638 71.5% Waste 27365 0.316 3.289 69.8% Wind 37440 0.118 1.197 79.0%
19
A further difficulty is that the propensity to patent is just partly controlled by the variable iprjt, which
only reflects cross-border heterogeneity. Yet we know that patenting propensity also varies much
across sectors and technologies. We mitigate this problem by running sector-specific regressions. The
remaining unobserved part is captured by the random term γjt in (5). If γjt is uncorrelated with the
regressors on the right-hand side, then this effect can be estimated using a random-effects model. But
if the random term is correlated, then estimates are biased. A fixed effect estimator cannot totally fix
this problem, since this effect varies over time.
For our estimations, we opted for a random-effects model for the following reasons. First, key
variables such as iprjt or trade_blocijt do not vary much across time. They are thus highly correlated
with country-pair specific effects, which leads to inefficient estimates of their coefficients when using
a fixed effect model. Second, fixed effect estimation causes all groups with zero patent transferred
during the 1990–2003 period to be dropped from the regression, including many potential technology
suppliers, which induces a selection bias. For that same reason, we cannot perform the standard
Hausman test of the random versus fixed effects specification as the models are ran on different
samples.
6 Results
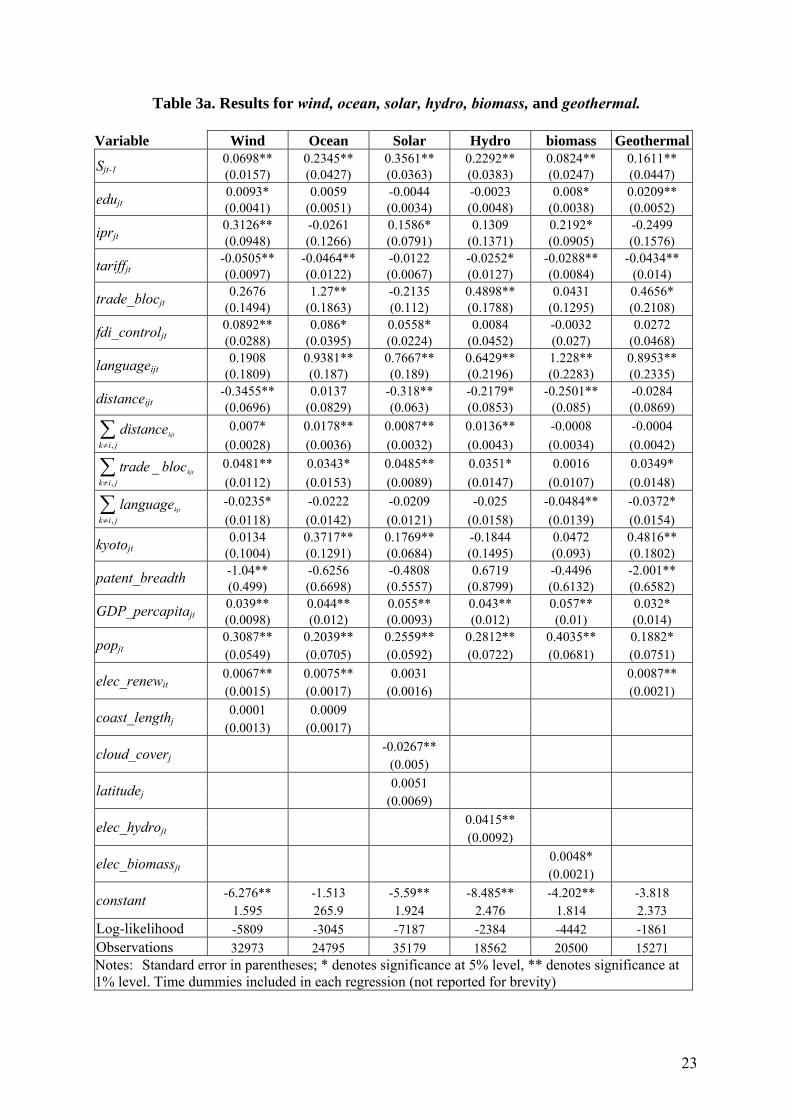
We report the results in Tables 3a and 3b. Estimates across technologies are relatively stable,
although there are some differences, which we will discuss below. We focus the interpretation on six
policy-relevant questions.
1) Does accumulated knowledge facilitate the import of technology? The local stock of
technology-specific knowledge Sjt-1 has a positive impact on the flows of patents in 11 regressions out
of 12. The coefficient is statistically significant at the 0.1% level. There is no doubt that patent
transfers increase if the recipient country is actively involved in R&D in the same technology field.
In contrast, the recipient country’s level of education is statistically significant and has a positive
impact only in five regressions. This suggests that generic absorptive capabilities are less important
than technology-specific knowledge.
20
Counter to an intuitive assessment of the situation, the impact of higher technology-specific
knowledge stock is negative in buildings insulation technologies. A possible explanation is that high
technological capabilities imply strong imitation capacities, which lead some innovators to refrain
from introducing new technologies in the recipient country.
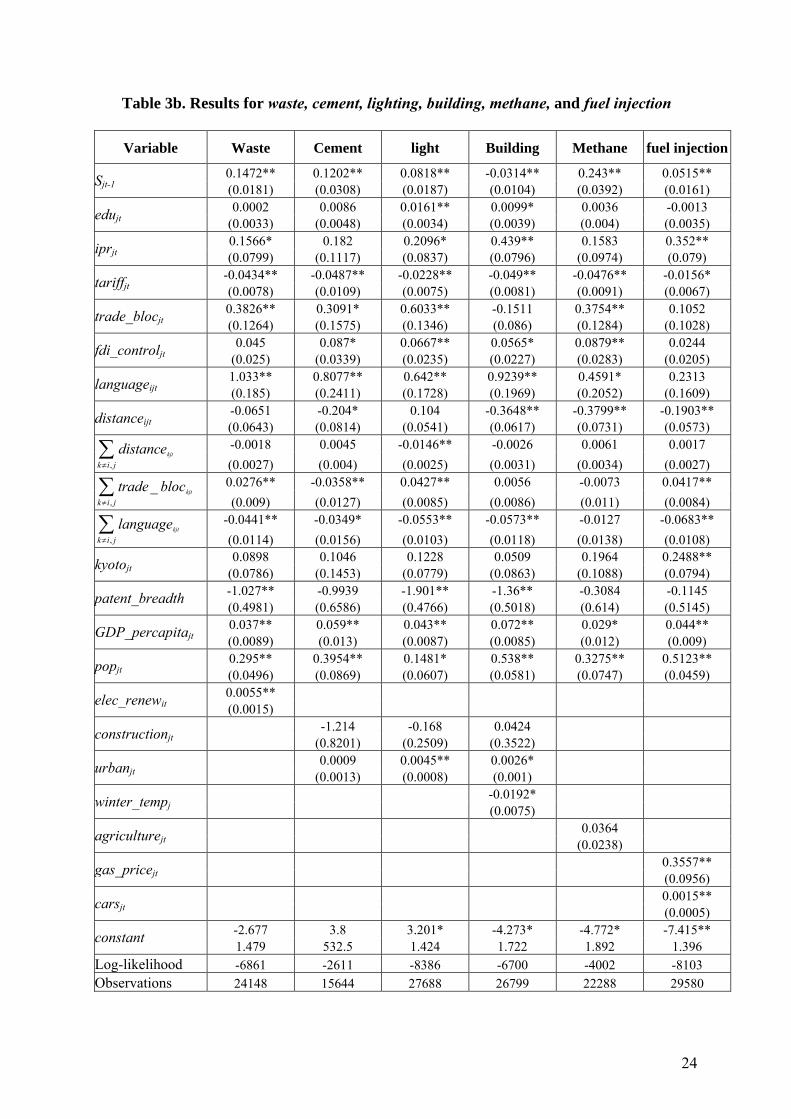
2) Do strict intellectual property rights promote technology transfer? As mentioned earlier,
this issue is very high in the political agenda. Our results suggest a positive influence of strict IP rights
on technology transfer. More precisely, this result holds in 7 regressions out of 12. Exceptions are
three renewable energy technologies (ocean energy, hydro power, and geothermal energy), as well as
methane destruction and cement, on which IP rights have no statistically significant impacts.
When IPR strictness has a significant positive effect, part of the induced patenting could also
reflect a substitution between patented and non-patented knowledge flows, rather than additional
technology flows.
3) Do restrictions on international trade hinder technology transfer? Restrictions to trade
seem to be more important than IPR strictness: Higher tariff rates have a statistically significant
negative impact on patent flows in 11 regressions. This result is confirmed by the fact that being part
of the same trade bloc significantly increases patent flows in seven regressions. This suggests that
transferred technologies are frequently incorporated in equipment goods.
4) Do restrictions on foreign direct investments hinder technology transfer? Stricter
international capital control has a statistically significant positive effect in seven regressions. This is
clearly counter-intuitive. Several factors may explain this result, involving either a real effect on
technology transfers or simply an increased use of patents as a means to secure these transfers. We do
not know the precise contents of FDI regulations in the different countries, since we use a synthetic
index developed by the World Economic Forum, but in some cases FDI control may directly aim at
promoting the transfer of technology through foreign investments. More generally, it is likely that
regulations increase the risk of losing control of transferred technology,18 thus pushing foreign
investors to rely more heavily on patents as a way to secure their intellectual assets. A final
interpretation could be that restrictions on FDI tend to shift technology transfer to other channels—
such as licensing to local users—that are more patent-intensive than FDI.
21
5) Has the Kyoto Protocol accelerated the diffusion of climate-related technology? The
variable kyoto has a statistically significant positive impact on patent flows in 4 regressions over 12.
This suggests that the impact of domestic policy measures related to the protocol is differentiated
across technologies.
Consider first the renewable energy technologies. It appears that the protocol has had an impact on
three technologies—ocean, solar and geothermal technologies—that have a large potential for energy
generation but that are still at an early stage of their technology development and commercial
deployment. The potential for further development of these technologies contrasts with more mature
technologies, such as hydropower, wind power, biomass energy, for which the kyoto dummy is not
statistically significant.
The kyoto variable also has a statistically significant positive impact on the diffusion of motor
vehicle fuel injection, which suggests that the transfer of this technology is particularly responsive to
public policies.
Other variables
Demand variables are either not significant or exhibit the expected signs. For instance, the cloud
coverage in the recipient country reduces the number of solar technologies that are imported. The
transfer of fuel-injection technologies increases with gasoline prices and with number of cars. The
production of renewable electricity promotes the import of renewable energy technologies (see
elec_renew, elec_biomass, elec_hydro), etc.
As expected, technology flows fall as geographic distance increases and rise if both countries
speak the same language. The recipient country’s size (pop) and economic wealth (GDP_percapita)
also promote the importation of technologies.
Finally, the control variable Σdistance has the expected positive impact in many regressions: the
longer the geographical distance between the recipient country j and the technology providers from
countries k≠ i, j, the larger the transfer from country i. Similarly, the higher the number of countries
speaking the same language among countries k≠ i, j (captured by Σlanguage), the less the transfer
from country i. The only potential problem concerns Σtrade_bloc, which should have a negative
22
impact but is actually statistically positive in eight regressions. A likely explanation is that
Σtrade_bloc is a proxy variable for the overall trade openness of the recipient country.
6 Conclusions
In this paper we use the PATSTAT database to analyze the international diffusion of patented
inventions in twelve climate-related technologies between 1990 and 2003. This allows us to draw
conclusions about those factors which promote or hinder international technology transfer.
Regressions show that absorptive capacities of recipient countries are determinant factors. This is
particularly true for technology-specific knowledge, whereas the general level of education exerts less
influence.
We are also able to assess the impacts of different policy barriers. The results stress that
restrictions to international trade—e.g., high tariff rates—and lax intellectual property regimes
negatively influence the international diffusion of patented knowledge. In addition, results suggest
that, unexpectedly, barriers to Foreign Direct Investments promote technology transfer in those cases
where the coefficients are significant. This puzzle can have different interpretations. Perhaps strict
FDI regulations include requirements of technology transfers. Another interpretation is that
restrictions on FDI lead foreign technology owners to rely more systematically on patents, either to
secure their FDI or as an alternative to it.
In conclusion, it is crucial to recall that patents are imperfect proxies of technology transfer
for reasons explained in the paper. This should be kept in mind when interpreting the results. If the
transfer of patented technologies is positively correlated with non-patented knowledge flows (e.g.,
know-how), our work gives a general view of the international diffusion of knowledge. Alternatively,
if they are negatively correlated, because they are substitutes, our results only give a partial view of
the overall picture. Further work is clearly necessary to clarify these points.
23
Table 3a. Results for wind, ocean, solar, hydro, biomass, and geothermal.
Variable Wind Ocean Solar Hydro biomass Geothermal0.0698** 0.2345** 0.3561** 0.2292** 0.0824** 0.1611** Sjt-1 (0.0157) (0.0427) (0.0363) (0.0383) (0.0247) (0.0447) 0.0093* 0.0059 -0.0044 -0.0023 0.008* 0.0209** edujt (0.0041) (0.0051) (0.0034) (0.0048) (0.0038) (0.0052) 0.3126** -0.0261 0.1586* 0.1309 0.2192* -0.2499 iprjt (0.0948) (0.1266) (0.0791) (0.1371) (0.0905) (0.1576) -0.0505** -0.0464** -0.0122 -0.0252* -0.0288** -0.0434** tariffjt (0.0097) (0.0122) (0.0067) (0.0127) (0.0084) (0.014)
0.2676 1.27** -0.2135 0.4898** 0.0431 0.4656* trade_blocjt (0.1494) (0.1863) (0.112) (0.1788) (0.1295) (0.2108) 0.0892** 0.086* 0.0558* 0.0084 -0.0032 0.0272 fdi_controljt (0.0288) (0.0395) (0.0224) (0.0452) (0.027) (0.0468) 0.1908 0.9381** 0.7667** 0.6429** 1.228** 0.8953** languageijt (0.1809) (0.187) (0.189) (0.2196) (0.2283) (0.2335)
-0.3455** 0.0137 -0.318** -0.2179* -0.2501** -0.0284 distanceijt (0.0696) (0.0829) (0.063) (0.0853) (0.085) (0.0869) 0.007* 0.0178** 0.0087** 0.0136** -0.0008 -0.0004
distancekjt
k≠i, j∑
(0.0028) (0.0036) (0.0032) (0.0043) (0.0034) (0.0042) 0.0481** 0.0343* 0.0485** 0.0351* 0.0016 0.0349*
trade _ blockjt
k≠i, j∑
(0.0112) (0.0153) (0.0089) (0.0147) (0.0107) (0.0148) -0.0235* -0.0222 -0.0209 -0.025 -0.0484** -0.0372*
languagekjt
k≠i, j∑
(0.0118) (0.0142) (0.0121) (0.0158) (0.0139) (0.0154) 0.0134 0.3717** 0.1769** -0.1844 0.0472 0.4816** kyotojt (0.1004) (0.1291) (0.0684) (0.1495) (0.093) (0.1802) -1.04** -0.6256 -0.4808 0.6719 -0.4496 -2.001** patent_breadth (0.499) (0.6698) (0.5557) (0.8799) (0.6132) (0.6582) 0.039** 0.044** 0.055** 0.043** 0.057** 0.032* GDP_percapitajt (0.0098) (0.012) (0.0093) (0.012) (0.01) (0.014) 0.3087** 0.2039** 0.2559** 0.2812** 0.4035** 0.1882* popjt (0.0549) (0.0705) (0.0592) (0.0722) (0.0681) (0.0751) 0.0067** 0.0075** 0.0031 0.0087** elec_renewit (0.0015) (0.0017) (0.0016) (0.0021) 0.0001 0.0009 coast_lengthj (0.0013) (0.0017)
-0.0267** cloud_coverj (0.005) 0.0051 latitudej (0.0069) 0.0415** elec_hydrojt (0.0092) 0.0048* elec_biomassjt (0.0021)
-6.276** -1.513 -5.59** -8.485** -4.202** -3.818 constant 1.595 265.9 1.924 2.476 1.814 2.373
Log-likelihood -5809 -3045 -7187 -2384 -4442 -1861 Observations 32973 24795 35179 18562 20500 15271 Notes: Standard error in parentheses; * denotes significance at 5% level, ** denotes significance at 1% level. Time dummies included in each regression (not reported for brevity)
24
Table 3b. Results for waste, cement, lighting, building, methane, and fuel injection
Variable Waste Cement light Building Methane fuel injection
0.1472** 0.1202** 0.0818** -0.0314** 0.243** 0.0515** Sjt-1 (0.0181) (0.0308) (0.0187) (0.0104) (0.0392) (0.0161) 0.0002 0.0086 0.0161** 0.0099* 0.0036 -0.0013 edujt (0.0033) (0.0048) (0.0034) (0.0039) (0.004) (0.0035)
0.1566* 0.182 0.2096* 0.439** 0.1583 0.352** iprjt (0.0799) (0.1117) (0.0837) (0.0796) (0.0974) (0.079) -0.0434** -0.0487** -0.0228** -0.049** -0.0476** -0.0156* tariffjt (0.0078) (0.0109) (0.0075) (0.0081) (0.0091) (0.0067) 0.3826** 0.3091* 0.6033** -0.1511 0.3754** 0.1052 trade_blocjt (0.1264) (0.1575) (0.1346) (0.086) (0.1284) (0.1028)
0.045 0.087* 0.0667** 0.0565* 0.0879** 0.0244 fdi_controljt (0.025) (0.0339) (0.0235) (0.0227) (0.0283) (0.0205) 1.033** 0.8077** 0.642** 0.9239** 0.4591* 0.2313 languageijt (0.185) (0.2411) (0.1728) (0.1969) (0.2052) (0.1609) -0.0651 -0.204* 0.104 -0.3648** -0.3799** -0.1903** distanceijt (0.0643) (0.0814) (0.0541) (0.0617) (0.0731) (0.0573) -0.0018 0.0045 -0.0146** -0.0026 0.0061 0.0017
distancekjt
k≠i, j∑
(0.0027) (0.004) (0.0025) (0.0031) (0.0034) (0.0027) 0.0276** -0.0358** 0.0427** 0.0056 -0.0073 0.0417**
trade _ blockjt
k≠i, j∑
(0.009) (0.0127) (0.0085) (0.0086) (0.011) (0.0084) -0.0441** -0.0349* -0.0553** -0.0573** -0.0127 -0.0683** languagekjt
k≠i, j∑
(0.0114) (0.0156) (0.0103) (0.0118) (0.0138) (0.0108) 0.0898 0.1046 0.1228 0.0509 0.1964 0.2488** kyotojt (0.0786) (0.1453) (0.0779) (0.0863) (0.1088) (0.0794)
-1.027** -0.9939 -1.901** -1.36** -0.3084 -0.1145 patent_breadth (0.4981) (0.6586) (0.4766) (0.5018) (0.614) (0.5145) 0.037** 0.059** 0.043** 0.072** 0.029* 0.044** GDP_percapitajt (0.0089) (0.013) (0.0087) (0.0085) (0.012) (0.009) 0.295** 0.3954** 0.1481* 0.538** 0.3275** 0.5123** popjt (0.0496) (0.0869) (0.0607) (0.0581) (0.0747) (0.0459) 0.0055** elec_renewit (0.0015)
-1.214 -0.168 0.0424 constructionjt (0.8201) (0.2509) (0.3522) 0.0009 0.0045** 0.0026* urbanjt (0.0013) (0.0008) (0.001) -0.0192* winter_tempj (0.0075) 0.0364 agriculturejt (0.0238) 0.3557** gas_pricejt (0.0956) 0.0015** carsjt (0.0005)
-2.677 3.8 3.201* -4.273* -4.772* -7.415** constant 1.479 532.5 1.424 1.722 1.892 1.396
Log-likelihood -6861 -2611 -8386 -6700 -4002 -8103 Observations 24148 15644 27688 26799 22288 29580
25
References
Arora, A., Ceccagnoli, M. and W.M. Cohen, 2008. R&D and the Patent Premium. International
Journal of Industrial Organization, 26: 5, pp. 1153-1179.
Barton, J., 2007. Intellectual Property and Access to Clean Energy Technologies in Developing
Countries. An Analysis of Solar Photovoltaic, Biofuel and Wind Technologies. ICTSD Programme on
Trade and Environment, Issue Paper No. 2.
Branstetter L.G. 2001. Are knowledge spillovers international or intranational in scope?
Microeconometric evidence from the U.S. and Japan. Journal of International Economics, 53, pp. 53-
79.
Branstetter L.G., R. Fisman and C.F. Foley, 2006. Do Stricter Intellectual Property Rights Increase
International Technology Transfers? Empirical Evidence from U.S. Firm-Level Panel Data. The
Quarterly Journal of Economics, 121(1), pp. 321-349
Coe, D., Helpman, E., 1995. International R&D Spillovers. Europea Economic Review 39:5, pp. 859–
87.
Cohen, W.M., Nelson, R.R., Walsh, J.P., 2000. Protecting their Intellectual Assets: Appropriability
Conditions and Why U.S. Manufacturing Firms Patent (or Not). NBER Working Paper no. 7552.
Dechezleprêtre, A., Glachant, M., Hascic, I., Johnstone, N., Ménière, Y., 2009. Invention and Transfer
of Climate Change Mitigation Technologies on a Global Scale: A Study Drawing on Patent Data.
Working paper.
Dekker, T., Vollebergh, H. R.J., De Vries, F. P., Withagen, C. 2009. Inciting Protocols - How
International Environmental Agreements Trigger Knowledge Transfers. Presented at the EAERE
Conference, June 25-27, Amsterdam.
Dernis, H., Guellec, D., 2001. Using Patent Counts for Cross-Country Comparisons of Technology
Output, STI Review 27
(http://www.oecd.org/LongAbstract/0,3425,en_2649_33703_21682516_1_1_1_1,00.html).
Eaton, J., Kortum, S., 1996. Trade in ideas Patenting and productivity in the OECD. Journal of
International Economics, vol. 40(3-4), pages 251-278, May
Eaton, J., Kortum, S. 1999. International Technology Diffusion: Theory and Measurement.
International Economic Review, vol. 40(3), pages 537-70, August.
Frietsch, R., Schmoch, U. 2006. Technological structures and performance as reflected by patent
indicators. in Schmoch, U.; Rammer, C.; Legler, H. (eds.) National Systems of Innovation in
26
comparison. Structure and performance indicators for knowledge societies. (Dordrecht: Springer)
Griliches, Z., 1990. Patent Statistics as Economic Indicators: A Survey. Journal of Economic
Literature, Vol. 28, No. 4, pp. 1661-1707.
Hascic I. and N. Johnstone. 2009. The Kyoto Protocol and International Technology Transfer: An
Empirical Analysis Using Patent Data. Presented at the EAERE Conference, June 25-27, Amsterdam.
Helfgott, S., 1993. Patent filing costs around the world. Journal of the Patent and Trademark Office
Society, July, pp. 567-580.
Hoekman, B. M., Maskus, K. E., Saggi, K., 2005. Transfer of technology to developing countries:
Unilateral and multilateral policy options, World Development, 33(10), pages 1587-1602.
Jaffe, A., Tratjenberg, M., Henderson R. 1993. Geographic localization of knowledge spillovers as
evidenced by patent citations. The Quarterly Journal of Economics 108(3), pp. 577-98.
Keller; W., 2002. Geographic localization of international technology diffusion, American Economic
Review, 92, 120-142.
Keller; W., 2004. International technology diffusion, Journal of Economic Literature, 42(3), pp. 752-
782.
Lanjouw, J.O., Mody, A., 1996. Innovation and the International Diffusion of Environmentally
Responsive Technology. Research Policy, Vol. 25, pp. 549-571.
Lanjouw, J., A. Pakes and J. Putnam (1998), “How to Count Patents and Value Intellectual Property:
Uses of Patent Renewal and Application Data”, The Journal of Industrial Economics, Vol. 46 (4), pp.
405-432.
Lichtenberg, F., van Pottelsberghe de la Potterie, B., 2000. Does Foreign Direct Investment Transfer
Technology Across Borders? Review of Economics and Statistics, vol. 83(3), 490-497
Maskus, K. E., 2000. Intellectual Property Rights in the Global Economy. Institute for International
Economics, Washington D.C.
McCalman, P. (2001) "Reaping what you sow: an empirical analysis of international patent
harmonization", Journal of International Economics, 55, 161-186.
McKinsey & Vattenfall, 2007. A global mapping of Greenhouse Gas abatement opportunities up to
2030. Available at http://www.vattenfall.com/www/ccc/ccc/577730downl/index.jsp
Park, W. G., Lippoldt, D. C., 2008. Technology Transfer and the Economic Implications of the
Strengthening of Intellectual Property Rights in Developing Countries, OECD Trade Policy Working
Papers 62, OECD Trade Directorate.
27
Peri, G., 2005. Determinants of knowledge flows and their effect on innovation. Review of Economics
and Statistics 87 (2), 308– 322.
Roland Berger Market Research, 2005. Study on the cost of patenting. Available at:
http://www.european-patent-office.org/epo/new/cost_analysis_2005_study_en.pdf
Smith, P. J., 2001. How do foreign patent rights affect U.S. exports, affiliate sales, and licenses?
Journal of International Economics, 55, 411-439.
28
Annex 1. Definition of IPC codes
Description Class
Buildings Insulation or other protection; Elements or use of specified material for that purpose.
E04B 1/62
Heat, sound or noise insulation, absorption, or reflection; Other building methods affording favorable thermal or acoustical conditions, e.g. accumulating of heat within walls
E04B 1/74–78
Insulating elements for both heat and sound E04B 1/88 Units comprising two or more parallel glass or like panes in spaced relationship, the panes being permanently secured together
E06B 3/66–67
Wing frames not characterized by the manner of movement, specially adapted for double glazing
E06B3/24
Use of energy recovery systems in air conditioning, ventilation or screening. F24F 12/00 Biomass Solid fuels based on materials of non-mineral origin—animal or plant C10L 5/42-44 Engines operating on gaseous fuels from solid fuel—e.g. wood F02B 43/08 Liquid carbonaceous fuels - organic compounds C10L 1/14 Anion exchange - use of materials, cellulose or wood B01J 41/16 Cement Natural pozzuolana cements C04B 7/12–13 Cements containing slag C04B 7/14–21 Iron ore cements C04B 7/22 Cements from oil shales, residues or waste other than slag C04B 7/24-30 Calcium sulfate cements C04B 11/00 Fuel injection Arrangements of fuel-injection apparatus with respect to engines; Pump drives adapted top such arrangements F02M 39/00
Fuel-injection apparatus with two or more injectors fed from a common pressure-source sequentially by means of a distributor F02M 41/00
Fuel-injection apparatus operating simultaneously on two or more fuels or on a liquid fuel and another liquid, e.g. the other liquid being an anti-knock additive
F02M 43/00
Fuel-injection apparatus characterized by a cyclic delivery of specific time/pressure or time/quantity relationship F02M 45/00
Fuel-injection apparatus operated cyclically with fuel-injection valves actuated by fluid pressure F02M 47/00
Fuel-injection apparatus in which injection pumps are driven, or injectors are actuated, by the pressure in engine working cylinders, or by impact of engine working piston
F02M 49/00
Fuel injection apparatus characterized by being operated electrically. F02M 51/00 Fuel-injection apparatus characterized by heating, cooling, or thermally-insulating means F02M 53/00
Fuel-injection apparatus characterized by their fuel conduits or their venting means F02M 55/00
Fuel injectors combined or associated with other devices F02M 57/00 Pumps specially adapted for fuel-injection and not provided for in groups F02M 39/00 to F02M 57/00 F02M 59/00
Fuel injection not provided for in groups F02M 39/00 to F02M 57/00 F02M 61/00 Other fuel-injection apparatus, parts, or accessories having pertinent characteristics not provided for F02M 63/00
29
Testing fuel-injection apparatus, e.g. testing injection timing F02M 65/00 Low-pressure fuel-injection apparatus F02M 69/00 Combinations of carburetors and low-pressure fuel-injection apparatus F02M 71/00 Geothermal Other production or use of heat, not derived from combustion—using natural or geothermal heat F24J 3/00-08
Devices for producing mechanical power from geothermal energy F03G 4/00-06 Hydro power
Machines or engines of reaction type (i.e. hydraulic turbines) F03B 3/00
Water wheels F03B 7/00 Adaptations of machines or engines for liquids for special use; Power stations or aggregates; Stations or aggregates of water-storage type; Machine or engine aggregates in dams or the like; Submerged units incorporating electric generators
F03B 13/06-10
Controlling machines or engines for liquids F03B15/00 Lighting Gas- or vapor-discharge lamps (Compact Fluorescent Lamp) H01J 61/00 Electroluminescent light sources (LED) H05B 33/00 Methane capture Anaerobic treatment of sludge; Production of methane by such processes C02F 11/04 Biological treatment of water, waste water, or sewage: Anaerobic digestion processes
C02F 3/28
Apparatus with means for collecting fermentation gases, e.g. methane C12M 1/107 Ocean power Tide or wave power plants E02B 9/08 Adaptations of machines or engines for special use—characterized by using wave or tide energy F03B 13/12-26
Mechanical-power-producing mechanisms—using pressure differences or thermal differences occurring in nature; ocean thermal energy conversion F03G 7/04-05
Water wheels F03B 7/00 Solar power Semiconductor devices sensitive to infra-red radiation, light, electromagnetic radiation of shorter wavelength, or corpuscular radiation and specially adapted either for the conversion of the energy of such radiation into electrical energy or for the control of electrical energy by such radiation—adapted as conversion devices, including a panel or array of photoelectric cells, e.g. solar cells
H01L 31/042-058
Generators in which light radiation is directly converted into electrical energy H02N 6/00 Aspects of roofing for energy collecting devices—e.g. including solar panels E04D 13/18 Use of solar heat, e.g. solar heat collectors; Receivers working at high temperature, e.g. solar power plants; having lenses or reflectors as concentrating elements
F24J 2/06-18
Devices for producing mechanical power from solar energy F03G 6/00-06 Use of solar heat; Solar heat collectors with support for article heated, e.g. stoves, ranges, crucibles, furnaces or ovens using solar heat F24J 2/02
Use of solar heat; solar heat collectors F24J 2/20-54 Drying solid materials or objects by processes involving the application of heat by radiation—e.g. from the sun F26B 3/28
Waste Solid fuels based on materials of non-material origin—refuse or waste C10L 5/46-48 Machine plant or systems using particular sources of energy—waste F25B 27/02 Hot gas or combustion—Profiting from waste heat of exhaust gases F02G 5/00-04 Incineration of waste—recuperation of heat F23G 5/46
30
Plants or engines characterized by use of industrial or other waste gases F01K 25/14 Prod. of combustible gases—combined with waste heat boilers C10J 3/86 Incinerators or other apparatus consuming waste—field organic waste F23G 7/10 Manufacture of fuel cells—combined with treatment of residues H01M 8/06 Wind power Wind motors with rotation axis substantially in wind direction F03D 1/00-06 Wind motors with rotation axis substantially at right angle to wind direction F03D 3/00-06 Other wind motors F03D 5/00-06 Controlling wind motors F03D 7/00-06 Adaptations of wind motors for special use F03D 9/00-02 Details, component parts, or accessories not provided for in, or of interest apart from, the other groups of this subclass F03D 11/00-04
Annex 2. Proof of Proposition 1
By differentiating (1) with respect to njjt, we obtain the following M first-order conditions:
∂Wt
∂njjt
= a1 njjt( )a1 −1nkjt
k≠ j∏⎛
⎝⎜⎞
⎠⎟
a2
K jta3 Djt
a4 − C jjt = 0, for j = 1,..M
Rearranging this expression, we obtain an expression of njjt which we will use in the following:
njjt =
C jjt
a1K jta3 Djt
a4
⎛
⎝⎜⎜
⎞
⎠⎟⎟
−1
1−a1
nkjtk≠ j∏⎛
⎝⎜⎞
⎠⎟
a2
1−a1
, for j = 1,..M (A.1)
Then the differentiation of (1) with respect to nij with i ≠ j yields the M (M-1) conditions
∂Wt
∂nijt
= a2 njjt( )a1 nkjtk≠ j∏⎛
⎝⎜⎞
⎠⎟
a2
(nijt )a2 −2 K jt
a3 Djta4
− Cijt = 0, for i, j = 1,..M and i ≠ j
Substituting (2) in each of these conditions and rearranging, we obtain
a2 a1a1 C jjt( )−a1 nkjt
k≠ j∏⎛
⎝⎜⎞
⎠⎟
a2
K jta3 Djt
a4
⎡
⎣
⎢⎢
⎤
⎦
⎥⎥
11−a1
(nijt )a2 −2 = Cijt for i, j = 1,..M and i ≠ j (A2)
Then, we multiply for each j the M-1 conditions (A2). This leads to
nkjtk≠ j∏ = ckjt
k≠ j∏⎡
⎣⎢
⎤
⎦⎥
1/ Z
a2
a1a1 K jt
a3 Djta4
C jjt
a1
⎛
⎝⎜⎜
⎞
⎠⎟⎟
11−a1
⎡
⎣
⎢⎢⎢
⎤
⎦
⎥⎥⎥
1− MZ
for j = 1,..M
31
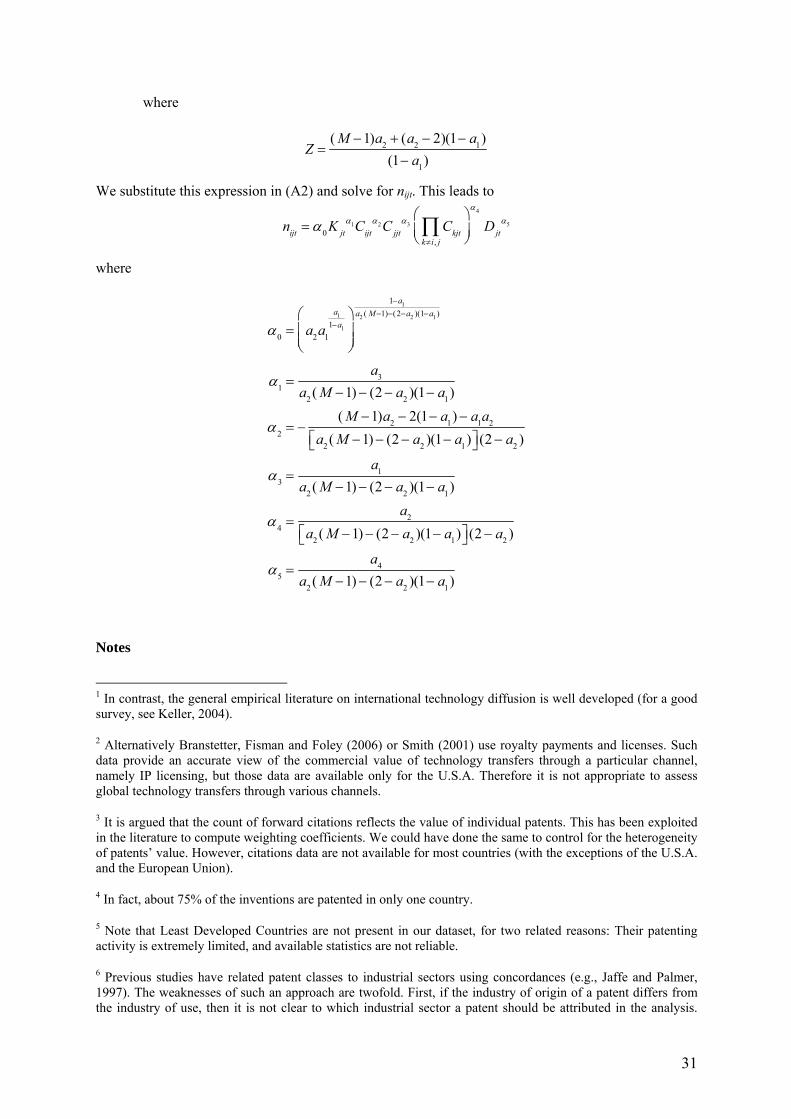
where
Z =
( M −1)a2 + (a2 − 2)(1− a1)(1− a1)
We substitute this expression in (A2) and solve for nijt. This leads to
nijt = α0 K jt
α1Cijtα2C jjt
α3 Ckjtk≠i, j∏
⎛
⎝⎜⎞
⎠⎟
α4
Djtα5
where
α0 = a2a1
a11−a1
⎛
⎝⎜⎜
⎞
⎠⎟⎟
1−a1a2 ( M−1)−(2−a2 )(1−a1 )
α1 =a3
a2 ( M −1)− (2 − a2 )(1− a1)
α2 = −( M −1)a2 − 2(1− a1)− a1a2
a2 ( M −1)− (2 − a2 )(1− a1)⎡⎣ ⎤⎦ (2 − a2 )
α3 =a1
a2 ( M −1)− (2 − a2 )(1− a1)
α4 =a2
a2 ( M −1)− (2− a2 )(1− a1)⎡⎣ ⎤⎦ (2− a2 )
α5 =a4
a2 ( M −1)− (2 − a2 )(1− a1)
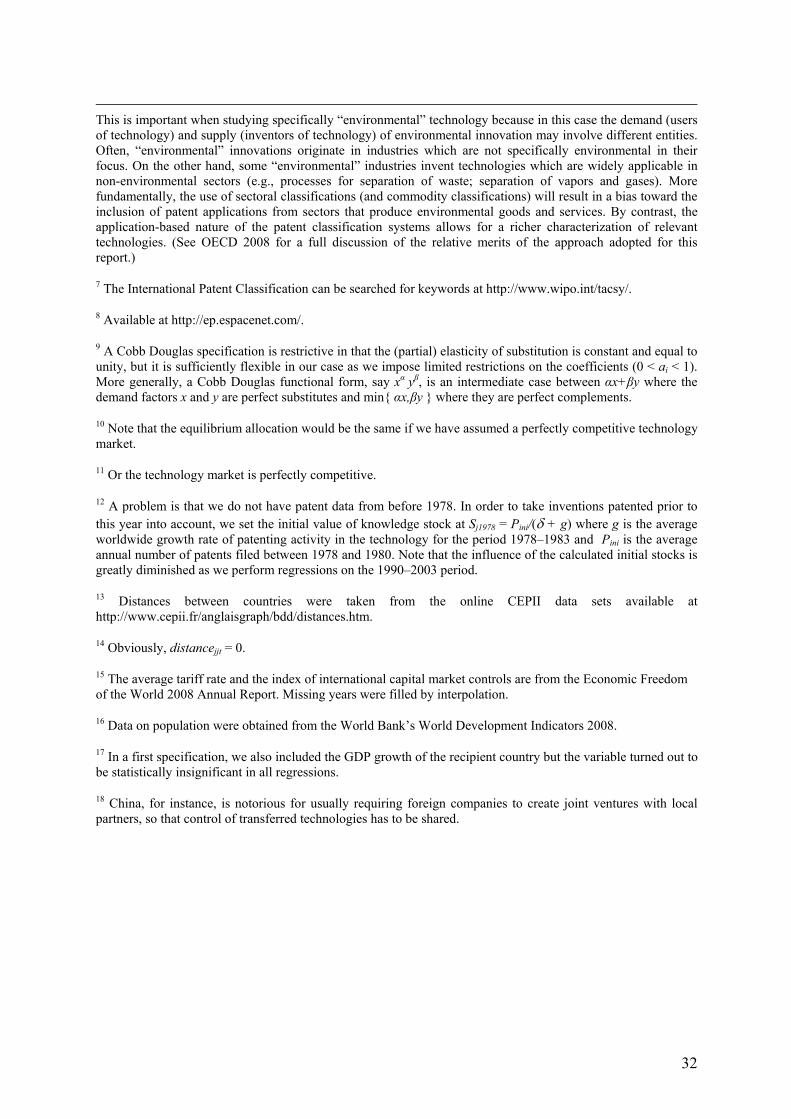
Notes
1 In contrast, the general empirical literature on international technology diffusion is well developed (for a good survey, see Keller, 2004).
2 Alternatively Branstetter, Fisman and Foley (2006) or Smith (2001) use royalty payments and licenses. Such data provide an accurate view of the commercial value of technology transfers through a particular channel, namely IP licensing, but those data are available only for the U.S.A. Therefore it is not appropriate to assess global technology transfers through various channels.
3 It is argued that the count of forward citations reflects the value of individual patents. This has been exploited in the literature to compute weighting coefficients. We could have done the same to control for the heterogeneity of patents’ value. However, citations data are not available for most countries (with the exceptions of the U.S.A. and the European Union).
4 In fact, about 75% of the inventions are patented in only one country.
5 Note that Least Developed Countries are not present in our dataset, for two related reasons: Their patenting activity is extremely limited, and available statistics are not reliable.
6 Previous studies have related patent classes to industrial sectors using concordances (e.g., Jaffe and Palmer, 1997). The weaknesses of such an approach are twofold. First, if the industry of origin of a patent differs from the industry of use, then it is not clear to which industrial sector a patent should be attributed in the analysis.
32
This is important when studying specifically “environmental” technology because in this case the demand (users of technology) and supply (inventors of technology) of environmental innovation may involve different entities. Often, “environmental” innovations originate in industries which are not specifically environmental in their focus. On the other hand, some “environmental” industries invent technologies which are widely applicable in non-environmental sectors (e.g., processes for separation of waste; separation of vapors and gases). More fundamentally, the use of sectoral classifications (and commodity classifications) will result in a bias toward the inclusion of patent applications from sectors that produce environmental goods and services. By contrast, the application-based nature of the patent classification systems allows for a richer characterization of relevant technologies. (See OECD 2008 for a full discussion of the relative merits of the approach adopted for this report.)
7 The International Patent Classification can be searched for keywords at http://www.wipo.int/tacsy/.
8 Available at http://ep.espacenet.com/.
9 A Cobb Douglas specification is restrictive in that the (partial) elasticity of substitution is constant and equal to unity, but it is sufficiently flexible in our case as we impose limited restrictions on the coefficients (0 < ai < 1). More generally, a Cobb Douglas functional form, say xα yβ, is an intermediate case between αx+βy where the demand factors x and y are perfect substitutes and min{ αx,βy } where they are perfect complements.
10 Note that the equilibrium allocation would be the same if we have assumed a perfectly competitive technology market.
11 Or the technology market is perfectly competitive.
12 A problem is that we do not have patent data from before 1978. In order to take inventions patented prior to this year into account, we set the initial value of knowledge stock at Sj1978 = Pini/(δ + g) where g is the average worldwide growth rate of patenting activity in the technology for the period 1978–1983 and Pini is the average annual number of patents filed between 1978 and 1980. Note that the influence of the calculated initial stocks is greatly diminished as we perform regressions on the 1990–2003 period.
13 Distances between countries were taken from the online CEPII data sets available at http://www.cepii.fr/anglaisgraph/bdd/distances.htm.
14 Obviously, distancejjt = 0.
15 The average tariff rate and the index of international capital market controls are from the Economic Freedom of the World 2008 Annual Report. Missing years were filled by interpolation.
16 Data on population were obtained from the World Bank’s World Development Indicators 2008.
17 In a first specification, we also included the GDP growth of the recipient country but the variable turned out to be statistically insignificant in all regressions.
18 China, for instance, is notorious for usually requiring foreign companies to create joint ventures with local partners, so that control of transferred technologies has to be shared.
NOTE DI LAVORO DELLA FONDAZIONE ENI ENRICO MATTEI
Fondazione Eni Enrico Mattei Working Paper Series
Our Note di Lavoro are available on the Internet at the following addresses: http://www.feem.it/getpage.aspx?id=73&sez=Publications&padre=20&tab=1
http://papers.ssrn.com/sol3/JELJOUR_Results.cfm?form_name=journalbrowse&journal_id=266659 http://ideas.repec.org/s/fem/femwpa.html
http://www.econis.eu/LNG=EN/FAM?PPN=505954494 http://ageconsearch.umn.edu/handle/35978
http://www.bepress.com/feem/
NOTE DI LAVORO PUBLISHED IN 2010 GC 1.2010 Cristina Cattaneo: Migrants’ International Transfers and Educational Expenditure: Empirical Evidence from
Albania SD 2.2010 Fabio Antoniou, Panos Hatzipanayotou and Phoebe Koundouri: Tradable Permits vs Ecological Dumping SD 3.2010 Fabio Antoniou, Panos Hatzipanayotou and Phoebe Koundouri: Second Best Environmental Policies under
Uncertainty SD 4.2010 Carlo Carraro, Enrica De Cian and Lea Nicita: Modeling Biased Technical Change. Implications for Climate
Policy IM 5.2010 Luca Di Corato: Profit Sharing under the threat of Nationalization SD 6.2010 Masako Ikefuji, Jun-ichi Itaya and Makoto Okamura: Optimal Emission Tax with Endogenous Location
Choice of Duopolistic Firms SD 7.2010 Michela Catenacci and Carlo Gipponi: Potentials and Limits of Bayesian Networks to Deal with Uncertainty
in the Assessment of Climate Change Adaptation Policies GC 8.2010 Paul Sarfo-Mensah and William Oduro: Changes in Beliefs and Perceptions about the Natural Environment
in the Forest-Savanna Transitional Zone of Ghana: The Influence of Religion IM 9.2010 Andrea Boitani, Marcella Nicolini and Carlo Scarpa: Do Competition and Ownership Matter? Evidence from
Local Public Transport in Europe SD 10.2010 Helen Ding and Paulo A.L.D. Nunes and Sonja Teelucksingh: European Forests and Carbon Sequestration
Services : An Economic Assessment of Climate Change Impacts GC 11.2010 Enrico Bertacchini, Walter Santagata and Giovanni Signorello: Loving Cultural Heritage Private Individual
Giving and Prosocial Behavior SD 12.2010 Antoine Dechezleprêtre, Matthieu Glachant and Yann Ménière: What Drives the International Transfer of
Climate Change Mitigation Technologies? Empirical Evidence from Patent Data