Embed Size (px)
Citation preview

NOTA DILAVORO105.2010
By Maurizio Ciaschini, Francesca Severini, Claudio Socci and Rosita Pretaroli, University of Macerata
The Economic Impact of the Green Certificate Market through the Macro Multiplier Approach

The opinions expressed in this paper do not necessarily reflect the position of Fondazione Eni Enrico Mattei
Corso Magenta, 63, 20123 Milano (I), web site: www.feem.it, e-mail: [email protected]
INSTITUTIONS AND MARKETS Series Editor: Fausto Panunzi
The Economic Impact of the Green Certificate Market through the Macro Multiplier Approach By Maurizio Ciaschini, Francesca Severini, Claudio Socci and Rosita Pretaroli, University of Macerata Summary In the last decade, as many other European countries, the Italian Government adopted several reforms in order to increase the use of Renewable Energy Sources (RES). The liberalization of the electricity market that represents one of these reforms aims to reach environmental benefits from the substitution of fossil fuel with renewable sources. The Italian Green Certificate market was introduced in 2002 in order to accomplish this objective and represents a mechanism where a quota of renewable electricity is imposed to suppliers in proportion to their sales. The electricity industries are obliged to meet this condition by producing the quantity of renewable electricity by means of a change in their production process, otherwise they must buy a number of certificates corresponding to the quota. This mechanism changes the importance of the electricity industry first in promoting climate protection, then in terms of the impact on the economy as a whole. A policy aimed to develop the market of green certificates may lead to environmental improvement by switching the energy production process to renewable resources. But above all an increase in demand for green certificates, resulting from a reform on the quota of renewable electricity, can generate positive change in all components of the industrial production. For this purpose, the paper aims to quantify the economic impact of a reform on Green Certificate market for the Italian system by means of the Macro Multiplier (MM) approach. The analysis is performed through the Hybrid Input-Output (I-O) model that allows expressing the energy ows in physical terms (GWh) while all other ows are expressed in monetary terms (€). Moreover, through the singular value decomposition of the inverse matrix of the model, which reveals the set of key structures of the exogenous change of final demand, we identify the appropriate key structure able to obtain both the expected positive total output change and the increase of electricity production from RES. Keywords: Environmental Policy, Hybrid I-O model, Macro Multiplier JEL Classification: C67, E23, Q43, Q48 Address for correspondence: Claudio Socci Department of Communication Science Via Armaroli 9 62100 Macerata Italy Phone +39 0733 258 2560 Fax +39 0733 258 2553 E-mail: socci [email protected]

The economic impact of the Green Certificate market through the Macro
Multiplier approach
Maurizio Ciaschini, Francesca Severini, Claudio Socci∗ and Rosita Pretaroli
University of Macerata
In the last decade, as many other European countries, the Italian Government adopted several reforms in
order to increase the use of Renewable Energy Sources (RES). The liberalization of the electricity market
that represent one of these reforms aims to reach environmental benefits from the substitution of fossil fuel
with renewable sources.The Italian Green Certificate market was introduced in 2002 in order to accomplish
this objective and represents a mechanism where a quota of renewable electricity is imposed to suppliers in
proportion to their sales. The electricity industries are obliged to meet this condition by producing the quantity
of renewable electricity by means of a change in their production process, otherwise they must buy a number
of certificates corresponding to the quota. This mechanism changes the importance of the electricity industry
first in promoting climate protection, than in terms of the impact in the economy as a whole. A policy aimed
to develop the market of green certificates may lead to environmental improvement by switching the energy
production process to renewable resources. But above all an increase in demand for green certificates, resultant
from a reform on the quota of renewable electricity, can generate positive change in all components of the
industrial production. For this purpose, the paper aims to quantify the economic impact of a reform on Green
Certificate market for the Italian system by means of the Macro Multiplier (MM) approach. The analysis is
performed through the Hybrid Input-Output (I-O) model that allows expressing the energy flows in physical
terms (GWh) while all other flows are expressed in monetary terms (e). Moreover, through the singular value
decomposition of the inverse matrix of the model, which reveals the set of key structures of the exogenous
change of final demand, we identify the appropriate key structure able to obtain both the expected positive
total output change and the increase of electricity production from RES.
Keywords: Environmental Policy, Hybrid I-O model, Macro Multiplier
JEL classification: C67, E23, Q43, Q48.
∗Corresponding author. e-mail: socci [email protected], Department of Communication Science, Via Armaroli 9, 62100
Macerata-Italy; Phone +39 0733 258 2560, Fax +39 0733 258 2553

2 M. Ciaschini et al.
1 Introduction
The Italian Green Certificates scheme (GC) represents one of the four Italian basic mechanisms
that took place in 2002 after the liberalization of electricity market, which was introduced by
the energy market reform (legislative decree 79/99)1. According to the Italian GC system, all
suppliers or distributors of electricity - that that lay on the network more than 100 GWh year -
are compelled to produce a quota of renewable electricity in proportion to their extra sales: the
quota is represented by the 2% of the excess in total production of electricity2. In better words,
producers are obliged to produce or purchase a quota of renewable electricity in proportion to
their extra sales when they exceed the annual quota3. The production of green electricity is
certificated by the Italian Authority for the Energy Services (ESM) that emits the certificates,
which represent the green quality of each unit of renewable electricity generation 4.
A green certificates market can be organized following two different schemes depending on the
identity of the agent that purchases the certificate property right. It might correspond to the
energy producer and/or distributor rather than the final consumer5. In both cases, since every
unit of renewable electricity generation is represented by the physical part and its associated
green value, alongside the traditional physical electricity market, a new market is established. A
market where green certificates can be accumulated and then sold, for example, when the value
is increased as a result of market demand6.
The GC scheme aims to create a market where electricity from renewable sources can be sold
with high margins of profit so that traditional electricity producing industries are stimulated
to change their processes towards ways of production characterized by less costs of production
and lower emissions of CO27. As an incentive for renewable energy sources usage in electricity
production processes, the GC scheme refers to the general issue concerning policy instruments
for markets that are affected by externalities. As known, in presence of negative externalities,
such as costs of pollution, the Government can restore economic efficiency using command-
1The other mechanisms introduced after the liberalization of the market are respectively: energy account both for solar
photovoltaic and thermodynamic; grants form EU, National and Regional Governs; voluntary certification of quality.2The quota has been incremented: +0,35% from 2004 to 2006 and +0,75% from 2007 to 2012.3Many other reforms modified the Italian GC system during the last decade: financial law 2008, D.M. 18/12/2008 and law
99/09.4At present, the market of GC and its development represents a crucial tool in the recent European energy policy, which
fixed an an ambitious goal: the increase of 20% in the energy production by renewable sources for the year 2020.5This mechanism supposes that energy consumers (households and firms) are responsible for environmental damage and
gives the possibility to consider the generation of electricity from renewable sources. This setting is adopted in Denmark
but it is also characterised by lofty transaction costs that make it unpopular within consumers judgment. According to the
first scheme energy producers and/or distributers receive green certificates equivalent to the amount of renewable electricity
produced. The policy maker imposes a quota of renewable electricity to suppliers in proportion to their sales. The operators
that are subjected to the quotas have two possibilities to respect their quota: producing themselves the quantity of renewable
electricity buying new technologies or, in alternative, buying each year the certificates corresponding to the quotas. The
choice between this two arrangements depends on the opportunities to get a revenue from the certificate trading.6In this respect the GC mechanism facilitates trade of green electricity since the obligation may be fulfilled by buying GC
either together with physical electricity or separately.7It is commonly known that the potential of renewable to supply energy is very high. No resource constraints exist for
solar, wind, geothermal and wave, but the expansion of the hydro energy production is limited and there is no consensus as
regards the limits for sustainable bio energy (Stoutenborough and Beverlin 2008, Haug 2007)

The economic impact of the GC market through the MM approach 3
and-control regulations, or in alternative, market-based polices (Parry 2002). These approaches
include taxes on Greenhouse Gas emissions by firms and subsidy programs that are known as
policy instruments for dealing with externalities (Baumol and Oates 1988). In alternative to
taxes and subsidies, which usually are discouraged because of their potential consequences on
different income distribution between Household groups, there exist many other market-based
instruments such as GC system that avoid the direct Government involvement (Goulder et al.
1999). Most European countries adopted a set of economic instruments based on price regulation
mechanisms (feed-in tariffs)8 or quantity regulation mechanisms (tradable energy quotas or
“green certificate”)9 to encourage the production of RES electricity. Nevertheless neither the
economic theory nor the practical experience in the appliance of green certificates or feed-in
tariffs can suggest a clear advantage of one instrument over the other even though both two are
distinct in terms of cost-efficacy10.
Under this aspect, the element that becomes more prominent is represented by the very closely
interaction between policy on RES with climate change policy. It has to be stressed that the
mechanisms of GC do not directly determine an environmental benefit in terms of reducing CO2
emissions. However, the promotion of RES can be justified by the environmental improvement
obtained each time the production process of energy will replace fossil fuels with renewable
sources. Moreover the exigency to promote renewable energy sources in electricity generation
allows considering the development of the market for GC as an opportunity to achieve economic
objectives like as the positive change in total output. From that point of view, the policies
designed to encourage RES usage through the green certificates system, might have major eco-
nomic relevance in terms of positive impact on industrial production because of the existence
of multisectoral interdependency between all components of total output. Since the level of de-
mand for green certificates is imposed by Government through the obligation target, a policy
establishing a higher target may lead both to a positive change in industrial output and a better
balance between renewable and non-renewable energy.
In this respect, the paper aims to quantify the economic impact of the GC market and the
change in the renewable and non-renewable energy balance. The object is to verify the effects of
policies designed to promote energy from RES by means of the Hybrid multisectoral approach,
which evaluates both the interdependence between all production processes and the relevance of
each commodity in the whole system. The Hybrid Input-Output (I-O) model is the suitable toll
in order to analyze the energy commodity that is characterized by non unitary pricings, which are
ruled by regulation in primary and finally markets. This feature is inconsistent with traditional
Input-Output approach which assumes unitary pricing across all commodities (Dietzenbacher
8Used in Germany, Spain, France and Portugal.9United Kingdom, Italy, Belgium, Sweden, Netherlands and Denmark.10Exchangeable quotas of green certificates were introduced in Netherlands, United Kingdom, Belgium, Italy, Denmark
and Sweden only in 2001 for the electricity market. For an extended analysis focused on institutional setting for green
certificate in these countries see Schaeffer et al. (2000), Van Dijk (2003), Jensen and Skytte (2002). Recently the European
Commission has strongly encouraged the adoption of these instruments in an harmonised way with the aim of limiting the
cost of European policy by allowing the development of the renewable energy sources (EC 2004).

4 M. Ciaschini et al.
and Stage 2006)11. In this case, since the flows of energy commodity would be assessed in mon-
etary terms the presence of administered pricings would lead to ambiguous results (Lahr 1993).
Furthermore, the hybrid I-O is particularly useful in order to evaluate effects of policies designed
for the GC market where the governmental quota is expressed in physical terms (GWhyear).
This approach allows expressing the flows in physical and monetary terms where the rows
include flows measured in energy units (GWh) corresponding to energy deliveries. Thus by means
of the hybrid I-O model it is possible to find the Leontief inverse, which can be used to compare
the results between the innovative approach of the Macro Multipliers (MM) and the traditional
analysis of multipliers (Ciaschini and Socci 2007). Through the MM approach that is based on
the decomposition of the inverse matrix of the model, the key structure of the exogenous variable
(final demand change) can be identified in order to obtain the expected total output change or
the expected renewable and non-renewable energy balance (Ciaschini and Socci 2006). In fact,
since the results of the traditional multipliers analysis are affected by the unrealistic structure of
the exogenous shock (Ciaschini et al. 2009), the Macro Multipliers analysis overcomes this limit
by the singular value decomposition (SVD) of the Leontief inverse. In fact, the MM approach
allows for the identification and quantitative determination of the aggregated Macro Multipliers
(MM), which lead the economic interactions, and the key structures of macroeconomic variables
that either hide or activate these forces.
For this purpose, the second section illustrates the hybrid I-O model based on the Input-
Output table for Italian economy for the 2005 (EUROSTAT 2008, 2009) which is integrated
with the data on the RES demand in physical terms (GWh) (ISTAT 2007). The third section
describes the innovative MM approach based on the Singular Value Decomposition of the inverse
matrix of the Hybrid I-O model. In the fourth section the results of the policies are showed. In
particular we will implement the empirical simulation focusing on three different scenarios. The
first is based on an exogenous shock on final demand that has the same structure of the observed
demand vector in the I-O table. The second scenario reproduces an exogenous shock on final
demand according to the dominating key structure suggested by the MM approach. This type
of policy, that is oriented to achieve the maximum output change, might allow reaching a better
result in terms of a better balance between energy production through fossil fuel and renewable
electricity. The third one aims to quantify the impact on both the balance between renewable
and non-renewable energy and output change when the exogenous shock is modelled according
to a policy control structure oriented to reach the maximum change of RES production.
2 Hybrid Input-Output model
As well as the traditional I-O approach, the Hybrid I-O model allows to evaluate the effects
of a final demand change on the economy as a whole given the structural interrelations among
industries (Polenske 1976). But the hybrid approach also allows evaluating the effects of a policy
11The hybrid Input-Output model is commonly applied to analyse the impact of environmental and energy policies because
it usually avoids the limits of a monetary approach (Miller and Blair 2009).

The economic impact of the GC market through the MM approach 5
of reform modelled in physical and monetary terms (Miller and Blair 2009).
The Hybrid I-O model represents n commodities: the index m identifies commodities whose
flows are expressed in monetary term, and k identifies the energy commodity, whose flows are
expressed in physical terms. Thus, the total requirement of the energy good by each commodity,
which can be called ”energy intensity”, is expressed in physical terms (GWh) and can be easily
determined by solving the Hybrid I-O model.
The fundamental equation of the model is given by:
x∗ = A∗ · x∗ + f∗ (1)
The vector x∗ is the output vector and its elements are all expressed in monetary terms (e)
with the exception of energy commodity, which is expressed in physical terms (GWh). The same
detail is adopted for the elements of the the vector f∗ that is the vector of the hybrid final
demand. Moreover, A∗ is the matrix of the hybrid technical coefficients that can be defined as:
A∗ = B∗ · (x̂∗)−1 (2)
where matrix B∗ is the hybrid matrix of I-O intermediate flows.
Matrix B is of dimension nxn and can be defined as the following:
B∗ =
{bij where i is commodity which is expressed in monetary terms
bkj where k is energy commodity which is expressed in physical terms
Vector f∗ is of dimension nx1:
f∗ =
{fi where i is expressed in monetary terms
fk where k is expressed in physical terms
Vector f∗ is of dimension nx1:
x∗ =
{xi where i is expressed in monetary terms
xk where k is expressed in physical terms
The matrices blocks whose elements are expressed according the same measurement unit can
be represented as follow:
B∗ =
[e e
GWh GWh
], f∗ =
[e
GWh
], x∗ =
[e
GWh
]
In this respect, according equation 2, matrix A∗ is represented as:
A∗
=
[e/e e/GWh
GWh/e GWh/GWh
](3)

6 M. Ciaschini et al.
Therefore, the solution of the hybrid model is expressed by the equation:
∆x∗ = [I−A∗]−1 ·∆f∗ (4)
that describes the relation between the change on policy control (final demand change, ∆f∗) and
the resulting change in the objective variable (total output change, ∆x∗).
The inverse matrix can be defined as:
R∗ = [I−A∗]−1 (5)
and represents the Leontief inverse of the hybrid model, which quantifies the direct and indirect
effects of final demand on total output.
3 Macro Multiplier approach
The traditional analysis that is based on matrix R∗ allows to reach knowledge about the eco-
nomic connection between the variables represented in the model (Round 2003). However, the
predetermined structure of the exogenous shock, which must be adopted when the traditional
multipliers analysis is performed, represents an important shortcoming that has led a major part
of the literature to advise against this approach (Skolka 1986).
Avoiding the main criticisms associated to traditional analysis in this paper we use the Macro
Multiplier (MM) in order to identifying the most convenient structure of the policy control (final
demand for renewable energy) by which the shock on the economy is modelled. The innovative
MM approach that is based on the Singular Value Decomposition of the Leontief inverse, can
identify the most efficient structure (or a desired structure) of the control variable that generates
the highest effect (or the desired one) in the policy variable (Ciaschini et al. 2009). All the
measures built starting from matrix R are not independent from the structure of neither the
exogenous shock vector nor of the vector on which we observe the effects. In this respect, the
possibility to consider the scale effect in conjunction with the composition effect became crucial
when we design the policy variable (Ciaschini 1989).
Matrix R∗ can be decomposed through the Singular Value Decomposition (Lancaster and
Tiesmenetsky 1985) and rewritten as the product of three different matrices:
R∗ = Z ·M ·PT (6)
The matrix Z = [z1 . . . zm] is a unitary matrix of dimension mxm whose columns represent
the structures of the objective variables (the total output) through which all the results are
observed and evaluated. These structures are called the key-structures of the policy-objectives.
The matrix P = [p1 . . .pn] is a unitary matrix of dimension nxn whose rows represent the
structures of the policies control. Such structures measure and establish the composition of all
the possible policies control: they are called the key-structures of the policy-control. Finally, the
matrix M is a diagonal matrix of dimension mxn with all elements equal to zero outside the

The economic impact of the GC market through the MM approach 7
diagonal. The elements along the diagonal represent aggregate multipliers, which are all real,
positive and ordered according their magnitude as: m1 ≥ m2 ≥ . . . ≥ mp ≥ 0.
The structures identified play a fundamental role in determining the potential behaviour of
the economic system: we can evaluate which will be the effect on total output of all possible final
demand structures. In this respect, we note that matrix R hides the fundamental combinations
of the policy variables (total output). Each of them is obtained multiplying the corresponding
combination of final demand by a predetermined scalar, which has in fact the role of aggregated
multiplier (Ciaschini et al. 2009, 2010).
The decomposition of the inverse matrix of the Hybrid I-O model can be compacted as:
R = [Z1Z2]
[M1 0
0 0
] [PT
1
PT2
](7)
that is
R = Z1 ·M1 ·PT1 (8)
where M1 is a rxr diagonal matrix where m are the non-zero Macro Multipliers. Z1 mxr repre-
sents the first r columns of matrix Z and is the orthonormal base in the objective space Z (R).
In the same way P1 (nxr) represents the first r columns of matrix P and corresponds to the
orthonormal base in the policy control space ϑ(R).
From this considerations it is possible to emphasize some interesting features of the decompo-
sition proposed. If RT ·R = (Z ·M · PT )T · (Z ·M · PT ) = P ·M2 · PT Macro Multipliers are
the square root of RT ·R eigenvalues, that is mi =√λi(RT ·R). Moreover the policy controls
key-structures pi are obtained as eigenvectors of RT ·R.
Similarly, if we consider R ·RT = (Z ·M ·PT ) · (Z ·M ·PT )T = Z ·M2 ·ZT Macro Multipliers
can also be calculated as square root of R ·RT eigenvalues, that is mi =√λi(R ·RT ). Moreover
the vectors that represent the key structures of policy objective zi correspond to the eigenvectors
of R ·RT .
It is worthwhile to mention that the key structures of policy objective are different from the
key structures of policy control since the matrix R is not symmetrical.
R · p1 = m1 · z1 (9)
p1 corresponds to the dominating key structure of policy control and z1 is the corresponding
key structure of the policy objective12.
Once implemented the set of key structures both for the policy variable and the policy ob-
jective, it is necessary to focus on some methodological aspects concerning the definition of
a suitable measure that allows to evaluate changes on multidimensional variables as the final
12All methodological details about MM approach are defined in appendix B.

8 M. Ciaschini et al.
demand or the total output.
Given a vector that shows the value of the sectoral components of a macro variable, defining
the structure of such macro variable, the delicate question of how to define its scale emerges. In
other words it is fundamental to define which scalar should be associated to the disaggregate
components of the macro variable in order to obtain consistent results in different levels of
aggregation.
Our interest focus on multidimensional macro variables in order to operate on the multidi-
mensional policy objectives using the multidimensional policy control. For this reason we need
to consider the rotation effect with respect to the axis that all the policy vectors with constant
absolute variation manifest. The matrixes through which we operate have the ability to compress
and expand the vectors. The axis rotation alters vectors coordinates but the transformation is
not uniform. It would be worth to take into account an aggregation criteria able to generate a
set of vectors whose characteristics are neutral with the respect to an axes rotation. In this case
the alteration of all vectors can be attributed only to the structural matrix transformation.
An aggregation criterion that overcomes these drawbacks is that of assigning to the vectors
scale the value of its modulus. All the policy vectors that have the same modulus, by describing
a circle whose radius corresponds to the modulus, are invariant with respect to rotations of the
axis.
The most immediate aggregation criteria is represented by the sum of sectoral elements. If
we consider that every single component can assume both positive or negative value - because
they can represent the activities balance of some variables (foreign debt) or the modification of a
pre-existing situation - we define this procedure synthetically as sum =∑pi. Vectors that show
the same sum will be allocated along the same line. In the policy application, this aggregation
procedure can be very interesting when simulating the zero-balance policies where the aggregate
level of the macro variable is unchanged and all the variation are compensated within the same
controlled macro variable. It is however apparent that the balance criteria is unable to define
the scale of a macro variable since the balance may hide variation of very different relevance.
Another criteria adopted to quantifies the real amount of resources that have been activated is
represented by the sum of the absolute values of the vector components: abs change(p) =∑|pi|.
The absolute change of vector p quantifies the amount of the policy manoeuvre in terms both
of expansion realized and the restraints imposed to sectors. In the income redistribution process
for example, this measure indicates the total effort of higher revenues to maintain a certain level
and the expansion of lower revenues. If the balance between these trends is positive, the policy
maker can respond employing new resources.
In our application we decided to use the absolute change as the suitable and convenient aggre-
gation criteria to synthesize the characteristics of the macro variable. In particular, the absolute
change allows to observe all key structures focusing on the the amount of the policy manoeuvre
both in monetary and physical terms.

The economic impact of the GC market through the MM approach 9
4 Policies for electricity production from renewable energy sources: Italian case
The application that we propose aims to evaluate the impact of a policy that stimulates the
production of energy by means the Italian production of energy from renewable sources. The
analysis is based on the Italian I-O table for the year 2005 (ISTAT 2007) that has a disaggregation
of 59x59 commodities. We emended the I-O flows with data in physical terms regarding the
requirement of renewable energy per each commodity. Our manipulation on the Italian I-O table
allows to construct a new data scheme which represents the Hybrid I-O table with a structure of
60x60 where 59 commodities and and only the 60th commodity represents the renewable energy
source good.
The first block of the data base represents the flows of intersectoral relationship among com-
modities and they are expressed in monetary terms apart from the flows of ”renewable energy
sources” that can be expressed in euro and GWh13. The second block refers to final demand
and the last row is still headed to renewable energy sources flows. The I-O table is closed by the
block of value added and the row of imports that guarantees the correspondence between row
and column totals. This new Hybrid I-O table represents the proper data set to implement the
Hybrid I-O model.
The original problem of the I-O model consists in the search of the output vector consistent
with the final demand vector for I-O sectors, given the structural interrelation among commodi-
ties. Such a vector faces both the predetermined final demand vector (f∗) by commodities and
the induced commodity demand. From the I-O matrix it is possible to identify the constant
technical coefficients matrix (A∗) and the inverse of the model, obtained according to the equa-
tion 4, shows the total requirements of commodity output per unit of final demand (exogenous
variable).
The simulations proposed concern three different scenarios: i) the first analyses the impact
on the balance between renewable and non-renewable electricity and total output of a shock
in final demand of 0.10%. The shock is distributed according the predetermined structure of
final demand observed in the I-O table; ii) the second scenario aims to achieve an increase on
the balance between renewable and non-renewable energy with a policy oriented to maximise
the total output change. In this second simulation the shock in final demand is of the same
amount of the first simulation but the structure of the exogenous shock has the structure of
the domination key policy revealed by the MM approach; iii) the third scenario considers the
impact on total output of a policy oriented to maximize the balance between renewable and
non-renewable energy. This balance is valuated with the ratio between renewable energy output
and total energy output (RNR ratio). In this last instance the scenario assumes a change on
final demand of the same amount of the first and second scenarios but here we adopt the key
structure oriented to renewable energy source production.
13The official statistics distinguish the total demand of renewable energy sources expressed in GWh (ISTAT 2007), in
intermediate requirement per each commodity and final consumption. The total renewable energy sources production is
59,600 GWh.

10 M. Ciaschini et al.
i) The change in final demand for the first simulation is of 1,683 million of Euro14 and
has, in disaggregate terms, the same structure observed in the I-O table. Even though this
assumption might be considered realistic, it does not represent the better policy structure
in terms of economic performances. Looking at figure 1, a positive impact on aggregate
and disaggregate output is verified and the most relevant result is observed for commodities
pertaining to tertiary sector 15.
Figure 1. Impacts of the final demand change (0.10%) according the pre existing I-O structure
0
100
200
1 2 3 4 5 6 7 8 9 10 11 12 13 14 15 16 17 18 19 20 21 22 23 24 25 26 27 28 29 30 31 32 33 34 35 36 37 38 39 40 41 42 43 44 45 46 47 48 49 50 51 52 53 54 55 56 57 58 59 60
commodities
final demand output
Gwh
In aggregate terms the principal economic and energetic indicators are showed in second
column (∆f∗) of the table 1. The shock in final demand of 0.10% generates an increase in total
production and thus in value added. The production of energy from renewable sources raises in
absolute terms for 12 GWh 16, but the balance between renewable and non-renewable energy
does not change in percentage terms (16.89% before the shock).
The structure used in this first simulation generates an increase in green certificates supply
for 1.35%, and this can be interpreted as a positive result even though the policy on the whole
is ”neutral” in terms balance between renewable and non-renewable energy. The limit of this
simulation derives from the fact that intersectoral linkages are completely ignored in favour of
the composition of the policy variable. It is crucial at this point to identify alternative scenarios
in which policy variable structures are oriented to a complex objective, as for example, the
14The variation is determined according to the absolute value of vector elements that can be considered as the amount of
the policy.15The classification of commodities is shown in appendix B, table A1.16In figure 1 the change in energy production is green coloured.

The economic impact of the GC market through the MM approach 11
Table 1. Aggregate results: comparison among the three different scenarios(0.10 of GDP
Final demand
I-O Structure (f) Structure 1 (p1) Structure 51 (p51)
∆f∗ = 0.10% ∆f∗1 = 0.10% ∆f∗51 = 0.10%
Multiplier change(a) 1.874 2.005 1.514
RNR ratio(b) 16.89% 16.92% 17.05%
Green certificates variation 1.35% 3.32% 11.72%
Value added variation 0.10% 0.63% -0.03%
(a) Indicator calculated as the ratio between the sum of output vec-
tor absolute values and the sum of final demand vector absolute value.
(b) Ratio between renewable energy output and total energy output.
increase in total output or/and a better balance between renewable and non-renewable energy.
ii) For this purpose in the second application we used the Macro Multiplier approach
that allows to define the best composition of the policy control according to the objective of the
policy maker. The singular value decomposition of the inverse matrix of the model permits to
obtain the key structures (mi · zi) favourable for the selected good. In order to reach this result
it is necessary to adopt a specific structure of the final demand (pi) according to the policy
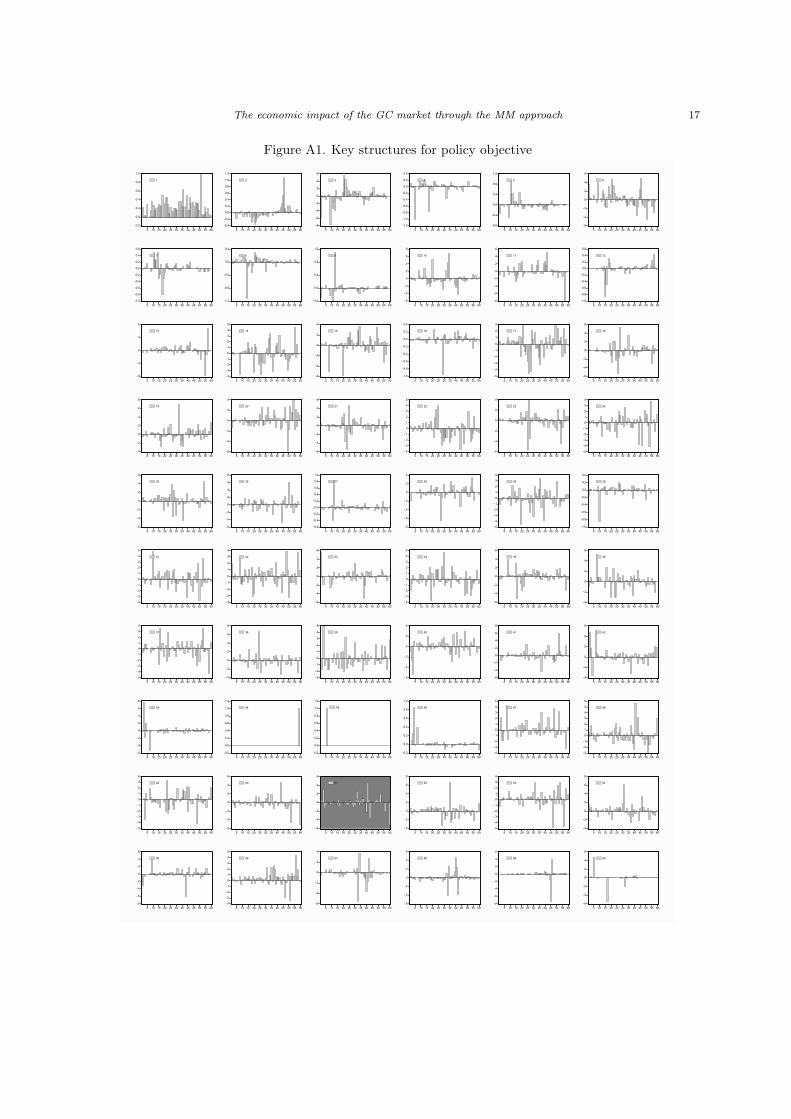
objective. Figure A1, in appendix A, illustrates the 60 key structure. Only the first one allows
to achieve the policy objective that is interpreted as the maximum change on total output.
This is the reason why the simulation considers this structure and assumes the same amount
of the shock on final demand (0.10% corresponding to 1.683 million of euro). Figure 2 puts
into evidence the differences between the final demand structure adopted in simulation (i) (I-O
structure) and the structure chosen in this case (key structure 1 of policy control).
The distribution of total change of output is different from the previous one, even though the
shock is of the same amount17.
The figure 3 summarises the results in disaggregate terms whereas the aggregate results are
described by the third column of table 1. According to key structure 1 of policy control, the
increase of final demand of 0.10% generates a multiple effect in economic terms higher than the
previous scenario. Value added in fact rises of 0.63% . At the same time the balance between
renewable and non-renewable energy registers a slight improvement and the percentage reaches
the 16.92%. This result depends on the increase in energy production from renewable sources
that is equal to 147 GWh and generates an increase in green certificates emission (+3.32%).
As it can be seen from table 1 the policy on final demand structured as key structure 1 is the
most favourable policy for the total output and the value added variables. Moreover the policy
is consistent with a better balance between renewable and non-renewable energy.
17The structure used for the second scenario is more balanced than the structure of final demand observed in the I-O table.

12 M. Ciaschini et al.
Figure 2. The differences between the composition of the final demand according to the I-O structureand the key structure 1 of policy control
0
70
140
1 2 3 4 5 6 7 8 9 10 11 12 13 14 15 16 17 18 19 20 21 22 23 24 25 26 27 28 29 30 31 32 33 34 35 36 37 38 39 40 41 42 43 44 45 46 47 48 49 50 51 52 53 54 55 56 57 58 59 60
I-O structure
key structure 1 of policy control
commodities
Gwh
Figure 3. Impacts of the final demand change (0.10%) according to the key structure 1 of policy control
0
125
250
1 2 3 4 5 6 7 8 9 10 11 12 13 14 15 16 17 18 19 20 21 22 23 24 25 26 27 28 29 30 31 32 33 34 35 36 37 38 39 40 41 42 43 44 45 46 47 48 49 50 51 52 53 54 55 56 57 58 59 60
commodities
final demand
output
Gwh
iii) Finally, the third scenario aims to identify the final demand composition suitable for
the best result in terms of balance between renewable and non-renewable energy: in this case
the policy maker aims to reach the maximum level of the environmental indicator. For this
purpose the proper key structure of the policy control variable (final demand) among the 60
key structures described in figure A1, is the one that activates the key structure of the policy

The economic impact of the GC market through the MM approach 13
variable that presents the highest effect on the production of renewable energy sources. The
structure consistent with this objective is the structure number 5118. Once the key structure
has been identified (p51) the final demand shock of 0.10% (1,683 million of euro) is distributed
according to its structure and the results are showed in figure 4. The environmental objective
can be achieved only implementing a policy based on a quite complex distribution of resources.
Figure 4. Impacts of the final demand change (0.10%) according to the key structure 51 of policy control
-300
-200
-100
0
100
200
300
400
500
600
1 2 3 4 5 6 7 8 9 10 11 12 13 14 15 16 17 18 19 20 21 22 23 24 25 26 27 28 29 30 31 32 33 34 35 36 37 38 39 40 41 42 43 44 45 46 47 48 49 50 51 52 53 54 55 56 57 58 59 60
commodities
final demand
output
Gwh
The aggregate results of this application are summarised in the fourth column of table 1. Even
if the total value added decreases of 0.03%, the balance between renewable and non-renewable
energy reaches the highest level assessing at 17.05%. The production of renewable energy sources
increases of 518 GWh and the supply of green certificates raise of 11.72%. This policy can be
interpreted as an environmental oriented policy that requests a new composition of the final
demand change that favours the production of renewable energy intensive commodities. This
policy, in fact, allows to generates the best results in terms of balance between renewable and
non-renewable energy with a slight negative effect on the change of value added.
5 Conclusion
The promotion of renewable energy sources in electricity production have increased in the last
20 years in the wake of the recent consideration for environmental question. The concern for
climate changes in fact led many countries to concentrate in designing optimal instruments to
reduce Greenhouse Gas Emissions and face the environmental damage and depleting. Among
18In figure A1, appendix B, the structure 51 is different coloured with respect to the others.
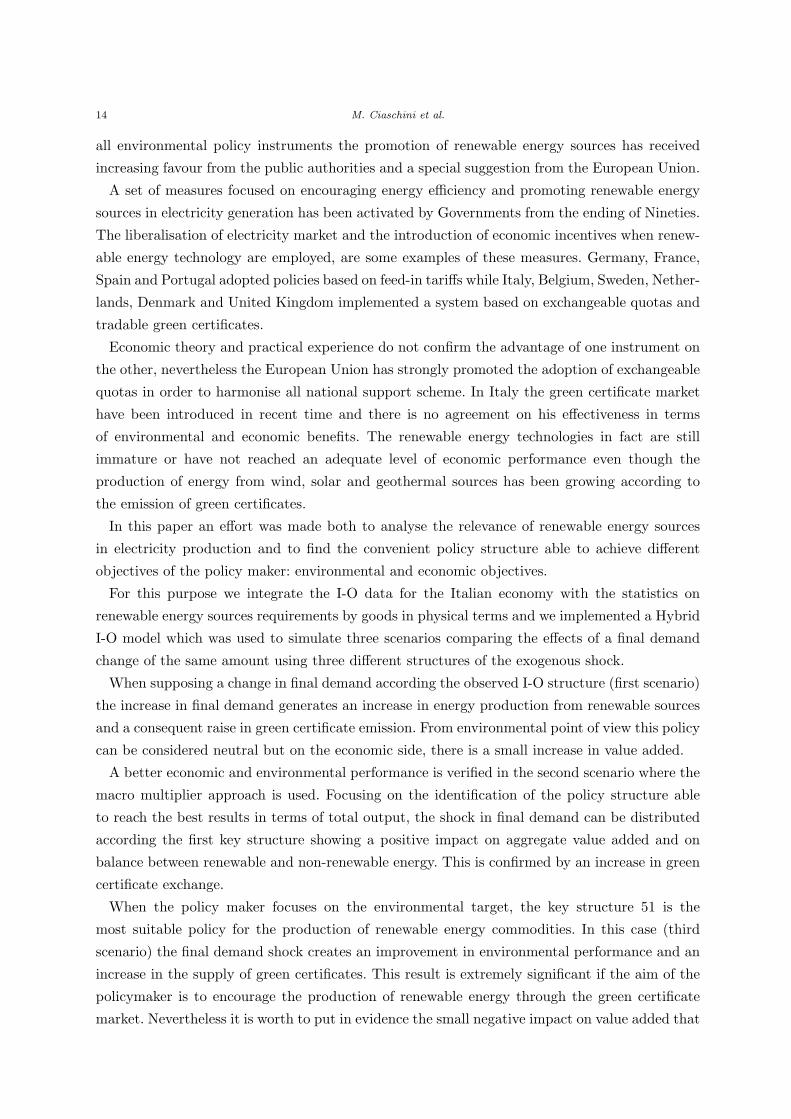
14 M. Ciaschini et al.
all environmental policy instruments the promotion of renewable energy sources has received
increasing favour from the public authorities and a special suggestion from the European Union.
A set of measures focused on encouraging energy efficiency and promoting renewable energy
sources in electricity generation has been activated by Governments from the ending of Nineties.
The liberalisation of electricity market and the introduction of economic incentives when renew-
able energy technology are employed, are some examples of these measures. Germany, France,
Spain and Portugal adopted policies based on feed-in tariffs while Italy, Belgium, Sweden, Nether-
lands, Denmark and United Kingdom implemented a system based on exchangeable quotas and
tradable green certificates.
Economic theory and practical experience do not confirm the advantage of one instrument on
the other, nevertheless the European Union has strongly promoted the adoption of exchangeable
quotas in order to harmonise all national support scheme. In Italy the green certificate market
have been introduced in recent time and there is no agreement on his effectiveness in terms
of environmental and economic benefits. The renewable energy technologies in fact are still
immature or have not reached an adequate level of economic performance even though the
production of energy from wind, solar and geothermal sources has been growing according to
the emission of green certificates.
In this paper an effort was made both to analyse the relevance of renewable energy sources
in electricity production and to find the convenient policy structure able to achieve different
objectives of the policy maker: environmental and economic objectives.
For this purpose we integrate the I-O data for the Italian economy with the statistics on
renewable energy sources requirements by goods in physical terms and we implemented a Hybrid
I-O model which was used to simulate three scenarios comparing the effects of a final demand
change of the same amount using three different structures of the exogenous shock.
When supposing a change in final demand according the observed I-O structure (first scenario)
the increase in final demand generates an increase in energy production from renewable sources
and a consequent raise in green certificate emission. From environmental point of view this policy
can be considered neutral but on the economic side, there is a small increase in value added.
A better economic and environmental performance is verified in the second scenario where the
macro multiplier approach is used. Focusing on the identification of the policy structure able
to reach the best results in terms of total output, the shock in final demand can be distributed
according the first key structure showing a positive impact on aggregate value added and on
balance between renewable and non-renewable energy. This is confirmed by an increase in green
certificate exchange.
When the policy maker focuses on the environmental target, the key structure 51 is the
most suitable policy for the production of renewable energy commodities. In this case (third
scenario) the final demand shock creates an improvement in environmental performance and an
increase in the supply of green certificates. This result is extremely significant if the aim of the
policymaker is to encourage the production of renewable energy through the green certificate
market. Nevertheless it is worth to put in evidence the small negative impact on value added that

The economic impact of the GC market through the MM approach 15
is of short size compared with the increase in the balance between renewable and non-renewable
energy.

16 M. Ciaschini et al.
Appendix A: Tables and figures
Table A1. Commodity classification1 Products of agriculture, hunting and related services2 Products of forestry, logging and related services3 Fish and other fishing products; services incidental of fishing4 Coal and lignite; peat5 Crude petroleum and natural gas; services incidental to oil and gas extraction excluding surveying6 Uranium and thorium ores7 Metal ores8 Other mining and quarrying products9 Food products and beverages
10 Tobacco products11 Textiles12 Wearing apparel; furs13 Leather and leather products14 Wood and products of wood and cork (except furniture); articles of straw and plaiting materials15 Pulp, paper and paper products16 Printed matter and recorded media17 Coke, refined petroleum products and nuclear fuels18 Chemicals, chemical products and man-made fibres19 Rubber and plastic products20 Other non-metallic mineral products21 Basic metals22 Fabricated metal products, except machinery and equipment23 Machinery and equipment n.e.c.24 Office machinery and computers25 Electrical machinery and apparatus n.e.c.26 Radio, television and communication equipment and apparatus27 Medical, precision and optical instruments, watches and clocks28 Motor vehicles, trailers and semi-trailers29 Other transport equipment30 Furniture; other manufactured goods n.e.c.31 Secondary raw materials32 Electrical energy, gas, steam and hot water33 Collected and purified water, distribution services of water34 Construction work35 Trade, maintenance and repair services of motor vehicles and motorcycles; retail sale of automotive fuel36 Wholesale trade and commission trade services, except of motor vehicles and motorcycles37 Retail trade services, except of motor vehicles and motorcycles; repair services of personal and household goods38 Hotel and restaurant services39 Land transport; transport via pipeline services40 Water transport services41 Air transport services42 Supporting and auxiliary transport services; travel agency services43 Post and telecommunication services44 Financial intermediation services, except insurance and pension funding services45 Insurance and pension funding services, except compulsory social security services46 Services auxiliary to financial intermediation47 Real estate services48 Renting services of machinery and equipment without operator and of personal and household goods49 Computer and related services50 Research and development services51 Other business services52 Public administration and defence services; compulsory social security services53 Education services54 Health and social work services55 Sewage and refuse disposal services, sanitation and similar services56 Membership organisation services n.e.c.57 Recreational, cultural and sporting services58 Other services59 Private households with employed persons60 Renewable energy
The economic impact of the GC market through the MM approach 17
Figure A1. Key structures for policy objective
-0.2
0.0
0.2
0.4
0.6
0.8
1.0
5 10 15 20 25 30 35 40 45 50 55 60
1
-0.4
-0.2
0.0
0.2
0.4
0.6
0.8
1.0
1.2
5 10 15 20 25 30 35 40 45 50 55 60
2
-.8
-.6
-.4
-.2
.0
.2
.4
.6
5 10 15 20 25 30 35 40 45 50 55 60
3
-1.2
-1.0
-0.8
-0.6
-0.4
-0.2
0.0
0.2
0.4
5 10 15 20 25 30 35 40 45 50 55 60
4
-0.8
-0.4
0.0
0.4
0.8
1.2
5 10 15 20 25 30 35 40 45 50 55 60
5
-.6
-.4
-.2
.0
.2
.4
.6
5 10 15 20 25 30 35 40 45 50 55 60
6
-1.0
-0.8
-0.6
-0.4
-0.2
0.0
0.2
0.4
0.6
5 10 15 20 25 30 35 40 45 50 55 60
7
-1.2
-0.8
-0.4
0.0
0.4
5 10 15 20 25 30 35 40 45 50 55 60
8
-0.4
0.0
0.4
0.8
1.2
5 10 15 20 25 30 35 40 45 50 55 60
9
-.6
-.4
-.2
.0
.2
.4
.6
.8
5 10 15 20 25 30 35 40 45 50 55 60
10
-.8
-.6
-.4
-.2
.0
.2
.4
.6
5 10 15 20 25 30 35 40 45 50 55 60
11
-1.0
-0.8
-0.6
-0.4
-0.2
0.0
0.2
0.4
0.6
5 10 15 20 25 30 35 40 45 50 55 60
12
-.8
-.4
.0
.4
.8
5 10 15 20 25 30 35 40 45 50 55 60
13
-.4
-.3
-.2
-.1
.0
.1
.2
.3
.4
.5
5 10 15 20 25 30 35 40 45 50 55 60
14
-.6
-.4
-.2
.0
.2
.4
5 10 15 20 25 30 35 40 45 50 55 60
15
-1.0
-0.8
-0.6
-0.4
-0.2
0.0
0.2
0.4
5 10 15 20 25 30 35 40 45 50 55 60
16
-.5
-.4
-.3
-.2
-.1
.0
.1
.2
.3
5 10 15 20 25 30 35 40 45 50 55 60
17
-.6
-.4
-.2
.0
.2
.4
.6
5 10 15 20 25 30 35 40 45 50 55 60
18
-.4
-.2
.0
.2
.4
.6
.8
5 10 15 20 25 30 35 40 45 50 55 60
19
-.6
-.4
-.2
.0
.2
.4
5 10 15 20 25 30 35 40 45 50 55 60
20
-.6
-.4
-.2
.0
.2
.4
.6
5 10 15 20 25 30 35 40 45 50 55 60
21
-.4
-.3
-.2
-.1
.0
.1
.2
.3
.4
.5
5 10 15 20 25 30 35 40 45 50 55 60
22
-.6
-.4
-.2
.0
.2
.4
5 10 15 20 25 30 35 40 45 50 55 60
23
-.5
-.4
-.3
-.2
-.1
.0
.1
.2
.3
.4
5 10 15 20 25 30 35 40 45 50 55 60
24
-.6
-.4
-.2
.0
.2
.4
.6
5 10 15 20 25 30 35 40 45 50 55 60
25
-.6
-.4
-.2
.0
.2
.4
.6
.8
5 10 15 20 25 30 35 40 45 50 55 60
26
-0.6
-0.4
-0.2
0.0
0.2
0.4
0.6
0.8
1.0
5 10 15 20 25 30 35 40 45 50 55 60
27
-.8
-.6
-.4
-.2
.0
.2
.4
5 10 15 20 25 30 35 40 45 50 55 60
28
-.5
-.4
-.3
-.2
-.1
.0
.1
.2
.3
.4
5 10 15 20 25 30 35 40 45 50 55 60
29
-1.0
-0.8
-0.6
-0.4
-0.2
0.0
0.2
0.4
5 10 15 20 25 30 35 40 45 50 55 60
30
-.4
-.3
-.2
-.1
.0
.1
.2
.3
.4
.5
5 10 15 20 25 30 35 40 45 50 55 60
31
-.4
-.3
-.2
-.1
.0
.1
.2
.3
.4
5 10 15 20 25 30 35 40 45 50 55 60
32
-.6
-.4
-.2
.0
.2
.4
.6
5 10 15 20 25 30 35 40 45 50 55 60
33
-.4
-.3
-.2
-.1
.0
.1
.2
.3
.4
.5
5 10 15 20 25 30 35 40 45 50 55 60
34
-.6
-.4
-.2
.0
.2
.4
.6
5 10 15 20 25 30 35 40 45 50 55 60
35
-.4
-.2
.0
.2
.4
.6
5 10 15 20 25 30 35 40 45 50 55 60
36
-.5
-.4
-.3
-.2
-.1
.0
.1
.2
.3
.4
5 10 15 20 25 30 35 40 45 50 55 60
37
-.4
-.2
.0
.2
.4
.6
.8
5 10 15 20 25 30 35 40 45 50 55 60
38
-.3
-.2
-.1
.0
.1
.2
.3
.4
.5
5 10 15 20 25 30 35 40 45 50 55 60
39
-.6
-.4
-.2
.0
.2
.4
5 10 15 20 25 30 35 40 45 50 55 60
40
-.6
-.4
-.2
.0
.2
.4
.6
.8
5 10 15 20 25 30 35 40 45 50 55 60
41
-.4
-.2
.0
.2
.4
.6
5 10 15 20 25 30 35 40 45 50 55 60
42
-.6
-.4
-.2
.0
.2
.4
.6
.8
5 10 15 20 25 30 35 40 45 50 55 60
43
-0.2
0.0
0.2
0.4
0.6
0.8
1.0
1.2
5 10 15 20 25 30 35 40 45 50 55 60
44
-0.2
0.0
0.2
0.4
0.6
0.8
1.0
1.2
5 10 15 20 25 30 35 40 45 50 55 60
45
-0.2
0.0
0.2
0.4
0.6
0.8
1.0
5 10 15 20 25 30 35 40 45 50 55 60
46
-.4
-.3
-.2
-.1
.0
.1
.2
.3
.4
.5
5 10 15 20 25 30 35 40 45 50 55 60
47
-.3
-.2
-.1
.0
.1
.2
.3
.4
.5
.6
5 10 15 20 25 30 35 40 45 50 55 60
48
-.5
-.4
-.3
-.2
-.1
.0
.1
.2
.3
.4
5 10 15 20 25 30 35 40 45 50 55 60
49
-.6
-.4
-.2
.0
.2
.4
.6
5 10 15 20 25 30 35 40 45 50 55 60
50
-.6
-.4
-.2
.0
.2
.4
.6
5 10 15 20 25 30 35 40 45 50 55 60
51
-.4
-.2
.0
.2
.4
.6
.8
5 10 15 20 25 30 35 40 45 50 55 60
52
-.5
-.4
-.3
-.2
-.1
.0
.1
.2
.3
.4
5 10 15 20 25 30 35 40 45 50 55 60
53
-.4
-.2
.0
.2
.4
.6
.8
5 10 15 20 25 30 35 40 45 50 55 60
54
-.8
-.6
-.4
-.2
.0
.2
.4
.6
5 10 15 20 25 30 35 40 45 50 55 60
55
-.4
-.3
-.2
-.1
.0
.1
.2
.3
.4
.5
5 10 15 20 25 30 35 40 45 50 55 60
56
-.6
-.4
-.2
.0
.2
.4
5 10 15 20 25 30 35 40 45 50 55 60
57
-.6
-.4
-.2
.0
.2
.4
.6
5 10 15 20 25 30 35 40 45 50 55 60
58
-.8
-.6
-.4
-.2
.0
.2
.4
.6
5 10 15 20 25 30 35 40 45 50 55 60
59
-.6
-.4
-.2
.0
.2
.4
.6
5 10 15 20 25 30 35 40 45 50 55 60
60
18 M. Ciaschini et al.
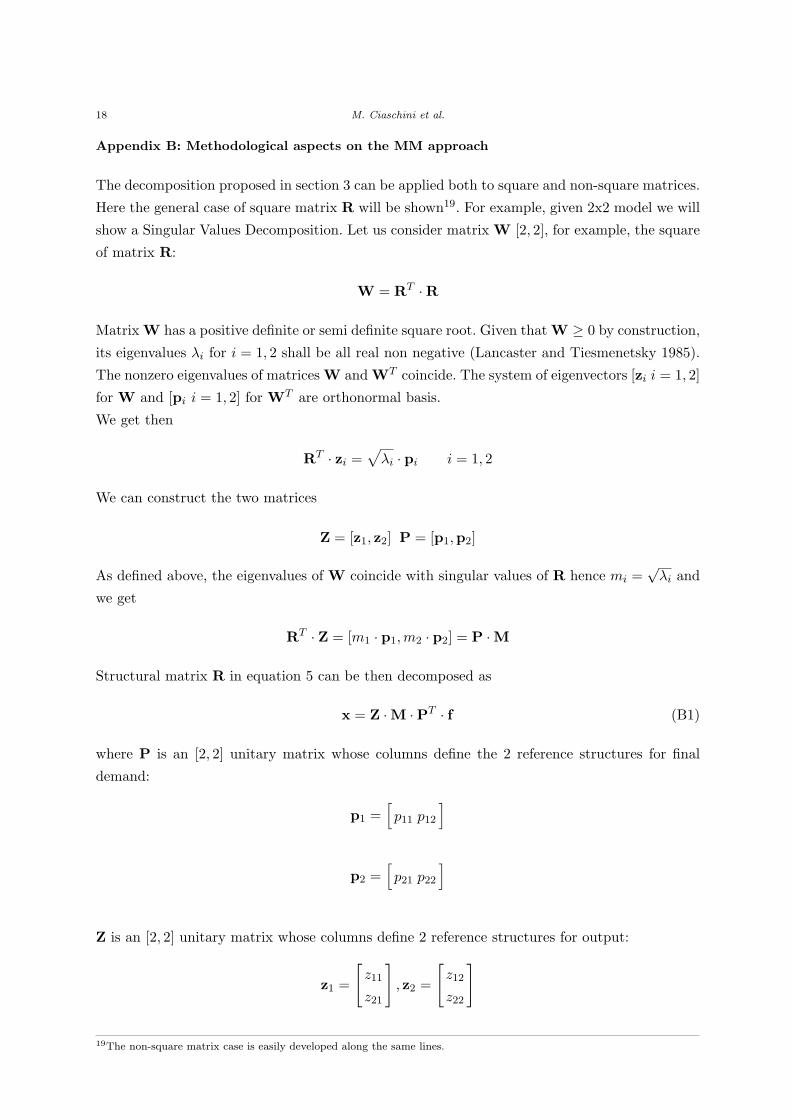
Appendix B: Methodological aspects on the MM approach
The decomposition proposed in section 3 can be applied both to square and non-square matrices.
Here the general case of square matrix R will be shown19. For example, given 2x2 model we will
show a Singular Values Decomposition. Let us consider matrix W [2, 2], for example, the square
of matrix R:
W = RT ·R
Matrix W has a positive definite or semi definite square root. Given that W ≥ 0 by construction,
its eigenvalues λi for i = 1, 2 shall be all real non negative (Lancaster and Tiesmenetsky 1985).
The nonzero eigenvalues of matrices W and WT coincide. The system of eigenvectors [zi i = 1, 2]
for W and [pi i = 1, 2] for WT are orthonormal basis.
We get then
RT · zi =√λi · pi i = 1, 2
We can construct the two matrices
Z = [z1, z2] P = [p1,p2]
As defined above, the eigenvalues of W coincide with singular values of R hence mi =√λi and
we get
RT · Z = [m1 · p1,m2 · p2] = P ·M
Structural matrix R in equation 5 can be then decomposed as
x = Z ·M ·PT · f (B1)
where P is an [2, 2] unitary matrix whose columns define the 2 reference structures for final
demand:
p1 =[p11 p12
]
p2 =[p21 p22
]
Z is an [2, 2] unitary matrix whose columns define 2 reference structures for output:
z1 =
[z11
z21
], z2 =
[z12
z22
]
19The non-square matrix case is easily developed along the same lines.

The economic impact of the GC market through the MM approach 19
and M is an [2, 2] diagonal matrix of the type:
M =
[m1 0
0 m2
]
Scalars mi are all real and positive and can be ordered as m1 > m2. Now we have all the
elements to show how this decomposition correctly represents the MM that quantify the aggre-
gate scale effects and the associated structures of the impact of a shock in final demand on total
output. In fact, if we express the actual vector f in terms of the structures identified by matrix
P, we obtain a new final demand vector, f0, expressed in terms of the structures suggested by
the R:
f0 = P · f (B2)
On the other hand we can also express total output according the output structures implied by
matrix R:
x0 = ZT · x (B3)
Equation B1 then becomes through equations B2 and B3:
x0 = M · f0 (B4)
which implies:
x0i = mi · f0
i (B5)
where i = 1, 2.
We note that matrix R hides 2 fundamental combination of the outputs (figure B1). Each of
them is obtained multiplying the corresponding combination of final demand by a predetermined
scalar which has in fact the role of aggregated Macro Multiplier. The complex effect on the
output vector of final demand shocks can be reduced to a multiplication by a constant mi. The
structures we have identified play a fundamental role in determining the potential behavior of
the economic system, i.e. the behavior of the system under all possible shocks. We can in fact
evaluate which will be the effect on output of all final demand possible structures. As we can
see in figure B1, when final demand vector crosses a structure in P, the vector of total output
crosses the corresponding structure in Z. Singular values mi, then, determine the aggregated
effect of a final demand shock on output. For this reason we will call them Macro Multipliers
(Ciaschini and Socci 2007). These MM are aggregated, in the sense that each of them applies on
all components of each macroeconomic variables taken into consideration, and are consistent with
the multi-industry specification of the model. Given the problems connected with aggregation
in multisectoral models, this feature of singular values mi is not of minor relevance. They are
20 M. Ciaschini et al.
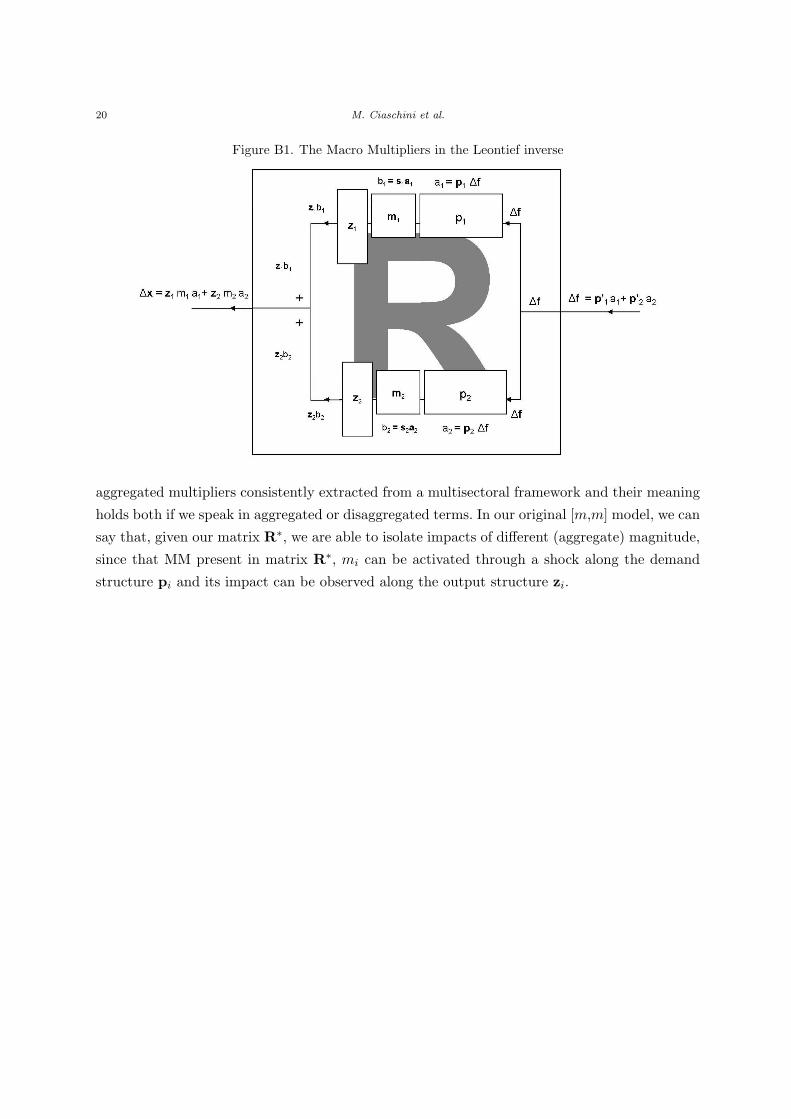
Figure B1. The Macro Multipliers in the Leontief inverse
aggregated multipliers consistently extracted from a multisectoral framework and their meaning
holds both if we speak in aggregated or disaggregated terms. In our original [m,m] model, we can
say that, given our matrix R∗, we are able to isolate impacts of different (aggregate) magnitude,
since that MM present in matrix R∗, mi can be activated through a shock along the demand
structure pi and its impact can be observed along the output structure zi.

REFERENCES 21
References
Baumol, W., and Oates, W., The Theory of Environmental Policy (1988).
Ciaschini, M., and Socci, C. (2006), “Income distribution and output change: Macro Multiplier
approach,” in Economic Growth and Distribution: On the Nature and Cause of the Wealth
of Nations ed. N. Salvadori, Edward Elgar, chap. 10, pp. 247–270.
Ciaschini, M., and Socci, C. (2007), “Final demand impact on output: a Macro Multiplier ap-
proach.,” Journal of Policy Modeling, 29(1), 115–132.
Ciaschini, M. (1989), “Scale and structure in economic modelling,” Economic Modelling, 6, 355–
373.
Ciaschini, M., Pretaroli, R., and Socci, C. (2009), “A conveniet multi sectoral policy control for
the ICT in the USA economy,” Metroeconomica, 60(4), 660–685.
Ciaschini, M., Pretaroli, R., and Socci, C. (2010), “Multisectoral structures and policy design,”
International Journal of Control, 83, 281–296.
Dietzenbacher, E., and Stage, J. (2006), “Mixing Oil and Water? Using Hybrid Input-Output
Tables in a Structural Decomposition Analysis,” Economic Systems Research, 18(1), 85–95.
EC, (2004), “The share of renweable energy in the EU Country profiles. Overview of RES
in the enlarged European Union,” Commission staff working document SEC (2004), 547,
26.5.2004.
EUROSTAT, (2008), “Energy - Yearly statistics 2006,” .
EUROSTAT, (2009), “Panorama of Energy - Energy statistics to support EU policies and solu-
tions,” .
Goulder, L., Parry, I., Williams III, R., and Burtraw, D. (1999), “The Cost-Effectiveness of
Alternative Instruments for Environmental Protection in a Second Best Setting,” Journal
of Public Economics, 72, 523–554.
Haug, M. (2007), “Renewable Energy in Future Energy Supply: A Renaissance in Waiting,”
Quarterly Journal of International Agriculture, 46(4), 304–324.
ISTAT,, I bilanci energetici, Roma: ISTAT (2007).
Jensen, S., and Skytte, K. (2002), “Interactions between the power and green certificate mar-
kets,” Energy Policy, 30, 425–435.
Lahr, M.L. (1993), “A Review of the Literature Supporting the Hybrid Approach to Constructing
REgional Input-Output Models,” Economc Systems Research, 5(3), 277–293.
Lancaster, P., and Tiesmenetsky, M. (1985)The Theory of Matricies, second ed., New York:
Academic Press.
Miller, R.E., and Blair, P.D., Input-Output Analysis: Foundations and Extensions, Prentice-Hall,
Inc., Englewood Cliffs, New Jersey (2009).
Parry, I. (2002), “Are Tradable Emissions Permits a Good Idea?,” Resources for the future, 02,
Washington, D.C.
Polenske, K.R. (1976), “Multiregional interactions between energy and transportation,” in Ad-
vances in Input-Output Analysis eds. K.R. Polenske and J.V. Skolka, Cambridge, Mass:
Ballinger.

22 REFERENCES
Round, J. (2003), “Social Accounting Matrices and SAM-based Multiplier Analysis,” in Tech-
niques for Evaluating the Poverty Impact of Economic Policies eds. L.A.P. da Silva and
F. Bourguinon, World Bank and Oxford University Press, chap. 14.
Schaeffer, G., Boots, M., Mitchell, C., Anedersono, T., Timpe, C., and Cames, M. (2000), “Op-
tion for design of tradable green certificate systems,” Report ECN-C-00-032, Petten.
Skolka, J., “Input Output Multipliers and Linkages.” paper presented at the 8th International
Conference on Input-Output Techniques - Sapporo (1986).
Stoutenborough, J.W., and Beverlin, M. (2008), “Encouraging Pollution-Free Energy: The Dif-
fusion of State Net Metering Policies,” Social Science Quarterly, 89, 1230–1251.
Van Dijk, M.e.a. (2003), “Renewable Energy Policies and Market Developments,” Report ECN-
C-99-072, Petten.

NOTE DI LAVORO DELLA FONDAZIONE ENI ENRICO MATTEI
Fondazione Eni Enrico Mattei Working Paper Series
Our Note di Lavoro are available on the Internet at the following addresses: http://www.feem.it/getpage.aspx?id=73&sez=Publications&padre=20&tab=1
http://papers.ssrn.com/sol3/JELJOUR_Results.cfm?form_name=journalbrowse&journal_id=266659 http://ideas.repec.org/s/fem/femwpa.html
http://www.econis.eu/LNG=EN/FAM?PPN=505954494 http://ageconsearch.umn.edu/handle/35978
http://www.bepress.com/feem/
NOTE DI LAVORO PUBLISHED IN 2010 GC 1.2010 Cristina Cattaneo: Migrants’ International Transfers and Educational Expenditure: Empirical Evidence
from Albania SD 2.2010 Fabio Antoniou, Panos Hatzipanayotou and Phoebe Koundouri: Tradable Permits vs Ecological Dumping SD 3.2010 Fabio Antoniou, Panos Hatzipanayotou and Phoebe Koundouri: Second Best Environmental Policies
under Uncertainty SD 4.2010 Carlo Carraro, Enrica De Cian and Lea Nicita: Modeling Biased Technical Change. Implications for
Climate Policy IM 5.2010 Luca Di Corato: Profit Sharing under the threat of Nationalization SD 6.2010 Masako Ikefuji, Jun-ichi Itaya and Makoto Okamura: Optimal Emission Tax with Endogenous Location
Choice of Duopolistic Firms SD 7.2010 Michela Catenacci and Carlo Giupponi: Potentials and Limits of Bayesian Networks to Deal with
Uncertainty in the Assessment of Climate Change Adaptation Policies GC 8.2010 Paul Sarfo-Mensah and William Oduro: Changes in Beliefs and Perceptions about the Natural
Environment in the Forest-Savanna Transitional Zone of Ghana: The Influence of Religion IM 9.2010 Andrea Boitani, Marcella Nicolini and Carlo Scarpa: Do Competition and Ownership Matter? Evidence
from Local Public Transport in Europe SD 10.2010 Helen Ding and Paulo A.L.D. Nunes and Sonja Teelucksingh: European Forests and Carbon Sequestration
Services : An Economic Assessment of Climate Change Impacts GC 11.2010 Enrico Bertacchini, Walter Santagata and Giovanni Signorello: Loving Cultural Heritage Private Individual
Giving and Prosocial Behavior SD 12.2010 Antoine Dechezleprêtre, Matthieu Glachant and Yann Ménière: What Drives the International Transfer of
Climate Change Mitigation Technologies? Empirical Evidence from Patent Data SD 13.2010 Andrea Bastianin, Alice Favero and Emanuele Massetti: Investments and Financial Flows Induced by
Climate Mitigation Policies SD 14.2010 Reyer Gerlagh: Too Much Oil IM 15.2010 Chiara Fumagalli and Massimo Motta: A Simple Theory of Predation GC 16.2010 Rinaldo Brau, Adriana Di Liberto and Francesco Pigliaru: Tourism and Development: A Recent
Phenomenon Built on Old (Institutional) Roots? SD 17.2010 Lucia Vergano, Georg Umgiesser and Paulo A.L.D. Nunes: An Economic Assessment of the Impacts of the
MOSE Barriers on Venice Port Activities SD 18.2010 ZhongXiang Zhang: Climate Change Meets Trade in Promoting Green Growth: Potential Conflicts and
Synergies SD 19.2010 Elisa Lanzi and Ian Sue Wing: Capital Malleability and the Macroeconomic Costs of Climate Policy IM 20.2010 Alberto Petrucci: Second-Best Optimal Taxation of Oil and Capital in a Small Open Economy SD 21.2010 Enrica De Cian and Alice Favero: Fairness, Credibility and Effectiveness in the Copenhagen Accord: An
Economic Assessment SD 22.2010 Francesco Bosello: Adaptation, Mitigation and “Green” R&D to Combat Global Climate Change. Insights
From an Empirical Integrated Assessment Exercise IM 23.2010 Jean Tirole and Roland Bénabou: Individual and Corporate Social Responsibility IM 24.2010 Cesare Dosi and Michele Moretto: Licences, "Use or Lose" Provisions and the Time of Investment GC 25.2010 Andrés Rodríguez-Pose and Vassilis Tselios (lxxxvi): Returns to Migration, Education, and Externalities in
the European Union GC 26.2010 Klaus Desmet and Esteban Rossi-Hansberg (lxxxvi): Spatial Development SD 27.2010 Massimiliano Mazzanti, Anna Montini and Francesco Nicolli: Waste Generation and Landfill Diversion
Dynamics: Decentralised Management and Spatial Effects SD 28.2010 Lucia Ceccato, Valentina Giannini and Carlo Gipponi: A Participatory Approach to Assess the
Effectiveness of Responses to Cope with Flood Risk SD 29.2010 Valentina Bosetti and David G. Victor: Politics and Economics of Second-Best Regulation of Greenhouse
Gases: The Importance of Regulatory Credibility IM 30.2010 Francesca Cornelli, Zbigniew Kominek and Alexander Ljungqvist: Monitoring Managers: Does it Matter? GC 31.2010 Francesco D’Amuri and Juri Marcucci: “Google it!” Forecasting the US Unemployment Rate with a Google
Job Search index SD 32.2010 Francesco Bosello, Carlo Carraro and Enrica De Cian: Climate Policy and the Optimal Balance between
Mitigation, Adaptation and Unavoided Damage
SD 33.2010 Enrica De Cian and Massimo Tavoni: The Role of International Carbon Offsets in a Second-best Climate Policy: A Numerical Evaluation
SD 34.2010 ZhongXiang Zhang: The U.S. Proposed Carbon Tariffs, WTO Scrutiny and China’s Responses IM 35.2010 Vincenzo Denicolò and Piercarlo Zanchettin: Leadership Cycles SD 36.2010 Stéphanie Monjon and Philippe Quirion: How to Design a Border Adjustment for the European Union
Emissions Trading System? SD 37.2010 Meriem Hamdi-Cherif, Céline Guivarch and Philippe Quirion: Sectoral Targets for Developing Countries:
Combining "Common but Differentiated Responsibilities" with "Meaningful participation" IM 38.2010 G. Andrew Karolyi and Rose C. Liao: What is Different about Government-Controlled Acquirers in Cross-
Border Acquisitions? GC 39.2010 Kjetil Bjorvatn and Alireza Naghavi: Rent Seekers in Rentier States: When Greed Brings Peace GC 40.2010 Andrea Mantovani and Alireza Naghavi: Parallel Imports and Innovation in an Emerging Economy SD 41.2010 Luke Brander, Andrea Ghermandi, Onno Kuik, Anil Markandya, Paulo A.L.D. Nunes, Marije Schaafsma
and Alfred Wagtendonk: Scaling up Ecosystem Services Values: Methodology, Applicability and a Case Study
SD 42.2010 Valentina Bosetti, Carlo Carraro, Romain Duval and Massimo Tavoni: What Should We Expect from Innovation? A Model-Based Assessment of the Environmental and Mitigation Cost Implications of Climate-Related R&D
SD 43.2010 Frank Vöhringer, Alain Haurie, Dabo Guan,Maryse Labriet, Richard Loulou, Valentina Bosetti, Pryadarshi R. Shukla and Philippe Thalmann: Reinforcing the EU Dialogue with Developing Countries on Climate Change Mitigation
GC 44.2010 Angelo Antoci, Pier Luigi Sacco and Mauro Sodini: Public Security vs. Private Self-Protection: Optimal Taxation and the Social Dynamics of Fear
IM 45.2010 Luca Enriques: European Takeover Law: The Case for a Neutral Approach SD 46.2010 Maureen L. Cropper, Yi Jiang, Anna Alberini and Patrick Baur: Getting Cars Off the Road: The Cost-
Effectiveness of an Episodic Pollution Control Program IM 47.2010 Thomas Hellman and Enrico Perotti: The Circulation of Ideas in Firms and Markets IM 48.2010 James Dow and Enrico Perotti: Resistance to Change SD 49.2010 Jaromir Kovarik, Friederike Mengel and José Gabriel Romero: (Anti-) Coordination in Networks SD 50.2010 Helen Ding, Silvia Silvestri, Aline Chiabai and Paulo A.L.D. Nunes: A Hybrid Approach to the Valuation of
Climate Change Effects on Ecosystem Services: Evidence from the European Forests GC 51.2010 Pauline Grosjean (lxxxvii): A History of Violence: Testing the ‘Culture of Honor’ in the US South GC 52.2010 Paolo Buonanno and Matteo M. Galizzi (lxxxvii): Advocatus, et non latro? Testing the Supplier-Induced-
Demand Hypothesis for Italian Courts of Justice GC 53.2010 Gilat Levy and Ronny Razin (lxxxvii): Religious Organizations GC 54.2010 Matteo Cervellati and Paolo Vanin (lxxxvii): ”Thou shalt not covet ...”: Prohibitions, Temptation and
Moral Values GC 55.2010 Sebastian Galiani, Martín A. Rossi and Ernesto Schargrodsky (lxxxvii): Conscription and Crime: Evidence
from the Argentine Draft Lottery GC 56.2010 Alberto Alesina, Yann Algan, Pierre Cahuc and Paola Giuliano (lxxxvii): Family Values and the Regulation
of Labor GC 57.2010 Raquel Fernández (lxxxvii): Women’s Rights and Development GC 58.2010 Tommaso Nannicini, Andrea Stella, Guido Tabellini, Ugo Troiano (lxxxvii): Social Capital and Political
Accountability GC 59.2010 Eleonora Patacchini and Yves Zenou (lxxxvii): Juvenile Delinquency and Conformism GC 60.2010 Gani Aldashev, Imane Chaara, Jean-Philippe Platteau and Zaki Wahhaj (lxxxvii): Using the Law to Change
the Custom GC 61.2010 Jeffrey Butler, Paola Giuliano and Luigi Guiso (lxxxvii): The Right Amount of Trust SD 62.2010 Valentina Bosetti, Carlo Carraio and Massimo Tavoni: Alternative Paths toward a Low Carbon World SD 63.2010 Kelly C. de Bruin, Rob B. Dellink and Richard S.J. Tol: International Cooperation on Climate Change
Adaptation from an Economic Perspective IM 64.2010 Andrea Bigano, Ramon Arigoni Ortiz, Anil Markandya, Emanuela Menichetti and Roberta Pierfederici:
The Linkages between Energy Efficiency and Security of Energy Supply in Europe SD 65.2010 Anil Markandya and Wan-Jung Chou: Eastern Europe and the former Soviet Union since the fall of the
Berlin Wall: Review of the Changes in the Environment and Natural Resources SD 66.2010 Anna Alberini and Milan Ščasný: Context and the VSL: Evidence from a Stated Preference Study in Italy
and the Czech Republic SD 67.2010 Francesco Bosello, Ramiro Parrado and Renato Rosa: The Economic and Environmental Effects of an EU
Ban on Illegal Logging Imports. Insights from a CGE Assessment IM 68.2010 Alessandro Fedele, Paolo M. Panteghini and Sergio Vergalli: Optimal Investment and Financial Strategies
under Tax Rate Uncertainty IM 69.2010 Carlo Cambini, Laura Rondi: Regulatory Independence and Political Interference: Evidence from EU
Mixed-Ownership Utilities’ Investment and Debt SD 70.2010 Xavier Pautrel: Environmental Policy, Education and Growth with Finite Lifetime: the Role of Abatement
Technology SD 71.2010 Antoine Leblois and Philippe Quirion: Agricultural Insurances Based on Meteorological Indices:
Realizations, Methods and Research Agenda IM 72.2010 Bin Dong and Benno Torgler: The Causes of Corruption: Evidence from China IM 73.2010 Bin Dong and Benno Torgler: The Consequences of Corruption: Evidence from China

IM 74.2010 Fereydoun Verdinejad and Yasaman Gorji: The Oil-Based Economies International Research Project. The Case of Iran.
GC 75.2010 Stelios Michalopoulos, Alireza Naghavi and Giovanni Prarolo (lxxxvii): Trade and Geography in the Economic Origins of Islam: Theory and Evidence
SD 76.2010 ZhongXiang Zhang: China in the Transition to a Low-Carbon Economy SD 77.2010 Valentina Iafolla, Massimiliano Mazzanti and Francesco Nicolli: Are You SURE You Want to Waste Policy
Chances? Waste Generation, Landfill Diversion and Environmental Policy Effectiveness in the EU15 IM 78.2010 Jean Tirole: Illiquidity and all its Friends SD 79.2010 Michael Finus and Pedro Pintassilgo: International Environmental Agreements under Uncertainty: Does
the Veil of Uncertainty Help? SD 80.2010 Robert W. Hahn and Robert N. Stavins: The Effect of Allowance Allocations on Cap-and-Trade System
Performance SD 81.2010 Francisco Alpizar, Fredrik Carlsson and Maria Naranjo (lxxxviii): The Effect of Risk, Ambiguity and
Coordination on Farmers’ Adaptation to Climate Change: A Framed Field Experiment SD 82.2010 Shardul Agrawala and Maëlis Carraro (lxxxviii): Assessing the Role of Microfinance in Fostering
Adaptation to Climate Change SD 83.2010 Wolfgang Lutz (lxxxviii): Improving Education as Key to Enhancing Adaptive Capacity in Developing
Countries SD 84.2010 Rasmus Heltberg, Habiba Gitay and Radhika Prabhu (lxxxviii): Community-based Adaptation: Lessons
from the Development Marketplace 2009 on Adaptation to Climate Change SD 85.2010 Anna Alberini, Christoph M. Rheinberger, Andrea Leiter, Charles A. McCormick and Andrew Mizrahi:
What is the Value of Hazardous Weather Forecasts? Evidence from a Survey of Backcountry Skiers SD 86.2010 Anna Alberini, Milan Ščasný, Dennis Guignet and Stefania Tonin: The Benefits of Contaminated Site
Cleanup Revisited: The Case of Naples and Caserta, Italy GC 87.2010 Paul Sarfo-Mensah, William Oduro, Fredrick Antoh Fredua and Stephen Amisah: Traditional
Representations of the Natural Environment and Biodiversity Conservation: Sacred Groves in Ghana IM 88.2010 Gian Luca Clementi, Thomas Cooley and Sonia Di Giannatale: A Theory of Firm Decline IM 89.2010 Gian Luca Clementi and Thomas Cooley: Executive Compensation: Facts GC 90.2010 Fabio Sabatini: A Theory of Firm Decline SD 91.2010 ZhongXiang Zhang: Copenhagen and Beyond: Reflections on China’s Stance and Responses SD 92.2010 ZhongXiang Zhang: Assessing China’s Energy Conservation and Carbon Intensity: How Will the Future
Differ from the Past? SD 93.2010 Daron Acemoglu, Philippe Aghion, Leonardo Bursztyn and David Hemous: The Environment and Directed
Technical Change SD 94.2010 Valeria Costantini and Massimiliano Mazzanti: On the Green Side of Trade Competitiveness?
Environmental Policies and Innovation in the EU IM 95.2010 Vittoria Cerasi, Barbara Chizzolini and Marc Ivaldi: The Impact of Mergers on the Degree of Competition
in the Banking Industry SD 96.2010 Emanuele Massetti and Lea Nicita: The Optimal Climate Policy Portfolio when Knowledge Spills Across
Sectors SD
97.2010 Sheila M. Olmstead and Robert N. Stavins: Three Key Elements of Post-2012 International Climate Policy Architecture
SD 98.2010 Lawrence H. Goulder and Robert N. Stavins: Interactions between State and Federal Climate Change Policies
IM 99.2010 Philippe Aghion, John Van Reenen and Luigi Zingales: Innovation and Institutional Ownership GC 100.2010 Angelo Antoci, Fabio Sabatini and Mauro Sodini: The Solaria Syndrome: Social Capital in a Growing
Hyper-technological Economy SD 101.2010 Georgios Kossioris, Michael Plexousakis, Anastasios Xepapadeas and Aart de Zeeuw: On the Optimal
Taxation of Common-Pool Resources SD 102.2010 ZhongXiang Zhang: Liberalizing Climate-Friendly Goods and Technologies in the WTO: Product Coverage,
Modalities, Challenges and the Way Forward SD 103.2010 Gérard Mondello: Risky Activities and Strict Liability Rules: Delegating Safety GC 104.2010 João Ramos and Benno Torgler: Are Academics Messy? Testing the Broken Windows Theory with a Field
Experiment in the Work Environment IM 105.2010 Maurizio Ciaschini, Francesca Severini, Claudio Socci and Rosita Pretaroli: The Economic Impact of the
Green Certificate Market through the Macro Multiplier Approach (lxxxvi) This paper was presented at the Conference on "Urban and Regional Economics" organised by the Centre for Economic Policy Research (CEPR) and FEEM, held in Milan on 12-13 October 2009.
(lxxxvii) This paper was presented at the Conference on “Economics of Culture, Institutions and Crime” organised by SUS.DIV, FEEM, University of Padua and CEPR, held in Milan on 20-22 January 2010.
(lxxxviii) This paper was presented at the International Workshop on “The Social Dimension of Adaptation to Climate Change”, jointly organized by the International Center for Climate Governance, Centro Euro-Mediterraneo per i Cambiamenti Climatici and Fondazione Eni Enrico Mattei, held in Venice, 18-19 February 2010.