Embed Size (px)
Citation preview

Not Just a Fair Share, A Fair Shake and
A Fair Chance at SustainabilityLong Island Regional Planning Council
March 8, 2011
Presented by:Gary D. Bixhorn
SCSSA Legislative ChairpersonEastern Suffolk BOCES, Chief Operating Officer
Dr. Thomas L. RogersDistrict Superintendent/Executive Officer, Nassau BOCES
Interim District Superintendent, Eastern and Western Suffolk BOCES

Not Just a Fair Share, A Fair Shake
• Setting the record straight.
• The Executive Budget - Do we get a fair share?
• The Tax Cap - Do we get a fair shake?
• The sustainability of Long Island’s education system – Do we have a fair chance?

Setting the Record Straight:New York State Education National Ranking
Education Week: Quality Counts ReportNYS Earns a “B” (second only to Maryland)
Grade Rank
Chance for Success B 12 “…combines information from 13 indicators that span childhood through adulthood…”
K-12 Achievement C 7 “…how well a student’s performance compares with those in the top ranked state on separate criteria…”
Transitions & Alignment B+ 9 “…tracks state efforts to better coordinate the connections between K-12 schooling and other segments of the educational pipeline…”
School Finance B+ 2 “…school spending patterns and the distribution of resources within a state…”
Overall B 2

Setting the Record Straight:Long Island Outcomes - All this and 57 of 300 Intel Semifinalists
2008-09 Percentage of Elementary and Middle Level Students Scoring at Levels 3 and 4
0.0%
10.0%
20.0%
30.0%
40.0%
50.0%
60.0%
70.0%
80.0%
90.0%
100.0%
Grade 4 EnglishLanguage Arts
Grade 4 Mathematics Grade 4 Science Grade 5 SocialStudies
Grade 8 EnglishLanguage Arts
Grade 8 Mathematics Grade 8 Science Grade 8 SocialStudies
Long Island Rest of State (excluding LI, but including NYC) New York State (including LI and NYC)

Setting the Record Straight:Long Island Outcomes - All this and 57 of 300 Intel Semifinalists
2008-09 Percentage of Secondary Students Scoring 65+ on Regents Exams
0.0%
10.0%
20.0%
30.0%
40.0%
50.0%
60.0%
70.0%
80.0%
90.0%
100.0%
English Mathematics Course A Global History andGeography
U.S. History andGovernment
Living Environment
Long Island Rest of State New York State

Percentage of Students in Long Island’s Least Wealthy and Wealthiest School Districts Passing the Elementary/Middle Level Assessments and Regents Exams
Setting the Record Straight: Long Island School Performance & Resource Gap
Demographic Factors/Assessment/Regents2008-09
Least Wealthy LI Districts
(9 districts)% of all students tested
Wealthiest LI Districts
(9 districts)% of all students tested
Total Enrollment % Free/Reduced Lunch% Limited English Proficient (LEP)% Drop Out State Aid Share (State Aid as % of Total Revenue) Per Pupil Expenditure
56,329 53.5 18.8 2.8 56.1$21,915
23,306 11.4 5.0 0.9 6.2$28,593
Assessment Results – Elementary and Middle Level Students Scoring at Levels 3 and 4
Grade 4 ELAGrade 4 MathematicsGrade 4 ScienceGrade 5 Social StudiesGrade 8 ELAGrade 8 MathematicsGrade 8 ScienceGrade 8 Social Studies
76.486.291.290.658.974.267.960.2
91.494.496.396.687.793.284.788.7
Regents Exam Results – Students Scoring 65+
EnglishMathematics Course AGlobal History & GeographyUS History & GovernmentLiving Environment
78.550.770.081.376.8
92.593.588.294.095.2

Percentage of Students in Long Island’s Least Wealthy and Wealthiest School Districts Passing the Elementary/Middle Level Assessments and Regents Exams
Setting the Record Straight: Long Island School Performance & Resource Gap
0.0%
10.0%
20.0%
30.0%
40.0%
50.0%
60.0%
70.0%
80.0%
90.0%
100.0%
Gr. 4 ELA Gr. 4 Math Grade 4
Science
Gr. 5 Social
Studies
Gr. 8 ELA Gr. 8 Math Grade 8
Science
Gr. 8 Social
Studies
English Math Course A Global History
& Geography
U.S. History &
Government
Living
Environment
Least Wealthy Districts Wealthiest Districts

Setting the Record Straight: Community Support for Long Island Budgets
• 2010-11: 100.0% (124 of 124) passed - 114 on first vote
• 2009-10: 98.0% (122 of 124) passed - 122 on first vote
• 2008-09: 97.5% (121 of 124) passed - 116 on first vote
• 2007-08: 99.0% (123 of 124) passed - 117 on first vote
• 2006-07: 97.0% (120 of 124) passed - 105 on first vote
Source: N-SSBA

Setting the Record Straight: School Funding
• The foundation formula shortchanges Long Island - recognized as problem since the day it was introduced.
• Wealth measures tend to overstate Long Island’s wealth.
• CFE settlement has forced reduction of regional share - exploded state deficit.
• Regional cost differences are not truly recognized.
• Reduced reliance on expense-driven formulas hurts high cost regions.

1988-89 $ 3,999,542,900
2011-12 $10,676,098,600
Adjusted for inflation $ 5,598,920,537
Long Island School Expenditures:
Long Island School Expenditures:
After adjusting for inflation*, the average annual percentage increase is 1.67%.
*Average annual change over 24-year period adjusted for NY-Northern NJ-LI CPI. Formula for calculating inflation provided by the US Bureau of Labor Statistics.
Setting the Record Straight: School Funding/Expenditures

1988-89 $1,288,419,700
State Aid to Long Island Schools:
State Aid to Long Island Schools:
2011-12 $2,292,335,029
Adjusted for inflation $1,174,964,135
*Average annual change over 24-year period adjusted for NY-Northern NJ-LI CPI. Formula for calculating inflation provided by the US Bureau of Labor Statistics.
Setting the Record Straight: School Funding/Aid
After adjusting for inflation*, the average annual percentage decrease is 0.37%.

• State aid as a share of expenses has dropped from 32.2% in 1988-89 to a projected 21.0% in 2011-12.
• Property taxes have backfilled drop - hence current level of overdependence.
• Taxpayers on Long Island pay 65% more of their gross household income in property taxes than New Yorkers in general (7.8% vs. 4.74%).
Setting the Record Straight: School Funding
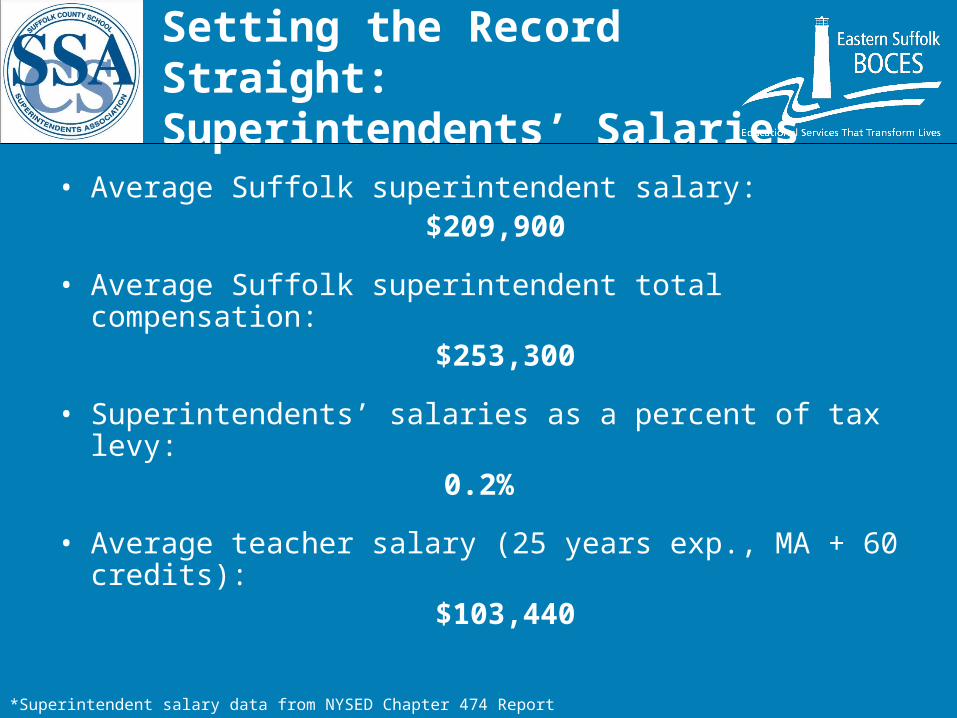
• Average Suffolk superintendent salary:$209,900
• Average Suffolk superintendent total compensation: $253,300
• Superintendents’ salaries as a percent of tax levy:0.2%
• Average teacher salary (25 years exp., MA + 60 credits): $103,440
Setting the Record Straight: Superintendents’ Salaries
*Superintendent salary data from NYSED Chapter 474 Report

• Average Nassau superintendent salary:$243,754
• Average Nassau superintendent total compensation: $300,348
• Superintendents’ salaries as a percent of tax levy:0.3%
• Average teacher salary (25 years exp., MA + 60 credits): $116,285
Setting the Record Straight: Superintendents’ Salaries
*Superintendent salary data from NYSED Chapter 474 Report

• Pension contributions are mandated.
• Mandates are generally well intentioned -introduced in response to need.
• Special education mandates tend to protect certain cost centers. Pressure focused on limited share of budget.
• Mandate relief will not happen by consensus.
Setting the Record Straight:
Cost Drivers & Mandates

• Communities resistant to consolidation need win-win.
• “Shared services” accepted business practice - can do more.
• BOCES Advocacy issues– Retain the BOCES Aid Formula– Public vs. Private Excess Cost Aid Formula– Workers Compensation Reserve Fund– Reimburse MTA Tax– Expand BOCES Role
Setting the Record Straight: Consolidation/Shared Services/BOCES

Regional Impact
• Long Island schools enroll approximately 17% of the students in the state but receive only 12% ($2.292 billion) of all school aid ($19.129 billion).
• Long Island schools absorbed a disproportionately large share (14.5% or $223 million) of the statewide school aid reduction ($1.537 billion).
• Long Island school aid was reduced by 8.9%, which is 22.6% greater than the 7.2% cut to the rest of the state.
• Long Island school aid per pupil is reduced to $4.246, which is 31.7% lower than the rest of the state ($6.216).
The Executive Budget:
Do We Get a Fair Share?

Formula Issues
• The school aid formulas remain broken. There are 29 low wealth (CWR<1.0) school districts on Long Island enrolling 35% of the students (158,927). The median aid cut among these districts is 8.8% ($3 million). Of the 29 districts, 12 will experience a double-digit aid decrease.
• Foundation Aid, which comprises 78% of all state aid (before GEA), is $3,329 per pupil on Long Island. This is 31.2% lower than the rest of the state ($4,835).
• The GEA cuts into Long Island school aid far more deeply (8.9%) than in New York City (6.5%) and the rest of the state (7.2%).
The Executive Budget:
Do We Get a Fair Share?

Tax Levy Impact
• The Island-wide loss in aid will drive a 3.0% increase in the tax levy.
• On a county-by-county basis, the loss of aid will drive a 3.9% tax levy increase in Suffolk, and a 2.2% tax levy in Nassau.
The Executive Budget:
Do We Get a Fair Share?

• “The Devil is in the Details” – analysis ongoing
• 2012-13 Loss of BOCES Aid
• BOCES Management Services non-aidable
• What about fund balance?
• What about cost shifts?
• 30-day amendments
The Executive Budget:
Do We Get a Fair Share?

The Tax Cap: Do We Get a Fair Shake?
Tax Levy Basics
• The school property tax levy represents the amount of funding a school district needs to raise through property taxes to balance its budget.
• The Property Tax Levy is calculated as follows:
Projected School Spending (- ) minus state aid (- ) minus other revenues (- ) minus prior year’s fund balance
= Property Tax Levy
• On Long Island, property taxes comprise nearly 70% of school funding.

The Tax Cap:
Do We Get a Fair Shake? • Overdependence on property taxes is real.
• Governor Cuomo’s top priority is the introduction of a Property Tax Cap. It was passed in the Senate on January 31, 2011 (S.2706).
• The Paterson proposed Property Tax Cap was the lesser of 4%, or 120% of the CPI increase.
• Caps the levy, not the tax rate.
• Overdependence on property taxes is real.
• Governor Cuomo’s top priority is the introduction of a Property Tax Cap. It was passed in the Senate on January 31, 2011 (S.2706).
• The Paterson proposed Property Tax Cap was the lesser of 4%, or 120% of the CPI increase.
• Caps the levy, not the tax rate.

The Proposed Cap (NYSSBA Analysis)
The Tax Cap:
Do We Get a Fair Shake?
• Community votes up or down on the tax levy - not budget.
• Commissioner of Education determines annual cap.
• Levy within cap requires approval by majority vote.
• Levy above cap requires approval by supermajority (60%).
• Failure of two consecutive levy proposals results in zero growth levy.
• No contingency budgets.

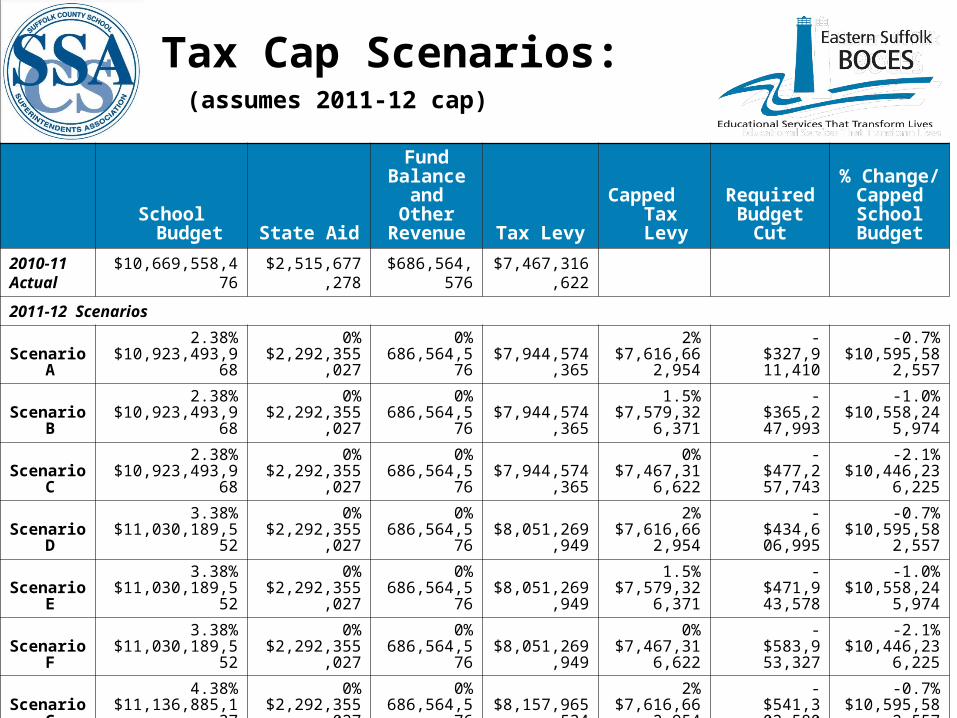
Tax Cap ~ 2011-12 “What If” ScenariosTax Cap ~ 2011-12 “What If” Scenarios
Scenarios
A B C D E F G H I
Spending +2.38% +2.38% +2.38% +3.38% +3.38% +3.38% +4.38% +4.38% +4.38%
State Aid Executive Budget
Fund Balance /Other Revenue
0.0% 0.0% 0.0% 0.0% 0.0% 0.0% 0.0% 0.0% 0.0%
Tax Cap 2.0% 1.5% 0.0% 2.0% 1.5% 0.0% 2.0% 1.5% 0.0%
School Budget State Aid
Fund Balance and
Other Revenue Tax Levy
Capped Tax Levy
Required Budget Cut
% Change/ Capped School Budget
2010-11 Actual $10,669,558,476 $2,515,677,278 $686,564,576 $7,467,316,622
2011-12 Scenarios
Scenario A2.38%
$10,923,493,9680%
$2,292,355,0270%
686,564,576 $7,944,574,3652%
$7,616,662,954 -$327,911,410-0.7%
$10,595,582,557
Scenario B2.38%
$10,923,493,9680%
$2,292,355,0270%
686,564,576 $7,944,574,3651.5%
$7,579,326,371 -$365,247,993-1.0%
$10,558,245,974
Scenario C2.38%
$10,923,493,9680%
$2,292,355,0270%
686,564,576 $7,944,574,3650%
$7,467,316,622 -$477,257,743-2.1%
$10,446,236,225
Scenario D3.38%
$11,030,189,5520%
$2,292,355,0270%
686,564,576 $8,051,269,9492%
$7,616,662,954 -$434,606,995-0.7%
$10,595,582,557
Scenario E3.38%
$11,030,189,5520%
$2,292,355,0270%
686,564,576 $8,051,269,9491.5%
$7,579,326,371 -$471,943,578-1.0%
$10,558,245,974
Scenario F3.38%
$11,030,189,5520%
$2,292,355,0270%
686,564,576 $8,051,269,9490%
$7,467,316,622 -$583,953,327-2.1%
$10,446,236,225
Scenario G4.38%
$11,136,885,1370%
$2,292,355,0270%
686,564,576 $8,157,965,5342%
$7,616,662,954 -$541,302,580-0.7%
$10,595,582,557
Scenario H4.38%
$11,136,885,1370%
$2,292,355,0270%
686,564,576 $8,157,965,5341.5%
$7,579,326,371 -$578,639,163-1.0%
$10,558,245,974
Scenario I4.38%
$11,136,885,1370%
$2,292,355,0270%
686,564,576 $8,157,965,5340%
$7,467,316,622 -$690,648,912-2.1%
$10,446,236,225
Tax Cap Scenarios: (assumes 2011-12 cap)

What would make it more fair?
SCSSA Tax Cap Design Principles
The Tax Cap:
Do We Get a Fair Shake?
• Any cap should be sensitive to “NYS Maintenance of Effort.”
• Any cap should be sensitive to “Local Control.”
• Any cap should be sensitive to “Cost Increases Beyond District Control.”
• Any cap should be sensitive to “Community Input.”
• Any cap should be “Introduced in Conjunction with Mandate Relief.”

How will this resolve itself?
• Where will the Assembly go?
• Will the Senate take another look?
• What will the Governor accept?
The Tax Cap:
Do We Get a Fair Shake?

A Fair Chance at
Sustainability
• The Facts / The Problem
• The Challenge / Critical Questions
• Sustainability Strategies

Population Changes
A Fair Chance at Sustainability:
The Facts

Changing Demographics
A Fair Chance at Sustainability:
The Facts

Property Value Growth vs. State Average
A Fair Chance at Sustainability:
The Facts

Income Value Growth vs. State Average
A Fair Chance at Sustainability:
The Facts

Adult Education Need
A Fair Chance at Sustainability:
The Facts

A Fair Chance at Sustainability:
The Facts

A Fair Chance at Sustainability
Sustainability Strategies- LIRPC Education Work Group
1. Fix low-performing schools2. Advocate for Mandate Relief3. Expanded use of technology for student
course offerings4. Restructure high school experience5. Incentivize consolidation6. Reign in pension costs

A Fair Chance at Sustainability
Sustainability Strategies- LIRPC Education Work Group(cont’d)
7. Reign in Health Insurance Costs8. Restructure the school funding system9. Explore regionalized employment structures10. Use schools as community centers11. Advocate for workforce housing12. Monitor progress

Questions?Gary D. Bixhorn
SCSSA Legislative ChairpersonEastern Suffolk BOCES, Chief Operating Officer
(631) 687-3001/ [email protected]
Dr. Thomas L. RogersDistrict Superintendent/Executive Officer, Nassau BOCES
Interim District Superintendent, Eastern and Western Suffolk BOCES(516) 396-2202/ [email protected]
Andrea M. GroomsEastern Suffolk BOCES
Director, Communications, Research & Recruitment(631) 687-3265/ [email protected]