Embed Size (px)
Citation preview

On the verge of re-entry Readjustment of labour and the optimal policy towards a post-
petroleum Norwegian economy
Synne Sogge Støhlmacher and Sara Skjeggestad Meyer
Supervisor: Øysten Thøgersen
Masterthesis, MSc in Economics and Business Administration
NORWEGIAN SCHOOL OF ECONOMICS
This thesis was written as a part of the Master of Science in Economics and Business Administration at NHH. Please note that neither the institution nor the examiners are responsible − through the approval of this thesis − for the theories and methods used, or results and conclusions drawn in this work
Norwegian School of Economics
Bergen, Fall 2015
1
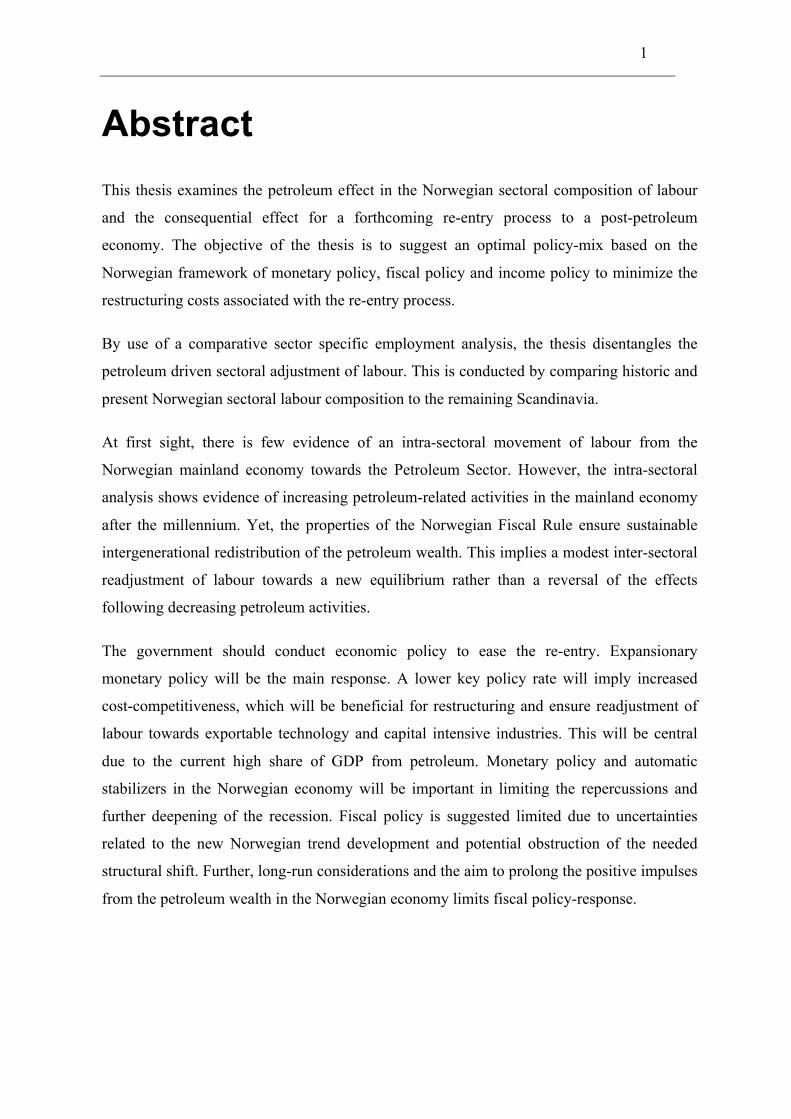
Abstract Abstract This thesis examines the petroleum effect in the Norwegian sectoral composition of labour
and the consequential effect for a forthcoming re-entry process to a post-petroleum
economy. The objective of the thesis is to suggest an optimal policy-mix based on the
Norwegian framework of monetary policy, fiscal policy and income policy to minimize the
restructuring costs associated with the re-entry process.
By use of a comparative sector specific employment analysis, the thesis disentangles the
petroleum driven sectoral adjustment of labour. This is conducted by comparing historic and
present Norwegian sectoral labour composition to the remaining Scandinavia.
At first sight, there is few evidence of an intra-sectoral movement of labour from the
Norwegian mainland economy towards the Petroleum Sector. However, the intra-sectoral
analysis shows evidence of increasing petroleum-related activities in the mainland economy
after the millennium. Yet, the properties of the Norwegian Fiscal Rule ensure sustainable
intergenerational redistribution of the petroleum wealth. This implies a modest inter-sectoral
readjustment of labour towards a new equilibrium rather than a reversal of the effects
following decreasing petroleum activities.
The government should conduct economic policy to ease the re-entry. Expansionary
monetary policy will be the main response. A lower key policy rate will imply increased
cost-competitiveness, which will be beneficial for restructuring and ensure readjustment of
labour towards exportable technology and capital intensive industries. This will be central
due to the current high share of GDP from petroleum. Monetary policy and automatic
stabilizers in the Norwegian economy will be important in limiting the repercussions and
further deepening of the recession. Fiscal policy is suggested limited due to uncertainties
related to the new Norwegian trend development and potential obstruction of the needed
structural shift. Further, long-run considerations and the aim to prolong the positive impulses
from the petroleum wealth in the Norwegian economy limits fiscal policy-response.
2
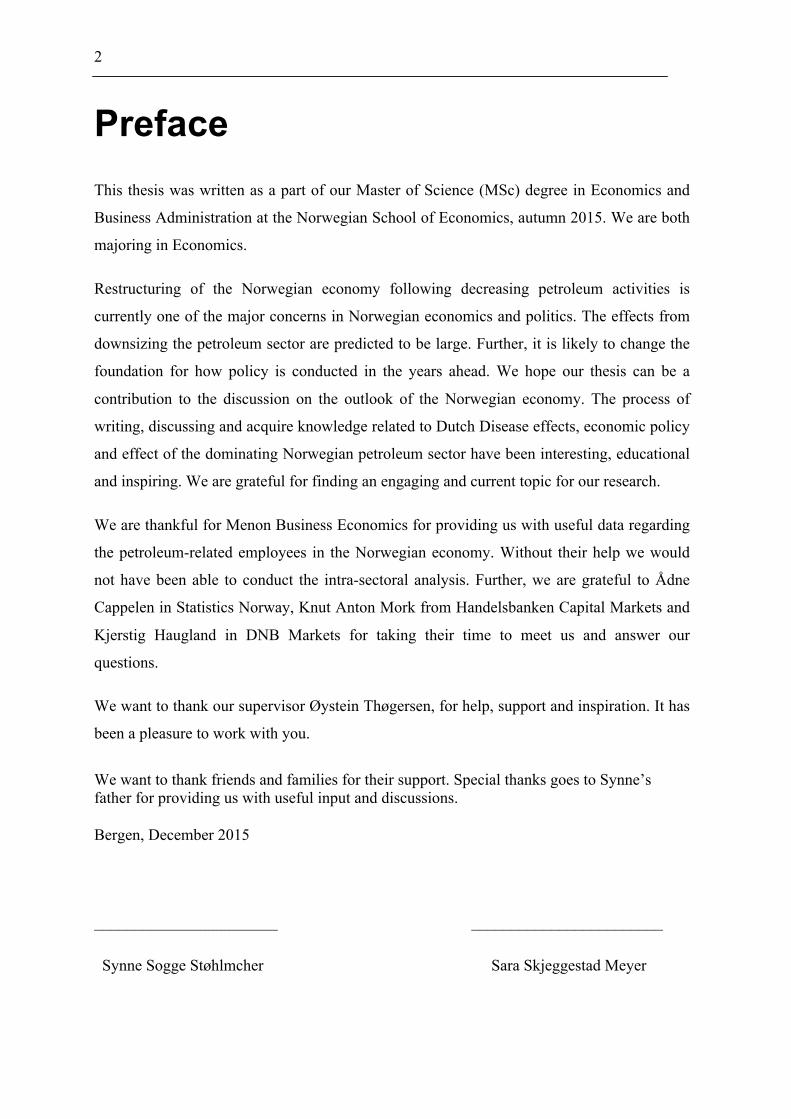
Preface Prefacee This thesis was written as a part of our Master of Science (MSc) degree in Economics and
Business Administration at the Norwegian School of Economics, autumn 2015. We are both
majoring in Economics.
Restructuring of the Norwegian economy following decreasing petroleum activities is
currently one of the major concerns in Norwegian economics and politics. The effects from
downsizing the petroleum sector are predicted to be large. Further, it is likely to change the
foundation for how policy is conducted in the years ahead. We hope our thesis can be a
contribution to the discussion on the outlook of the Norwegian economy. The process of
writing, discussing and acquire knowledge related to Dutch Disease effects, economic policy
and effect of the dominating Norwegian petroleum sector have been interesting, educational
and inspiring. We are grateful for finding an engaging and current topic for our research.
We are thankful for Menon Business Economics for providing us with useful data regarding
the petroleum-related employees in the Norwegian economy. Without their help we would
not have been able to conduct the intra-sectoral analysis. Further, we are grateful to Ådne
Cappelen in Statistics Norway, Knut Anton Mork from Handelsbanken Capital Markets and
Kjerstig Haugland in DNB Markets for taking their time to meet us and answer our
questions.
We want to thank our supervisor Øystein Thøgersen, for help, support and inspiration. It has
been a pleasure to work with you.
We want to thank friends and families for their support. Special thanks goes to Synne’s father for providing us with useful input and discussions.
Bergen, December 2015
_______________________ ________________________
Synne Sogge Støhlmcher Sara Skjeggestad Meyer

3
Content ABSTRACT ........................................................................................................................................... 1
PREFACE……………………………………………………………………………………………...2
1 INTRODUCTION .......................................................................................................................... 5
1.1 THE NORWEGIAN PETROLEUM ECONOMY ................................................................................. 5
1.2 THE NORWEGIAN RE-ENTRY ..................................................................................................... 9
1.3 THE RESEARCH QUESTIONS ..................................................................................................... 10
1.4 THE STRUCTURE OF THIS THESIS ............................................................................................. 13
2 THE DUTCH DISEASE MODEL FOR A SMALL OPEN ECONOMY ............................... 14
2.1 THE CORE DUTCH DISEASE MODEL ......................................................................................... 14
2.2 THE RE-ENTRY PROCESS .......................................................................................................... 20
3 THEORY ON ECONOMIC POLICY ....................................................................................... 25
3.1 MONETARY POLICY ................................................................................................................ 25
3.2 FISCAL POLICY ........................................................................................................................ 34
3.3 INCOME POLICY………………………………………………………………………………39
4 TWO VIEWS ON THE NORWEGIAN RE-ENTRY PROCESS ........................................... 42
4.1 THE OPTIMISTIC VIEW ............................................................................................................. 42
4.2 THE PESSIMISTIC VIEW ............................................................................................................ 47
5 COMPARATIVE SECTOR SPECIFIC EMPLOYMENT ANALYSESFEIL! BOKMERKE ER IKKE
DEFINERT.
5.1 DATA AND CHOICE OF METHOD .................................... FEIL! BOKMERKE ER IKKE DEFINERT.
5.2 DATA FINDINGS ............................................................ FEIL! BOKMERKE ER IKKE DEFINERT.
6 DISCUSSION ............................................................. FEIL! BOKMERKE ER IKKE DEFINERT.
6.1 CHARACTERISTICS OF THE NORWEGIAN READJUSTMENTFEIL! BOKMERKE ER IKKE DEFINERT.
6.2 POLICY-MIX .................................................................. FEIL! BOKMERKE ER IKKE DEFINERT.
4
7 CONCLUSION AND FINAL REMARKS ............. FEIL! BOKMERKE ER IKKE DEFINERT.
7.1 THE OPTIMAL POLICY MIX ............................................ FEIL! BOKMERKE ER IKKE DEFINERT.
7.2 THE WAY AHEAD .......................................................... FEIL! BOKMERKE ER IKKE DEFINERT.
7.3 FURTHER RESEARCH AND LIMITATIONS OF THE THESIS FEIL! BOKMERKE ER IKKE DEFINERT.
8 BIBLIOGRAPHY ......................................................................................................................... 98
9 APPENDIX A – NACE REV. 2 ................................................................................................. 105
10 APPENDIX B – THE DATA SETS .......................................................................................... 106
DANISH DATA .................................................................................................................................. 106
SWEDISH DATA ................................................................................................................................ 106
NORWEGIAN DATA .......................................................................................................................... 107
DATA ERRORS, RECLASSIFICATION FROM SN2002 TO SN2007 ...................................................... 108
THE COUNTERFACTUAL NORWAY ................................................................................................... 109
THE PREDICTION SCENARIOES ......................................................................................................... 109

5
Chapter 1 – Introduction 1 Introduction
“From a unique economic position to restructuring.”
Øystein Olsen, Norwegian Central Bank Governor in Annual Address (2015)
The oil price fell drastically from a top of 115 USD per barrel from summer 2014 to 50 USD
early 2015. The drop in the oil price may have expedited an expected adjustment to a lower
activity level in the Norwegian Petroleum Sector (Olsen, 2015) While the activity in the
petroleum sector and the spending of petroleum revenue have caused years of high growth
and strong macroeconomic performances for the Norwegian economy, restructuring now
seems inevitable. Thus, Norway is on the verge of re-entry towards a post-petroleum
economy. Decreasing activities in the petroleum sector will cause sectoral readjustments of
labour. However, due to the Norwegian economic policy, many of the effects from
petroleum are assumed sustainable. Hence, rather than reversing the petroleum wealth, the
Norwegian re-entry should imply a reversing of petroleum activities. Yet, the Norwegian
economy has become increasingly petroleum dependent and the new economic phase is
likely to endure costs from a sectoral readjustment of labour. How costly it will be depends
on the need for restructuring in the economy, the economy’s ability to adapt and the policy
response to re-entry.
1.1 The Norwegian petroleum economy A windfall discoveries of oil and gas at the Norwegian continental shelf in the 1960’s
resulted in the emergence of a booming Petroleum Sector, improving the potential for
enforced economic growth (St.melding nr.25 (1973-1974)). The sector has been of
increasing importance for the Norwegian economy, causing high growth, low unemployment
and increasing standards of living, evident from Figure 1.1. The profitability from the
industry imposes strong impulses on the Norwegian economy, and in 2015, the Petroleum
Sector accounted for 15 % of total Norwegian GDP (St.Melding nr. 1 (2015-2016)).

6
To be able to extract the petroleum wealth, structural shifts in the he Norwegian sectoral
composition of labour have been necessary. These sectoral adjustments are in economic
theory referred to as Dutch Disease1. Due to the exhaustible nature of the resources, the
profitability in the Petroleum Sector will at some point diminish. Hence, the term “disease”
refers to potential costs from re-entry towards a post-petroleum economy.
Dutch Disease theory provides a theoretical framework for adjustment of labour in a small
open economy following a windfall discovery of resources or a substantial growth in
resource prices2 (Corden & Neary, 1982). The framework is applicable for assessing the
Norwegian development following a booming Petroleum Sector3. Dutch Disease theory
includes of two effects, the resource movement effect, and the spending effect. The total
resource movement effect can be decomposed into two mechanisms: i) A Booming
Petroleum Sector is expected to cause a reallocation of labour from the sector for tradable
goods and the sector for non-tradable goods in the mainland economy towards the profitable
Petroleum Sector. This resource movement effect will cause direct deindustrialization of
traditional tradable industries, in this thesis referred to as the Internationally Exposed Sector.
ii) Labour moving from the Non-Tradable Sector to the Petroleum Sector causes excess
demand for non-tradable goods. This will result in an appreciation of the Norwegian real
1 The term was first introduced in an article in the Economist, November 26th, 1977, and refers to the sectorial adjustments in Holland after the discoveries of natural gas in the 1960’s 2 Theory opens for several causes to the emergence of a booming sector. Corden (1984, p.360) presents three reasons: i) a permanent exogenous technical improvement, ii) a windfall discovery of new resources, and iii) an exogenous increase in world prices for the product relative to the price of import. 3 Assuming that Norway is a small open economy consisting of three sectors, a tradable sector, a non-tradable sector and the booming resource sector.
Figure 1.1 - GDP and unemployment in Norway. Source: Macrobond
Panel A) Unemployment Panel B) GDP
7
exchange rate, defined as the relative price of non-tradable to tradable goods. The real
appreciation will cause an indirect resource movement effect when labour is moved from the
Tradable Sector to the Non-Tradable Sector. Further, higher real income following the
Petroleum causes the spending effect. This reinforces the real appreciation and causes an
indirect deindustrialization. Thus, labour is moved from the Non-Tradable Sector to the
Internationally Exposed Sector. These effects on the sectoral composition of labour will be
referred to as inter-sectoral adjustment of labour.
Due to the nature of the Norwegian petroleum reserves, the Norwegian Petroleum Sector is
particularly technology and capital intensive. The sector’s use of labour factors is modest.
Only 2 % of the Norwegian labour stock is employed directly in petroleum4. This gives
expectations of a negligible inter-sectoral resource movement effect (Corden & Neary,
1982). Thereby, there has been a general perception that the main concern for the Norwegian
economy is to restrict the spending effect.
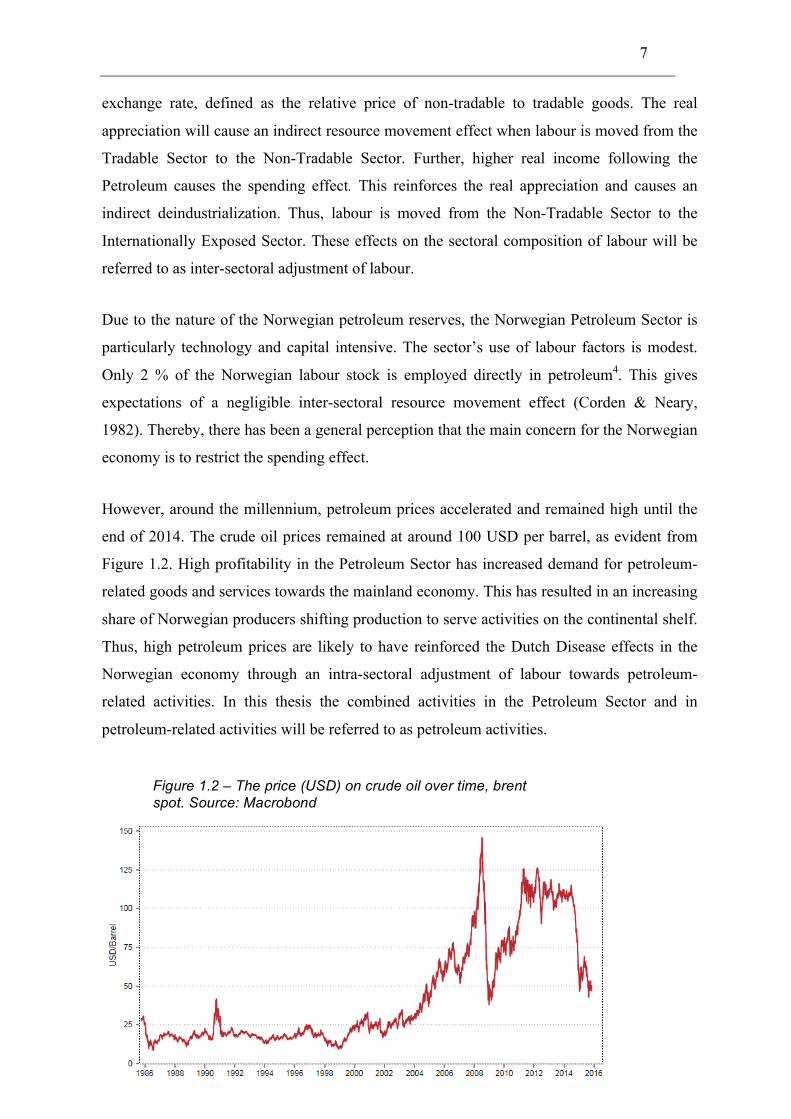
However, around the millennium, petroleum prices accelerated and remained high until the
end of 2014. The crude oil prices remained at around 100 USD per barrel, as evident from
Figure 1.2. High profitability in the Petroleum Sector has increased demand for petroleum-
related goods and services towards the mainland economy. This has resulted in an increasing
share of Norwegian producers shifting production to serve activities on the continental shelf.
Thus, high petroleum prices are likely to have reinforced the Dutch Disease effects in the
Norwegian economy through an intra-sectoral adjustment of labour towards petroleum-
related activities. In this thesis the combined activities in the Petroleum Sector and in
petroleum-related activities will be referred to as petroleum activities.
4 Register-based employment data form Statistics Norway
Figure 1.2 – The price (USD) on crude oil over time, brent spot. Source: Macrobond
8
In order to restrict the potential costs of re-entry, political initiatives are implemented to
ensure that the Norwegian government collects the petroleum rent5. The petroleum rent is
defined as the share of gross product that excess normal factor prices (Cappelen el al. 2013).
Following these initiatives, the government collects approximately 85 % of the annual net-
cash flow in the Petroleum Sector(Olsen & Skjæveland, 2002). The government’s revenue
from petroleum is invested in the Norwegian sovereign wealth fund6, the Government
Pension Fund Global, referred to as GPFG (St.melding nr. 21 (2014-2015)).
Petroleum revenues are gradually phased into the economy over the fiscal budget, following
the Norwegian Fiscal Rule. The Fiscal Rule states that the public spending of petroleum
wealth in a normal year should be in accordance with the 4 % expected real return of the
GPFG7. Thus, a Norwegian assumption is that the spending effect is sustainable over time,
since the properties of the Fiscal Rule allows for continues positive petroleum impulses in
the Norwegian economy.
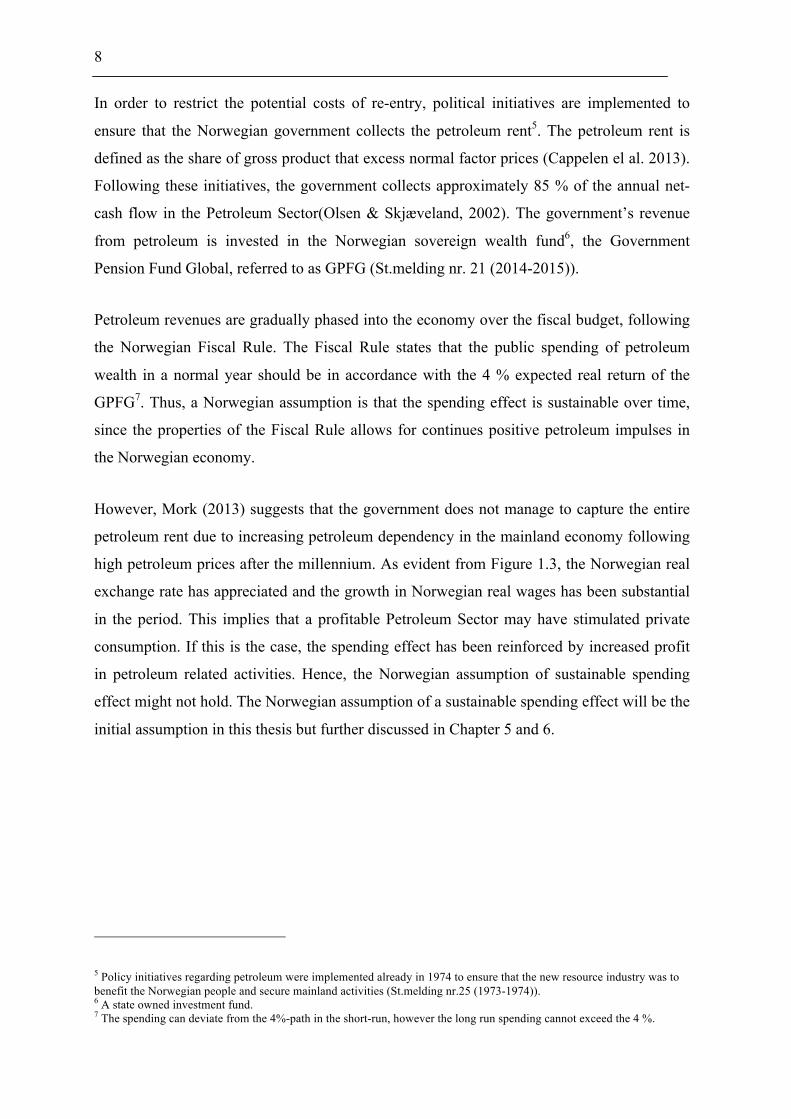
However, Mork (2013) suggests that the government does not manage to capture the entire
petroleum rent due to increasing petroleum dependency in the mainland economy following
high petroleum prices after the millennium. As evident from Figure 1.3, the Norwegian real
exchange rate has appreciated and the growth in Norwegian real wages has been substantial
in the period. This implies that a profitable Petroleum Sector may have stimulated private
consumption. If this is the case, the spending effect has been reinforced by increased profit
in petroleum related activities. Hence, the Norwegian assumption of sustainable spending
effect might not hold. The Norwegian assumption of a sustainable spending effect will be the
initial assumption in this thesis but further discussed in Chapter 5 and 6.
5 Policy initiatives regarding petroleum were implemented already in 1974 to ensure that the new resource industry was to benefit the Norwegian people and secure mainland activities (St.melding nr.25 (1973-1974)). 6 A state owned investment fund. 7 The spending can deviate from the 4%-path in the short-run, however the long run spending cannot exceed the 4 %.
9
The favourable impulse of high petroleum prices on the Norwegian mainland economy may
be referred to as a super cycle – a term denoting long lasting cycles with an expansionary
phase of minimum 10 years and broad-based effects (Cuddington & Jerrett, 2008). Today,
there are factors indicating that the Norwegian super cycle has started to contract.
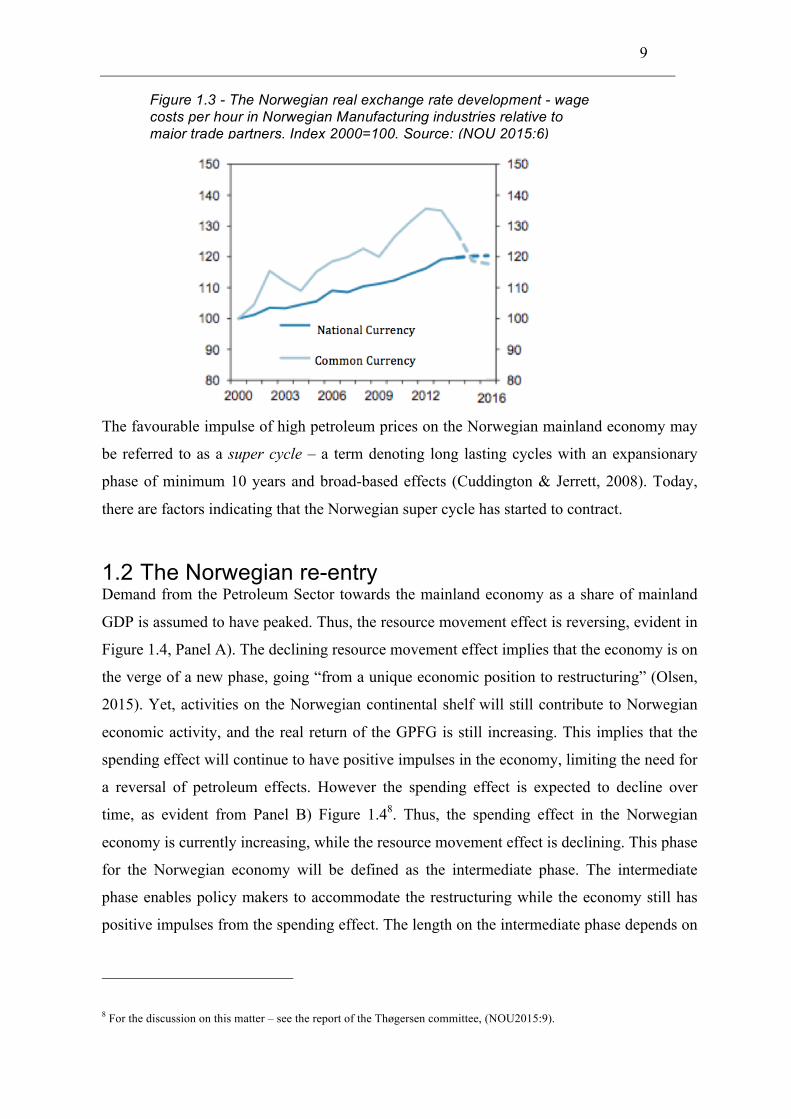
1.2 The Norwegian re-entry Demand from the Petroleum Sector towards the mainland economy as a share of mainland
GDP is assumed to have peaked. Thus, the resource movement effect is reversing, evident in
Figure 1.4, Panel A). The declining resource movement effect implies that the economy is on
the verge of a new phase, going “from a unique economic position to restructuring” (Olsen,
2015). Yet, activities on the Norwegian continental shelf will still contribute to Norwegian
economic activity, and the real return of the GPFG is still increasing. This implies that the
spending effect will continue to have positive impulses in the economy, limiting the need for
a reversal of petroleum effects. However the spending effect is expected to decline over
time, as evident from Panel B) Figure 1.48. Thus, the spending effect in the Norwegian
economy is currently increasing, while the resource movement effect is declining. This phase
for the Norwegian economy will be defined as the intermediate phase. The intermediate
phase enables policy makers to accommodate the restructuring while the economy still has
positive impulses from the spending effect. The length on the intermediate phase depends on
8 For the discussion on this matter – see the report of the Thøgersen committee, (NOU2015:9).
Figure 1.3 - The Norwegian real exchange rate development - wage costs per hour in Norwegian Manufacturing industries relative to major trade partners. Index 2000=100. Source: (NOU 2015:6)
10
the conduction of the Fiscal Rule, thus it poses an important aspect related to the optimal
policy-mix during re-entry.
The optimal policy response to declining petroleum activities should aim to minimize the
costs related to a re-entry process. The restructuring process will cause readjustment costs in
the transition towards a post-petroleum economy, defined as increased structural
unemployment following from a rigid process of sectoral readjustments (Steigum &
Thøgersen, 2003). The readjustment costs and all other costs related to the short-run and
long-run effects of sectoral readjustments of labour and the short-run and long-run effects of
economic policy measures used to mitigate current readjustment costs will be defined as
restructuring costs.
1.3 The research questions The Norwegian economy on the verge of re-entry and the assumed increasing petroleum
dependency in the mainland economy has motivated the following three research questions:
Research question 1 How has the Norwegian Petroleum Sector affected the sectoral composition of labour in the
Norwegian economy?
Figure 1.4 - Panel A) Demand form the Petroleum Sector towards the Norwegian mainland economy. Panel B) The use of petroleum revenues over the fiscal budget, illustrated by the structural budget deficit and the 4 % real return on the GPFG (NOU 2015:9, 2015)
Panel A) Panel B)

11
Research question 2 What is the extent of the required sectoral readjustment of labour to reach a balanced post-
petroleum sectoral composition?
Research question 3 What is the optimal policy-mix to ease the re-entry process, given the required sectoral
readjustment of labour?
It is important to understand the characteristics of the initial sectoral structure of the
economy to assess the required sectoral readjustments and ease the costs of restructuring.
Dutch Disease theory gives clear predictions of sectoral adjustment of labour following a
booming Petroleum Sector. However, similar sectoral developments have taken place in
several non-petroleum OECD countries. Existing literature fails to separate the petroleum
driven sectoral labour adjustments, peculiar for Norway, from the natural development for a
similar non-petroleum economy. This thesis aims to distinguish between these two drivers of
sectoral labour adjustment. Thereby disentangling the Norwegian petroleum-related Dutch
Disease effects from the natural development in a counterfactual non-petroleum Norwegian
economy. This is conducted by use of a comparative sector specific employment analysis.
The sectoral development in the counterfactual Norway is based on the development in
Scandinavia. Scandinavia is here referred to as the average development in Denmark and
Sweden. Norway, Denmark and Sweden are similar countries along economic and
institutional dimensions (Steigum & Thøgersen, 2014). Due to similarities in culture, history,
institutions, welfare systems and standards of living, Scandinavia provides a measure for
comparison and a benchmark for the future Norwegian development. Assessing two major
views on the petroleum economy and cost of the restructuring process provides further
insight about Norwegian re-entry. These are represented by the slightly optimistic view of
Cappelen et.al (2013), and more pessimistic expectations of Mork (2013) and Bjørnland and
Thorsrud (2014).
Understanding the petroleum-driven development prior to re-entry provides the ability to
suggest an optimal policy-mix to minimize restructuring costs. The optimal policy response
depends on the drivers of required restructuring process following declining petroleum
activities and the ability of the Norwegian economy to adapt. In the re-entry process,
economic policy should stabilize the short-run fluctuations from reduced petroleum activities

12
and facilitate a long-run structural shift by ensuring labour market flexibility, while still
addressing the long-run considerations for economic growth and stabilization.
Expected findings Dutch Disease theory gives clear predictions about the sectoral labour adjustment following
a booming Petroleum Sector. Based on Dutch Disease theory, the expected findings should
be:
• Labour in the Petroleum Sector as share of total employment is increasing.
• Deindustrialization in the Norwegian economy has been more profound than in
Scandinavia.
• The effect in the Non-Tradable Sector is ambiguous due to the resource movement
effect and the spending effect pulling in different directions.
The theoretical predictions are modified based on Norwegian characteristics. Due to the
technology and capital-intensive nature of the Norwegian Petroleum Sector, the inter-
sectoral adjustment of labour from the Internationally Exposed Sector is expected to be
marginal. Due to the properties of the Norwegian economy with a large public sector it is
appropriate to decompose the Non-Tradable Sector into Market Directed Services and Non-
Market Directed Services. This enables capturing the dynamics of the private and public
activities during sectoral adjustment. This dynamic is interesting for of assessing the effect
of the assumed sustainable public spending of petroleum revenues. This may affect either
Market Directed Services or Non-Market Directed Services through tax reliefs or increased
public expenditure, respectively. The decomposition of mainland economy into petroleum
related and non-petroleum related activities, are expected to revel intra-sectoral labour
adjustments towards petroleum Further, Norwegian private sectors, the Internationally
Exposed Sector and Market Directed Services, are expected to exhibit an extensive
petroleum dependency following high petroleum prices. A real appreciation and higher
Norwegian real wage growth is expected to have caused Market Directed Services to
increase faster in Norway than in counterfactual Norway. Non-Market Directed Sector is
also anticipated to increase relatively faster due to the public spending effect.

13
Thus, based on the Norwegian characteristics, the expected findings are:
• Limited inter-sectoral adjustment of labour towards the Petroleum Sector, however:
o A slightly higher growth in Market Directed Services than in the counterfactual
Norway following from a gradual phasing of the spending effect. This is due to
real wage growth and a real appreciation.
o A relatively faster growth in Non-Market Directed Services compared to a
counterfactual Norway due to the phasing in of the spending effect over the fiscal
budget.
• A substantial intra-sectoral adjustment of labour in the Internationally Exposed
Sector and Market Directed Services due to increasing demand from the Petroleum
Sector towards the mainland economy.
1.4 The structure of this thesis The following chapter will present the theoretical framework for Dutch Disease effects
following a booming Petroleum Sector in a small, open economy and the consequential
effect of a reversal of the Petroleum Sector. Economic policy tools of monetary policy, fiscal
policy and income policy is presented in Chapter 3. In Chapter 4, two Norwegian views on
the Norwegian petroleum economy and the forthcoming restructuring process are outlined,
followed by comparative sector specific employment analyses in Chapter 5. This gives a
foundation to suggest an optimal policy-mix for the Norwegian re-entry process in Chapter
6. Chapter 7 includes concluding remarks and a brief discussion about the implications of
recent developments for the forthcoming sectoral readjustment of labour.

14
Chapter 2 – Dutch Disease theory 2 The Dutch Disease model for a small open economy
2.1 The core Dutch Disease model The windfall discovery of petroleum on the Norwegian continental shelf resulted in a new
booming Petroleum Sector in Norway. A booming Petroleum Sector in a small open
economy causes sectoral adjustment of resources, known as Dutch Disease (Corden W.,
1984). This may result in deindustrialization of the traditional tradable sector, here referred
to as the Internationally Exposed Sector, IE. The following theoretical framework to assess
the booming Petroleum Sector in Norway is based on the work by Corden and Neary (1982).
Before a windfall discovery of petroleum, a small open economy is assumed to consist of
two sectors, the Non-Tradable Sector, N, and the Tradable Sector, T9. The Non-Tradable
Sector operates in the domestic marked with prices driven by normal market mechanisms10.
Internationally Exposed Sector consists of businesses competing in the international market,
and this sector has to adapt to exogenous world prices. A windfall discovery of new
resources introduces a new tradable sector to the economy: a booming Petroleum Sector, PS.
The Petroleum Sector is assumed more profitable than the Internationally Exposed Sector.
The static theoretical model builds on several assumptions. Each sector applies two factors:
labour, L, and capital, K. The labour stock is fixed, but perfectly mobile between all sectors
(Corden & Neary, 1982). Capital is sector-specific and the factor price is measured in terms
of internationally exposed goods. Internationally exposed goods are the numenaire good11
where the price is normalized to one. The Internationally Exposed Sector is relatively more
capital intensive than the Non-Tradable Sector
Following a booming Petroleum Sector, the resource movement effect occurs due to higher
marginal product of labour in the Petroleum Sector than in other sectors. Thus, labour is
reallocated from the Non-Tradable Sector and the Internationally Exposed Sector to the
Petroleum Sector (Corden & Neary, 1982). This causes direct deindustrialization. Following
excess demand for non-tradable goods, the price for such goods increase. Since the price for
9 Tradable Sector = Internationally Exposed Sector + Petroleum Sectors. 10 Later on, this sector will be decomposed into a Non-Market Directed Sector and a Market Directed Sector. 11 The good that’s price the relative price of all other tradables are expressed.

15
tradable goods are exogenous this results in an appreciation of the real exchange rate,
defined as the relative price of non-tradable to tradable goods, PN/PT. This causes a
movement of labour from the Tradable Sector to the Non-Tradable Sector and an indirect
deindustrialization, which is referred to as the indirect resource movement effect.
The spending effect increases demand for non-tradable goods. Increased demand results in
higher PN reinforcing the real appreciation, and thus reinforcing indirect deindustrialization.
Thereby resources are moved from the Non-Tradable Sector to Internationally Exposed
Sector12 (Corden W., 1984).
The resource movement effect and spending effect can be illustrated in a simple Heckscher-
Ohlin framework, shown in Figure 2.1 (Corden & Neary, 1982). In the framework, total
labour supply is given by the horizontal axis, where labour in the Non-Tradable Sector, LN,
is measured from the left and labour in the tradable sector, LT, is measured from the right. LT
is defined as the sum of labour in the Internationally Exposed Sector and in the Petroleum
Sector, LIE+LPS. Due to perfect market clearing, there is no unemployment in the labour
stock. The vertical axes represent the real wages, W13. Labour demand in each sector is a
decreasing function of wages relative to sector specific product prices.
12 The size of this effect depends on the marginal propensity in consumption of non-tradable goods 13 Producer real wages, W, in terms of prices facing a sectors, determines labour demand for that sector.

16
The initial equilibrium in the labour market, Point A Figure 2.1, determines the relative
sectoral distribution of labour between the Tradable Sector and the Non-Tradable
Sector, 𝐿!! 𝐿!! . Petroleum activities shift total labour demand in the tradable sector up to 𝐷!"! .
Due to higher profitability in the Petroleum Sector, labour from the Internationally Exposed
Sector is reallocated to the Petroleum Sector. This shifts labour demand in the Internationally
Exposed Sector to 𝐷!"#! . Keeping product real wages fixed labour adjustment in the
Internationally Exposed Sector is at the point 𝐿!"! . Thus, the direct resource movement effect
is the difference between 𝐿!! and 𝐿!"! . Producer real wages are defined as wages deflated by
the product price. For the labour market to clear, real wages must increase so that the
equilibrium is in Point B. This increases labour in the Non-Tradable sector to 𝐿!! , on the
expense of labour in the Internationally Exposed Sector. The labour in the Internationally
Exposed sector is reduced to 𝐿!"! , reinforcing the deindustrialization. Thus, the indirect
resource movement effect is the movement from 𝐿!"! to 𝐿!"! (Corden & Neary, 1982).
The commodity market is included in the framework by the use of a Salter-diagram in order
to illustrate the effects from a real exchange appreciation following a booming Petroleum
Sector, see Figure 2.2. PN is made endogenous in the model.
Figure 2.1 - Deindustrialization due to a booming petroleum sector in the Heckscher-Ohlin framework (Corden & Neary, 1982)
W0
W2
W0
W2
W

17
Domestic production is determined by the concave production possibility frontier, TN. The
income consumption-curve, the AA’-curve, represents the set of stationary equilibrium for
different levels of income where consumption equals production of non-tradable goods,
CN=XN. The initial market-equilibrium is where the production possibility frontier tangents
the highest attainable indifference curve for consumers, u0. The initial real exchange rate is
given by the slope in the point of tangency, Point a.
Due to the booming Petroleum Sector, the production possibilities in the Tradable Sector is
expanded, while the production possibilities in the Non-Tradable Sectors remains
unchanged, evident in Figure 2.2. The new production possibility frontier is shifted to T’N.
To assess the effect from the resource movement effect on the real exchange rate, income-
elasticity of demand is assumed to be zero, implying that the spending effect is disregarded.
When keeping the real exchange rate fixed, this would isolated correspond to a production
adjustment given by Point b. If keeping demand for non-tradable goods unchanged, the
consumption adjustment from the booming Petroleum Sector will be in Point j. This implies
excess demand for non-tradable goods in the economy. When easing the assumption of
constant CN, this excess demand will increase PN, causing a real appreciation. This
movement corresponds to the indirect resource movement effect in the Internationally
Exposed Sector. The outcome of the resource movement effect alone will be at the T’N line,
between Point b and Point j. This adjustment will depend on the share of labour that can be
Figure 2.2 - A real appreciation in the Salter-diagram (Corden & Neary, 1982)
N

18
drawn from elsewhere in the economy. This is given by point B in the Heckscher-Ohlin
framework in Figure 2.1.
To assess the spending effect in Figure 2.2 the assumption of zero income-elasticity of
demand is eased14. When keeping the exchange rate fixed, the discovery of petroleum results
in a production adjustment in Point b, while demand moves along the income-consumption
curve, AA’, to Point c. Excess demand causes a real appreciation. The new adjustment in the
economy from the spending effect will be along the T’N-curve, between Point j and Point c.
The size of the effect depends on marginal prosperity to consumption. This will increase
demand for labour in the Non-Tradable Sector. Returning to the Heckscher-Ohlin
framework, this corresponds to a shift in demand for labour in the Non-Tradable Sector to
𝐷!"! , as illustrated in Figure 2.3.
The petroleum effect on the Non-Tradable Sector is ambiguous. This is because the resource
movement effect and the spending effect pull demand for non-tradable goods in different
directions, evident from Figure 2.2. Thus, while the resource movement effect dominates the
final effect on LN in Figure 2.3, 𝐿!! could have ended up to the right of 𝐿!! . However, Figure
2.3 illustrates that both the real appreciation-effects from the indirect resource movement
14 All non-tradable goods are assumed to be normal goods.
Figure 2.3 - Sectoral adjustment in the labour market including both real appreciation-effects in the Heckscher-Ohlin framework (Corden & Neary, 1982)
1

19
effect, 𝐿!! to 𝐿!! , and the spending effect, 𝐿!! to 𝐿!! , will increase real wages. Thus, demand
for LN increase on the expense of LT. This results in an indirect deindustrialization due to a
sectoral adjustment of labour to point B.
2.1.1 Migration The core Dutch Disease model assumes a fixed labour stock. However, if opening for
international labour mobility, the labour stock can expand following a booming Petroleum
Sector. Thus, labour migration can ease the scarcity of labour factors. A booming Petroleum
Sector will increase consumer real wages in terms of a weighted basket of non-tradable
goods and internationally exposed goods, W*15. This is likely to cause immigration to
Norway, and can be illustrated by the use of a framework for market equilibrium in the
market for non-tradable goods (Corden W., 1984). The framework is applied in order to
illustrate the effect of changes in the total labour stock. According to the core Dutch Disease
model, the resource movement effect initially reduces the labour stock in the Non-Tradable
Sector, reducing the supply of non-tradable goods, so that the supply curve shift to S1. This
causes excess supply of non-tradable goods bringing equilibrium from Point A to Point B in
Figure 2.4. Disregarding the spending effect, the product real wage, W, in terms of non-
tradable goods will rise. This will cause migration, increasing the labour supply and shift the
supply curve back to S0. Thus, PN falls. Migration may continue until W* is back at the pre-
petroleum level in Point A.
The spending effect explained in the core model shifts demand for non-tradables to D1.
Immigration reinforces demand by enlarging the labour stock, so that D1 shifts further to D2.
This results in an adjustment in Point C. In Point C, PN and output of non-tradables have
increased compared to the initial level in Point A. For the deindustrialization effect to be
offset, W* must be reduced to the pre-petroleum level. PT is exogenous to the model, to that
the development in W* depends on the response in W and PN. PN will rise following both the
spending effect and resource movement effect. However, the effect on W is ambiguous and
dependent on the size of the spending effect relative to the resource movement effect.
Comparing Point C to Point A, W in terms of non-tradables must have fallen since
production of non-tradables has risen. Thus, W in terms of tradables must have risen since
15 𝑊∗ = !!"!"!(!!!)!!
. a is the weighting between the different goods in the consumption basket, where a is given by the
consumer´s marginal elasticity of substitution.

20
Figure 2.4 - Migration in the Dutch Disease framework, illustrated by the market for non-tradable goods (Corden W., 1984, p.361)
the relative prices have changed. Due to a higher W in terms of tradables, LT must be higher
in Point C than in Point A, implying that some deindustrialization remains.
2.1.2 Decomposing the Internationally Exposed Sector It is possible that some of the industries within the Internationally Exposed Sector actually
expand due to a booming Petroleum Sector, even though the sector as a whole contracts
(Corden W., 1984). The Petroleum Sector may demand goods and services from the
Internationally Exposed Sector, increasing the share of petroleum-related activities for
certain industries within the sector. Thus, an intra-sectoral adjustment of labour occurs.
While the core Dutch Disease model assumes that a new resource sector results in two
tradable sectors, increased petroleum dependency in the Internationally Exposed Sector can
be modelled by introducing an additional sector to the framework. Thus, the tradable sectors
in the petroleum economy are the Petroleum Sector, the non-petroleum related
Internationally Exposed Sector and the petroleum related Internationally Exposed Sector
(Torvik, 2015). This implies that the economy will be subjected to an additional resource
movement effect, increasing petroleum dependency in the economy.
2.2 The re-entry process When the marginal cost of extraction exceeds the marginal revenue, the Norwegian
Petroleum Sector is expected to diminish gradually. The marginal cost is increasing with
extraction because easily accessible petroleum resources are developed first. This follows
XN
21
from the exhaustible nature of petroleum. A negative petroleum prices shock may accelerate
the diminishing commercial profitability and thereby expedite the re-entry process.
During re-entry, the Petroleum Sector will be downsized, and with an initial real
depreciation following decreasing petroleum activities, the Dutch Disease effects in the
economy will have to reverse in the core model.
Theory describes how market rigidities may cause re-entry problems. Re-entry problems are
defined as the challenges facing an oil-exporting economy when the petroleum wealth is
reversed and the previous level of consumption in the economy no longer can be sustained
(Steigum, 1989). Following the Norwegian assumption of a sustainable spending effect, and
thus a maintainable level of consumption, the forthcoming re-entry problems in its pure
definition will be limited. However, some sectoral readjustments are expected and the
potential costs related to labour market rigidities during re-entry. Such market imperfections
can be real wage rigidities and sector specific knowledge. This will prevent perfect
transferability of labour between sectors and are thereby associated with increased
unemployment in the economy (Steigum & Thøgersen, 2003).
An economy will constantly face a fraction of frictional unemployment due to turnovers in
the labour market, originating from imperfect information so that it takes time for workers to
be matched to new jobs (Lillen, 1982). Further, Business cycle fluctuations and aggregate
disturbances, in particular aggregated demand, cause cyclical unemployment (Abraham &
Katz, 1984). Cyclical unemployment is short-run deviations from the natural level of
unemployment, occurring when sticky wages prevents a flexible labour market adaption to
fluctuations in economic activities. Structural unemployment on the other hand occurs due
imperfect transferability of labour between sectors and causes structural imbalances in the
economy (Jackman & Roper, 1987). Thus, structural unemployment follows from
mismatches in the labour market16. During re-entry the economy faces a structural shift form
a gradual decrease in petroleum activities. Following Abraham and Katz (1984), cyclical
variations in unemployment, which directly following a structural shift are not necessary
driven by fluctuations in aggregated demand. Hence, unemployment is caused by sectoral
readjustment of labour and will here be defined as structural unemployment. Increased
16 Wage rigidities, geographical immobility, technological innovations, capital deepening and imperfect transferability of industry-specific knowledge among others may cause such rigidities.
22
structural unemployment and an uncertain economic outlook during a re-entry can limit
households’ demand and cause additional cyclical unemployment.
The static properties of the core Dutch Disease model do not capture rigidities in a sectoral
adjustment process. By easing the assumptions of the core model the Dutch Disease
framework may explain more realistic properties of the Norwegian re-entry process to a
post-petroleum economy.
From real wage rigidities, the result of the Dutch Disease effects is increased unemployment
during restructuring rather than the nominal wage adjustments outlined by the core model
(Corden W., 1984)17. If some labour factors are sector-specific in the intermediate run,
sectoral labour adjustments following reduced petroleum activities will cause unemployment
of these specific factors. Similarly, sector-specific knowledge in the Internationally Exposed
Sector may enforce training costs from the transfer of knowledge to new labour factors,
when the real depreciation enlarges the sector’s labour stock. This is the adjustment cost
applied for assessing dynamic properties of sectoral adjustment following an adverse
external trade shocks to the Petroleum Sector (Steigum & Thøgersen, 2003). By examining
the dynamic effects of adjustment costs, the effect of re-entry on unemployment can be
assessed18.
When the profitability in the Petroleum Sector falls due to an adverse trade shock, labour
factors will be reallocated from the Non-Tradable Sector and the Petroleum Sector towards
the Internationally Exposed Sector. This is evident from the reversed effects of the core
Dutch Disease model. Due to the lack of sector-specific knowledge, there are initial rigidities
in the Internationally Exposed Sector’s labour stock, causing unemployment during the
readjustment process. If workers with substantial experience from the sector can be
reallocated to function as instructors, new workers can be trained to adapt to required sector-
specific knowledge. This is associated with costs of training and reduced activity in the
sector due to the initial use of labour factors on training rather than production. Training
costs are assumed to be linear and given by the required number of instructors to train the
flow of new workers. Thus, in the decision of reallocating experienced workers from
17 A static modelling of Dutch Disease effects with wage stickiness can be found in (Van Wijnbergen, 1984).
18 The model here presented is a strict simplification of the original theoretical model. The entire dynamic structure of the model will not be presented, but can be assessed in Steigum and Thøgersen (2003).
23
production to training, profit-maximizing firms in the Internationally Exposed Sector
considers the marginal product of labour. The marginal product of labour is given by the
opportunity cost of applied labour factors in production relative to the cost of training new
workers, given the net flow of new workers to the sector.
The opportunity cost of workers applied in production rises when the shock to petroleum
increases the labour supply for the Internationally Exposed Sector. Hence, the marginal
product of labour increases temporary. This will cause a reallocation of experienced workers
to instructor positions initially reducing production in the sector. This is necessary to enable
enforcement of the sectoral labour stock. The real wages are gradually adjusted as labour
moves towards the Internationally Exposed Sector. This will depreciate the real exchange
rate and reduce the temporary unemployment. In the presence of adjustment costs, this
sectoral readjustment of labour may be a costly and time-consuming process (Steigum &
Thøgersen, 2003).
The dynamics of this model can be modelled in a similar framework to the Dutch Disease
model in a two-sector Salter-diagram. The Petroleum Sector is modelled in Figure 2.6 as a
foreign exchange gift, allowing for a negative trade balance in the economy with 𝐶!"! > 𝑋!"! .
The initial adjustment in the economy is given by Point a.

24
Figure 2.5 - The re-entry problem, following (Steigum, 1989) and (Norman & Orvedal, 2010). An oil price shock reduces production in Internationally Exposed Sector due to training costs. Production in the Non-Tradable Sector fall as the labour stock moves.
In the process of sectoral readjustment following reduced profitability in the Petroleum
Sector, consumption must be reduced from 𝐶!"! to 𝐶!"! , i.e. import must fall equal to the size
of the price shock. For reaching a new equilibrium for the post-petroleum economy,
consumption and production must be reduced to Point b. The new long-run equilibrium is
here modelled to allow for a continuous higher consumption than justified by production of
internationally exposed goods due to the properties of the Norwegian Fiscal Rule. The real
depreciation following reduced petroleum revenues will move labour from the Non-Tradable
Sector to the Internationally Exposed Sector. Adjustment costs from sector-specific
knowledge will cause reallocation of a fraction of 𝐿!" to instructor-positions for training the
flow of new workers to the sector. This will result in an initial drop in 𝑋!"! to 𝑋!"! (Steigum,
1989). Due to real wage stickiness, the production will not immediately increase in the
Internationally Exposed Sector, yet the real depreciation will cause XN to fall. Thus, the
economy will approach the new long-run equilibrium through Point c, resulting in a costly
restructuring process with increased unemployment in the period19 (Norman & Orvedal,
2010)
19 Following the arguments of (Norman & Orvedal, 2010), demand has to be restricted further, to where 𝑋!"! intersects the AA’-curve, in order to obtain a general equilibrium. This entails even larger restructuring costs.
25
Chapter 3 - Theory on economic policy 3 Theory on economic policy Economic policy in Norway should be set to secure desirable macroeconomic outcomes such
as sustainable economic growth, economic efficiency, low unemployment, a fair income
distribution and social insurance in a welfare state for current and future generations
(Steigum, 2013; St.melding nr.29 (2000-2001)). The problems in the economy that arises
when Norwegian petroleum activities start to decline, violates the prospects of a stable and
sustainable economic development. Dutch Disease mechanisms, when allowing for market
rigidities, makes evident that sectoral readjustment of labour may be a costly and time-
consuming process. In order to minimize the restructuring costs, the Norwegian government
has several economic policy instruments within three areas of economic policy: fiscal policy,
monetary policy and income policy. During the re-entry process the interaction of these three
areas result in a policy-mix to ease market rigidities, and facilitate new activities. Further,
economic policy should aim to maintain domestic demand and secure long-run policy-
considerations in order to reduce overall restructuring costs.
3.1 Monetary Policy Monetary policy serves as the first line defence from business cycle fluctuations in Norway.
The current guidelines for fiscal and monetary policy in Norway were established in 2001
(St.melding nr.29 (2000-2001)). The current mandate of the Norwegian monetary policy is
to secure stability in inflation and in the exchange rate, contributing to stabilize the
expectations to the currency development of the Norwegian krone, NOK, while contributing
to stabilization of production and employment. (Norwegian Regulation on Monetary Policy
29.03.2001). The Norwegian central bank, Norges Bank, is responsible for the operational
conduction of Norway monetary policy, targeting a low, stable inflation of 2,5 %. Their main
tool is the key policy rate. The key policy rate affects the economy through different
channels and is regarded a well-suited tool for stabilizing business cycles since monetary
policy only affects the real economy in the short-run (Røisland & Sveen, 2005). Thus, the
inflation target is made flexible, not solely focusing on inflation but also ensuring a stable
development in unemployment and output. The financial crisis of 2008/09 showed that
build-ups of financial imbalances during booms could be devastating (Reinhart & Rognoff,

26
2009). Thus, an explicit concern for the robustness of the monetary policy and consideration
of the financial stability was introduced. Now, Norges Bank holds three criteria for an
appropriate interest rate path (MPR 1/11):
1. The Inflation target is reached
2. The Inflation target is flexible, considering the output gap and the inflation
target simultaneously
3. Monetary policy is robust.
Some channels for the effect of monetary policy on the real economy that will be relevant in
the Norwegian re-entry process are here presented 20:
The traditional interest rate channel When the key policy rate deviates from the real interest rate affects real investments,
investments in residential housing and expenditures on consumers’ durables. Thus monetary
policy affects output and economic activity (Mishkin, 1996). This may contribute to
facilitate new activity in the Norwegian economy after petroleum.
The net export channel Further, a change in the key policy rate influences net export (Mishkin, 1996). This is due to
the monetary policy influence on the exchange rate. All other being equal, a difference
between key policy rates in Norway and abroad leads to capital flight to the country with
relative low interest rates due to lower returns on domestic investments. This reduces
demand for the local currency causing the currency to depreciate (Bank of England, 2001).
Exported goods and services become relatively cheaper on the global market, while imported
goods become relatively more expensive. Thus, monetary policy can improve local cost-
competitiveness, increasing GDP through an improved trade balance (Gartner, 2009).
The credit channel Monetary policy influences the access to capital as well as the asset and debt positions of
households and firms through the credit channel (Mishkin, 1996). Expansionary monetary
policy, in other words decreasing the key policy rate, directly results in increased access to
credit (Hall, 2001). In addition, reduced costs related to holding a mortgage results in lower
20 Following transmission mechanisms applied by (Norges Bank, 2015a); (Mishkin, 1996).

27
risk of defaults. This reduces the risk premiums to loans, contributing to a further increase
access to credit.
The expectation channel Aggregated demand depends on the expected path of the interest rate and on expected future
long-run interest rates due to their influence on future alternative cost. Expectations of the
future interest rate further affects aggregated demand (Svensson, 1999).
In addition, the key policy rate affect inflation in the long and the short run through three
channels (Norges Bank, 2015a):
The demand channel Fluctuations in economic activities due to changes in the key policy rate affect inflation
through the demand channel. Increased activity pushes wages up and increases the
purchasing power of households. The change in inflation depends on wages response to the
key policy rate, affected by excess capacity in the economy.
The exchange rate channel The Consumer Price Index basket consists of imported and domestically produced goods,
measuring inflation (Statistics Norway, 2015). Through the net-export channel, expansionary
monetary policy results in a depreciation of the local currency. Since imported goods
become relatively more expensive, inflation increases. More expensive imported goods and
increased cost-competitiveness for internationally exposed industries increase the wage
growth, driving inflation further.
The expectation channel A reduced key policy rate causes expectations of higher inflation in the future. This affects
current wages, current aggregated demand and current exchange rate. Wage stickiness will
cause economic actors to consider future inflation when negotiating current wages. Further,
aggregated demand is affected by expectations about increased future prices and the
exchange rate is affected by expectations about future exchange rates. Increased demand and
a lower exchange rate will reinforce the wage growth. Together with imported inflation this
will further increase inflation today.
The criteria for an appropriate interest rate path will now be elaborated, starting with flexible
inflation targeting, including the two first criteria.

28
3.1.1 Flexible inflation targeting Low and stable inflation results in transparent relative prices and secures efficient markets. It
also reduces speculative behaviour, and thus contributes to stable financial markets21
(Freedman & Laxton, 2009). The operational target for Norges Bank is an annual growth in
consumption prices which in the long run approaches 2,5 %22 (Norwegian Regulation on
Monetary Policy 29.03.2001). Inflation targeting is founded on a rule-based monetary policy
regime23. Since economic agents adjust their behaviour according to their expectations of
future inflation and interest rates, credibility and consistency following a rule-based
inflation-targeting regime ensures an efficient conduction of monetary policy24. Rule-based
monetary policy is widely applied, and inflation targeting is regarded as international best-
practice for monetary policy (Thøgersen, 2004).
The mechanisms of Norwegian flexible inflation targeting are here illustrated through a
theoretical framework following Røisland and Sveen (2005). For the purpose of this thesis,
the presentation of the framework will focus on the optimal response of Norges Bank to a
reduction in Norwegian petroleum activities.
When conducting monetary policy, Norges Bank aims to minimize their loss function:
𝐿 =12 [ π! – π
∗ ! + λ 𝑌! − 𝑌!∗ !]
Over time the central bank shall minimize the deviation in inflation, 𝜋, from the inflation
target, 𝜋∗, and the deviation in current output, Y, from the natural output-level, Y*25. 𝜆 is a
weight indicating the preferences of Norges Bank. A large 𝜆 assigns more weight on
stabilizing output at the expense of inflation prolonging the time horizon for achieving the
inflation target. Norges Bank has proved to be credible, so the credibility of the inflation
target remains despite short run inflation gaps.
21 Too low inflation induces risk of declined nominal wages, narrowed key policy rate flexibility and deflation (Akerlof et al., 1996). 22 The target is slightly higher than other countries’ targets, due to the price pressure from the phasing of petroleum revenues. 23 The theoretical argument for a ruled-based policy originates from the work of Kydland and Prescott (1977). 24 Monetary policy authorities may have short-termed incentives to deviate from the inflation target. This may violate the central bank’s credibility, an essential feature in order to secure efficient monetary policy in the long run. Rule-based Monetary Policy can ensure credibility by limiting the risk of the time inconsistency problem. 25 Y* is defined as production during normal capacity utilization.
29
Norges Bank minimizes their loss function subject to the aggregated demand and the
aggregated supply in the economy.
Aggregate demand, the IS-curve:
𝑌 = 𝑌∗ − α! 𝑖 − π! − 𝑟∗ + α! 𝑒 − 𝑒∗ + 𝑣
Production is affected by the deviation from the long-run interest rate, r*, as explained in the
traditional interest rate channel. The real interest rate is here represented by the Fischer
identity, 𝑟 = 𝑖 − π!, thus monetary policy affects output directly through i. Further, output is
affected by the expected inflation, 𝜋!, explained in the expectation channel, and the
exchange rate deviation from the long-run equilibrium rate, e*, as in the net-export channel.
In addition there may occur exogenous demand shocks, v.
Aggregate Supply, the Phillips Curve:
π = π! + γ 𝑌 − 𝑌∗ + β 𝑒 − 𝑒∗ + 𝑢
The Phillips Curve illustrates the short-run trade-off between output and inflation. Inflation
is affected through the expectation channel. Norges Bank has proven to be credible, thus the
market expect future inflation to equal the central bank inflation target. The activity in the
economy affects inflation through the demand channel, and a weaker currency affects
inflation through the exchange rate channel. Thus, inflation is only affected indirectly by
changes in the key policy rate. Additionally exogenous inflation shocks, u, may occur.
The real exchange rate is endogenous in the model, and modelled as uncovered interest rate
parity: 𝑒 = 𝑒! 𝑟 − 𝑟! + 𝑧. The real exchange rate is influenced by the difference between
the Norwegian and foreign real interest rates, rf. In addition there may occur exogenous risk
premium shocks, z.
By minimizing the loss function, subject to aggregated demand and aggregated supply, the
central bank obtains the monetary policy-curve, the MP-curve, for Norway:
π− π∗ =λ(α! + α!)
γ(α! + α!)+ β𝑦 − 𝑦∗
The MP-curve determines the optimal monetary policy. It highlights the trade-off between
output and inflation when determining the real interest rate. Accordingly, an optimal

30
Figure 3.1 - Optimal response to a Negative Demand Shock under flexible inflation targeting (Røisland & Sveen, 2005)
monetary policy is achieved if there is zero deviations from the inflation target and the
natural level of production, or if there is a negative relationship between the two gaps. If the
output gap and the inflation gap have different sizes, there is a trade-off between price
stability and business cycle stabilization (Røisland & Sveen, 2005).
Reduced petroleum activities can be modelled as a negative demand shock towards the
Norwegian economy, Δv <0. Thus the IS-curve shifts down to IS1 and the PC -curve up to
PC1, resulting in a negative gap in output and inflation. Inflation and output is now on π1 and
Y1 respectively. As evident from Figure 3.1, the optimal response for Norges Bank is to
lower the key policy rate so that the real interest rate is r1 and reduce the output gap while
allowing for a positive inflation gap in order to stay on the MP-curve. A petroleum prices
shock driven by reduced global demand will reinforce such a demand shock as a negative
trade shock on the mainland economy.
r2
r0

31
This policy is supported also if a reduced petroleum activity is modelled as a negative
inflation shock, originating from excess capacity of labour, Δu<0, modelled in Figure 3.2.
This results in reduced pressure on inflation in the economy. Thus, the PC-curve shifts
down, leaving output at Y*, and inflation at π1. The optimal policy response is to reduce the
inflation gap by lowering the interest rate. This will cause a small negative output gap.
The fall in petroleum prices can lead to foreign investors experiences falling rate of return on
Norwegian bonds, thus requiring increased risk premiums on the NOK, Δz>0, depreciating
NOK. This shift is favourable in the case of a Norwegian re-entry process, and should not be
counteracted by monetary policy.
Figure 3.2 - Optimal response to a negative inflation shock under flexible inflation targeting (Røisland & Sveen, 2005)
32
3.1.2 A robust monetary policy A strict conduction of monetary policy in accordance with a flexible inflation-targeting
regime, is likely to impose distortions in other parts in the economy, e.g. through the credit
channel. Financial stability may affect the stability in output, unemployment and inflation.
The criterion for robustness requires Norges Bank to strive to achieve financial stability
rather than sudden changes in the economy when determining the key policy rate
(Nicolaisen, 2011).
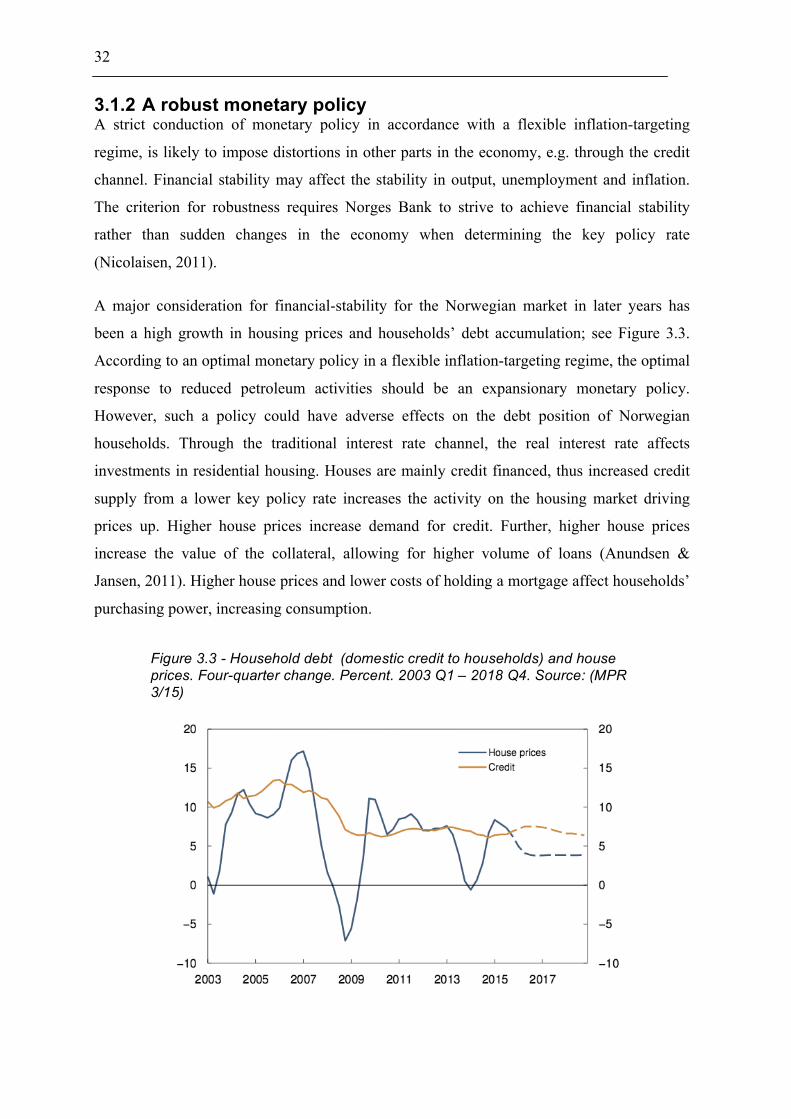
A major consideration for financial-stability for the Norwegian market in later years has
been a high growth in housing prices and households’ debt accumulation; see Figure 3.3.
According to an optimal monetary policy in a flexible inflation-targeting regime, the optimal
response to reduced petroleum activities should be an expansionary monetary policy.
However, such a policy could have adverse effects on the debt position of Norwegian
households. Through the traditional interest rate channel, the real interest rate affects
investments in residential housing. Houses are mainly credit financed, thus increased credit
supply from a lower key policy rate increases the activity on the housing market driving
prices up. Higher house prices increase demand for credit. Further, higher house prices
increase the value of the collateral, allowing for higher volume of loans (Anundsen &
Jansen, 2011). Higher house prices and lower costs of holding a mortgage affect households’
purchasing power, increasing consumption.
Figure 3.3 - Household debt (domestic credit to households) and house prices. Four-quarter change. Percent. 2003 Q1 – 2018 Q4. Source: (MPR 3/15)
33
Monetary policy alone should not deal with financial stability such as debt accumulation and
increasing house prices. According to critics of the robustness-criterion, other policy areas,
like macroprudential policy26, should address the financial stability considerations alone, so
monetary policy can consider inflation and output alone (Andreassen, 2015).
The financial stability criterion has proven difficult for the central bank to communicate.
This has been evident in Norway lately. In December 2014 the market expected the key
policy rate to stay unchanged due to increasing house prices and increasing debt
accumulation in Norwegian households. The market was therefore taken by surprise when
Norges Bank lowered the interest rate (MPR 4/14). The adjustment was founded on falling
petroleum prices and lower economic outlook. Due to this concern for petroleum prices, the
market was again taken by surprise in March 2015 when the interest rate was left unchanged
(MPR 1/15, 2015). The main concern for this decision was again the growth in house prices.
The example illustrates that even though the Norwegian central bank is known to be
trustworthy and transparent through extensive forward guidance efforts, the third criterion is
not fully internalized by the market.
3.1.3 Expectation management Despite the challenging communication of the robustness criterion, Norges Bank has
obtained credibility. A credible central bank will be able to conduct an efficient monetary
policy by minimizing the lags in the response of inflation expectations to monetary policy
(Barro & Gordon, 1983). “For not only do expectations about policy matter, but […], very
little else matters” (Woodford, 2005). Expectation about the future economic outlook affects
real sizes in the economy through the expectation channel. Managing expectations could be
an additional tool in a flexible inflation-targeting regime to enforce economic stability.
Since the Financial Crisis of 2008/09, real interest rates have been remarkably low all over
the world. Norway is no exception (MPR 3/15). The key policy rate has a (zero) lower
bound, reducing the flexibility of future monetary policy by putting a constraint on the key
policy rate27. As the key policy rate approaches its lower bound, the use of expectation
management becomes increasingly important during re-entry in order to enforce
26 Macroprudential policy is the credit standards and capital requirements that banks are subject to. Each bank should hold capital in proportion to its risk exposure, to dampen the build-up of systemic risk and ensure that the banking system as a whole is resilient to shocks (Olsen, 2013). 27 One expected the lower bound of the nominal interest rate to be zero, however, in resent years, some central banks, e.g. Denmark, Switzerland, challenges this lower bound by holding a negative key policy rate.
34
expansionary impulses. Norges Banks already applies expectation management, like
publishing the expected future interest rate path, to improve monetary policy flexibility.
3.2 Fiscal Policy While monetary policy serves as the first line of defence from business cycle fluctuations in
Norway, the main purpose of the fiscal policy is to secure an efficient distribution of
government finances in order to facilitate economic growth, market efficiency, income
distribution and supply of welfare goods(St.melding nr.29 (2000-2001)). Norway, as the rest
of Scandinavia, has an extensive welfare state with a widespread offer in public services and
redistribution of income. In addition, fiscal policy has important long-run considerations.
This will be important in the preceding discussion in Chapter 6. Fiscal policy has four policy
tools: public consumption, CG, public real investments, IG, tax schemes, T, and public
transfers, TR. Automatic stabilizers are included in the design of the policy framework with
properties to automatic enact countercyclical. Thus, the use of expansionary or contractive
discretionary policy to stabilize short-run fluctuations in the real economy can be limited.
The national income identity illustrates how fiscal policy affects aggregated demand:
𝑌 = 𝐶 + 𝐼 + 𝐺 − 𝑁𝑋
Public sector expenditures28, G=CG+IG, directly affect output, and indirectly affect private
consumption, C, investments, I, and net export, NX29. Initially G is primarily financed by net
taxes, T=taxes-transfers30. The intertemporal relationship between government expenditures
and government revenues is given from a stylized intertemporal public budget constraint for
a small, open economy (Barro, 1979, p. 942)31:
𝑇!
1+ 𝑖 ! = 𝐷! +𝐺!
1+ 𝑖 !
!
!!!
!
!!!
In the stylized model the government has an initial debt, D0. The government is able to
impose expansionary impulses on the economy during recessions by running budget deficits.
28 Including public liabilities. 29 E.g. purchasing power is directly affected through the income effect, and indirectly through labour supply (substitution effects). 30 Revenues may also arise like returns on public investments or dividends from governmental ownership. 31 t is time, and i is the nominal intrest rate

35
Accumulation of debt in one period must be compensated by wealth accumulation during
booms to balance the budget in the long run32. Thereby, an intertemporal perspective is
included in the fiscal policy consideration.
The Petroleum Sector causes special features of the Norwegian government’s intertemporal
budget constraint. Due to the GPFG, the initial Norwegian D0 is negative and budget deficits
can be run with wealth extraction rather than debt accumulation. This allows for fiscal policy
flexibility, but also eliminates the disciplining effect of debt accumulation on the budget
policy. Theory of political economy highlights the challenges of conducting an optimal fiscal
policy with intertemporal consideration within the short-run mandate of fiscal policy
authorities. Thus, the need of a “chalk-line”, a rule-based policy to give a clear-cut
measurement of the budget balance is needed (Olsen & Skjæveland, 2002). The rule-based
fiscal policy aims to limit the budget`s exposure to political cycles and political pressure for
increased spending of the petroleum wealth for short-run consideration. The Fiscal Rule
allows for a structural, non-oil budget deficit equivalent to the expected 4% real return on the
GPFG33 (St.melding nr.29 (2000-2001)). This limits the risk of the time inconsistency
problem that commonly results in wealth corrosion34 (Thøgersen, 2004). It is therefore
natural begin by assessing the long-run considerations for fiscal policy before considering
the short-term properties of fiscal policy for stabilization.
3.2.1 The long run considerations for Norwegian fiscal policy There are two dominating long-run fiscal policy-concerns of the Norwegian economy: i)
large governmental petroleum revenues and the intergenerational redistribution of the
petroleum wealth and ii) a changing demographic composition in the Norwegian population.
Olsen and Skjæveland (2002) illustrates how a finite horizon of petroleum activities results
in an intergenerational consideration in the distribution of the petroleum wealth, Figure 3.4
Panel A), while saving of petroleum revenues allow for a permanent higher public and
private consumption, Panel B).
32 It has been proven politically difficult to withdraw an expansive fiscal policy. Countries accumulate high levels of debt through recessions without balancing the budget through booms. This might bind resources and reduce fiscal policy flexibility. 33 The institutional properties for the budget process have also been crucial to the success of the stable Norwegian phasing of the petroleum revenues and limited use of discretionary fiscal policy, which have been applied from 1997. First the size of the total budget and the boundaries for each general budget area is decides. Thereafter the grants are allocated between different budget areas (Thøgersen, 2004). 34 For more details on the time-inconsistency problem and strategic actions of politicians, see i.e. (Alesina and Perotti, 1995).

36
The GPFG accumulates financial wealth from petroleum revenues, which can generate a
return over a longer period of time than the non-renewable petroleum resources (St.melding
nr.29 (2000-2001)). The fund is managed with the aim to generate strong returns and
safeguard wealth for future generations. Thus, the investment horizon is extremely long-run
and the management of the fund is relatively conservative35. These properties follow from
the Norwegian definition of petroleum wealth as the sum of the market value of remaining
petroleum reserves and the financial wealth of invested petroleum revenues (NOU 1988:21).
Defining the use of petroleum revenues as reallocation of wealth rather than income in
normal terms, implements a responsibility for an intergenerational redistribution of the
petroleum wealth. This reinforces the argument of a rule-based restriction on spending of the
petroleum wealth. Thus, fiscal policy is given an explicit long-run objective by the Fiscal
Rule:
“Petroleum revenues are gradually phased into the economy, approximately in pace with the
expected real return on the Government Petroleum Fund” (St.melding nr.29 (2000-2001), p.
8).
35 The current benchmark portfolio strategy consists of 60 % equity, 35 % fixed income and 5 % real estate. In addition, a small fraction of the fund is liberated for active management (NBIM, 2015).
Figure 3.4 - Extraction and consumption of the petroleum wealth (Olsen & Skjæveland, 2002, p.78)
37
The final design of the Fiscal Rule is based on a conservative strategy where phasing of
petroleum revenues depends on already obtained, secure wealth rather than an uncertain
future income from remaining reserves (Olsen & Skjæveland, 2002). The use of the financial
real return allows for increased spending of petroleum revenues over the fiscal budget until
the fund stops growing and the annual transfer from the GPFG to the economy stabilizes at a
higher permanent income in absolute terms. This implies that the public spending effect
following the gradual public phasing of petroleum through the fiscal budget can be
maintained permanently. This may imply that the Norwegian economy can avoid a wide-
scaled restructuring due to a limited, sustainable spending effect. The budget-impulse from
petroleum as a share of GDP will peak at some point in time, contracting the public spending
effect36. The timing of the peak depends on the spending of petroleum wealth, and will be
further elaborated in Chapter 6.
The aging population with an increasing number of seniors per worker is expected to result
in doubled pensions expenditures for the Norwegian government from 2001 to 2050 (NOU
2004:1). This will increase future demand for public services and impose a pressure on
future public finances. There is a consensus that the demographic changes will require a
future contraction in fiscal policy in order to mitigate an increasing pressure on public
services (Cappelen, Eika, & Prestmo, 2013). Even though the Fiscal Rule allows for a
permanent upward shift in public expenditures, it cannot fully compensate for required
austerity measures in the facing of an aging population. However, it may ease some of the
burden on future public finances and the inevitable contraction in fiscal policy (Olsen &
Skjæveland, 2002; NOU 2015:9).
The 4 % of the GPFG has results in a continuous impulse on the economy. However, there
are two uncertainties related to the size of the fund and thus current and future spending over
the fiscal budget: i) uncertainties related to the size of petroleum revenues, and ii)
uncertainties related to market fluctuations and the value of the GPFG. The first has resulted
in a distinction between current petroleum revenues from the use of petroleum wealth by
investing petroleum revenues in the GPFG (St.melding nr.29 (2000-2001)). This secures
stability in the petroleum impulse on the national budget, making it less exposed to current
petroleum activities. The latter uncertainty is challenging to mitigate. The fund is currently
36 This was evident in Chapter 1, Figure 1.4.
38
subjected to reduced value due to falling petroleum prices, and low international interest
rates. This will affect the fiscal flexibility given by the fund (van der Bremer et al., 2014).
Evident from these long run consideration, potential use of short-run fiscal policy during the
re-entry will need to consider the intergenerational redistribution and the future pressure on
public finances from a demographic shift, while considering the uncertainties related to the
future value of the GPFG.
3.2.2 Structural policy and smoothing of the restructuring process Due to the long-run anchor of fiscal policy and the first line of defence against business
cycle fluctuations from monetary policy, the role of fiscal policy for short-run stabilizing is
restricted. Yet, the Fiscal Rule allows for fiscal flexibility. This is given by the short-run
objective of the Fiscal Rule:
”Considerable emphasis must be placed on stabilising fluctuations in the economy with a
view to ensuring appropriate capacity utilisation and low unemployment” (St.melding nr.29
(2000-2001)).
Short run fiscal policy mainly includes automatic stabilizers and discretionary policy.
Automatic stabilizers are designed to securing a stable development in the economy and
preventing erratic changes in demand without the use of active policy intervention. The tax-
smoothing model, developed by Barro (1979), imposes the principle for automatic
stabilizers. Tax smoothing is achieved by allowing automatic stabilizers to work through
budget deficits, as described in relation to the general intertemporal budget constraint for the
government. Increased tax-rates are associated with a cost of distortion to the economy37. To
minimize the cost of distortion, taxes should be smoothed over time. This implies variations
in the tax-base over the business cycles should be limited. Similar reasoning is applied for
the operational design of the Fiscal Rule to phase petroleum revenues through the structural
non-oil budget deficit. Basing the Fiscal Rule on a structural rather than actual budget deficit
allows for the automatic stabilizers to work, balancing the budget during business cycle
fluctuations (Olsen & Skjæveland, 2002).
The use of discretionary policies to stabilize short run fluctuations can be done by changing
government expenditures or taxes. However, such measures can be challenging since it is
37 E.g. distortion in labour supply.

39
difficult to target only certain parts of the economy by use of discretionary fiscal policy. For
instance it can be challenging to ease taxes in the Internationally Exposed Sector, while
avoiding stimulating petroleum-related activities (NOU 2015:9). It has further been proven
politically difficult to withdraw fiscal policy impulse when a contraction in the economy
turns. The ability to withdraw impulses will be especially important considering large
economic uncertainties in the time ahead.
Even though the spending effect is assumed sustainable, declining petroleum activities is
likely to result in lower capacity utilization and increased unemployment. Declining
petroleum activities implies a structural shift towards a new Norwegian sectoral
composition. Some structural unemployment during the shift can be necessary in order to
facilitate a sustainable growth for the post-petroleum economy. Thus, automatic stabilizers
are important features to stabilize demand and maintain purchasing power. Use of
discretionary policy should be adapted to the characteristics of the restructuring and should
allow for some unemployment in order to facilitate a re-entry process.
One type of discretionary policy that may be beneficial during restructuring is structural
policy to stimulate new activities in the economy. In the re-entry process, such policy should
aim to facilitate a shift towards post-petroleum activities and improve the competitiveness of
the Internationally Exposed Sector. This may include allocation of means to education,
R&D, infrastructure, tax-reliefs for incentivising business activities in Norway and loosen
business regulations (Mork, 2013). Such policies are challenging to predict due to the strong
connection to political affiliation, and will therefore not be widely elaborated in this thesis.
3.3 Income policy There can be distinguished between three types of unemployment. Cyclical unemployment
occurs during recessions. To reduce cyclical unemployment the government may use fiscal
or monetary policy to stimulate aggregate demand. Frictional unemployment is hard to
restrain by the use of policy means, yet it may be limited by initiatives to ensure flow of
information in the labour market and a well-functioning welfare system. In a restructuring
process, there will mainly be the structural unemployment that is likely to increase. Such
unemployment has proven difficult to mitigate structural unemployment with the use of
policy means. However, monetary policy and the income policy, the third component in the
Norwegian policy-mix, are both able to improve the flexibility in the labour market (Holden,

40
2012). Income policy thus reduces some of the pressure on monetary policy (St.melding
nr.29 (2000-2001)).
The purpose of the income policy is to ensure sensible price and income growth according to
the current economic situation. When conducting income policy the government aim to
create a common understanding of the short-run and long-run economic development
between the social partners. This may improve the basis for a continuous low unemployment
rate. Thus, the income policy with centralized wage negotiations is able to facilitate flexible
wages and competitiveness for the Internationally Exposed Sector in a re-entry process
(NOU 2013:13).
Cost-competitiveness through the income policy follows from the Aukrust-model, the
Norwegian Frontfagsmodellen, here referred to as the exposed industry model38. The aim is
to secure a manageable wage growth ensuring cost-competitiveness for the Internationally
Exposed Sector. In practice the exposed industry model implies that central employers and
labour unions within the Internationally Exposed Sector negotiate first and define a norm for
the wage settlements in other sectors39. The exposed industry model has proven efficient to
improve wage flexibility, and the nominal wage growth is expected to be in accordance with
competitiveness for Norwegian industries. There is a general consensus that the institutional
equilibrium given by the model will be an important contribution in order to ease a
Norwegian re-entry process (NOU 2013:13, 2013).
It can be argued that the wage settlements following the exposed industry model have been
influenced by petroleum. This is reinforced by the potential petroleum dependency in the
Internationally Exposed Sector. Thus, a high petroleum prices and profitability in the
Petroleum Sector is likely to have resulted in a higher nominal wage growth than if non-
petroleum-related Internationally Exposed Sector was dominant in the negotiations.
However, it is assumed that the exposed industry model have been able to limit
unsustainable spending effects in Norwegian real wages. This has been done by ensuring an
equalized income distribution of the wage effects from petroleum and makes sure a
maintainable level in nominal wages towards the post-petroleum economy. Hence, it will
contribute to the initial Norwegian assumption of a sustainable spending effect. In the
38 The model is developed by (Aukrust, Holte, & Stoltz, 1966). 39 The employer and labour unions are the Confederations of Norwegian Enterprises (NHO) and The Norwegian Confederation of Trade Unions (LO).

41
forthcoming restructuring the non-petroleum-related Internationally Exposed Sector cost-
competitiveness needs to increase. Since this sector sets the norm for the Norwegian wage
growth, it is reasonable to assume that the nominal wage growth will be moderate during the
restructuring process. This is evident in the response to the negative petroleum-price shock,
where the expected nominal wage growth for 2015 is 2,75 %, implying a real wage growth
of approximately 0 % (MPR 3/15).
By ensuring equalized income distribution in the Norwegian economy, the exposed industry
model has resulted in relatively cheap high-skilled labour. This may have created a
Norwegian competitive advantage for industries intensive in high-skilled labour. At the same
time, this implies relatively high labour costs related to low-skilled labour intensive
production processes. Since the wage level in low-skilled occupations is not particularly
lower than in other occupations, there are few incentives to increase productivity to improve
the income. This may restrict the potential for productivity growth40. Thus, even though the
exposed industry model is important to ensure cost-competitiveness to be able to sustain the
spending effect in real wages and will be important to facilitate a restructuring process, the
properties of the model might also dampen productivity growth.
40 This may also dampen incentives for attainment of extremely high skills since the wage in activities requiring such skills is restricted by the coordinated wages.

42
Chapter 4 - Two views on the Norwegian re-entry 4 Two views on the Norwegian re-entry process There are several predictions regarding how a downsizing of the Petroleum Sector will affect
the Norwegian economy. Consequently, it also exists numerous different recommendations
related to the optimal policy-mix in a re-entry process. The following chapter presents two
different views on the future of the Norwegian petroleum economy41. The main distinction
between the two is that one believes the sectoral adjustment process to be smooth due to
flexibly in the Norwegian market. The other predicts that the size of the petroleum-impulse
on the domestic economy is more significant, and that the Norwegian economy is subjected
to rigidity.
Cappelen et al. (2013) represent the first, relatively optimistic, view. They recognize the
challenges of the restructuring process, but conclude with substantial buffers in the
Norwegian economy making the consequences of restructuring acceptable. Mork (2013), and
Bjørnland and Thorsrud (2014a) represent a far more pessimistic view on the restructuring
process. Mork (2013) doubts the Norwegian prospects of a smooth re-entry process due to
signs of substantial petroleum dependency in the Norwegian economy. He argues that
Norwegian petroleum suppliers are subjected to a local monopoly, and that a petroleum-
related mainland economy has enlarged the public tax-base. Bjørnland and Thorsrud (2014a)
have analysed the effect on the Norwegian economy of a petroleum price shock, and
supports Mork’s view.
4.1 The optimistic view
4.1.1 The baseline scenario Cappelen et al. (2013) suggests that the Petroleum Sector as a share of GDP gradually will
decline due to increasing marginal costs of extraction in new and existing petroleum fields.
Due to the flexibility in the Norwegian economy and a gradual phasing of petroleum
41 There also exists a third view, primarily represented by Jarand Rystad and Petter Osmundsen. Their argument rests on the notion of improved future profitability within the Petroleum Sector, driven by the current petroleum price shock. Combined with expectations of an increased petroleum price, they argue that the Petroleum Sector will have high future profitability. See (Osmundsen, 2015) and (Rystad Energy, 2014).

43
revenues by use of the Fiscal Rule, the downsizing of the Petroleum Sector does not
necessarily induce a painful restructuring process for the Norwegian economy. Cappelen et
al. (2013) estimates the development in the Norwegian economy towards 204042. They
identify three categories of demand from the Petroleum Sector: investments, input factors
and direct employment. Investments are highly volatile and depend on the current
profitability in the sector. Since the Petroleum Sector first extracts easy assessable resources,
while postponing difficult fields, the use of input factors and direct employment in the sector
is increasing with production.
The baseline scenario assumes a fixed petroleum price of 94 2015-USD per barrel from 2015
and onwards. According to the estimation, petroleum extraction in fixed 2010-NOK will fall
by 46,5 % from 2013 to 204043 (Cappelen el al. 2013). Thus, demand from the sector is
expected to drop gradually by 0,4 percentage point per year from 2014, to about the half of
the peaking 2015- level in 2040, evident in Figure 4.1.
42 The estimation is conducted using MODAG, a Norwegian macroeconomic model for annual data developed by SSB (Cappelen et al., 2013). 43 The estimation is based on data from the petroleum directorate (Oljedirektoratet).
Figure 4.1 - Demand from the petroleum sector, billions 2010-NOK, from (Cappelen et al, 2013, p. 12)

44
According to Cappelen et al. (2013), an increasing GPFG in absolute terms and a structural
non-oil budget deficit in line with recent practice, fiscal policy will be sufficiently flexible to
ensure positive demand impulses in the future. Thus, they predict that the Norwegian
economy can overcome 25 years of negative demand impulses from the Petroleum Sector
without facing large economic imbalances. In other words, the intermediate phase, as
defined in this thesis, will be sufficient to smooth restructuring. Further, the institutional
properties of the Norwegian economy will provide a robust public balance. Due to the steady
reduction of petroleum as share of GDP and the shifting demographic composition in the
economy, the unemployment rate is expected to be restricted to 3-4 %. Consequently,
Cappelen et al. (2013) argue that reduction of petroleum activities will not result in large
restructuring processes within the Norwegian economy.
Two petroleum price shock scenarios Cappelen et al. (2013) also includes scenarios for the consequences of a demand driven and a
supply driven petroleum price shock. Both shocks are modelled as a drop in the petroleum
price in the beginning of 2015 to 40 USD per barrel44. Due to overshooting in the market, the
price is expected to adjust upwards to 60 2015-USD per barrel from 2016. This is assumed
to approach the limit for profitability remaining reserves (Cappelen el al., 2013). Due to
falling profitability in the sector, petroleum activities are expected to drop, reducing the
petroleum impulse to the mainland economy. A price shock will lead to a more widespread
restructuring process than the baseline scenario, however the outcome depends on the nature
of the shock.
A lower petroleum prices following decreased global demand is regarded as the worst-case
scenario for the Norwegian economy. Such a shock will affect the economy through several
channels. A fall in the petroleum prices will directly result in decreasing GDP from reduced
petroleum revenues. Further, extraction of marginal fields will be reduced due to lower
profitability. Thus, exploration of new fields will be constrained. In turn, this will result in a
drop in petroleum investments. Lower petroleum investments, decreasing the Petroleum
Sectors demand for input factors, reduce the petroleum impulse on the mainland economy.
Demand for Norwegian exported non-petroleum goods will decline following reduced global
demand. This may complicates the restructuring process.
44 The researchers express that despite their surprisingly precise timing of the shock, such a shock was not expected as realistic when the report was written (ref. conversation with Cappelen, 14.10.2015).

45
A supply driven petroleum price shock will have similar effects as a demand driven shock on
the level of petroleum activities. However, lower commodity prices stimulate demand in
petroleum importing countries. According to OECD a 1 % decrease in petroleum prices is
expected to increase OECD GDP by 0,025 % (OECD, 2011). Thus, increase competitiveness
of the Norwegian export industry due to depreciated NOK combined with Norwegian trading
partners experiencing increased GDP from lower commodity prices, increases export of
Norwegian non-petroleum goods and services. Compared to a demand driven petroleum-
price shock, Norwegian GDP is expected to fall less (Cappelen el al. 2013).
4.1.2 Key arguments for the authors’ conclusion Cappelen et al. (2013) assume increased profitability for petroleum related mainland
activities due to accelerating petroleum prices the last decade45. This has improved mainland
growth and the Norwegian standard of living. However, increased petroleum prices have
also influenced the sectoral structure in the economy. Yet, Cappelen et al. (2013) concludes
that the re-entry process will be relatively smooth, even in the case of petroleum price
shocks. Their conclusion depends on several characteristics of on the Norwegian economy,
presented below.
A gradual phasing of petroleum revenues A sustainable phasing of petroleum revenues combined with a steady decline in demand
from the Petroleum Sector will gradually reduce the petroleum dependency in the Norwegian
economy, ensuring a stable and balanced restructuring process (Cappelen el al. 2013).
A flexible exchange rate In the case of a petroleum price shock, Norges Bank is expected to conduct expansionary
monetary policy by lowering the key policy rate (Cappelen el al. 2013). A lower interest rate
causes NOK to depreciate, improving the cost-competitiveness of the Norwegian
Internationally Exposed Sector. Improved cost-competitiveness secures Norwegian mainland
activities and employment. A price shock will positively influence the process of a
Norwegian sectoral adjustment from petroleum activities to non-petroleum related activities.
Thus, even in the case of a demand driven petroleum price shock, the export volume of the
Norwegian economy is estimated to exceed the baseline scenario after 10 years (Cappelen el
al. 2013).
45 Mainly due to the boom in demand from Asia, primarily the expansion in the Chinese demand for petroleum.

46
Restricted real wages and income policy Exchange rate depreciation results in higher inflation through the exchange rate channel.
Further, reduced pressure on the labour market from decreased activity, coordinated income
policy and increased inflation enables restriction, and perhaps contraction, of the real wage
growth46. Norway has revealed evidence of real wage flexibility. Moderate real wage growth
will improve cost-competitiveness. Moderate wage growth will also reduce the growth in
unemployment. Lower income and higher unemployment in Norway relative to other
countries, results in less immigration, which reduces labour supply. Thus, the level of
employment is expected to decrease more than the level of unemployment is expected to
increase. Thus, unemployment is predicted to increase by less than 1 percentage point from
the reference path the first 13 years, and peak in 2020 in the case of a demand driven
petroleum price shock (Cappelen el al. 2013).
Companies ability to adapt The economy’s ability to respond to the re-entry process depends on each company’s ability
to adapt its production process to serve new markets. When downsizing the Norwegian
Petroleum Sector, a substantial share of direct petroleum suppliers will need to reduce
activity and eventually phase out production. However, already in 2008 export of petroleum
services accounted for 40 % of the Norwegian Petroleum Sector’s turnover (Econ Pöyry,
2010). Cappelen et al. (2013) argues that companies with a specialized high-skilled labour
stock should be able to replace a declining demand from the Norwegian continental shelf by
export petroleum-related goods and services to other petroleum exporting areas.
4.1.3 Optimal policy-mix Given the baseline scenario, Cappelen et al. (2013) assume a budget policy based on the
Fiscal Rule where the first decade will be in line with the recent years practice of a structural
budget deficit of around 3 %. The exposed industry model in Norway restricts real wage
development in all sectors, including the public sector, improving fiscal policy flexibility
from lower public expenditures. This will help staying at the 3 %-path in the years ahead.
Over time, the fiscal impulse will move towards the 4 %-path, and in 2040 the structural
non-oil budget deficit is expected to correspond to 4 % of GPFG. Monetary policy is used as
the main tool for cyclical stabilization, and expansionary discretionary fiscal policy should
46 The effect is sustained by a demand driven shock.
47
be restricted because an aging population requires fiscal contraction in the end of the period.
However, according to Cappelen et al. (2013) strong automatic stabilizers will contribute to
limit the restructuring costs following a decline in petroleum activities. A demographic shift
in combination with GPFG’s declining share of GDP will put a pressure on public finances
(Cappelen el al. 2013).
An expansion in the market value of the GPFG the later years has increased the fiscal policy
flexibility within the guidelines of the Fiscal Rule, resulting in budget deficits below 4 % of
the GPFG. A demand driven petroleum price shock is expected to reduce the value of GPFG
resulting in a non-oil budget deficit above the 4 %-path for a period of time. In both
petroleum price shock scenarios, a lower tax-base reduces fiscal policy flexibility. To ensure
that the Fiscal Rule is sustained, fiscal tightening is needed earlier than in the baseline
scenario. However, due to countercyclical considerations after the petroleum-price shock, no
use for discretionary fiscal tightening is assumed to be implemented until 2017.
4.2 The pessimistic view
4.2.1 The assumptions
Mork (2013) bases his arguments on a theoretical model describing production and
investments in the Petroleum Sector. An essential assumption in the model is increasing
marginal costs of extraction. Increased costs of extraction combined with an increasing
Norwegian cost level, mainly due to high labour costs, will result in marginal costs
exceeding marginal revenues at some point in time. Until this point, investments will
increase at the same rate as the growth in extraction-costs. After this point petroleum
investments will drop drastically. Investments related to maintenance-costs will still be
present due to the capital-intensive nature of the Petroleum Sector (Mork, 2013). The
development is illustrated in Figure 4.2.

48
The timing of the drop in investments is difficult to predict since petroleum price shocks
may accelerate the fall in investments and new technology might reduce costs of extraction.
Nevertheless, the main conclusion related to the Norwegian economy facing a substantial,
sharp drop in petroleum investments remains. This differs from the baseline scenario of
Cappelen et al. (2013), which predicts a gradual decline in investments over time.
4.2.2 The petroleum price shock scenarios Bjørnland and Thorsrud (2014a) mainly focus on a petroleum price shock as the cause for
diminishing petroleum activities. Their results are based on an empirical Dutch Disease
analysis47, in which they analyse the effects of a supply driven petroleum-price shock,
induced as a commodity price shock, and a demand driven shock, originating from a drop in
global activity48. In the analysis a temporary drop in petroleum prices of 25 % is assumed.
This would imply a reduction in global activity of 1,5-2 % with a time span of 1,5-2 years on
average49 (Bjørnland & Thorsrud, 2014a).
47 Based on a Bayesian Dynamic Factor model. 48 The model also includes potential shocks to the petroleum activity, as a technology shock or a windfall discovery, to cover the initial resource movement effect and a shock in the domestic non-petroleum activities. These shocks however, in contrast to the other two, are unobservable (Bjørnland & Thorsrud, 2014). 49 The effects are uncertain and reported in median values from average response to identified shocks over the last 18 years.
Figure 4.2 - Stylized model of petroleum production and investments. Based on: Mork (2013, p.15)

49
Bjørnland and Thorsrud (2014) argues that variation in global activity explain about 55 % of
the variation in overall activity in Norway. In comparison, the corresponding effect in
Australia is 25 %. This reflects the degree of openness in the Norwegian economy, and thus
how vulnerable the economy is to fluctuations in global demand. A demand driven
petroleum price shock is predicted to reduce mainland employment by 1,5-2 % and mainland
GDP by 2-2,5 % after 2 years. Further, it is predicted to result in a real exchange
depreciation of 2,5-3 % on impact. A supply driven petroleum price shock will have initial
positive effects on investments and aggregated demand, but still cause restructuring and
sectoral adjustment. In the case of a supply driven price shock, mainland employment is
expected to drop by 0,9 % after 2-3 years. Further, mainland GDP is expected to drop with
0,5 % after 2 years, and the real exchange rate is expected to drop by 2,5 % on impact
(Bjørnland & Thorsrud, 2014).
4.2.3 Key arguments for the authors’ conclusion
Petroleum dependency According to Bjørnland and Thorsrud (2014b), the petroleum impulse explains 40 % of the
variation in mainland GDP, this is more than identified by others. Increasing Petroleum
investments, which are rising due to diminishing return, has resulted in increased demand to
the mainland economy. This has caused a real exchange rate appreciation with strong
impulses on the Norwegian economy and increasing mainland growth, since many activities
have shifted towards the profitable Petroleum Sector (Mork, 2013).
A local monopoly Mork’s assessment of the Norwegian mainland economy’s exposure to activities in the
Petroleum Sector is based on an assumed existence of a local monopoly. This would imply
an extraordinary profitability for petroleum related mainland activities. Mork (2013) argues
that mainland petroleum suppliers benefit from limiting competition from the global market
due to the geographical closeness to the Norwegian continental shelf and specific knowledge
about the Norwegian offshore market. When activities on the Norwegian continental shelf
decline, Norwegian petroleum suppliers will face international competition and no longer
have a natural competitive advantage. Therefor Mork (2013) questions Norwegian
petroleum-suppliers’ ability to shift sales towards an international market, as suggested by
Cappelen et al. (2013). This results in an anticipated tougher restructuring process than
predicted by Cappelen et al. (2013).

50
A product price driven wage development Mork (2013) argues that the Norwegian real wage growth is not founded on increased
productivity. The product real wages, defined as wage deflated by the product price, will
increase following high product prices for petroleum supply. While wage negotiations are
based on product real wages, workers base their consumption decisions on consumer real
wages. High petroleum prices and a local monopoly have caused product prices to increase
faster than the consumer price, resulting in consumer wages to increase faster than
productivity. When the petroleum impulse declines, Norwegian wages must again be
justified by productivity. Thus, Mork (2013) claims that wages needs to adjust downward to
a similar level as in the other Nordic countries. Further, he argues that even the Nordic wage
level will be relatively high in a European context. Hence, immigration is unlikely to crowd
out by lower real wages as suggested by Cappelen et al. (2013). Mork (2013) argues that
Norwegian workers demand lucrative employee-benefits. Such costly benefits must be lower
in order to improve the Norwegian cost-competitiveness (Mork, 2013). High real wages and
expensive employee-benefits may therefore weaken the position of Norwegian labour on the
Norwegian labour market when facing competition from immigrants.
A pro-cyclical public sector Since Mork (2013) claims that the Norwegian economy has become increasingly petroleum
dependent, he argues that a private spending effect has occurred. This spending effect
originates from petroleum driven wage growth in the economy and increased profitability for
petroleum-suppliers due to high demand for petroleum related goods and services. This will
provide the public sector with an enlarged tax base, implying that the government does not
capture the entire petroleum rent. Thereby, the re-entry process will result in a lower public
tax-base than anticipated by Cappelen et al. (2013). Mork therefore suggests that
contractionary impulses in the fiscal policy might need to be implemented at an early point
in time than suggested by Cappelen et al. (2013) to ensure non-oil structural budget deficits
in accordance with the Fiscal Rule. He mainly suggests reducing public expenditures.

51
Bjørnland and Thorsrud (2015a) argue that the fiscal policy has been more, not less, pro-
cyclical after the adaption of the rule50. Their analysis estimates that a positive supply driven
petroleum price shock explains 20 % of fluctuations in employment and 50 % of value added
fluctuations in the public sector (Bjørnland & Thorsrud, 2014a). The main cause is suggested
to be an expansion in the market value of GPFG allowing for more use of petroleum
revenues over the fiscal budget than expected when the Fiscal Rule was implementation in
2001. This is illustrated in Figure 4.3. They show that the public sector has grown at the
expense of the private sector for a given positive petroleum price shock (Bjørnland &
Thorsrud, 2015a).
4.2.4 Optimal Policy mix
Mork (2015) questions the flexibility of the Norwegian labour market. He argues that a
substantially lower real wage growth is necessary to improve the Norwegian cost-
competitiveness. This will also reduce public spending on wages, which is necessary due to
the reduced tax-base from declining petroleum related activities. Mork (2013) highlight
income policy and monetary policy as useful contributions to moderate Norwegian real wage
growth. Mork (2015) argues that monetary policy may enforce structural adjustment through
50 This holds in the presence of both types of price shocks, however the result of a demand driven shock is more nuanced than that of the commodity price shock.
Figure 4.3 - Petroleum prices and changes in the conduction of the Fiscal Rule, actual 2013 - estimates 2002 (Bjørnland & Thorsrud, 2015, p. 26)

52
a lower interest rate improving Norwegian cost-competitiveness. Yet, he claims that it might
not be sufficient, and predict that nominal wage cuts will be necessary. This could cause
conflicts in the labour market, resulting in increased pressure on the institutional equilibrium
in Norwegian wage negotiation model. If this pressure is substantial, the important
contribution from income policy for smoothing the restructuring process may be lost (Mork,
2013).
Further, a depreciation of the NOK increases the inflationary pressure (Mork, 2013). This
might result in the need for an increased key policy rate, resulting in reducing cost-
competitiveness and a need for reduced nominal wages. Thus, an inflationary pressure may
reinforce the recession (Mork, 2013).
Mork highlights the need for structural fiscal policies and a reform of the welfare state in the
re-entry process to stimulate growth in the Internationally Exposed Sector and restrict
government expenditures. He points to the challenges of structural policy from the
incapacity of the government in targeting new, profitable industries, or “picking winners”.
Rather, he believes that private actors must drive development of future dominating
industries, while the government enables such activities by reforming the tax scheme and
limiting of business regulations (Mork, 2015).
Bjørnland and Thorsrud (2014a) predict dampened negative effects of declining petroleum
prices if current super cycle has temporarily increased domestic demand and spending. The
increased value of GPFG has allowed expansionary impulses into the Norwegian economy.
Declining inflow to the GPFG will imply a need for lower future public spending and a
reform of the welfare system is needed in order to restrict public expenditures to a
sustainable level for the post-petroleum economy (Bjørnland & Thorsrud, 2015b).

53
Chapter 5 – Comparative sector specific employment analyses 5 Comparative sector specific employment analyses Dutch Disease theory gives clear predictions of the expected sectoral labour adjustment to
have occurred in Norway following a booming Petroleum Sector. Sectoral adjustments are
natural consequences of a booming Petroleum Sector, necessary to extract the petroleum
wealth. Nevertheless, readjustments of the sectoral labour composition are expected to occur
when the profitability in the Petroleum Sector decreases and there is expected costs related to
this re-entry process.
Existing literature describing Norwegian Dutch Disease effects has estimated the changes in
the Norwegian sectoral composition of labour following petroleum, but seems to fail to
separate the petroleum driven sectoral labour adjustment from the natural sectoral
development. In this chapter, the actual Norwegian sectoral labour adjustment is compared
to the development in a counterfactual Norway. The counterfactual Norway is the
hypothetical development in Norway without petroleum from 1975 if following a
Scandinavian development51. Due to overreaching similarities in history, culture, standard of
living, political systems, social institutions, tax-levels etc., it is a good approximation to
assume that the Norwegian development in sectoral structure without petroleum resources
would have followed a trend similar to the average trend of Denmark and Sweden. Thus,
comparing the development in Norway to the counterfactual Norway could disentangle the
Norwegian Dutch Disease effects. Country specific traits in Denmark and Sweden are
adjusted for by applying an average of the two countries52.
The analysis will consist of four parts. The first is an inter-sectoral analysis of traditional
Dutch Disease effects from 1975 up until 2014. This is expected to reveal limited evidence
of deindustrialization of the Internationally Exposed Sector, because few labour factors are
employed in the Petroleum Sector. Due to a preference for a strong welfare state, it is
reasonable to expect that the public spending effect from government petroleum revenues
51 Norway is not included in the average Scandinavia in order to ensure an economy free from petroleum impulses. 52 This applies for many observations within the population. Here, only two countries are included in the population. However, the result is expected to apply.
54
mainly have manifested in Non-Market Directed Services. Yet, tax-reliefs permitted by the
Fiscal Rule and a real appreciation is expected to have increased Market Directed Services.
Demand from the Norwegian continental shelf towards the mainland economy has increased
sharply since 2002 (Prestmo et al. 2015). This is likely to originate from a steady rise in
petroleum prices around the millennium, which may have reinforced the Dutch Disease
effects. Thus, a short-run analysis including the intra-sectoral adjustment of labour for the
period 2001 to 2014 is conducted. This analysis provides an estimate of the share of
petroleum-related employment in the Norwegian economy. The difference between the
counterfactual Norway and the actual Norwegian development, less the petroleum-related
employment stock provides an estimate of the unobservable Dutch Disease effects.
The unobservable Dutch Disease effects following the spending effect are expected to be
sustainable over time by the properties of the Fiscal Rule, while the inter-sectoral resource
movement effect is assumed to be negligible. Therefore, these effects do not need to be
reversed, and the re-entry does not imply an adjustment to the counterfactual sectoral
composition and required inter-sectoral adjustment of labour is not expected to be the same
as the required inter-sectoral readjustment when the activity in the Petroleum Sector decline.
As the budget impulse from the GPFG as a share of GDP will decline after the intermediate
phase, the Norwegian sectoral composition should to adjust to a new sustainable balanced
sectoral labour composition. The Scandinavian sectoral composition is used as a benchmark
for a sustainable development for the Norwegian economy after a downsizing of the
Petroleum Sector. To obtain additional understanding of the Norwegian re-entry process, a
static analysis of the required restructuring of employment in 2014 is presented, followed by
three scenarios for sectoral readjustment of labour up until 2020.
5.1 Data and choice of method To analyse the petroleum driven Dutch Disease effects in the Norwegian economy register-
based employment data from Norway, Sweden and Denmark are applied53. All data are
classified at industry level according to the European industry standard NACE Rev. 2, and
are comparable across countries and time. See more about NACE and the data in Appendix
A and B.
53 Due to availability of Norwegian data, employment data from the national accounting is applied prior to 2001. The data is linked to fit the level of the register-based series. Register-based data is chosen as the mean for analysis due to the detailed level of industry categorization. Data is retrieved from Statistics Norway, Statistics Sweden and Statistics Denmark. The data includes total employment aged 15 to 64 years.

55
Empirical Dutch Disease analysis often includes variables such as labour productivity, hours
worked, value-added, real wage and the real exchange rate in order to identify shift in the
sectoral labour structure, see e.g. (Bjørnland & Thorsrud, 2014a; Stehrer & Ward, Sectoral
Employment Effects of Economic Downturns, 2012). However, the Norwegian petroleum
driven sectoral labour adjustment is recognizable based on a comparison of the univariable
analysis of Norwegian and Scandinavian employment. Since a Norwegian non-petroleum
economy is assumed to have followed a Scandinavian development without petroleum, it
follows that all deviations in sectoral composition of labour must derive from petroleum.
Even though this is a strong assumption, the results are expected to give indications about
the effect of petroleum on the Norwegian economy and properties of the forthcoming re-
entry process.
In the comparative sector-specific employment analyses descriptive methods are applied to
disentangle the Dutch Disease effects in the Norwegian sectoral labour compositions. A
graphical presentation including annual average growth rate for each sector provides an
overview of the development in different sectors over time. The growth rate in each sector
provides a quantified mean of comparison adjusting for level inequalities. The combination
of trend development and graphical analysis is well suited to empirically assess the Dutch
Disease effects. Allowing for use of discretion related to deviation in the development from
the average annual growth rate enables a more dynamic discussion of the findings. Due to
the purpose of the analyses and nature of the data, including autocorrelation and possible
measurement errors from changing industry classifications, and the results from this method
is assumed to be the best suited54.
5.1.1 Sector classification
The NACE rev. 2 industries are classified into four sectors based on the tradability of the
output in an industry, and follows a traditional economic sector classification55.
1. Internationally Exposed Sector (NACE 1 – 5, 7-8 and 10 - 39)
2. The Petroleum Sector (NACE 6 and 9)
3. Marked Directed Services (NACE 41 to 82)
4. Non-Marked Directed Services (NACE 84 to 99)
54 Better suited than e.g. an econometric time-series analysis. 55 The classification similar to that of Grünfeld et al. (2013).

56
Theory defines petroleum as a tradable good and between the Internationally Exposed Sector
and the Petroleum Sector. The Internationally Exposed Sector here includes all tradable
goods including the primary industries56. From the classification, it is evident that the Non-
Tradable Sector is separated in two, the sector for Market Directed Services and the sector
for Non-Market Directed Services. The latter mainly consists of the public sector57. An
important characteristic of all Scandinavian countries is a large sector for Non-Market
Directed Services.
5.1.2 Sector classification with decomposition of petroleum-related activities
The high petroleum price has increased profitability in the Petroleum Sector. Improved
profitability has caused companies in the mainland economy to shift production towards
serving the Petroleum Sector, resulting in an intra-sectoral adjustment of labour. Following
the Dutch Disease model with a decomposition of the Internationally Exposed Sector, the
sector should be decomposed into petroleum-related and non-petroleum related activities
(Torvik, 2015). While this theory solely decompose the Internationally Exposed Sector, also
other parts of the economy has shifted activities towards petroleum, suggested among others
by Nordbø and Stensland (2015). Thus, in this analysis each sector is decomposed into
petroleum related activities and non-petroleum-related activities. By decomposing all
sectors, the intra-sectoral resource movement effect is recognized, providing a better
understanding of characteristics of the re-entry process.
Multiple contributions have aimed to determine the extent of petroleum-related activities
originating from increased demand from the Norwegian continental shelf; e.g. (Prestmo,
Strøm, & Midem, 2015; Finci & Wang, 2015; Blomgren, et al., 2015; Grünfeld et al., 2013).
Menon Business Economics has kindly provided new and revised data for this thesis on the
number of directly petroleum-related employees in Norway for the time-period of 2001-
56 All Scandinavian countries have a substantial share of export related to the primary industries; fish, agriculture or forestry is major export goods in Norway, Denmark and Sweden representatively. 57 Main share is public, however private schools, medical services and so on are also included in this category.

57
201458 59. The data provides the foundation for separating the share of employment in
petroleum-related activities from non-petroleum-related employment.
5.2 Data findings
5.2.1 Analysis of inter-sectoral adjustments
Figure 5.1 show that the Norwegian Petroleum Sector, Market Directed Services and Non-
Market Directed Services’ share of total employment have increased at the expenses of the
Internationally Exposed Sector in the period of 1975-2014. The development seems to be in
line with the expectations from the core Dutch Disease model. However, the data shows a
marginal increase in the Petroleum Sector share of total employment in the period. While the
Norwegian Petroleum Sector’s share of GDP is 15 % (St.Melding nr. 1 (2015-2016)), the
data reveals that the industry only employs 2,6 % of the total employment. The findings are
therefore in line with the assumed negligible resource movement effect from the technology
and capital intensive Norwegian sector60. Figure 5.2 shows that a similar Scandinavian
pattern in the sectoral labour adjustment. Hence, other factors than petroleum, such as
technology innovations and capital deepening, are likely to have influenced the observed
deindustrialization.
58A company or a business department is classified as petroleum-related if more than 50% of its activity is related to petroleum. All activities of these companies or departments are included in the dataset as petroleum related activities. Thus, petroleum-related activities in some companies are over-estimated. However, the underestimation of petroleum-related activities in other companies is expected to make it even out (Wifstad, 2015). 59The data follows the industry classifications of NACE Rev. 2. The data used in this thesis was updated on November 5th 2015. Due to revisions, data applied in this thesis differ somewhat from previous reports based on the Menon database, e.g. (Blomgren, et al., 2015), (Grünfeld, et al., 2013). Further, the Menon data refers to employees rather than employment. Shares of petroleum-related employees are thus utilized on employment data. This is not expected to violate the results. 60 Ref. (Corden & Neary, 1982).

58
Figure 5.2 - Development of employment in Norwegian sectors as share of total labour stock, 1975-2014
Figure 5.1 - Development of employment in Scandinavian sectors as share of total labour stock, 1975-2014

59
An analysis of the inter-sectoral adjustment of labour uses the counterfactual Norway as
benchmark to assess petroleum driven adjustments in Norway. Table 5.1 displays the annual
average growth rates for the period for Norway and Scandinavia proceeded by a graphical
discussion. The growth-rate in counterfactual Norway naturally follows the growth-rate in
Scandinavia.
Table 5.1 - Annual average growth rates for Norway and Counterfactual Norway, 1975 - 2014
Norway Scandinavia
Internationally Exposed Sector -2,28 % -2,06 %
Market Directed Services 0,03 % 0,49 %
Non-Market Directed Services 1,24 % 0,77 %
Surprisingly the growth in Norwegian Market Directed Services’ share of total employment
is close to zero over the period. The sector for Market Directed Services was expected to
increase more rapidly in Norway than in Scandinavia. However, not only is the growth in the
sector low, the average annual growth rate is 0,46 percentage points lower than in
Scandinavia. While the relative growth in Market Directed Services has been modest, the
average annual growth rate in the sector for Non-Market Directed Services is 0,47
percentage points higher than in Scandinavia. Following the expected findings in regard to
Norwegian characteristics, the moderate growth in Market Directed Services and the rapid
expansion in Non-Market Directed Services could be in support of a phasing of petroleum
revenues mainly through increased public expenditures. This implies a limited public
spending effect in Market Directed Services. The Internationally Exposed Sector has
increased 0,22 percentage points faster in Norway than in Scandinavia, showing evidence of
a modest resource movement effect.
The sector specific employment analysis for the Internationally Exposed Sector in Figure 5.3
shows the Norwegian Internationally Exposed Sector have followed a similar pattern as the
development in the counterfactual Norway. This implies that petroleum have resulted in a
marginal inter-sectoral adjustment of labour from the sector. From the argument of a
negligible resource movement effect and considering the Norwegian real appreciation
following petroleum the adjustment of labour in the sector has been low.

60
The Dutch Disease model including migration proposes an explanation to why
deindustrialization has been low. The real appreciation following petroleum has increased
Norwegian consumer real wages. Further, labour mobility between countries has improved
through out the period, mainly due to the internal market of the European Union following
the Single Market Act (European Comission, 2012). From Figure 5.4 it is evident that
immigration to Norway has increased, which according to the theory, limits
deindustrialization
The comparative results cannot be discussed solely from properties related to Norway. The
small inter-sectoral adjustment of labour from the Internationally Exposed Sector suggests
that the Norwegian deindustrialization is driven by the same factors as deindustrialization in
Scandinavia. Scandinavian Internationally Exposed Sector is expected to have decreased due
to technological innovations and capital deepening. This development is likely to follow
from diminishing cost-competitiveness for low-skilled labour due to the entrance of
emerging economies on the world market, along with a high-skilled labour stock following a
highly educated population.
Figure - 5.3 - Internationally Exposed Sector as share of total (non-petroleum) employment in Norway, Scandinavia and counterfactual Norway, 1975-2014.

61
When deindustrialization occurs, labour shifts towards the non-tradable sectors. As evident
from, Table 5.1 the sector for Market Directed Services in Scandinavia exhibit a relatively
strong growth, while the growth in Non-Market Directed Services have been modest. This
implies that the Scandinavian shift of labour form the Internationally Exposed Sector mainly
have been directed towards Market Directed Services. On the contrary, in Norway labour has
mainly shifted towards Non-Market Directed Services.
From theory, it is ambiguous how petroleum affects the Non-Tradable Sector since the
resource movement effect and the spending effect pull in different directions. The
Norwegian Non-Tradable Sector, i.e. Market Directed Services and Non- Market Directed
Services, has increased. Therefore, the total spending effect in the Norwegian economy is
expected to have exceeded the resource movement effect. This is due to the argument of a
negligible resource movement effect. Since the increase in Market Directed Services have
been marginal, this could imply that the resource movement effect in this sector have in fact
exceeded the spending effect. In the counterfactual Norway the sector for Market Directed
Services accounts for a substantial larger share of total employment than what it does in
Norway, as evident in Figure 5.5.
Figure 5.4 - Market Directed Services sectoral share of total employment in Norway Scandinavia and counterfactual Norway, 1975-2014

62
The development in the Norwegian sector shows signs of spending effect up until 1988. At
that time, an increasing understanding for these tendencies resulted in political initiatives to
limit these the impulses61. From the analysis it seems that public control of the petroleum
revenues have stabilized the adverse development. Further, it is evident that the Financial
Crisis affected employment in both countries62. Yet, for the period as a whole, the sector
exhibit evidence of expected petroleum driven Dutch Disease effects. The Norwegian and
the Scandinavian sectors’ share of total employment converge towards the end of the period
due to differences in the trend growths. In 2014, the Norwegian sector exceeds the
Scandinavian by 0,27 percentage points.
The strong growth in the Scandinavian Market Directed Services is assumed driven by
export of goods and services previously defined as non-tradable. Export of services has been
increasing in Scandinavia throughout the period (Statistics Denmark, 2015). This is likely to
follow from technological innovations, a high-skilled labour stock and a more integrated
global market (Saltveit, 2015). The stagnated growth in Market Directed Services’ share of
total employment in Norway could imply that the share of export directed services is higher
in Scandinavia than in Norway. This would imply that the demand from the Petroleum
Sector may have crowded-out the transition towards export of services in the Norwegian
economy. Data for export-related labour in each sector is not available for any of the
countries, thus the analysis in this thesis is not adjusted for such effects in the sector
classification.
Figure 5.6 exhibits evidence of petroleum driven enforcement of Non-Market Directed
Services’ share of total Norwegian employment. While growth in Market Directed Services
has been modest, Non-Market Directed Services has grown substantially faster in Norway
than in the rest of Scandinavia and is converging the size of the Scandinavian sector. The
Scandinavian Non-Market Directed Services is 0,9 percentage points larger than the
Norwegian sector. The data, exhibits evidence of increasing public expenditures following
increased employment. This implies that a spending effect is present in the sector and
supports the arguments of Bjørnland and Thorsrud (2015a). If the Norwegian assumption of
61 Evident from the report of the Steigum-committee, (NOU 1988:21) and the introduction of “solidaritesalternativet”, the Norwegian policy-mix from 1992 to 1997. 62 2008 is also affected by a re-classification of NACE-industries.
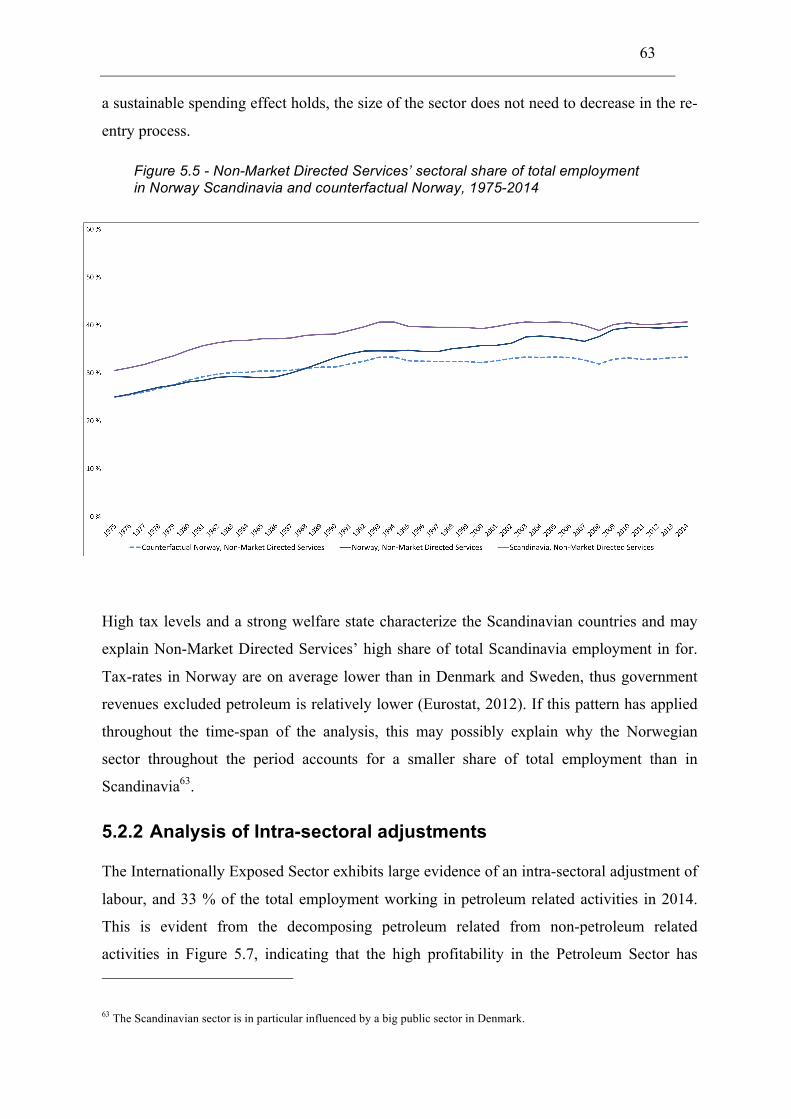
63
a sustainable spending effect holds, the size of the sector does not need to decrease in the re-
entry process.
High tax levels and a strong welfare state characterize the Scandinavian countries and may
explain Non-Market Directed Services’ high share of total Scandinavia employment in for.
Tax-rates in Norway are on average lower than in Denmark and Sweden, thus government
revenues excluded petroleum is relatively lower (Eurostat, 2012). If this pattern has applied
throughout the time-span of the analysis, this may possibly explain why the Norwegian
sector throughout the period accounts for a smaller share of total employment than in
Scandinavia63.
5.2.2 Analysis of Intra-sectoral adjustments
The Internationally Exposed Sector exhibits large evidence of an intra-sectoral adjustment of
labour, and 33 % of the total employment working in petroleum related activities in 2014.
This is evident from the decomposing petroleum related from non-petroleum related
activities in Figure 5.7, indicating that the high profitability in the Petroleum Sector has
63 The Scandinavian sector is in particular influenced by a big public sector in Denmark.
Figure 5.5 - Non-Market Directed Services’ sectoral share of total employment in Norway Scandinavia and counterfactual Norway, 1975-2014
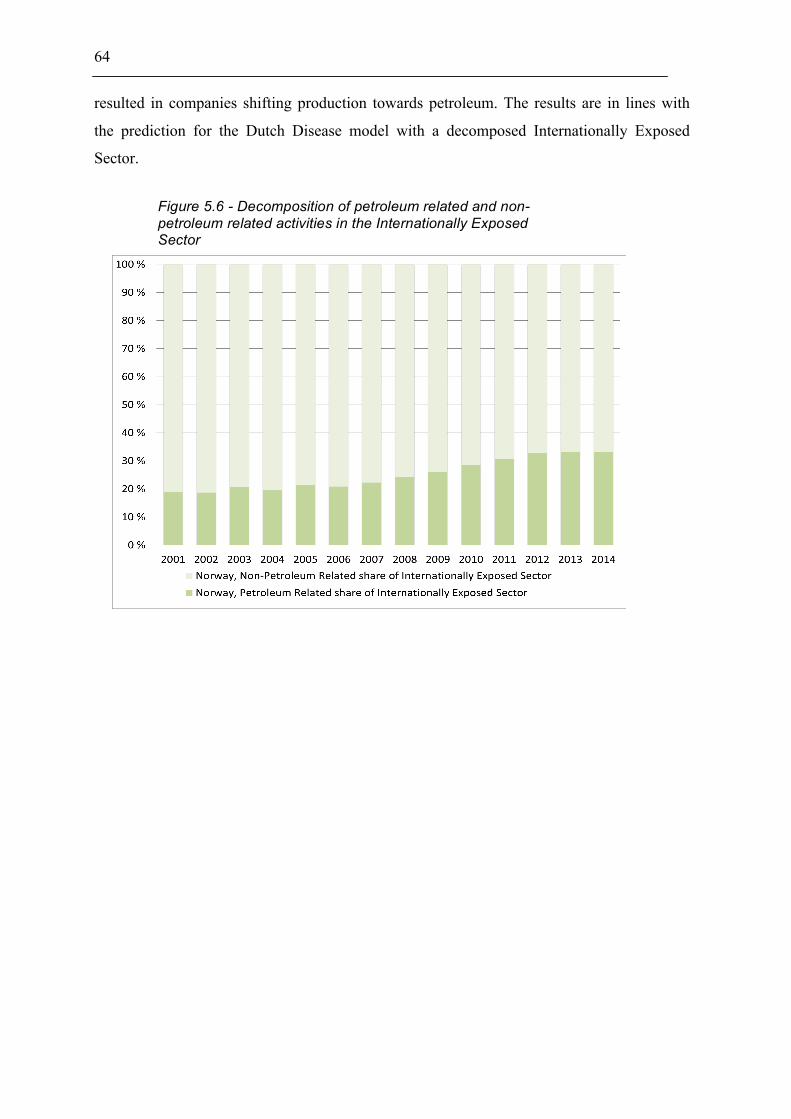
64
resulted in companies shifting production towards petroleum. The results are in lines with
the prediction for the Dutch Disease model with a decomposed Internationally Exposed
Sector.
Figure 5.6 - Decomposition of petroleum related and non-petroleum related activities in the Internationally Exposed Sector

65
Market Directed Services also exhibit a shift towards increasing petroleum related activities,
evident in Figure 5.8, Panel A). Non-Market Directed Services has the lowest share of
petroleum related activities, with a declining petroleum-share of the sector’s labour stock,
Panel B). From Figure 5.7 and Figure 5.8 it is evident that an increasing share of private
companies in the mainland economy has shifted activities towards direct-petroleum supply
after the millennium. This shows evidence of an intra-sectoral adjustment of labour towards
petroleum-related activities. Today, 7 % of total employment is engaged in petroleum
activities, including the Petroleum Sector, as evident from Figure 5.8 Panel C).
Decomposition the internationally exposed sector reveals a larger deviation from the
development in counterfactual Norway, evident in Figure 5.9. The non-petroleum related
Internationally Exposed Sector are 4.00 percentage points smaller than in Scandinavia, and
Figure 5.7- Decomposition of petroleum and non-petroleum activities for each sector Panel A) Market-Directed Services Sector, Panel B) Non-Market Directed Services, and C) Petroleum-Related share of total economy
Panel A) Panel B)

66
3.56 percentage points smaller than in counterfactual Norway in 2014. Similar effects are
evident in the sector for Market Directed Services. In Non-Market Directed Services the
results from the initial analysis of inter-sectoral adjustment of labour holds, due to a
marginal share of petroleum-related employment, evident from Figure 5.9.
Disentangling the petroleum-related activities in the mainland economy introduces a
discussion of whether the petroleum rent is in fact captured by the government and
sustainably phased into the economy through the Fiscal Rule. When the Petroleum Sector is
extended to include all petroleum-related activities the traditional definition of petroleum
revenues must be revised. The current policy measure to ensure that the government captures
the entire petroleum rate is thus insufficient, since an additional private spending effect is
present in the economy. As evident from the results, a larger share of the economy supplies
the petroleum, following the increased demand from the Petroleum Sector. As argued by
Mork (2013), real wage growth driven by product prices improves purchasing power when
the mainland economy shifts production towards profitable petroleum-related activities. The
enforced domination petroleum activities in exposed industries in the wage negotiation
model is likely to reinforce the Dutch Disease effects in real wages. This is evident form the
substantial real appreciation since the millennium. Thus, it is possible that the inter-sectoral
resource movement effect in the sector has been even larger than what this analysis
exhibits64.
64 Unobservable intra-sectoral Dutch Disease effects are not evident from this sectoral comparison with Scandinavia.

67
Figure 5.8 – Internationally Exposed Sector, Market Directed Services and Non-Market Directed Services decomposed and compared to Scandinavian level and the Counterfactual Norway
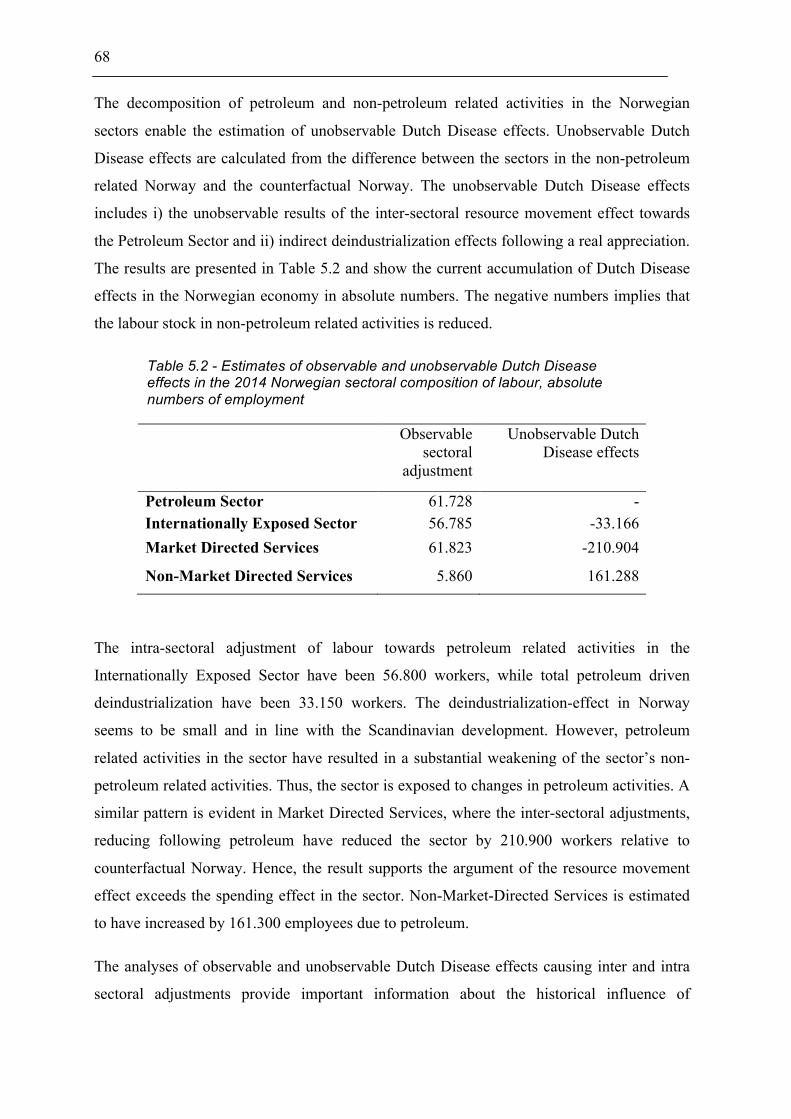
68
The decomposition of petroleum and non-petroleum related activities in the Norwegian
sectors enable the estimation of unobservable Dutch Disease effects. Unobservable Dutch
Disease effects are calculated from the difference between the sectors in the non-petroleum
related Norway and the counterfactual Norway. The unobservable Dutch Disease effects
includes i) the unobservable results of the inter-sectoral resource movement effect towards
the Petroleum Sector and ii) indirect deindustrialization effects following a real appreciation.
The results are presented in Table 5.2 and show the current accumulation of Dutch Disease
effects in the Norwegian economy in absolute numbers. The negative numbers implies that
the labour stock in non-petroleum related activities is reduced.
Table 5.2 - Estimates of observable and unobservable Dutch Disease effects in the 2014 Norwegian sectoral composition of labour, absolute numbers of employment
Observable sectoral
adjustment
Unobservable Dutch Disease effects
Petroleum Sector 61.728 - Internationally Exposed Sector 56.785 -33.166 Market Directed Services 61.823 -210.904
Non-Market Directed Services 5.860 161.288
The intra-sectoral adjustment of labour towards petroleum related activities in the
Internationally Exposed Sector have been 56.800 workers, while total petroleum driven
deindustrialization have been 33.150 workers. The deindustrialization-effect in Norway
seems to be small and in line with the Scandinavian development. However, petroleum
related activities in the sector have resulted in a substantial weakening of the sector’s non-
petroleum related activities. Thus, the sector is exposed to changes in petroleum activities. A
similar pattern is evident in Market Directed Services, where the inter-sectoral adjustments,
reducing following petroleum have reduced the sector by 210.900 workers relative to
counterfactual Norway. Hence, the result supports the argument of the resource movement
effect exceeds the spending effect in the sector. Non-Market-Directed Services is estimated
to have increased by 161.300 employees due to petroleum.
The analyses of observable and unobservable Dutch Disease effects causing inter and intra
sectoral adjustments provide important information about the historical influence of

69
petroleum on the Norwegian economy. This can provide useful insight about the
sustainability of the Fiscal Rule, the economy’s ability to adapt and the properties of the
forthcoming re-entry process. When petroleum activities decline, favourable petroleum-
effects and the assumed sustainable spending effect imply that the sectoral composition of
labour should approach a new sustainable post-petroleum equilibrium. The Scandinavian
sectoral composition is assumed to be a good approximation of such equilibrium. Thus,
during the Norwegian re-entry process all observed intra-sectoral adjustment of labour
should be readjusted. Further, the Norwegian deviation form the Scandinavian sectoral
composition of labour provides an estimate of needed extent of inter-sectoral adjustment for
the Norwegian economy during re-entry.
5.2.3 On the verge of re-entry
If using Scandinavia as a benchmark for the needed readjustment, the total need of
restructuring from declining petroleum activities is estimated to be 412.600 workers based
on a static analysis for 2014. This is evident from Table 5.3. The static analysis reveals that
he re-entry process would require intra-sectoral re-adjustments of 189.600 from the
Norwegian labour stock. The required inter-sectoral adjustment of labour would be 223.000.
It is reasonable to believe that an intra-sectoral readjustment of labour is less costly than an
inter-sectoral readjustment. Depending on the flexibility of Norwegian companies to adapt to
serve new markets, intra-sectoral reallocation of labour could be completed with limited
adjustment costs. This will be further elaborated in Chapter 6. The negative numbers in
Table 5.3 implies that the non-petroleum sectors will have to increase in order to reach the
Scandinavian level.
Table 5.3 - Estimates of needed restructuring in the 2014 Norwegian sectoral employment structure65
Needed intra-
sectoral labour
readjustment
Needed inter-
sectoral labour
readjustment Petroleum Sector - 61.728
Internationally Exposed Sector 60.224 -40.913 Market Directed Services 61.823 6.825
65 There is a minor error in estimates of the inter-sectoral labour adjustment due to a component of missing observations.

70
Non-Market Directed Services 5.860 -22.526
The non-petroleum related part of the Internationally Exposed Sector requires 101.100 more
workers. The majority, about 60.200 workers, could be covered by an intra-sectoral
reallocation of labour from the petroleum-related part of the sector. Further, if all petroleum
related employment in Market Directed Services readjusts intra-sectoral, the sector would
have a surplus of labour of about 6.800 people.
Norwegian Non-Market Directed Services have increased substantially due to Dutch Disease
effects, however the sector is small in the Scandinavian context. Accordingly, the sector
should increase by 22.500 in order to reach the Scandinavian sectoral share of total
employment. Due to minor intra-sectoral readjustments in this sector, the re-entry process
will mainly require inter-sectoral readjustment. However, ceretis paribus an allocation of
labour towards the Non-Market Directed Services will imply increased public expenditure.
Thus, to justify increased public employment, without reducing government expenditures or
increased spending of GPFG, the tax level must increase or public wages must decrease. If
not, expenditures will increase permanently putting a pressure on public finances. Norway is
facing an aging population, and thus increasing demand for public services, increasing the
pressure on government expenditures. This implies that with a current welfare level,
employment in the sector for Non-Market Directed Services must increase gradually over
time. This indicates a restriction of current growth of the sector to be able to increase
spending in the future.
5.2.4 The re-entry process
The above analysis describes the needed extent of restructuring in 2014, and so providing a
static perspective on the Norwegian re-entry. However, the forthcoming restructuring will
not occur instantly. Three scenarios are constructed based on a downsizing of all 2014-
petroleum-related activities of 25 %, 50 % and 75 % by the year 202066. These scenarios
follow the scenarios predicted by Mork (2013) and Cappelen et al. (2013). The 25 %
scenario follows from the baseline scenario of Cappelen et al (2013), where petroleum
activities are predicted to gradually decrease. Further, the 50 % scenario corresponds to the
modelled price-shock scenarios by Cappelen et al (2013) and Bjørnland and Thorsrud
(2014b). Mork (2013) predicts that when marginal costs exceed the marginal revenue all
66 See more assumptions regarding the Scenarios in Appendix B.

71
development of new petroleum projects will suddenly end while only current projects
continue. This development corresponds to the constructed 75 %-scenario. Since a
Scandinavian sectoral composition of labour is assumed suitable as a benchmark for a new
Norwegian equilibrium, dynamics of the Scandinavian sectoral labour composition,
following a natural trend, should be taken into consideration when predicting the required
restructuring of the Norwegian economy up until 202067.
Table 5.4 and 5.5 presents the sectoral downsizing of observable Dutch Disease effects in the
three scenarios and the estimated needed job creation for the Norwegian economy in order to
reach the Scandinavian 2020-composition of labour. Thus, in total the economy is required
to facilitate between 104.800 and 168.800 non-petroleum related jobs within 2020. This
number is higher than the required reduction of petroleum activities since there still is some
petroleum left in the economy, mainly in the Petroleum Sector. The numbers are also
subjected to some errors due to the linear estimation of the trend, yet they provide useful
insight about the size of the needed readjustment of labour.
Table 5.4 - Total accumulated downsizing of petroleum and petroleum related activities in number of employees in the three scenarios, 25 %, 50 % and 75 % reduction of petroleum related employees from 2014 level
25 % 50 % 75 %
Petroleum Sector 15.432 30.864 46.296 Internationally Exposed Sector 15.056 30.112 45.168 Market Directed Services 1.5456 30.912 46.368 Non-Market Directed Services 1.465 2.930 4.395 Total downsizing 47.409 94.818 142.226
Table 5.5 - Total required sectoral enforcement to be on a new balanced equilibrium, in number of employees in the three scenarios, 25 %, 50 % and 75 % reduction of petroleum related employees from 2014 level
25 % 50 % 75 %
Internationally exposed 10.166 25.222 40.278 Market Directed Services 55.092 70.548 86.004 Non-Market Directed Services 39.580 41.045 42.510
Total job creation 104.838 136.815 168.792
67 It is assumed that the Scandinavian sectoral adjustment will follow the same annual average growth rate as it has the last 13 years (2001 to 2014) from 2014 to 2020. Thus, the trend is assumed to be a deterministic for the period.

72
Figure 5.9 – Predicted Norwegian sectoral downsizing based on the scenarios of reduced petroleum dependency of 25 %, 50 % and 75 %, and the path to reach a Scandinavian level
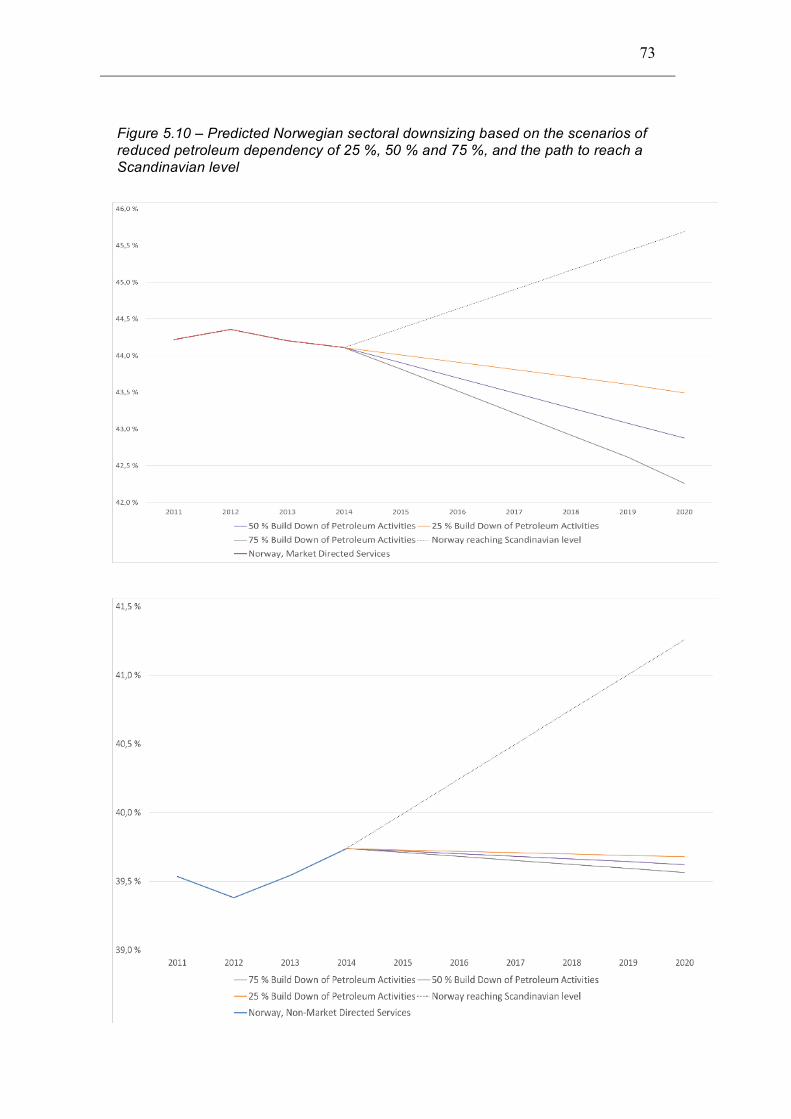
73
Figure 5.10 – Predicted Norwegian sectoral downsizing based on the scenarios of reduced petroleum dependency of 25 %, 50 % and 75 %, and the path to reach a Scandinavian level

74
Given the three scenarios between 15.400 and 46.300 employees in the Petroleum Sector
need to be reallocated to other sectors throughout the period. This is evident from Figure
5.10, Panel A).
The Internationally Exposed Sector faces a reduction in total employment before 2020 is
15.000, 30.000, 45.000 in the 25 %, 50 % and 75 % scenario, respectively. The need for new
non-petroleum related jobs in the period in order to reach the Scandinavian sectoral
composition of labour is predicted to be 10.100, 25.000 or 40.278. Therefore, the needed job
creation in the sector is smaller than the required downsizing. This is caused by the natural
development in the Scandinavian Internationally Exposed Sector. However, a large
petroleum dependency in the sector still implies a required enforcement of non-petroleum
activities.
For Market Directed Services, the total reduction of jobs when petroleum activities are
reduced accounts for between 15.00 and 46.000. The need for job creation is between
55.000 and 86.000 within 2020, depending on the pace of restructuring. The static 2014
analysis shows that all sectoral readjustments in the sector can be conducted by intra-sectoral
readjustment of labour. However, when looking at the dynamic analysis, the sector will have
a large deficit of labour over time, even if all petroleum related employment is intra-sectoral
readjusted. This is due to a low Norwegian annual average growth rate, and a strong
Scandinavian growth. Thus, to be at a Scandinavian level over time, there must be a shift in
trend in this sector.
In the Non-Market Directed services, the need for downsizing is moderate, due to the low
petroleum dependency in the sector. Still, given the results of these analyses, the need for
new jobs in the sector is between 39.000 and 42.510 depending on the pace of restructuring.

75
Chapter 6 – Discussion 6 Discussion The analyses show that 7 % of total employment in Norway is working in the Petroleum
Sector or in petroleum-related activities. Accordingly, the re-entry of the Norwegian
economy will in total require a restructuring of 412.600 people68. The optimal re-entry
implies an enforcement of the Internationally Exposed Sector and Market Directed Services.
The Internationally Exposed Sector has a substantial share of petroleum related activities and
require an enforcement of non-petroleum related activities. Intra-sectoral adjustment can
cover the required expansion in the sector. For Market Directed Services, the 5-years
prediction scenarios reveal the need for inter-sectoral adjustments of labour from the
Petroleum Sector to Market Directed Services, preferably towards export-related services.
The analyses further reveal a need for increased labour in Non-Market Directed Services.
However, the optimal development for this sector is ambiguous. It is affected by an
increased future demand for public services, potential exposure of the fiscal budget to
variations in petroleum activities, and the ability of the economy to replace the shortfall of
the petroleum-impulse. The total restructuring costs depend on the nature of declining
petroleum activities and the characteristics of the Norwegian economy. An optimal policy-
mix minimizing restructuring costs must therefore consider a trade-off between the short and
long-run costs of unemployment and the short and long-run costs of policy measures. This is
to facilitate the restructuring process and obtain a new, balanced sectoral composition similar
to the Scandinavian. The following chapter will give characteristics of the Norwegian
economy that will determine the restructuring costs during the re-entry process. Thus, the
foundation is made for suggesting the optimal policy-mix in order to smooth the estimated
required restructuring.
6.1 Characteristics of the Norwegian readjustment The smoothness of sectoral readjustment of labour in Norway depends on the drivers of the
declining petroleum activities, the ability of the economy to initiate new activities and
characteristics of the labour market. There are different opinions about the flexibility of the
Norwegian labour market and characteristics of the Norwegian economy. Such opinions
68 Based on the 2014 sectoral structure.
76
about the ease of restructuring provide different conclusions regarding the re-entry process
and thus different policy approaches, as evident in Chapter 3.
In order to get further insight in which factors that will be most crucial for the Norwegian
restructuring, experiences from a similar re-entry process in Finland can be useful. The
Finnish equivalent to the Norwegian Petroleum Sector is the mobile phone industry,
represented by Nokia.
After Nokia collapsed, the Finnish government has not been able to accommodate the
needed structural change. Finland has experienced real wage rigidities, resulting in high
unemployment. Since Finland is a member of the European Monetary Union, real wage
adjustments are not enforced by a flexible exchange rate. Further nominal wages has proven
rigid resulting in low cost-competitiveness reducing Finnish growth prospects. The
profitable electronics industry and the following spending effect in the rest of the economy
enabled high public expenditures through a temporary high tax-base. Following lower
activity in Nokia, the Finnish government has not been able to finance public expenditures
(Due-Andersen et.al 2014)
6.1.1 The drivers of declining petroleum activities The Norwegian Petroleum Sector will diminish gradually when the marginal cost of
extraction exceeds the marginal revenue. Marginal costs are increasing with extraction and
have the last decade resulted in increased petroleum investments. This has contributed to
increased demand from the Petroleum Sector towards the mainland economy even though
the production volume peaked ten years ago. The characteristics of the re-entry process will
be affected by the Petroleum Sector’s response to these increasing marginal costs. This is
evident from the different conclusions regarding re-entry from Cappelen et al. (2013) and
Mork (2013). Further, the timing of the introduction of the re-entry may be affected by
changes in the petroleum price, affecting marginal revenues. A negative price shock will
cause lower activity on the Norwegian continental shelf, which further will result in lower
demand from the Petroleum Sector towards the mainland economy. The shocks may occur
simultaneously, yet the consequences of the different drivers of a petroleum price shock will
be discussed separately.
A negative supply-driven petroleum price shock originates from excess supply of petroleum,
which will affect the price, reducing the marginal revenue of extraction. An expansion in
shale oil production following a high petroleum price, primarily in the U.S., has caused an

77
excess supply of petroleum on the world market. In order to restrict the development in shale
oil and maintain market shares OPEC increased their petroleum production following the
price shock, reinforcing the excess supply.
While a supply driven shock reduces the demand for petroleum-related activities, the
purchasing power for net petroleum importers is assumed to increase. Excess supply of
petroleum will reduce production costs for industries using petroleum as input factor. Thus,
GDP for petroleum importing countries is expected to increase, stimulating demand for
Norwegian non-petroleum related tradable goods (Bjørnland & Thorsrud, 2014). Reduced
profitability in the Petroleum Sector, and the increased demand for other Norwegian tradable
goods, can motivate companies to shift production towards new markets. Therefore, a supply
driven shock stimulates the emergence of new profitable industries in the Internationally
Exposed Sector (Cappelen et al., 2013). Thus, such a shock would be preferable to ease
readjustment costs during the re-entry process,
A petroleum price shock driven by reduced global demand is assumed to be the Norwegian
worst-case scenario (Bjørnland & Thorsrud, 2014); (Cappelen et al., 2013); (Torvik, 2015).
Declining growth in emerging economies, especially in China, has dampened the petroleum
demand (OPEC, 2015). If the shock follows from lower economic growth in major
petroleum importers it will require a permanent build-down of petroleum activities.
However, if the low demand follows from business cycle fluctuations the price is expected to
rise in the future (Torvik, 2015).
Regardless of the persistency of the shock, a demand driven shock will affect all petroleum
exporting countries, and dampen the international demand for petroleum related activities.
Low global activity will also reduce international demand for non-petroleum related goods
and services (Bjørnland & Thorsrud, 2014). Hence, a demand driven shock can reinforce
restructuring cost from cyclical unemployment. Low international demand will make the
transition towards new profitable tradable industries more challenging69. Depending on the
characteristics of the shock, a gradual build-down of petroleum activities can be necessary to
compensate for low global demand for other goods and services, for instance by enforcing
export of petroleum-related goods and services.
69 The major trade-partners for the Norwegian economy are the European countries. Thus, stimulating new dominating Norwegian tradable industries will be sensitive to the development in the European economy.

78
6.1.2 Stimulating new activity – replacing a profitable sector Regardless of the driver of lower petroleum activities, the technology and capital intensive
Petroleum Sector will eventually phase out. The Petroleum Sector accounts for 15 % of
Norwegian GDP and petroleum have generated high growth in the Norwegian economy and
provided a high-skilled labour stock (Bjørnland & Thorsrud, 2014). Thus, the Norwegian
economy is in need of technology and capital intensive activities independent of production
on the Norwegian continental shelf. There are mainly three ways in which this can occur i)
export of petroleum activities, ii) intra-sectoral adjustment towards non-petroleum related
industries, iii) emergence or strengthening of non-petroleum industries. This implies that the
readjustment costs in the re-entry will depend on companies’ ability to adapt to new
profitable markets and the economy’s ability to facilitate emergence of new industries.
Demand from the Norwegian Petroleum Sector towards the mainland economy has resulted
in a Norwegian competitive advantage in high-skilled knowledge about offshore petroleum
extraction (Cappelen et al., 2013). Norwegian petroleum related activities have proven
competitive on the international market. Adjustments towards new petroleum producing
markets will reduce readjustment costs by distributing the sectoral readjustment of labour
over time. The Norwegian Petroleum Sector is considered as the leading industry for high
quality offshore production. Yet, if this competitive advantage is based on a local monopoly,
Norwegian petroleum related companies would be challenged on the international market
(Mork, 2013). Hence, it is unlikely that companies without highly specialized skills within
one unique niche will succeed a transition towards other petroleum producing markets.
Since it is unlikely that all petroleum-related companies are able to successfully shift to serve
new markets, the economy also depends on companies’ ability to shift production away from
petroleum related activities. In order to secure a strong, sustainable tradable sector, Norway
is dependent on sustaining the footloose industries70 (NOU 2013:13). Available labour from
the petroleum activities should be allocated towards technology and capital intensive
footloose industries in the Internationally Exposed Sector and export related Market Directed
Services. Evident from the suggested new balanced sectoral labour composition, resources
from the Petroleum Sector should mainly be reallocated towards Market Directed Services.
Readjustments in the Internationally Exposed Sector could be obtained by intra-sectoral
70 Footloose industries are only depending on the country-specific production factors of labor. Footloose industries could also include petroleum knowledge export (Cappelen, Eika, & Strøm, 2013).

79
readjustment of labour alone. A continuous deindustrialization in the Internationally
Exposed Sector enforces the need for resources moving to technology and capital intensive
production. Since intra-sectoral adjustment is assumed less costly than inter-sectoral
adjustments, restructuring towards non-petroleum related footloose industries might reduce
readjustment costs.
Petroleum related production has proven flexible when shifting production toward
petroleum. This and the fact that the Petroleum Sector consists of a highly skilled
employment stock could imply an ability to adapt production to serve new product markets
(Bjørnland & Thorsrud, 2014). This may eases the reallocation towards high-skilled
intensive footloose industries. New dominating footloose industries can also emerge from
either entrepreneurial eras of production or from strengthening of existing non-petroleum
related industries. Such shifts depend on the improvement of the Norwegian cost-
competitiveness, and the global demand for non-petroleum related goods and services, along
with access to financial capital.
The successful enforcement of non-petroleum related technology and capital intensive
industries will limit the potential adverse effects from the reversal of the unobserved Dutch
Disease effects. Even though these effects are mainly assumed sustainable due to the
properties of the Fiscal Rule, the indirect resource movement effect and private spending
effect could be affected if a new technology and capital intensive sector is unable to emerge
in the Norwegian economy.
6.1.3 Labour market rigidities Labour market will increase adjustment costs during re-entry. Mainly since the lack of
labour market flexibility is likely to increase structural unemployment by preventing a
perfect transferability of labour between sectors, industries and companies. Labour market
rigidities can originate from real wage rigidities, rigidities in the labour stock, and a
mismatch in demand and supply of labour skills due to sector specific knowledge.
Cost-competitiveness for Norwegian Internationally Exposed Sector is said to be an essential
factor to ensure the economy’s ability replace the positive impulse from the Petroleum
Sector. Cost-competitiveness is enforced by a moderate real wage growth and thus depends
on restricted nominal wages, inflation and a depreciation of the real exchange rate (NOU
2013:13). Under the assumption of a new sector composition based on the Scandinavian, it is

80
reasonable to assume that Norwegian real wages should be sustainable on a Scandinavian
level. Real wages on this level is also suggested by Mork (2013).
Real wages have proven upwards flexible the last decades (Cappelen et al., 2013). However,
this shows little evidence of flexible wages in the case of a downward wage pressure. In
general, wages are proven to be more downward sticky (Due-Andersen et al. 2014).
Cappelen et al. (2013) points to four factors that ensures real wage flexibility: i) the flexible
inflation targeting of Norges Bank, ii) floating exchange rate improving the cost-
competitiveness, iii) the centralized income policy and iv) reduced labour market pressure
from less migration (Cappelen et al., 2013). Monetary policy, income policy and a floating
exchange rate during the re-entry process will be further elaborated in the following section
of an optimal policy-mix.
Extensive migration to Norway could imply a flexible Norwegian labour stock. Each year
about 300.000 labour immigrants, mostly low-skilled, comes to Norway (Friberg et al.,
2013). This is said to have enabled the expansion of the Norwegian economy and dampened
the pressure on the labour market following petroleum. The relative level of consumer real
wages affects the size of immigration. If real wages decrease during re-entry, it is likely that
immigration will fall, reducing the labour supply and thus limiting structural unemployment
(Cappelen et al., 2013). However, even with real wages equal to the Scandinavian level, the
wage level will be relatively higher than in other countries. This restricts the flexibility of the
labour stock71 (Mork, 2013).
Immigration of low-skilled labour might allowed Norwegian labour factors to specialize on
high skilled activities. Further, the Norwegian market is in need of technology and capital-
intensive industries. If immigration continues the pressure on the labour market is likely to
increase. This might decrease wages in low-skilled labour intensive occupations, resulting in
labour adjustments towards labour intensive production processes rather than high-skilled
technology and capital intensive processes (Cappelen et al., 2013). This may reduce
productivity, hamper economic growth and possibly increase excess capacity of high-skilled
labour, which is likely to increase readjustment costs.
71 I Chapter 7, this discussion is further nuanced regarding the current migrant crisis.

81
The readjustment costs from a mismatch in demand and supply of skill-specific labour may
be reinforced by rigidities in the transferability of knowledge between the sectors, industries
and companies. According to the dynamic Dutch Disease model with sector-specific
knowledge in the Internationally Exposed Sector, an increase in the sectoral labour stock
from a real depreciation will reallocate experienced workers to train the flow of new workers
(Steigum & Thøgersen, 2003). Thus, rigidities in transferability of knowledge is expected to
obstruct the sectoral readjustment of labour and cause a temporary reduction in production
due to reallocation of resources to training of new workers. Similar costs may occur when
companies apply competence to shift production processes towards new markets.
The drivers of the re-entry process affect the economy’s ability to facilitate new industries
and the characteristics of the Norwegian labour market determine the potential costs from
structural unemployment. High unemployment during re-entry and a reduced profitability in
the Petroleum Sector will reduce households’ purchasing power and increase uncertainty for
future disposable income. Reduced purchasing power, increased uncertainty and moderate
real wage growth will likely affect aggregated demand. Reduced demand towards Market
Directed Services and import competing goods form the Internationally Exposed Sector
could reinforce unemployment effects in the re-entry process by increasing cyclical
unemployment. This will reduce demand for labour more than predicted by the analyses in
this thesis. A larger share of high-skilled unemployment will potentially reinforce reduced
private demand, due to the previously strong purchasing power of the group. A potential
reduction of migration will also reduce demand towards the domestic economy further.
From the Finland case and the above discussion it is evident that the optimal policy-mix
should ensure low real wages, limit negative demand effects in the economy and facilitate
the restructuring by stimulating new footloose activities.
6.2 Policy-mix The main concern when conducting economic policy in the re-entry is to stabilize the short-
run fluctuations from reduced petroleum activities and facilitate a long-run structural shift by
ensuring labour market flexibility. This should be done while still addressing the long-run
considerations for economic growth and stabilization. However, political pressure, political
cycles and time inconsistency problems might distort the intertemporal perspectives for

82
Norwegian economic policy. If the policy does not consider both long-run and short-run
effects, it may be counterproductive, violate established policy considerations and prevent a
necessary restructuring process. This may result in a postponed recession and increase the
costs of restructuring (Cappelen et al., 2013). The discussion on the optimal policy-mix will
be related to the required labour readjustment in each sector.
6.2.1 The Internationally Exposed Sector A policy-mix should aim to stimulate new profitable industries in the Internationally
Exposed Sector to smooth the re-entry process. Evident from the analyses, over 56.800
works in the sector are employed in petroleum related activities. This implies a reduction in
petroleum related employment of between 3.000 and 9.000 each year until 2020, depending
on the pace of restructuring. The previous discussion highlights the need for emergence of
technology and capital intensive footloose industries in the Internationally Exposed Sector.
Thus, the policy should ensure cost-competitiveness to facilitate new industries. Moderate
real wage growth could be achieved politically by expansionary monetary policy and
restrictive income policy. A lower key policy rate will also benefit the cost-competitiveness
though the net export channel.
A low key policy rate is an appropriate response to decreased petroleum activities, since a
downsizing of the Petroleum Sector results in lower demand towards the mainland economy,
causing a negative output-gap72. Expansionary monetary policy will improve the Norwegian
cost-competitiveness through the net-export channel. Accordingly, a low key policy rate can
facilitate growth in the Internationally Exposed Sector. In addition to increasing cost-
competitiveness, a lower interest rate will also stimulate real investment. This could endure
investments in technology and capital, contributing to enforcement of profitable non-
petroleum related activity in the Internationally Exposed Sector. This implies that even
though monetary policy is assumed to only have temporary effects on the real economy, an
expansive monetary policy in the re-entry process may assist a structural shift (Mork, 2015).
A low key policy rate will be beneficial, however an appropriate interest rate is based on
several criteria.
Norges Bank has been less aggressive in its response than anticipated to declining petroleum
activities by the flexible inflation targeting alone due to consideration of robustness. This
72This corresponds to a negative demand shock in the model for flexible inflation targeting, see Chapter 3.

83
criterion has also been a reason for the stepwise reduction of the key policy rate, as evident
from Figure 6.1. Currently, the consideration for financial stability is mainly influenced by
the strong growth in Norwegian house prices and households’ accumulation of debt. Form
the credit channel it is clear that a lower interest rate results in increased demand for
financial capital, which will maintain the pressure in the house market.
The critics of the third criteria argue that the consideration for the housing market and
accumulation of debt limits monetary policy flexibility and its ability to respond sufficiently
to the negative shocks towards the Norwegian economy. Excess capacity in the labour
market during restructuring is expected to reduce the pressure in the housing market
(Andreassen, 2015). Following, increased uncertainty in the economy is likely to increase
the risk premium on loans, which could destabilize the housing market. This implies large
wealth effects73 in the economy. These could reinforce the risk of recession and obstructs the
restructuring process. If this is the case, monetary policy should respond more aggressively
to reduced petroleum activities in order to stimulate the real economy. This is more in
accordance to Norges Banks’s alternative scenario in Figure 6.1. However, the analysis in
73 Would affect demand, but could also affect the financial sector and potentially result in a banking crisis.
Figure 6.1 - Expected paths for the key policy rate, in percentage. 2008 Q1-2018 Q4. Source: MPR 3/15

84
this thesis makes it evident that the petroleum-related labour stock is relatively small, sector-
specific. Therefore, the anticipated effects of a declining Petroleum Sector will be relatively
modest and only directly affect certain parts of the economy. For non-affected parts of the
economy, an expansionary monetary policy will increase demand for financial capital
reinforcing the pressure in the housing market.
Mork (2013) argues that an expansionary monetary policy will increase the inflationary
pressure through the exchange rate channel and the expectation channels. Isolated, this could
cause an upward pressure on the wage-level limiting the Norwegian real wage flexibility
during re-entry. However, excess capacity of labour following a declining Petroleum Sector
will ease the pressure in the labour market putting a downward pressure on inflation. This
supports an expansionary policy. Further, due to an anticipated negative output in the
restructuring period, it is likely that inflationary pressure will lie above the target only for a
short period of time (Cappelen et al., 2013).
Income policy is the other important policy measure to ensue cost-competitiveness. The
institutional properties of the Norwegian wage negotiation model have shown ability to
restrict the growth in nominal wages. Thus, even though inflation is expected to increase in
the short run, income policy is able to restrict nominal wage growth on the basis of the long-
run aim of limiting structural unemployment and improving companies’ competitiveness.
However, if the restructuring are as substantial as predicted by the 75 %-scenario, downward
nominal wage adjustments may be required (Mork 2013). This can challenge the institutional
equilibrium in the model. Yet, the composition of the leading industries is assumed to be
sustainable through the build-down of petroleum activities. This is due to reduced
extraordinary wage pressure from petroleum-related activities (NOU 2013:13).
The improved cost-competitiveness following a restrictive income policy and an
expansionary monetary policy is visible in the economy today. An example is that REC
Solar is acquiring parts of the bankrupt Elkem Sola, to reopen Norwegian production of solar
panels in Norway (Schultz, 2015). From this it is evident that improved cost-competitiveness
might contribute to the emergence of new industries and markets.
New emerging industries can also be stimulated through structural policy measures, as tax
reliefs for non-petroleum related tradable goods and services, investments in knowledge,
research and development, infrastructure, entrepreneurship and innovation. For instance

85
could allocation of public means to development of innovative business climates and
innovation hubs, encourage business development. However, it is challenging for politicians
to “pick winners”, and such policy is closely related to political beliefs. Thus the effects of
supply side policies are challenging to predict. Yet, it seems as an appropriate measure to
obtain a structure for stimulating emergence of non-petroleum related activities. The short
and long run effects of expansionary discretionary fiscal policy during re-entry will be
discussed in the two next sections.
6.2.2 Market Directed Services In the long run Market Directed Services will need reallocation of labour from the Petroleum
Sector since it is required to expand over time in order to reach a Scandinavian level. This
long-run shift to export-related services should be stimulated through income policy,
structural policy and monetary policy. Thus, the following discussion will be applicable for
the short run needs in the sector. In the short run, the sector for Market Directed Services
will be exposed to reduced domestic demand74. Increased unemployment during re-entry
could cause demand effects, these will mainly manifest in Market Directed Services. Hence,
the re-entry might affect more than the 61.800 petroleum-related employees in Market
Directed Services. Therefor, economic policy should aim to maintain domestic demand
through the re-entry process. There are mainly two factors to consider in order to maintain
private demand: i) sustaining private consumption by maintaining the consumer confidence
and thus limit precautionary saving and ii) maintenance of the households’ purchasing
power.
Expansionary Monetary Policy will affect demand, investments and expectations about
future consumption positively. Therefore it is likely to help maintain private consumption.
Thus, a lower key policy rate will be an important policy tool to facilitate continuous activity
in Market Directed services and reduce demand effects in the re-entry process. Policy
measures for limiting structural unemployment by retraining programs, education and
adaption of the labour stock for needed skills will also maintain the purchasing power in the
economy and limit the risk of cyclical unemployment.
The main tool for stabilizing short-run domestic demand in the Norwegian policy-mix is the
automatic stabilizers. During recessions, tax smoothing and unemployment benefits are
74 The Internationally Exposed Sector is competing on the world market, and is not affected by domestic demand, neither are Non-Market Directed Services, which are sheltered from market exposure.
86
designed to maintain purchasing power and consumer confidence. The automatic stabilizers
are allowed to work through the structural non-oil budget deficit (NOU 2015:9). If the
Norwegian super-cycle is contracting and the calculated structural trend growth is
overshooting its true long-run trend growth, the automatic stabilizers in fiscal policy will
have pro-cyclical properties from the super cycle (Bjørnland & Thorsrud, 2015). If this is the
case, the current properties of the automatic stabilizers will have to be contracted at a later
point in time, following from the intertemporal budget balance (NOU 2015:9). This implies
a need of adapting the properties of the automatic stabilizers to a post-petroleum economy.
Adjustment costs and the possible cyclical unemployment from the re-entry process may
give temptations to extend the impulse exceeding the 4 %-path. If the downsizing in the
economy follows a similar path to the 75 %-scenario, the use of expansionary discretionary
fiscal policy could be justified by short-run considerations for domestic demand. However,
policy authorities must be aware that the structural shift in a re-entry is likely to imply
increased unemployment, which must be tolerated in order to reach a new balanced sectoral
composition. Therefor, the use of fiscal policy to stimulate petroleum activities should be
restricted. Further, the use of fiscal policy could prevent a needed structural shift by
unintentionally maintaining petroleum-related activities, following from the challenges in
targeting only certain areas of the economy. Policies for stimulating domestic demand could
also increase the profitability of serving the Norwegian market rather than enforcing export
activities. Thus, fiscal policy could further prevent a real depreciation and counteract a
structural shift (Torvik, 2015). Evidently, there are short-run considerations for discretionary
fiscal policy making it a less favourable tool during re-entry than monetary policy.
Further, discretionary fiscal policy affects the government’s intertemporal budget constraint
and must be financed either by increased current taxes, or by an intergenerational
redistribution of wealth. Increased taxes today are likely to result in adverse contractionary
impulses to the economy the other alternative if desiring to increase spending today is then
to increase spending of the GPFG. This will result in an intergenerational redistribution of
wealth, only assumed justified if the decline in petroleum activities implies a deep recession.
Evidently, the use of such policy has some limitations given by long-run considerations. This
will be further discussed in the following section.

87
6.2.3 Non-Market Directed Services The findings in this thesis give implication of a needed enforcement of Non-Market Directed
Services in order to reach a new balanced sectoral composition. Accordingly, the need for
new employees in the sector accounts for between 39.600 and 42.500 workers within 2020.
However, this discussion will conclude that the labour stock in Non-Market Directed
Services will have to be constrained rather than enforced. One argument for this is the high
growth in the Norwegian sector, which needs to be dampened if the Norwegian Non-Market
Directed sector shall be sustained at a Scandinavian level. Even though the sector should
increase over all, the Norwegian sector will have to reduce the growth rate by 0,47
percentage points from the historic Norwegian annual average growth rate to follow the
Scandinavian pace. Thus, even with a current limitation of growth in this sector, it is likely
to reach that the Scandinavian level will be reached over time.
The Fiscal Rule is designed to sustain a continuous gradual petroleum impulse to the
Norwegian economy. However, Mork (2013) claims that the government fails to capture the
entire petroleum rent and Bjørnland and Thorsrud (2015) expresses concerns of a pro-
cyclical Fiscal Rule based on the expansionary phase of the Norwegian super cycle. If this is
true, the spending effect caused by an enlarged public sector is unsustainable and decreasing
petroleum activities will reduce current government revenues or increase spending of GPFG.
Even though the petroleum related activities in the Norwegian employment stock are no
more than 7 %, it is likely that the booming Petroleum Sector have resulted in an increased
tax base. This is based both on to the size of unobserved Dutch Disease effects, and high real
wages in the Norwegian economy. Therefore, the downsizing of petroleum is likely to affect
the government’s revenues. Automatic stabilizers increasing due to increased unemployment
and the current prospects of a low real return of the GPFG given by global long-term interest
rates further limits current and future flexibility of the budget under the Fiscal Rule. In
addition, there will be increased future public expenditures due to an aging population. This
reduces the room for expansionary spending of the GPFG during re-entry (NOU 2015:6).
Based on this it is evident that there is limited flexibility to conduct expansionary fiscal
policy within the aim of to staying below the 4 %-path.
The desire to stay below the 4 %-path follows from the long-run considerations of fiscal
policy, mainly a wish to extend the intermediate phase. The appropriate level of petroleum
impulses on the government budget is assessed in three scenarios for the application of the
Fiscal Rule by the Thøgersen-committee (NOU 2015:9). See Figure 6.2. The scenarios

88
predicts the length of phasing of the spending effect as a share of GDP given different
budget impulses from the GPFG, defined as annual increase in spending of the fund. The
impulse-scenarios highlight the need for current restriction in the conduction of the Fiscal
Rule in order to sustain the intermediate phase.
If the use of petroleum revenues increases to the 4 %-path, the intermediate phase is
expected to end before an increased pressure on public finances from an aging population is
imposed. To ensure a constant welfare level without increasing the tax-burden on future
generations, spending of petroleum revenues will have to be further limited over the next 10-
15 years (NOU 2015:9). Spending of petroleum revenues substantially below the 4 %-path
permits an extension of the intermediate phase. Thus, by more gradual phasing petroleum
revenues over time, the spending effect in the Norwegian economy may be smoother and
may facilitate a gradual restructuring to the Internationally Exposed Sector (NOU 2015:9).
Due to decreasing petroleum activities, the increased pressure on the welfare state and a
future contraction in the spending effect, the need for additional measures to ensure a
spending of petroleum revenues below the 4%-path may be needed. Two such means are: i)
reduction of wages in the sector for Non-Market Directed Services, ii) the implementation of
structural reforms of the welfare state in order to discipline current public expenditures
(Mork, 2013), iii) increased taxes.
Public expenditures are affected by the relatively strong growth of wages for the sector
during the petroleum era, when considering the relatively low level of productivity in the
sector (Mork, 2013). The Norwegian public sector faces higher wages than the rest of
Figure 6.2 - The use of petroleum revenues over the national budget, illustrated by the structural budget deficit and the 4 % real return on the GPFG (NOU 2015:9).

89
Scandinavia. The public wages in the Norwegian health sector was about 10 % higher in
Norway than Scandinavia in 2006 (Kittelse et al., 2009). Labour intensive Market Directed
Services are not exposed to normal market mechanisms. Thus, one can argue that wages in
this sector are less flexible than wages in private sectors (Mork, 2013). This is expected to
result in a mismatch between productivity and real wages in the public sector, increasing
public expenditures relative to public revenues. Flexible public wages could be an efficient
way to adjust government expenditures to the re-entry process without affecting the
intertemporal budget balance. Relatively lower real wages in the sector will permit an
increased sectoral labour stock while limiting public expenditures. Due to the income policy,
real wages are likely to be restricted during re-entry in order to stimulate the Internationally
Exposed Sector. Yet, this might not be enough when considering the potential loss of tax
revenues.
Implementing structural reforms of the welfare state may limit current public expenditures.
Such reforms are assumed to limit the growth in the labour stock for Market Directed
Services, by increasing efficiency or reduce the welfare coverage in the economy75. A
detailed discussion on the appropriate reforms is not provided in this thesis. Rather, it is here
referred to primarily three reforms suggested by Mork (2013): restricting sickness benefits,
limiting unemployment benefits and increased private financing of education, kindergartens,
culture and sports. However, such reforms will break the foundation of the Norwegian
welfare state.
Increased taxes, targeting the Scandinavian tax-level is preferred over praying on the
principal amount of the GPFG. Taxes are already expected to increase due to the
demographic shift. Yet, there are adverse contractive impulses from increased taxes Due to
the higher Scandinavian tax level, it may be justified to maintain low taxes through the
initial phase of the re-entry process, in particular justified in the 75 %-scenario. A tax level
similar to the Scandinavian is assumed sustainable in the Norwegian economy, however an
increase from current tax-rates is likely to cause distortions and efficiency losses.
75 This could assumedly have adverse effects for saving decisions and a stable purchasing power in the economy. However, this will not be discussed in this thesis.

90
Overall it is evident that an expansionary fiscal policy will have long-term costs by reducing
the intermediate phase, and that the use of fiscal policy might counteract the needed
structural change in the short run.

91
Chapter 7 - Conclusion and final remarks 7 Conclusion and final remarks The aim of this thesis is to analyse how the Norwegian Petroleum Sector has affected the
sectoral composition of labour in the Norwegian economy and the following extent of
required sectoral readjustment of labour in order for the economy to reach a balanced post-
petroleum sectoral composition of labour.
It has been shown that the sectoral composition of labour in Norway has followed a similar
development as remaining Scandinavia. When assessing inter-sectoral labour adjustments
over time, there is few evidence of a petroleum driven deindustrialization. However, the
intra-sectoral analysis shows evidence of increasing petroleum-related activities in the
mainland economy after the millennium. This implies that reduced petroleum activities on
the Norwegian continental shelf will affect the Norwegian economy. These effects may be
restricted by use of economic policy.
The analysis shows that in total about 60.000 are directly employed in the Petroleum Sector
and about 125.000 are employed in petroleum-related activities. In total, this only adds up to
about 7 % of total employment. The analyses also makes evident that the large unobserved
Dutch Disease effects in the Norwegian labour market, mainly affects the Non-Market
Directed Services This indicates that a downsizing of petroleum potentially could affect
large parts of the economy. However, the properties of the Fiscal Rule and the income policy
should under the Norwegian assumptions ensure a sustainable spending effect, thus limiting
the need for reversal of the unobservable Dutch Disease effects. Thereby, a downsizing of
the Petroleum Sector will not imply a reversal of all petroleum effects, rather a need for a
new balanced sectoral composition. The need for restructuring in the Norway economy is
estimated based on a downsizing of all petroleum activities of 25 %, 50 % and 75 % by
2020. This implies a readjustment of 47.400, 94.800 and 142.200 employees, respectively.
To reach a Scandinavian sectoral composition, all sectors needs to increase. The largest
required readjustment will be in Market Directed Services, where the trend growth for the
sector should increase rapidly to accommodate a required enforcement of between 55.000
and 86.000 employees.

92
In the past, the Market Directed Services has experienced a much lower growth than
Scandinavia, which is unexpected due to an assumed increase following the spending effect.
One explanation for this could be that the resource movement effect from the sector has been
larger than the spending effect. The high growth in the Scandinavian sector is likely to be
caused by an increasing degree of tradable high-skilled services. In Norway it is likely that
increased petroleum supply has crowded out these effects, resulting in lower growth in non-
petroleum related Market Directed Services.
The Internationally exposed sector must increase over time, but is not expected to require a
large inter-sectoral readjustment of labour, since all adjustment in the sector can be
accommodated by intra-sectoral readjustments. Yet, an enforcement of profitability in this
sector will be of significance in order to sustain growth after the shortfall of the Petroleum
Sector. This follows from need for new technology and capital intensive footloose industries
in the Internationally Exposed Sector and export-related Market Directed Services. This need
is reinforced by a potential shortfall of a Norwegian competitive advantage for petroleum
related goods and services following a local monopoly, as suggested by Mork (2013).
Non-Market Directed Services has increased rapidly after petroleum, and the spending effect
seems to have been most profound in this sector. However, this result rests on an assumption
of a sustainable spending effect, and does not consider the future pressure on the sector due
to an aging population and the intergenerational aspect related to increased expenditures
today.
During re-entry, readjustment costs will occur due to structural unemployment. These costs
are assumed to cause adverse demand effects and possibly increase cyclical unemployment.
To ensure a smooth transmission towards a balanced sectoral composition of labour, the
economic policy-mix should address labour market flexibility, facilitate the emergence of
new industries by improving the Norwegian costs-competitiveness and maintain domestic
demand. This should be done while still allowing for a structural shift and maintain long-run
economic growth and a fair intergenerational distribution of the petroleum wealth.
7.1 The optimal policy mix Based on the required sectoral readjustment of labour and the related discussion of this
thesis, the next section suggests the optimal policy-mix to ease the re-entry process.

93
Monetary policy will be an important instrument in the optimal policy-mix. Expansionary
monetary policy can ensure cost-competitiveness through the net-export channel,
contributing to a moderate real wage growth and the emergence of new industries. A low key
policy rate will stimulate real investments, reinforcing the facilitation of new industries.
Monetary policy will affect domestic consumption though the demand channel, thereby
reducing potential adverse demand effects in Market Directed Services. Nevertheless,
monetary policy must consider financial stability when deciding the key policy rate. In
particular will this imply considering the development in the Norwegian housing market and
the debt position of the households. Depending on the pace of restructuring, Norges Bank
should put more or less weight on the robustness criteria. However, if the adverse effects on
the real economy from the restructuring are substantial, like suggested by the scenario of
75% reduction in petroleum activities within 2020, this require Norges Bank to put more
weight on limiting the output gap.
Another important contribution for restricting the real wage growth and improving
Norwegian cost-competitiveness is the income policy. Especially the exposed industry
model is likely to restrict nominal wage growth in the time ahead, to ensure cost-
competitiveness for the Internationally Exposed Sector. The interaction between monetary
and income policy will provide a good foundation for restricting real wage growth since
short-run effects of monetary policy is accommodated by the more long-run considerations
of income policy. For instance, the wage settlement of 2015 was restricted despite
expectations of increased inflation in the short-run.
In regard of fiscal policy, automatic stabilizers will be important to maintain the domestic
demand during re-entry. The automatic stabilizers are allowed to work through the
operational design of the Fiscal Rule. Even though the preceding analyses indicate a required
enforcement of Non-Market Directed Services, the suggested policy is to rather restrict the
growth in the sectors labour stock. In the short-run, discretionary fiscal policy might
intentionally or unintentionally prevent a structural shift by maintaining activity in the
Petroleum Sector or petroleum-related activities. Further, will reduced government revenues
from decreasing activities in the Petroleum Sector and increased government expenditures
from pressure on the automatic stabilizers during restructuring limit the current fiscal
flexibility. The intermediate phase should be prolonged to ensure positive impulses to the
economy while the restructuring to a new balanced sectoral composition is obtained. This is
reinforced by increased demand for public services following an aging population. Based on

94
short and long-run consideration, the use of discretionary fiscal policy during restructuring is
recommended to be restricted. Yet, this can be modified if the initial decline in in petroleum
activities is substantial. For instance, more expansionary fiscal policy may be justified in the
75 %-scenario due to an enlarged cost of restructuring on the current generation, allowing
for intergenerational redistribution of wealth.
In regard to the required sectoral readjustment of labour, monetary policy, income policy and
the automatic stabilizers should be sufficient to ensure continuous economic activities.
However, given the findings in this thesis, a further restriction of fiscal expenditures and an
adjustment of the automatic stabilizers to mitigate unsustainable spending effects could be
necessary in order to prolong the intermediate phase.
The conclusion of this thesis is similar to the one of Cappelen et al. (2013), where it is
assumed that expansionary monetary policy and a restrictive income policy is sufficient to
smooth the re-entry process. However, the disentangled petroleum effects in the mainland
economy are likely to have affected government finances more than anticipated by Cappelen
et al. (2013). Therefore, due to a pro-cyclical fiscal policy, restrictive fiscal policy should be
conducted during re-entry. Hence, the policy implications for the fiscal policy are more in
line with the suggestions of Mork (2013), and Bjørnland and Thorsrud (2014).
7.2 The way ahead This thesis has elaborated the main domestic considerations in relation to the restructuring of
the Petroleum Sector. The analyses have included few factors from the current economic
development in main arguments in order to be robust to rapid changes in the Norwegian
economic outlook. However, there are several uncertainties in the current economic situation
that may have a large influence on the outcome of the Norwegian re-entry process.
Therefore, some factors that are likely to affect the re-entry process and the subsequent
policy-mix are briefly discussed below.
7.2.1 The current petroleum price shock From Summer 2014, the oil price has experiences a large negative price shock. There are
indicators of multiple simultaneous drivers of decreasing petroleum activities. Improved
shale oil technology has resulted in increased supply of petroleum. OPEC has not responded
to the increase, and has rather reinforced the excess supply by allowing for increased
extraction volumes (OPEC Monthly Oil Market Report, 2015). Poor macroeconomic
95
performances and reduced petroleum demand from China the latest years, has further
imposed a demand component to the current price shock. The future price will therefor
depend on whether the reduced Chinese growth is due to business cycle fluctuations or a
permanent shift in trend growth. The overall demand for petroleum is slightly increasing,
while supply is still exceeding demand. Thus, the development in petroleum price is difficult
to predict.
The current outlook for major Norwegian trade partners shows modest improvements in the
macroeconomic indicators towards the end of 2015 (MPR 3/2015), thus non-petroleum
export are not yet affected by the demand driven petroleum price shock and has rather
increased due to improved Norwegian cost-competitiveness (MPR 3/2015).
7.2.2 The migrant crisis The current situation in Syria and other conflict areas have caused a flow of refugees to
Europe, including Norway. Estimates by the Norwegian government predict that between
30.000 and 50.000 refugees will need to be accommodated in Norway in 2016 (Prop. 1 S
Tillegg nr. 1 (2015–2016)). The large flow of refugees will increase the pressure on public
finances. Further, will the migration result in an upward shift in labour supply, thus
reinforces the existing petroleum-driven pressure on the labour market. This is likely to be
especially evident in low-skilled occupations (Dørum, 2015). This may result in a downward
pressure on wages in low-skill industries and possibly result in more inequality in the
economy (Dagsnytt atten 30.11.15, 2015). A downward pressure on wages from increased
slack in the economy can give incentives for a shift towards labour intensive production
processes, rather than favourable investments in technology and capital intensive processes.
Activities to ensure flexibilities in the adaption of immigrants to the Norwegian labour
market are important for large volume of immigration (NOU 2011:7) This will help secure
integration, reduce unemployment burdens for the government and ensure productivity-
growth in the economy (Dagsnytt atten 30.11.15, 2015).
7.2.3 House prices and households debt Norges Bank has responded more aggressively to reduced petroleum activities than
anticipated by Cappelen et al. (2013). This has maintained the pressure on the housing
market by increasing demand for financial capital. Further, competition in the Norwegian
banking industry has increased after the union for Norwegian Professional Associates,
Akademikerne, representing a large and profitable customer group changed bank of their

96
member group in January 2015. This has resulted in lower margins on interest rates on
mortgages. These factors have reinforced the growth in Norwegian house prices and the
private debt accumulation. Households’ growth in credit now exceeds the growth in income
(MPR 3/15, 2015). This increase has occurred despite moderate economic outlook for the
Norwegian economy the preceding year. However, pressure on the housing market is
expected to be reduced as the re-entry process unfolds. Increased unemployment reduced
economic activities and increased uncertainty in the market may increase the risk of default
mortgages and induces the risk of housing prices without sufficient fundamental drivers and
thus burst of a potential housing bubble. This may have substantial adverse effects for the
Norwegian real economy and increase the costs of the re-entry.
7.3 Further research and limitations of the thesis The estimates of the petroleum dependency in mainland employment in this thesis are
presumably undershooting the true effects. Increasing demand from the Petroleum Industry
towards the mainland economy, shifting mainland activities towards supply of offshore
activities is likely to have increase demand towards the mainland economy, also for input
factors in the petroleum related activities. These indirect petroleum effects are hard to
measure, and are not included in available data. Therefor indirect petroleum related activities
are not fully captured in this thesis. However, IRIS-estimates suggested the amount of
employment in indirect petroleum activities to be 144.000 employees in 2014, or about 7 %
of total employment (Blomgren, et al., 2015).
Regional differences for the petroleum-related activities in Norway are expected to affect the
costs of restructuring (Blomgren, et al., 2015). An analysis of petroleum driven sectoral
adjustment of labour for regions on the west coast of Norway is expected to show more
profound evidences for Dutch Disease effects. Thus, the regional differences in restructuring
costs are expected to be substantial. Emergence of new, dominating industries seems to
occur in other parts of the country, and the following geographical differences between
demand and supply in the labour market will most likely increase frictional unemployment.
In this thesis, sectoral adjustments have been compared across countries and the regional-
dimension has therefore not been included.
While the thesis has focused on sectoral adjustment of labour following a profitable
Petroleum Sector, further research should aim to include an industry analysis of similar
97
labour adjustments, including value-added and labour productivity in the analyses. This
enables an assessment of whether intra-sectoral adjustments of labour has reduced the
growth potential for Norwegian non-petroleum related activities relative to the Scandinavian
economy. Suggesting that Norway should be equal to the sectoral composition in
Scandinavia does not necessary imply equivalent productivity in a sector across borderlines.
Thus, a Scandinavian sector structure for labour is not unambiguously sustainable over time.
However, similar level of education in the populations and productivity spillovers from the
Petroleum Industry gives indicators of possibly high productivity also in non-petroleum
related activities. Further, differences in comparative advantages within Scandinavia, may
allow for deviations from the Scandinavian sector composition of labour.
All in all, the Norway will not face an economic crisis due to declining petroleum activities,
yet there are challenges related to the forthcoming restructuring. By wisely using policy
tools, and stimulating new industries, the transition towards a post-petroleum economy will
occur gradual and the knowledge from petroleum extraction will be a foundation for future
growth.

98
Bibliography 8 Bibliography
Abraham, K., & Katz, L. (1984, July). Cyclical Unemployment: Sectoral Shift or Aggregated Distrubances? Working Paper No. 1410 . Cambridge: National Byrau of Economic Research.
Akerlof, G., Dickens, W., Perry, G., Gordon, R., & Mankiw, N. (1996). The Macroeconomics of Low Inflation. Brookings Papers on Economic Activity , 1996 (1), pp. 1-76.
Alesina, A., & Perotti, R. (1995). The Political Economy of Budget Deficits. International Monetary Fund.
Andreassen, J. (2015, September 28). Tanker rundt Norges Banks tenkning. Retrieved November 15, 2015 from http://jansblogg.eika.no: http://jansblogg.eika.no/2015/09/tanker-rundt-norges-banks-tenking/
Anundsen, A., & Jansen, E. (2011). Self-reinforcing effects between housing prices and credit - Evidence from Norway. Discussion Papers No. 651 . Oslo: Statistics Norway.
Aukrust, O., Holte, F., & Stoltz, G. (1966). Innstilling II fra Utredningsutvalget for inntektsoppgjør 1966 - Vedlegg til St.meld. nr. 58 for 1966-67. Oslo: The Norwegian Government.
Bank of England. (2001). The transmission mechanism of monetary policy. London: Bank of England.
Barro, R. (1979, Oct.). On the Determination of the Public Debt. Journal of Political Economy , Vol. 87 (5), pp. 940-971.
Barro, R., & Gordon, D. (1983). Rules, Discretyion and Reputation in a Model of Monetary Policy. Journal of Monetary Economics , 1983 (12), pp. 101-121.
Bjørnalnd, H., & Thorsrud, L. (2013). Ringvirkninger - Norsk økonomi og olje. Working Paper Series 7/13 . Oslo: BI Norwegian Business School.
Bjørnland, H., & Thorsrud, L. (2014a). Boom or gloom? Expamening the Dutch disease in two-speed economies. Working Paper 122014 . Oslo: Norges Bank.
Bjørnland, H., & Thorsrud, L. (2014b, November). What is the effect of an oil price on the Norwegian economy? Oslo: BI Norwegian Business School.
99
Bjørnland, H., & Thorsrud, L. (2015a). Commodity prices and fiscal policy design: procyclical despite a rule. CAMP Working Paper Series No 5/2015 . Oslo: BI Norwegian Business School.
Bjørnland, H., & Thorsrud, L. (2015b). Hva skjer når oljeprisen faller? Samfunnsøkonomen , 2015 (2), pp. 22-29.
Blomgren, A., Quale, C., Austnes-Underhaug, R., Harstad, A., Fjose, S., Wifstad, K., et al. (2015). Industribyggerne 2015 - En kartlegging av ansatte i norske petroleumsrelaterte virksomheter, med et særskilt fokus på leverandørbedriftenes ansatte relatert til eksport. Stavanger: IRIS.
Cappelen, Å., Eika, T., & Prestmo, J. (2015). Oljeprisfallet gir ingen krise. Samfunnsøkonomen , 2015 (2), pp. 18-21.
Cappelen, Å., Eika, T., & Prestmo, J. (2013). Petroleumsvikromhetens virkning på norsk økonomi og lønnsdannelse - Fremtidig nedbygging og følsomhet for oljeprissjokk. Oslo: Statistics Norway.
Cappelen, Å., Eika, T., & Strøm, B. (2013). Konkurranseutsatte næringer i Norge. Oslo: Statistics Norway.
Corden, W. (1984, November). Booming Sector and Dutch Disease Economics: Survey and Consolidation. Oxford Economic Papers , 1984 (3), pp. 359-380.
Corden, W., & Neary, J. (1982, December). Booming Sector and De-industrialisation in a Small Open Economy. The Economic Journal (368), pp. 825-848.
Council of The Europen Union. (2007, November 23). Towards Common Principles of Flexicurity - Draft Council Conclusions. SOC 476, ECOFIN 483 . Brussels: Council of The Europen Union.
Cuddington, J., & Jerrett, D. (2008). Super Cycles in Real Metals Prices? IMF Staff Papers , 55 (4), pp. 541-565.
Dagsnytt atten 20.11.2015. (2015, November 30). NRK.
Due-Andersen, K.; Hov, M.G.; Knudsen, N.K.; Mork, K.A (2014). Konjunkturrapport 2015: Norge etter oljen — som Finland etter Nokia? Oslo: Handelsbanken.
Dørum, Ø. (2015, November 27). Flyktningekrisen i Europa - store tall, små effekter. Retrieved December 16, 2015 from DNB Markets: https://www.dnb.no/bedrift/markets/nyheter/web-tv/151127-2.html#
Econ Pöyry. (2010). Næringsmessige konsekvenser av redusert petroleumsaktivitet. Oslo: Lederne.
100
European Comission. (2012, March 10). Single Market Act II - Together for new grwoth. Communication from the Commissjon to the European Parliament, the Concil, the European Economic and Social Committee and the Commettee of the Regions . Brussels: European Commission.
Eurostat. (2012). Taxation trends in the European Union. Brussels: European Commission.
Eurostat. (2008). NACE Rev. 2 - Statistical classification of economic activities in the European Community. Luxenbourg: European Commistion.
Finci, A., & Wang, H. (2015, Sept. 20). Ny klassifisering av norsk petroleumsrettet leverandørindustri - Kraftig vekst for leverandørindustrien fra 2010 til 2013. Retrieved October 15, 2015 from ssb.no: https://www.ssb.no/energi-og-industri/artikler-og-publikasjoner/kraftig-vekst-for-leverandorindustrien-fra-2010-til-2013
Freedman, C., & Laxton, D. (2009, April). Why Inflation Targeting? IMF Working Paper/09/86 . Washington D.C.: International Monetary Fund.
Friberg, J., Dølvik, J., & Eldring, L. (2013). Arbeidsmigrasjon til Norge fra Øst- og Sentral-Europa. Oslo: Norges Forskningsråd.
Friedman, M. (1948, June). A Monetary and Fiscal Framework for Economic Stability. The American Economic Review , 38 (3), pp. 245-264.
Gartner, M. (2009). Macroeconomics (Third Edition ed.). Pearson International.
Grünfeld, L., Holmen, R. W., & Gulbrandsen, M. (2013, September). Måling av konkurranseevne i norsk industri og næringsliv ellers. Menon-publikasjon Nr. 24/2013 . Oslo: Menon Business Economics.
Hall, S. (2001). Credit channel effects in the monetary transmission mechanism. Bank of England Quartarly Bulletin (Winter), pp. 442-448.
Holden, S. (2012). Pareto 1. Oslo: Cappelen Damm.
Jackman, R., & Roper, S. (1987). Structural Unemployment. Oxford Bulletin of Economics and Statistics , 49 (1), pp. 9-36.
Katz, L. F., & Meyer, B. (1990). The impact of the potential duration of unemployment benefits on the duration of unemployment. Journal of Public Economics , 41 (1), 45-72.
Kittelsen, S., Anthun, K., Kalseth, B., Kalseth, J., Halsteinli, V., & Magnussen, J. (2009). En komparativ analyse av spesialist- helsetjenesten i Finland, Sverige, Danmark og Norge: Aktivitet, ressursbruk og produktivitet 2005-2007. Trondheim: SINTEF Helsetjenesteforskning og Frischsenteret.
Kjus, T. (2015). It's the supply side, stupid. Oslo: DNB Markets.

101
Kydland, F., & Prescott, E. (1997, June). Rules Rather than Discretion: The Inconsistancy of Optimal Policy. The Journal of Political Economy , 85 (3), pp. 473-492.
Lillen, D. (1982, Aug.). Structural Shift and Cyclical Unemployment. Journal of Political Economy , 90 (4), pp. 777-793.
Mishkin, F. (1996). The Channels of Monetary Transmission: Lessons for Monetary Policy. Cambridge: National Bureau of Economic Research.
Mork, K. (2013, January). Etter oljen: Utfordringer for norsk økonomi. Working Paper Series 2/13 . Oslo: BI Norwegian Business School.
Mork, K. (2015). Resesjon og omstilling. Samfunnsøkonomen , 2015 (2), pp. 6-9.
MPR 1/11. (2011). Monetary Policy Report with Financial Stability Assessment 1/11. Oslo: Norges Bank.
MPR 4/14. (2014). Monetary Policy Report with Financial Stability Assessment 4/14. Oslo: Norges Bank.
MPR 1/15. (2015). Monetary Policy Report with Financial Stability Assessment 1/15. Oslo: Norges Bank.
MPR 3/15. (2015). Monetary Policy Report with Financial Stability Assessment 3/15. Oslo: Norges Bank.
Nicolaisen, J. (2011, February 8). Robust Pengepolitikk i en Urolig Verden. Valutaseminaret 2011 . Oslo: Norges Bank.
Nordbø, E., & Stensland, N. (2015). Oljevirksomheten og norsk økonomi. Aktuell Kommentar Nr. 4/2015 . Oslo: Norges Bank.
Norges Bank. (2015a). Hvordan virker renten på inflasjon? Retrieved December 10, 2015 from norges-bank.no: http://www.norges-bank.no/Upload/import/pengepolitikk/rentevirkninger/hoved.swf
Norges Bank. (2015b). Inflation Indicatiors. Retrieved 11 23, 2015 from Norges Bank: http://www.norges-bank.no/Statistikk/Inflasjon/Indikatorer-for-prisvekst/
Norman, V., & Orvedal, L. (2010). En liten,åpen økonomi (4ht ed. ed.). Oslo: Gyldendal.
Norwegian Regulation on Monetary Policy 29.03.2001 (2001). Oslo: The Norwegian Government.
NOU 1988:21. (1988). Norsk økonomi i forandring (The Steigum-Committee). Oslo: The Norwegian Government.
102
NOU 2004:1. (2004). Modernisert folketrygd - Bærekraftig pensjon for fremtida (The Pension Commission). Oslo: The Norwegian Government.
NOU 2011:7. (2011). Velferd og migrasjon — Den norske modellens framtid (The welfare and migration Committee). Oslo: The Norwegian Government.
NOU 2013:13. (2013). Lønnsdannelse og utfordringer for norsk økonomi (The Holden III Committee). Oslo: The Norwegian Government.
NOU 2015:6. (2015). Grunnlaget for inntektsoppgjørene 2015 (The Norwegian Technical Calculation Committee for Wage Settlements). Oslo: The Norwegian Government.
NOU 2015:9. (2015). Finanspolitikk i en oljeøkonomi - praktisering av handlingsregelen (The Thøgersen Committee). Oslo: The Norwegian Government.
OECD. (2011). OECD Economic Outlook Volume 2011 Issue 1. Paris: OECD.
Olsen, Ø., & Skjæveland, A. (2002). Handlingsregelen for bruk av oljeinntekter. In A. J. Isachsen, Hva gjør oljepengene med oss? (pp. 69-98). Oslo: Cappelen Akademiske Forlag.
Olsen, Ø. (2013, October 31). Macroprudential regulation and financial stability. Speach, Norwegian Savings Banks Association . Oslo: Norges Bank.
Olsen, Ø. (2014, April 8). Speech: A decade of forward guidance in Norway. Oslo: Norges Bank.
Olsen, Ø. (2015, February 12). Economic Perspectives. Annual Address . Oslo: Norges Bank
OPEC. (2015). OPEC Monthly Oil Market Report. Vienna: OPEC.
Organization of the Oil Producing Exporting Countries. (2015, October 12). OPEC Monthly Oil Market Report. Retrieved November 29, 2015 from OPEC.org: http://www.opec.org/opec_web/static_files_project/media/downloads/publications/MOMROctober2015.pdf
Osmundsen, P. (2015, April 30). Prognoser for oljenæringen – fakta eller
skremselspropaganda? Retrieved October 29, 2015 from npd.no:
http://www.npd.no/Publikasjoner/Norsk-sokkel/Nr1-2015/Prognoser-for-oljenaringen/
Prestmo, J., Strøm, B., & Midem, H. (2015). Ringvirkninger av petroleumsnæringen i norsk økonomi. Oslo: Statistics Norway.
Prop. 1 S Tillegg nr. 1 (2015–2016). (2015). FOR BUDSJETTÅRET 2016 Endring av Prop. 1 S (2015–2016) Statsbudsjettet 2016 og Prop. 1 LS (2015–2016) Skatter, avgifter og toll 2016 (økt antall asylankomster) . Oslo: Finansdepartementet.

103
Røisland, Ø., & Sveen, T. (2005). Pengepolitikk under et inflasjonsmål. Norsk Økonomisk tidsskrift (119), pp. 16-38.
Reinhart, C., & Rognoff, K. (2009). The Aftermath of Financial Crisis. American Economic Review , 99 (2), pp. 466-472.
Romer, D. (2012). Advanced Macroeconomics (4th edition ed.). New York: McGraw-Hil.
Rystad Energy. (2014). Petro Foresight - 2030: Aktivitietsnivået inennfor olje og gass i
Nord-Norge. Oslo: Rystad Energy.
Saltveit, M. (2015, November 4). Klassifisering av tjenesteeksport. (S. S. Støhlmacher, Interviewer)
Schultz, J. (2015, September 04). 80 nye arbeidsplasser på Herøya. Retrieved November 24, 2015 from Dagens Næringsliv: http://www.dn.no/nyheter/naringsliv/2015/09/04/0859/REC-Solar/80-nye-arbeidsplasser-p-herya
Statistics Denmark. (2015). International trade in services. Retrieved December 12, 2015 from dst.dk: http://www.dst.dk/en/Statistik/emner/udenrigshandel/udenrigshandel-med-tjenester
Statistics Finland. (2015, November 24). Unemployment rate 8.7 per cent in October. Retrieved December 2015, 2015 from stat.fi: http://www.stat.fi/til/tyti/2015/10/tyti_2015_10_2015-11-24_tie_001_en.html
Statistics Norway. (2015, 09 10). Consumer price index, November 2015. Retrieved 09 15, 2015 from ssb.no: https://www.ssb.no/en/kpi
St.Melding nr. 1 (2015-2016). (2015). Nasjonalbudsjettet 2016. Oslo: The Norwegain Government.
St.melding nr. 21 (2014-2015). (2015). Forvaltning av Statens Pensjonsfond i 2014. Oslo: The Norwegian Government.
St.melding nr.25 (1973-1974). (1974). Petroleum industry in Norwegian Society. Oslo: The Norwegian Government.
St.melding nr.29 (2000-2001). (2001). Guidelines for economic policy. Oslo: The Norwegian Government.
Stehrer, R., & Ward, T. (2012, August). Sectoral Employment Effects of Economic Downturns. wiiw Research Reports 379 . Vianna: The Vianna Institute for International Economic Studies.

104
Steigum, E. (1989, July). Wealth, Structural Adjustment and Optimal Recovery from the Dutch Disease. Norges Handelshøyskole Discussion Paper 06:89 . Bergen: Norewgian School of Economics.
Steigum, E. (1993). Offentlig gjeld og folketrygd i en overlappende generasjonsmodell for en liten åpen økonomi. Notat . Bergen: Norwegian School of Economics.
Steigum, E., & Thøgersen, Ø. (2003, May). Borrow and adjust: Fiscal Policy and Sectoral Adjustment in an Open Economy. International Economic Review , 44 (2), pp. 699-724.
Steigum, E. (2013). Sovereign wealth funds for macroeconomic purposes . Oslo: Swedish Fiscal Policy Council .
Steigum, E., & Thøgersen, Ø. (2014). A crisis not wasted - Institutional and structural reforms behind Norway's strong macroeconomic performance. In T. Andersen, M. Bergman, & S. Jensen, Reform Capacity and Macroeconomic Performance in Nordic Countries (Ch. 10). Oxford University Press.
Svensson, L. (1999, June). Inflation Targeting as a Monetary Policy Rule. Journal off Monetary Economics , 43 (3), pp. 607-654.
Thøgersen, Ø. (1995). Overlappende generasjonsmodeller og virkningen av finans- og overføringspolitikk. Norsk Økonomisk Tidsskrift (109), pp. 165-188.
Thøgersen, Ø. (2004). Finanspolitisk styring: Mindre fleksibilitet - bedre resultater? Magma, 7 (2), pp. 54-65.
Torvik, R. (2001, February). Learning by doing and the Dutch disease. European Economic Review , 45 (2), pp. 285-306.
Torvik, R. (2015, April). Oljeprisfall: Pengepolitikk i en Oljeøkonomi. Samfunnsøkonomen (2), pp. 34-45.
Van der Bremer, T., Van der Ploeg, F., & Wills, S. (2014). The Elephant in the Ground: Managing Oil and Sovereign Wealth. Ox Research Paper 129 . Oxford: Oxford Department of Economics.
Van Wijnbergen, S. (1984, May). Inflation, Empoyment adn Dutch Disease in Oil-Exporing Countries: A Short-Run Disequilibrium Analysis. The Quarterly Journal of Economics , 99 (2), pp. 233-250.
Wifstad, K. (2015, October 05). Oljerettede næringslivsaktiviteter. (S. S. Meyer, & S. S. Støhlmacher, Interviewers)
Woodford, M. (2005, August). Central Bank Communication and Policy Effectiveness. NBER Working Paper 11898 . Wyoming: Columbia University.

105
Appendix A 9 Appendix A – Nace Rev. 2 NACE Rev. 2 is the subject of industry classification at a European level. This imposes a
uniform classification within all member states. NACE Rev. 2 is the revised version of
NACE Rev. 1 and imposes minor update NACE Rev. 1.1. Changes to the NACE Rev. 2
reflect technological developments and structural changes of the European economies, and
the classification system contributes to more comparable and relevant data. NACE rev. 2 is
classified down to a four-digit level for industry activities76 (Eurostat, 2008). Country-
specific classifications specify the industry activities at further detailed digit levels. All
Scandinavian countries classify employment data at a six-digit level. The differences
between these countries’ classifications are minimal due to the similarities in the economic
structures; see Appendix 2. Figure A.1 provides an overview of NACE rev. 2 at a two-digit
level.
76 Thus, each industry group consists of several sub-industries and further decomposition of smaller industry classifications.
Figure 9.1 - The broad-level structure of the industry classification NACE Rev. 2. Source: (Eurostat, 2008)

106
Appendix B 10 B. Appendix B – The Data Sets
Danish data The Danish employment data is published by Statistics Denmark, and Danish standard for
industry classifications, DB, is closely related to NACE Rev. 2. The applied time series are
annual date from Q4 for the period of 1975-2014. All data are register-based according to
DB2007 on a two-digit level.
Swedish data Swedish register-based employment data are published Statistics Sweden. Historic Swedish
data are classified according to the current Swedish standard for industry classification, SNI,
at the time of publishing. For the purpose of this thesis, time series with annual data for
employment in Q4 for the period of 1993-2014 are reclassified to suit the SNI2007. The
differences between the classifications are minor and mainly involve incremental changes on
a four-digit level.
Available Swedish employment data for the period 1975-1993 are only published every five
years, following the FOB. To apply the data for construction of a Scandinavian average prior
to 1993, a linear trend between each observation is constructed77. Thus, there may bee
marginal deviation from the actual development in the Scandinavian sectoral labour structure
in the time interval 1975-1993. The Swedish time series has in general a higher reported
number of uncategorized data78, cause minor fluctuations in the time-series around the time
when classification systems are changed79. This is particularly evident from 1992 to 1993.
The group of missing classifications is increasing prior to an implementation of new industry
standards, and most likely accurse since new industries do not fit the classification before a
revised standard is implemented. There is little to suggest that the fluctuations in the
category of missing observations affect the overall result, but is worth mentioning as it
explains some of the sudden fluctuations in the Swedish data.
77 A trend is constructed form 1975 to 1980, 1980 to 1985, 1985 to 1990, and 1990 to 1993. After 1993 employment data is recorded annually. 78 NACE Rev. 2 group 99. 79 In 1993, 2003 and 2998 for the change to SNI1992, SNI2002, SNI2007.

107
Norwegian data Statistics Norway, SSB, publishes the Norwegian employment data. The Norwegian
adaption of the NACE Rev. 2 industry classifications is SN2007. Applied time series are
annual date from Q4 on a two-digit level. The series are based on data from national
accounting for the period of 1975-2000. Data for the period of 2001-2014 are register-based
and reclassified to the standard of SN2007.
Register-based data are applied in order to be applicable in analysis with the data from the
Menon Database for Norwegian Activities and Accounting. These data were provided on a
two-digit level classified by SN2007 for the time period of 2001-2014. Data from Menon
Business Economics is based on data on employees registered at The Brønnøysund Register
Centre. Thus, the shares of employees in petroleum related activities provided by Menon
Business Economics, is applied to the register based data in order to get the numbers of
petroleum employees. The share of employment could therefore deviate slightly from the
precise numbers, yet this is not expected to violate the conclusions.
The Norwegian national account-data prior to 2000 are linked to the register based data in
2001 in order to adjust for level-differences in the data series and construct a coherent time-
series. This is conducted by applying the annual growth rate calculated from the national
account data, to a base year in the register-based data. Data from the national account record
employment in domestic companies, while register-based data record employment from
persons working domestically, provided by AKU80.
Further, the data does not capture short-termed immigration. Therefore, the actual effect
from the reduced profitability in the Petroleum Sector could be slightly different than the
results of the analysis. For instance could a large degree of short-termed labour in Market
Directed Service make the data under-estimate the effects in the sector However, the extent
of labour migration is expected overall similar across Scandinavia, thus the effects are
unlikely to change the conclusion of the analysis.
SSB provides a measure for adaption between the standards of 2002 and 2007, which have
been applied when reclassifying the data. To construct a coherent data series a linear trend
has been constructed for some industries with deviations between SN2002 and SN2007. The
80 The Norwegian Labour Force Survey
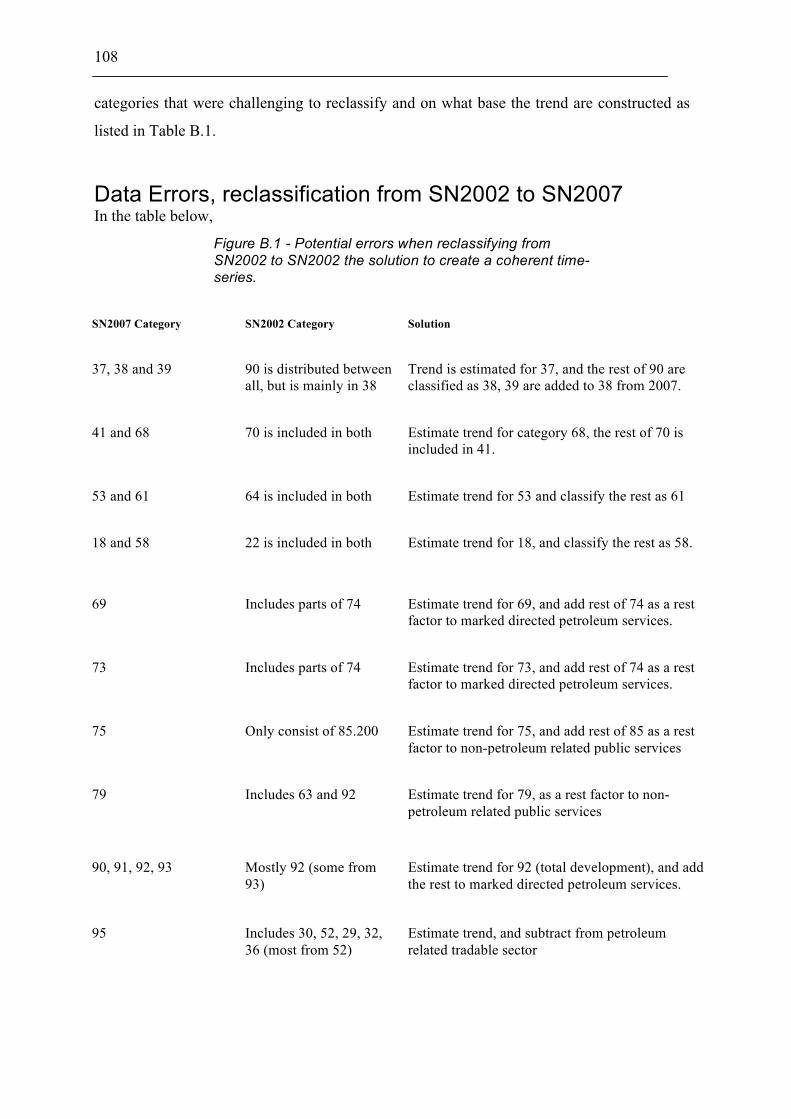
108
categories that were challenging to reclassify and on what base the trend are constructed as
listed in Table B.1.
Data Errors, reclassification from SN2002 to SN2007 In the table below,
SN2007 Category SN2002 Category Solution
37, 38 and 39 90 is distributed between all, but is mainly in 38
Trend is estimated for 37, and the rest of 90 are classified as 38, 39 are added to 38 from 2007.
41 and 68 70 is included in both Estimate trend for category 68, the rest of 70 is included in 41.
53 and 61 64 is included in both Estimate trend for 53 and classify the rest as 61
18 and 58 22 is included in both Estimate trend for 18, and classify the rest as 58.
69 Includes parts of 74 Estimate trend for 69, and add rest of 74 as a rest factor to marked directed petroleum services.
73 Includes parts of 74 Estimate trend for 73, and add rest of 74 as a rest factor to marked directed petroleum services.
75 Only consist of 85.200 Estimate trend for 75, and add rest of 85 as a rest factor to non-petroleum related public services
79 Includes 63 and 92 Estimate trend for 79, as a rest factor to non-petroleum related public services
90, 91, 92, 93 Mostly 92 (some from 93)
Estimate trend for 92 (total development), and add the rest to marked directed petroleum services.
95 Includes 30, 52, 29, 32, 36 (most from 52)
Estimate trend, and subtract from petroleum related tradable sector
Figure B.1 - Potential errors when reclassifying from SN2002 to SN2002 the solution to create a coherent time-series.

109
Category 92 is the main problem since it is included in many categories, yet most of them
are within petroleum-related Marked Directed Services. Thus, the errors are assumed small
when the remaining part of 92 is estimated81.
The counterfactual Norway The counterfactual Norway is constructed by linking the Scandinavian development to the
Norwegian data, in the same way as the register-based and the register-based data was
linked.
The prediction scenarioes The scenarios are predicted by using average annual growth rate, and rest on some
assumptions. The Norwegian employment stock is assumed constant over the next 5 years.
This is due to uncertainties regarding the future growth in the labour stock. Further, the
historical development in each sector is not included in the estimates due to uncertainties
regarding the development during restructuring, and a potential permanent shift in trend.
The job creation is calculated by the difference between the Scandinavian and the
Norwegian sector in 2020. The Scandinavian development is estimated based on the
historical trend from 2001 to 2013, and assumed constant towards 2020. This is assumed
both for the development of the total labour stock and in the employment in each sector.
The deviation between the required downsizing in the Norwegian sectors and the job
creation comes from the fact that petroleum is still present in the Norwegian economy. The
missing component is also not included, which is another source of error and a reason for
why the numbers are not adding up in absolute numbers. Yet, the results are assumed to
provide indications about the relative sectoral composition of labour.
81 It must be noted that there are more discrepancies, however these are within the same sector (for instance manufacturing) in industries where all sectors are classified as petroleum dependent. To deal with such discrepancies, the industry classifications are simply added together; hence this is not a source for errors in the dataset.