Embed Size (px)
Citation preview

Norway’s new jobs in the wake of the digital revolutionStefan Fölster
Director of the Reform Institute

2
Report
A large number of jobs are likely to be rendered obsolete by the forces of automation, robotization or digitaliza-tion. But technology also helps create new jobs or even entirely new occupations. Some of these are necessary to build new digital infrastructures, others may arise due the wider impacts of digitalization or rising incomes. The creation of new jobs can also depend on how economic policy responds to automation.
Previous reports for Norway indicate that a third of cur-rent jobs are in occupations with a high risk of automation over the coming two decades, somewhat fewer than in many other countries, but still a large number. But how many new jobs are created?
To assess the net effects of automation and new job crea-tion on the labour market an empirical method has been developed that combines experts’ assessment of the effe-cts of technology with a statistical analysis of Norwegian labour market dynamics in recent years.
This report builds on an earlier Swedish study of automa-tion risk that the SSF published in the summer of 2015. There it was concluded that automation during the period 2006-2011 has actually already taken place at a high rate of about two percent per year. Over the course of five years, every tenth job had been automated. But new jobs were also created at a similar rate.
According to the estimates in this report Norway has lost 7-9 percent of jobs to automation over the five-year period from 2009-2014, amounting to 166-200 thousand jobs. If this trend continues the share of jobs automated would amount to about 35 percent over a twenty-year period.
But digitalization is also a driver of new jobs. Some of these are filled by the people who develop the new digi-tal technologies, run IT-systems or produce and deliver services that digitalization makes possible. For example, the number of software and applications development specialists increased by 4 700, or 15 percent. According to the analysis new jobs due to digitalization amounted to about 30 000 new jobs or 1,2 percent over five years. Not all consist of digital experts. For example, e-retail trade gives rise to more delivery jobs.
Another driver of job growth is rising incomes that can increase demand for some labour intensive services. Some examples are that the number of building construction workers in Norway increased by 32%, the number of sports- and fitness workers by 26%, the number of oth-er personal service workers by 31%, and the number of veterinary assistents (dyreplejare) by 49%. Overall the analysis suggests that 46 000 jobs, or 2 percent, can be traced to the effect of rising incomes over the 5-year period.
Comparison with other countries suggests that the new jobs created by digitalization or rising incomes could have been larger, or even much larger, in Norway. But they were to some extent crowded out by the surge of jobs in the oil and gas industries and the wider demand these created. The main employment scenario in this report assumes that the underlying growth will not be as strong in the future, merely equal to the population increase of about 0,8 percent a year. Adding to this the net of auto-mation and new job creation due to digitalization and income growth at the same pace as over the years 2009-2014 would imply a significant shortfall of employment growth relative to population growth.
Yet this is not an inevitable outcome. International comparisons indicate that only countries that have failed to meet automation with employment enhancing reforms fail to create a sufficient number of jobs. In contrast, co-untries that have compensated with economic reforms have experienced record employment levels in spite of automation. Even some countries with much industry and a high automation potential, such as Germany, have achieved such a positive outcome.
This report discusses various policy options that can compensate for automation and stimulate new jobs in the wake of digitalization. Norway can hone its innovation policies. A new comparison suggests that Norway ranks 7th in Europe in terms of “brain business” jobs – jobs in knowledge intensive firms. Norway has a smaller share of students in higher education in natural sciences and te-chnology than many European countries. More attempts could be made in line with the push for Grand Challenge innovation competitions that all US public authorities now implement.
Summary
3
Report
Table of content
Summary s. 2.
Automation and the Norwegian labour market s. 5.
Robots and jobs: Evidence from international research s. 7. Recent studies on automation and tasks Research on the effect of robotisation on total employment Polarization of wages The neglected policy response
The jobs that dissappeared s. 13.
The new jobs s. 15.
Consequences for Norwegian productivity and jobs s. 23. Innovation and brain business Consequences for jobs in Norway
Polarisation of employment and wages s. 26.
One agenda for Norway’s digitalization s. 28. Maintain high employment and avoid polarization Use the potential for digitalization of public service Productivity growth - A more effective innovation strategy Macroeconomic policy
References s. 35.
Appendix - Method and regressions s. 38.
4
Report
There is also a potential for a gradual continuing shift from tax on labour to tax on consumption and fixed property. Social insurance systems can be adjusted to improve the employment outlook and to be simpler and more trans-parent for workers in the digital age, many of whom may work with short term contracts rather than in long term employment.
A rarely recognized aspect of digitalization is how it relates to complexity. Automation indirectly leads to new jobs by enabling greater complexity. Thanks to smart computers, many companies can, for example, produce and handle an ever-increasing range of products and services that are to be sold, distributed and serviced. Digitalization also enables increased complexity in the company’s pricing structure, organization, and international engagements. More complex regulations and work processes can be introduced. These involve more administration and le-gal processes. For example, the number of lawyers has increased by 18 percent in just five years in Norway and can be expected to continue to increase. The number of
“administration professionals” (administrasjonsrådgivere) has increased by 26% and was, in fact, the fastest growing occupation of all in absolute terms. Even though this is partly tempered by a decline in the number of office clerks, it suggests that a push for digitalized and efficient admi-nistration might be an important productivity enhancing measure in Norway. Even more important, it may be a crucial strategy to maintain trust in public institutions and welfare services.
The research literature on robotization emphasises how job losses have led to more polarised labour markets in most countries. Norway has so far come out relatively well, with only small changes in the measures of income equality and the share of labour income of GDP. In fact, this is similar in comparable countries as long as the em-ployment rate remains high, but could be a greater pro-blem if employment weakens. Thus reforms that bolster employment can also be the most effective defense for an egalitarian and inclusive society.

5
Report
The terms digitalization, robotization and automation are often used more or less synonomously to characterize the technological revolution that is upending many firms and entire branches. A variety of studies have attempted to assess how labour markets might be affected, most of-ten with a focus on jobs that are lost. A recent Norwegian study concluded that a third of Norwegian jobs are in professions with high (over 70%) risk of being automated over the coming twenty years.1 Similar studies in other countries tend to find even larger impacts.
However, this is only one side of the equation. What new jobs can be created in the wake of automation? This qu-estion has not been investigated as much. Nevertheless, there is a strong presumption among economists that new jobs will replace old ones. At least since the begin-ning of the industrial revolution, new jobs have often been created faster than old jobs have been automated. A key issue is, however, how the demand for different types of labour shifts. A number of studies find that automation risks polarizing the labour market. Demand for people in high wage occupations rises, but jobs in the middle of wage distribution are automated, which forces more people to compete for low wage jobs. A continuation of that trend would be worrisome.
This report analyzes which types of jobs have been lost due to automation in Norway, and which have been crea-ted instead. Three channels are identified through which digitalization can increase the demand for labor. The first is rising demand for those who develop digital techno-logy. The second channel is the extent to which demand increases for people who sell digitized services or whose product or service is indirectly affected by digitization. The third channel is demand growth as a result of rising incomes and lower prices for goods and services (whether directly attributable to digitization or not).
In order to estimate the emergence of new jobs due to digitalization and higher incomes, a method has been applied that resembles that used in previous studies to es-timate the risk of automation. IT and labor market experts
were asked to assess the extent to which demand for dif-ferent occupational groups services and products might be affected. A statistical estimate then tests the predictive value of the experts’ subjective assessments based on a re-cent five-year period. This empirical estimate also forms the basis for a foreward looking scenario. It thus builds on the assumption that the forces of digitization already are at work and have a similar impact in the future.
The results offer surprises, but also some expected pat-terns. Most expected is that routine jobs such as cashier, some industrial jobs, and other routine jobs are auto-mated, while demand for computer technicians and en-gineers grows. However, a rarely appreciated insight is that the increasing complexity of goods and services that digitalization enables seems to give rise to many new jobs.
Another important job generator is rising incomes, in particular for some types of labour intensive occupati-ons. For example, in retail trade for groceries, the share of people working at cash registries and with inventory decreases as more are automated, but this is partially compensated by staff for a growing number of in-store bakeries, delicatessen and the like. Tourism-related ser-vices are increasing, as are some green (environmentally oriented) jobs. An entire list of occupations, their rate of growth or decline, and expected changes are presented in Section 4.
This report also examines how the wage distribution has been affected. Since the 1990s, Norway experienced the same polarization as almost all other countries. There were more jobs in occupations with high wages, and in those with low wages, but fewer jobs in the middle of wage distribution. However, during the period 2009-2014, development was more favourable. The number of jobs in the occupations with the highest wages increased sharply. Clearly, a smaller share of jobs were created in the middle of the wage distribution, but jobs in occupations with the lowest wages have not increased. The labor cost share of GDP is also unchanged since the 1980s.
Automation and the Norwegian labour market
1 Pajarinen, Rouvinen and Ekeland, (2014; 2015).
6
Report
In Norway, and some other countries, the effects of di-gitalization so far have been less problematic than in many other countries. Norway received a great boost to the demand for labour as the oil- and gas sector expan-ded during the early years of this millennium. Over the last few years, however, there is a declining trend from a high level.
Generally, countries have handled digitalization well when they have reacted with extensive growth and em-ployment reforms. Examples are Germany, Sweden, the Netherlands or Switzerland have seen positive labour market development after reforms.
7
Report
“We are being afflicted with a new disease of which some readers may not have heard the name, but of which they will hear a great deal in the years to come,” John Maynard Keynes wrote almost a century ago, ”namely, technolo-gical unemployment.”2
Today again gloomy predictions about adverse conse-quences of digitalization on the labour market attract much attention, most famously Brynjolfsson and McA-fee’s book ”The Second Machine Age” (2014) or Ford’s
”The Rise of Robots” (2016). Bolstering such concerns, a range of low-skill and medium-skill occupations exposed to automation have suffered employment declines and sluggish or even negative wage growth.3
Over the past two decades quite a number of empirical studies have attempted to analyze the effects of automa-tion on the labour market, often trying also to separate these effects from those of globalization. Viewed super-ficially, the results of these studies appear quite contra-dictory. Some sense can be made of the differing results by sorting out exactly what question the various studies focus on. This chapter gives an overview emphasizing recent studies and their different vantage points.
A common lacuna in virtually all the empirical studies is that they generally claim to investigate the effect of, or correlation, between some measure of new techno-logy and employment. But then they fail to point out that when new technology threatens jobs, there is often a policy response. This can come in the form of national labour market reforms, other growth inducing reforms, or in the form of sectoral or regional stimulants. Even branches or individual firms can respond and change their strategy. The employment effect that studies regis-ter is therefore usually the net effect of new technology and policy responses. The crux is that policy responses may differ widely between countries, branches or regions, leading to wildy different outcomes.
Recent studies on automation and tasks
Much research attempts to estimate job displacement due to automation. Most spectacularly, Frey and Osborne (2013), classified occupations by how susceptible they are to automation and concluded that 47% of US workers are at risk in the next 20 years. The starting point for Frey and Osborne’s study is a research literature launched by Autor et al. (2003), where work content has been clas-sified in order to assess potential for computerization. However, Frey and Osborne do this much more detai-led than previous studies using the US O*net database. This contains a careful mapping of the chores for each occupation, originally used to assess the extent to which people with different disabilities can continue to work in their occupations.
Based on this description, eight dimensions were identi-fied where computers have difficulty coping. These are listed in the table below.
Skills that are difficult for computers or robots to take over, according to Frey och Osborne, based on the American database of tasks within each profession, O*NET.
• Finger Dexterity: The ability to make precisely coordi-nated movements of the fingers of one or both hands to grasp, manipulate, or assemble very small objects.
• Manual Dexterity: The ability to quickly move your hand, your hand together with your arm, or your two hands to grasp, manipulate, or assemble objects.
• Cramped Work Space, Awkward Positions: How often does this job require working in cramped work spaces that requires getting into awkward positions?
• Originality: The ability to come up with unusual or clever ideas about a given topic or situation, or to de-velop creative ways to solve a problem.
Robots and jobs: Evidence from international research
2 Keynes (1930).3 E.g. Autor et al. (2003), Goos and Manning (2007) or Michaels et al. (2014).

8
Report
• Fine Arts: Knowledge of theory and techniques requi-red to compose, produce, and perform works of music, dance, visual arts, drama, and sculpture.
• Social Perceptiveness: Being aware of others’ reacti-ons and understanding why they react as they do.
• Negotiation: Bringing others together and trying to reconcile differences.
• Persuasion: Persuading others to change their minds or behavior.
• Assisting and Caring for Others: Providing personal assistance, medical attention, emotional support, or other personal care to others such as coworkers, customers, or patients.
Source: Frey och Osborne (2013).
Each occupation is assigned a profile detailing the extent to which they are characterized by these eight bottle-necks for computerization. The next step in Frey and Osborne’s method was to allow experts in ML (Machine Learning) to assess the extent to which different tasks can be taken over by computers over the next two deca-des. Their assessments were then weighed together and applied to the profiles of each occupation.
The results were remarkable in several respects. Swathes of jobs risk being outdated. For example, the occupati-onal group of ”salesmen, retailers, demonstrators” was assigned a high probability of being automated. One example of this is that Google has replaced traditional staff-intensive media advertising sales with automated auctions. According to industry sources, 30-50 percent of advertising sales are expected to happen automatically within the near future.
A similar analysis for Norway and Finland finds that about one-third of jobs are in professions with a high risk (over 70%) of being automated.4 Since this study more or less assumes the same probability of automation for each occupation as Frey and Osborne do, the lower overall risk is mostly a result of a different composition of
jobs in the US on the one hand and Norway and Finland on the other hand.
In a recent Swedish study, the corresponding share of jobs in professions with a risk of being automated is slightly higher, due to differences in the countries’ occupational composition. But the Swedish study also phrased the qu-estion differently.5 Instead of asking which occupations have a greater than 70 percent chance of automation, it assumes that there can be some automation even in oc-cupations with lower risks. Applying risks of automation as probabilities or shares of jobs that might be automated yields the result is that over 50 percent of jobs can be automated within 20 years.
In these projections occupations with shorter educational requirements are more likely to be computerized, while many occupations that require tertiary education and higher wages are on average less affected, or even bene-fit from digitalization, in the sense that, for example, a CEO or a mathematician may become more productive with the aid of computers. However, there are also many exceptions to this generalization. For example, hairdres-sers and personal trainers are less exposed than biome-dical analysts.
More noteworthy, however, is that many white-collar jobs can also fall victim to digitalization. Business eco-nomists (and economists), for example, are attributed a 46 percent probability of being replaced by computers. Even several types of tasks for engineers and technicians can be replaced. However, for both of these groups, digi-talization may also increase productivity which in itself could increase demand.
Other studies have pursued similar approaches. McKin-sey (2016) claims that the statistic for jobs at risk of auto-mation is 45%, and The World Bank estimates that this number for the OECD as a whole is 57% of workers.
Some also point out important limitations to the appro-ach taken in these studies. For example, Arntz et al. (2016), argue that, within an occupation, many workers perform tasks that cannot be automated easily. Taking this into account their estimate for OECD jobs at risk is only 9%.
4 Pajarinen, Rouvinen and Ekeland, (2014; 2015). These authors also provide a very good analysis of the reliability of the Frey & Osborne
approach.5 Also, the different studies divide occupations differently, some dividing them into 300-400 occupations while others, such as the
Swedish study, uses a division into about 116 occupations (based on the 3-digit level). A finer grid has advantages, but also creates
more cases were conversion between countries and redefinitions over time cause problems.
9
Report
Yet this objection is itself open to criticism. For example, they illustrate their results with the example of retail sales persons who have a 92 risk of being automated according to Frey and Osborne. Yet 96% of all retail sales people spend some of their time in group work or face to face customer interaction. Both of these are tasks that Arntz et al. classify as difficult to automate. Yet this argument also illustrates the shortcomings of the task-based approach used by Arntz et al. In digitized retail sales, customers may be much less interested in face to face interaction with sales people. In fact, this has already happened to employees at travel agencies. Most of those spent time talking to customers previously, but have been replaced by digital travel booking.
Still, it is important to be clear about the difference bet-ween jobs and tasks. To the extent that digitalization also increases demand for new tasks, many people with jobs at risk may not actually lose their jobs. Instead the compo-sition of task within their job can be affected. Also, some people at risk will move into retirement, while young people who enter the labour market more often choose the kinds of jobs for which demand increases in the wake of digitization. Further, even when tasks can be automa-ted, there is no guarantee that firms would replace those workers with robots. That would depend on the costs of automation, and how much wages change in response to this threat. Additionally, even if an industry introduces robots to do specific jobs, productivity improvements may create new jobs in the firm, or other occupations might be able to expand.
For these reasons it is important to look at studies that examine the actual effect that automation has on aggre-gate employment.
Research on the effect of robotisation on total employment
Some, less serious, studies exaggerate the effects on employment or deny them entirely.6 In contrast, one of the most carefully conducted recent studies is that by Acemoglu and Restrepo (2017), examining evidence that industrial robots reduced employment and wages
between 1990 and 2007. In this case, robots are more narrowly defined than wider digital technologies. Over the period industrial robots increased fourfold in the US and Western Europe.
The exposure to robots is defined as the sum over in-dustries of the national penetration of robots into 19 industries, multiplied by the employment share of that industry in that labour market.
The results show a strong relationship between a commuting zone’s exposure to robots and its employ-ment rate. In the areas most exposed to robots, between 1990 and 2007 both employment and wages declined in a robust and significant way. During this period, the authors estimate that, relative to other areas, the introdu-ction of one new robot per 1,000 workers in a commuting zone reduced the local employment-to-population ratio by 0.37 percentage points and local wages by 0.73%. This is equivalent to 6.2 workers losing their jobs for every robot.
Although these numbers suggest that exposed commuting zones are doing worse than the rest in terms of employ-ment and wages, they do not necessarily reflect the US-wide effects of robots. The adoption of robots in one commuting zone could lower production costs, and via trade, enable other industries to create employment in the rest of the economy. Yet controlling for this effect as well as overall capital intensity and IT capital, or exposure to globalization, does not change the results much.
The employment effect is strongest for routine manual, blue collar, assembly and related occupations, and for workers without college education. But no one, it seems, has escaped entirely. The negative effects are surprising, because of the small offsetting employment increases in other industries and occupations. So far, there are rela-tively few robots in the US economy, and so the number of jobs lost due to robots has been limited to between 360,000 and 670,000 jobs. If the robots spread as predic-ted, future aggregate job losses will be much larger, but not unmanageable according to the authors.
6 For example Atkinson (2017) denies any effect of automation based on an analysis of the U.S. Bureau of Labor Statistics’ (BLS’s) em-
ployment projection data series for 2014–2024, without realizing that those projections are made by an algorithm that does not incor-
porate effects of digitalization. In another study Atkinson and Wu (2017) claim that robots have no effect on the labor market because
the rate of ”churn” between occupations is lower than since the 1870ties. This argument fails to take account that there are many more
occupation categories for industry than for services. Thus, occupational churning appears statistically more common when industry
was a larger share of the economy.

10
Report
Polarization of wages
David Ricardo, most famous for his book from 1817 on the theory of welfare gains from trade, already described that some forms of capital-intensive technology development can actually lower real income for workers. Some empi-rical studies also find that this may have taken place.7
More importantly, however, technology may benefit groups with different skills and education differently. In many countries in the western world, the pay gap has increased between well-educated and less educa-ted people. Research in recent years strongly supports the notion that much so-called ”skill-biased technical change” has occurred over the past decades.8 A recent study by Peter Cappelli, of the University of Pennsylva-nia, also concludes that the push for higher education in many developed countries does not create enough jobs to absorb the growing number of people with higher education. These tend to compete with those who have poorer education.
Some research already documents polarization. For example, Goos, Manning and Solomon recently showed in the American Economic Review that middle-level jobs sharply decreased between 1993 and 2010 in all the co-untries surveyed and in the Nordic countries by around 9 percentage points. More people have well-paid jobs, but more are also forced to choose between unemployment and low-paid jobs.9
In addition, the wage share of GDP has fallen in many co-untries. Some studies also argue an interesting explana-tion based on digitalization. Of 56 countries studied by Karabarbounis and Neiman (2012, 2013), in two of the most elaborate studies of wage development between 1975 and 2012, 38 had a decreasing wage share of GDP. A reservation is that the wage share is fraught with measu-rement problems. Conversions of the National Accounts in the United States and the United Kingdom in recent years have, for example, led to a fairly large downward adjustment of the profit share, after taking into acco-unt that some of the profits are provisions for employee future pensions.
Particularly interesting, however, is that Karabarbounis and Neiman find that a large part of the increasing pro-
fit share has occurred as a result of a marked decline in prices for investment products - a consequence of new technology and, to some extent, globalization.
For example, cheaper industrial robots would lower a company’s investment costs in the short run, which can explain a higher profit share. Cyclical upturns may not entail equally large investment booms. Investments are also more often be in robots, which means that demand for at least some types of labor does not increase as much over a business cycle. Consequently, cyclical upturns may be weaker - a possible explanation for what some economists describe as ”secular stagnation” - as well as a long-term less advantageous competitive situation for labour, which is replaced by machines more easily.
The neglected policy response
All the studies described above that analyze the employ-ment effects of automation ignore the likelihood that any automation that threatens jobs may elicit a policy response to mitigate the consequences for people who are threatened by technological unemployment. Such policy changes may consist of changes in national or local taxes that affect the cost of labour. They may consist of changes in labour regulation that affects indirect costs. Trade unions may react by agreeing to more flexible or cheaper collective bargaining agreements. Taxes and re-gulations can also be changed in ways that make it easier for new business start-ups or investments that increase the demand for labour.
Studies that look at country-wide, regional or bransch-le-vel employment effects of automation should therefore be interpreted as analyzing the net effect of automation and policy responses. For example, Autor and Salomons (2017) claim in a noted paper “Robocalypse now” that new technology actually creates more jobs than it destroys. In fact, their paper does not show this at all. They do not specifically analyze the effect of digital or any other new technology, but rather the effect of productivity growth on overall employment in countries, taking account of spillover effects that occur, for example because produ-ctivity growth gives rise to higher real incomes which leads to higher demand in other parts of the economy.
While it is crucial to analyze the economy-wide employ-
7 Se t.ex. Acemoglu m.fl. (2003).8 Se t.ex. Krusell m.fl. (2000).9 Autor and Salomons (2017) also show the polarization effect, most pronounced in the US.

11
Report
ment effect – which is also the gist of this report – Autor and Salomon’s conclusion misleads. Productivity growth is clearly not just an effect of new technology, but also of growth-enhancing economic policy reforms, and possi-bly, business cycle effects. A more correct formulation of their conclusion would be that countries that with some unknown mix of adopting new technology and growth-enhancing reforms have achieved higher pro-ductivity growth, have also experienced employment increases.
A study like Acemoglu and Restrepo’s (2017) described above might be less susceptible to this point since it uses commuting zones as its unit of observation. But even municipalities control a number of policy instruments that can be adjusted in response to rising unemployment, for example training programs, local regulation and lo-cal bureaucracy affects local business and may become more growth-promoting in response to robot-induced job losses.
If the policy response to automation were more like a law of nature, it would be easy to interpret much research as simply estimating the net employment effects of auto-mation. In fact, though the policy response may differ widely depending on political circumstances, voter’s to-lerance to unemployment increases, and the economic competence of governments to choose effective policy responses.10
For these reasons one might expect that countries handle the consequences of automation quite differently and achieve different outcomes. This is in fact what appears to have happened.
For example, the employment rates in countries that have reformed actively such as Germany, Australia, Canada, the Netherlands, Switzerland, Sweden or the UK have held up well or even improved. In contrast, the employment rates of countries that have not reformed in employment-promoting ways such as France or Italy have deteriorated.
The employment rate in Germany (yellow), UK (red) and France (blue) and Italy (Orange) (This diagram should be redrawn with country labels on the lines)
The employment ratePer cent. Age 15-74
Source: Macroband/Eurostat
Even the United States’ dismal employment development in the 21st century fits the pattern in the sense that the United States has not improved its business environment for many years. The corporate tax rate is high compared to other countries. The regulatory burden and complexity of many regulatory systems afflict many investments. Expenses for employers’ taxes and health premiums have increased, when they have fallen in many other countries. In the so-called Economic Freedom Index, the US has slowed down, and is now far behind, for example, Canada.
Remarkably the USA has experienced a sharp decline in employment rates in the 2000s, which has dropped from about 74 percent to 67 percent, starting well before the financial crisis broke out in 2006. The EU’s employment rate, on the other hand, has risen marginally, despite the financial crisis and southern Europe’s problems. The chart below shows the employment rate in the US and the EU.
10 In addition, whether a country has a fixed or flexible exchange rate could make a big difference to the effect of automation on
the labour market.

12
Report
Employment rate Per cent. Age 15-65
Source: Macrobond/Eurostat

13
Report
Frey and Osborne (2013) calculate how different occupa-tional groups risk being replaced by digital technology using US vocational codes. These must first be transla-ted into occupational codes used in Norway. How this is done is described in the appendix. There are several issues to take account of. In particular, the occupational division at the so called 4-digit level does not match very well. Therefore, we focus on a division into 114 occupa-tions that cover 2 473 000 Norwegian jobs (in 2014) at the 3-digit level.
After conversion, the average automation risk (20 years) for all occupations is 53 percent.11 But somewhat fewer (47%) in the US, and (33%) in Norway work in occupations with a high (over 70%) risk of automation.
Automation is already in full progress
A good test of the automation risk forecast is to investi-gate whether it is already happening. This also gives a good picture of how the Norwegian labour market has changed in recent years.
For this estimation we have focused on the period 2009-2014, the latest possible with current occupational sta-tistics from Statistiska Sentralbyrån.12 This is a period during which many countries were hit by a financial crisis, but Norway remained fairly stable.
Among the jobs that have decreased the most in absolute terms are retail trade personell, farmers, various types of industrial workers especially in the printing trade and general office clerks (although the latter is more than matched by a rise in administrative professionals).
Since the estimates of automation risk used by Frey and Osborne are based on expert judgements, they are fraught with considerable uncertainty. The method used here
is in many ways more accurate. It uses the automation risk percentages merely as what econometrician’s call a
“proxy” variable, which can contain considerable measu-rement error. As long as this measurement error is not systematic, regression estimates will still be valid.
The regression estimates are reported in the appendix. They capture how well the automation risk according to Frey and Osborne explains employment change in occupations. In the table below, the regression results have been converted to percentages.
During the five years included in the estimation, the ave-rage employment rate drop due to automation was 8,5-9 percent depending on how the regression is designed. If automation were to continue at the same rate, 34-36 percent of jobs would be automated within 20 years. A variety of additional control variables have been tested but hardly affect the results, and therefore are therefore not reported. The variable that made the biggest differen-ce is the percentage of young people in each occupation.13
Percent of jobs that have been lost due to automation during 2009-2014, and that might be lost if the trend is extrapolated over 20 years, according to regressions shown in the appendix.
2009-2014 Over 20 years
Without controlling 8,5 34 for share of youths
After controlling for 9 36
the share of youths
In summary, estimates of the employment loss already associated with automation risk are quite well in line with the previous forecasts for the percent of Norwegi-
The jobs that dissappeared
11 And similar when weighted by the number of persons in each occupation.12 The subsequent years from 2015 do not include self-employed, and can therefore not be compared to occupational statistics
for the years up until 2014.13 In the Swedish estimations this variable made a bigger difference. This could be because Sweden implemented a range of job-
creating measures that reduce employer and tax deductions which had the greatest impact on young people, while at the same
time young people are overrepresented in occupations with much automation.

14
Report
an jobs that have a higher risk than 70 percent of being automated over the coming 20 years.
So far this analysis focuses only on jobs that are lost. In the next section we will investigate what new jobs are taking their place and why.
15
Report
The digital revolution should also give rise to many new jobs, and not just for programmers, system developers, game developers and the many other fairly specialized computer specialists. Unfortunately, the research lite-rature gives sparse guidance on what kinds of new jobs might arise. For example, the two most often cited labor market researchers on this question are Levy and Mur-mane at Harvard and MIT (Massachusetts Institute of Technology) in spite of the fact that they as late as in 2004 mistakenly claimed that car driving could never be automated. In recent years they argue that human work will only be about three kinds of tasks: solving new problems, work with new information, and performing non-routine manual work.14
This is a very sweeping description of what types of po-tential new jobs might replace those that are lost. In order to arrive at a description that can be operationalized at an occupational level and empirically evaluated, a more specific categorization is needed. As a starting point, con-sider several categories of jobs that digitalization may deliver.
The creators of digital technology
Computer specialists are already a large occupational category, and can be expected to grow significantly. Many of them appear in an occupational category “software and applications developers and analysts” (code 251). In 2014 there were about 37 000 of these in Norway, after swelling by 15 percent over the previous five years. In fact, this oc-cupation is on 11th place in terms of (absolute) growth of jobs over the five-year period (but on 20th place in terms of the number of jobs in 2014). By way of comparison, it is the eighth most common occupation in Sweden, where it has also grown faster than in Norway. In addition to software developers one would expect rising demand for engineers, scientists and other categories of people who construct and build digital hardware.
Digital platform and systems jobs
Many new jobs are created when companies create and
use new digital platforms. These include, for example, those working on Spotify, Google, or Finn.no. In some cases, like Spotify, there are quite a few people who cre-ate and maintain the digital platform. In other cases, for example an e-commerce company, even more jobs might be created for distribution and delivery to custo-mers which in most cases is a new service replacing a task that shoppers perform themselves when they visit a traditional shop. Therefore, many jobs that are created in the wake of digitalization are not themselves digital or require any digital competence.
Jobs created indirectly by digital technology
An important consequence of digital technology is that it is much easier to manufacture and distribute much greater variety and individualised products and services. All these then need to be serviced and and require spare parts. In many cases, this range of ”customized” products and services is an added value for the consumer. In some cases, variation may be created merely for marketing purposes.
As a consequence, more jobs may be created. For example, greater diversity of products may require more people who market, sell, install and service. In many countries this has also given rise to an increase in sales persons, but not in Norway.
Another mechanism is that digitization enables hand-ling a more complex regulatory framework. As a result, more administration may be demanded by authorities and also by management in private firms. For example, demands for documentation in health care and schools have generally increased. When the magazine “Chef” asked 963 executives about how much time they spent on administration, most complained about burgeoning paper work and documention in all the various IT-sys-tems that seem to occupy a great deal of managers’ time.15.
Nearly every third boss says they spend more than half their working hours on administration. Perhaps for that reason the occupational category “Managing Directors and Chief Executives” (Administrerende direktører) has
The new jobs
14 Levy and Murnane (2004, 2013).15 This is a Swedish magazine, but the managers queried operate in all nordic markets. Described in Svenska Dagbladet 1. March 2015,
p. 22.
16
Report
increased with 15 percent over the years 2009-2015.
Another occupation that might be expected to increase because of increased complexity are the number of pe-ople in legal professions. These have increased with 21 percent, or about 1 300 to about 7 400 in 2014. Digitali-zation enables firms to operate in many more countries, but has also allowed government regulators to increase the volume of regulation and required documentation. These trends may be one reason for a growing number of lawyers.
The most remarkable change in Norway over the years we analyse is the mushrooming of “administration pro-fessionals” (administrasjonsrådgivere). In fact, this is the occupation that has increased more than most in Norway in percent, by 26 percent, or by some 18 000 jobs to re-ach 70 000 in 2014. In fact, this has been the occupation with the largest growth in the number of jobs in Norway. Within this group the largest subgroup “2422 Høyere saks-behandlere i offentlig og privat virksomhet” has grown the most, with 29 percent. This is somewhat mitigated by a decline in office clerks.
While such increases in the number of lawyers and ad-ministrators could partly be driven by digitalization and its effects on complexity, they can also indicate that the potential of digitalization to automate administration has not been exploited sufficiently.
Jobs that are created due to rising incomes
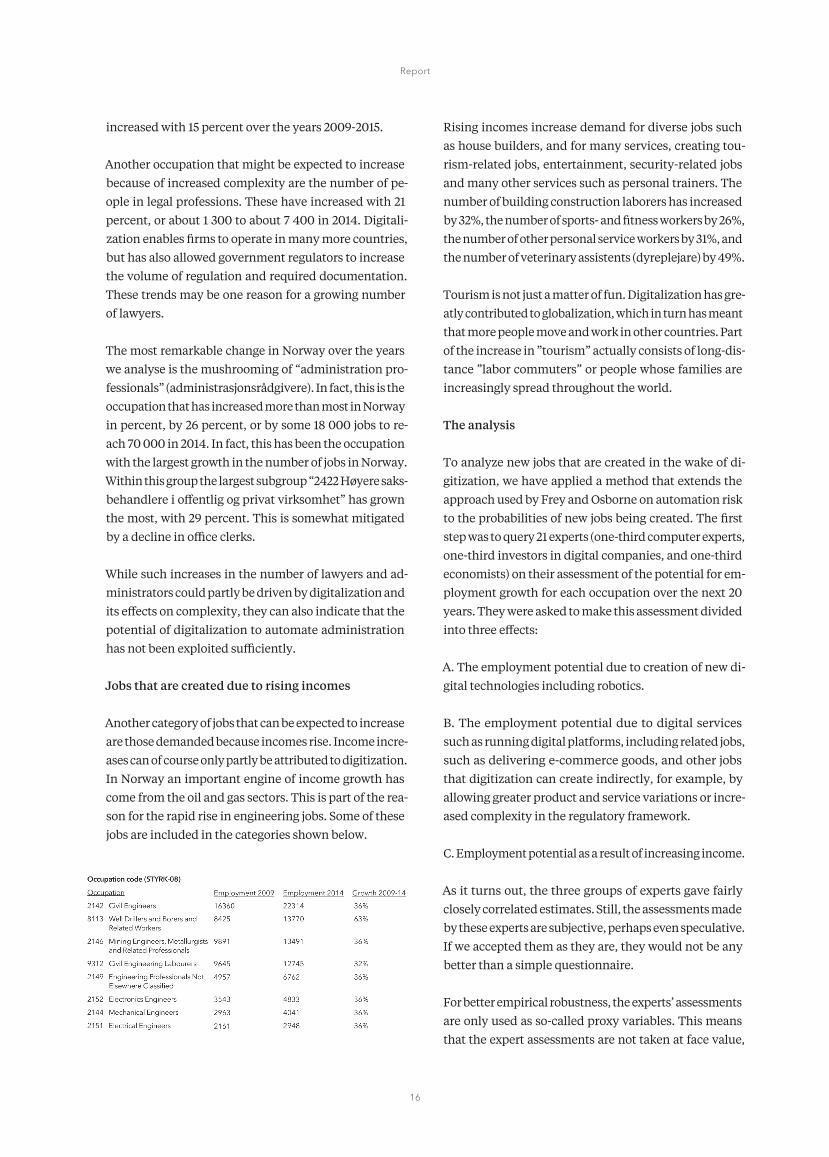
Another category of jobs that can be expected to increase are those demanded because incomes rise. Income incre-ases can of course only partly be attributed to digitization. In Norway an important engine of income growth has come from the oil and gas sectors. This is part of the rea-son for the rapid rise in engineering jobs. Some of these jobs are included in the categories shown below.
Rising incomes increase demand for diverse jobs such as house builders, and for many services, creating tou-rism-related jobs, entertainment, security-related jobs and many other services such as personal trainers. The number of building construction laborers has increased by 32%, the number of sports- and fitness workers by 26%, the number of other personal service workers by 31%, and the number of veterinary assistents (dyreplejare) by 49%.
Tourism is not just a matter of fun. Digitalization has gre-atly contributed to globalization, which in turn has meant that more people move and work in other countries. Part of the increase in ”tourism” actually consists of long-dis-tance ”labor commuters” or people whose families are increasingly spread throughout the world.
The analysis
To analyze new jobs that are created in the wake of di-gitization, we have applied a method that extends the approach used by Frey and Osborne on automation risk to the probabilities of new jobs being created. The first step was to query 21 experts (one-third computer experts, one-third investors in digital companies, and one-third economists) on their assessment of the potential for em-ployment growth for each occupation over the next 20 years. They were asked to make this assessment divided into three effects:
A. The employment potential due to creation of new di-gital technologies including robotics.
B. The employment potential due to digital services such as running digital platforms, including related jobs, such as delivering e-commerce goods, and other jobs that digitization can create indirectly, for example, by allowing greater product and service variations or incre-ased complexity in the regulatory framework.
C. Employment potential as a result of increasing income.
As it turns out, the three groups of experts gave fairly closely correlated estimates. Still, the assessments made by these experts are subjective, perhaps even speculative. If we accepted them as they are, they would not be any better than a simple questionnaire.
For better empirical robustness, the experts’ assessments are only used as so-called proxy variables. This means that the expert assessments are not taken at face value,
17
Report
but tested and calibrated using actual data over the years 2009-2014.
It turned out that the experts saw a potential for employ-ment creation due to new digital technology (category A above) only in a handful of occupations (where they were judged to be significant, however). Therefore, we combined category A with with B under the label ”digital workers”. This leaves us with two variables to explain the growth of new jobs. New net job creation can of course occur in many occupations for other reasons that are difficult to know beforehand. In the regression analysis these are captured by the random error.
Thus, we estimate a regression equation with the employ-ment increase 2009-2014 as dependent variable, and as independent variables automation risk (from Frey and Osborne), the experts’ assessment of employment poten-tial for digital workers, the experts’ assessment of the em-ployment potential due to higher incomes, and the share of young people in each occupation. The latter was an important variable in the Swedish context, probably be-cause of a number of tax deductions and other programs aimed at youth unemployment. But in the Norwegian analysis the youth share turns out to be inconsequential.
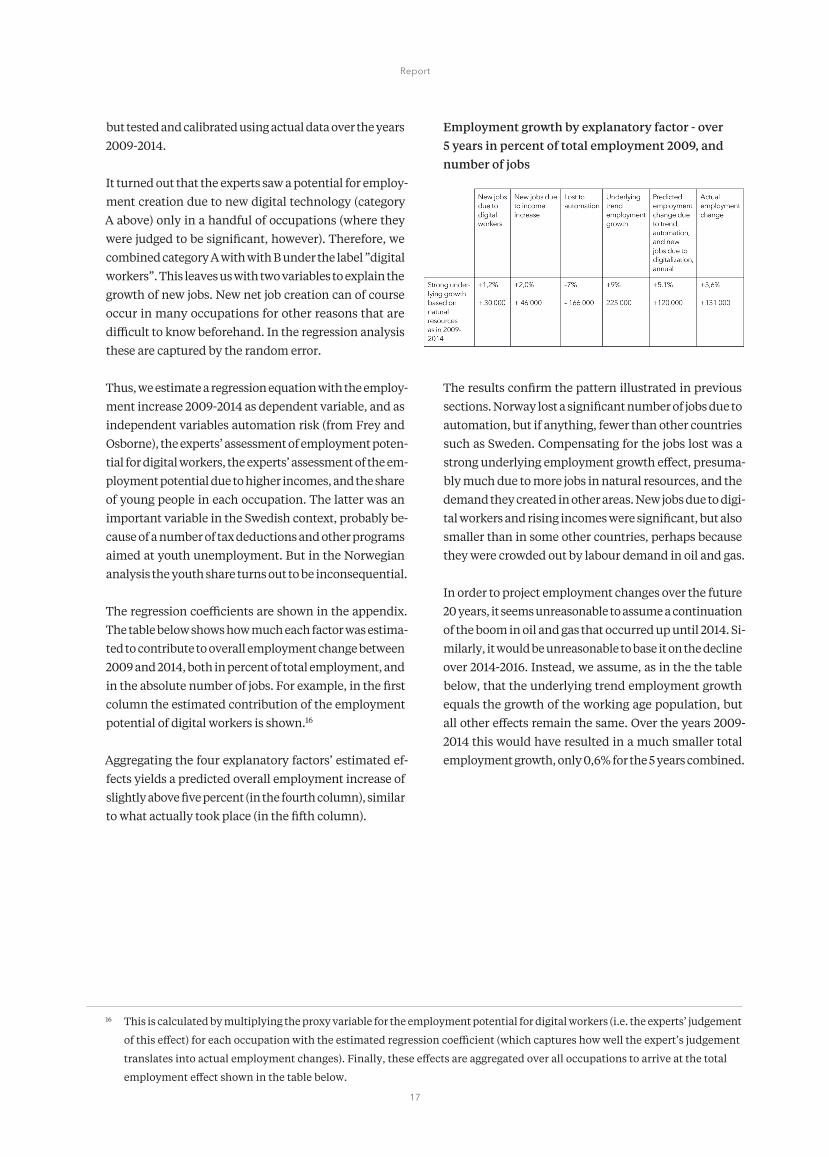
The regression coefficients are shown in the appendix. The table below shows how much each factor was estima-ted to contribute to overall employment change between 2009 and 2014, both in percent of total employment, and in the absolute number of jobs. For example, in the first column the estimated contribution of the employment potential of digital workers is shown.16
Aggregating the four explanatory factors’ estimated ef-fects yields a predicted overall employment increase of slightly above five percent (in the fourth column), similar to what actually took place (in the fifth column).
Employment growth by explanatory factor - over 5 years in percent of total employment 2009, and number of jobs
The results confirm the pattern illustrated in previous sections. Norway lost a significant number of jobs due to automation, but if anything, fewer than other countries such as Sweden. Compensating for the jobs lost was a strong underlying employment growth effect, presuma-bly much due to more jobs in natural resources, and the demand they created in other areas. New jobs due to digi-tal workers and rising incomes were significant, but also smaller than in some other countries, perhaps because they were crowded out by labour demand in oil and gas.
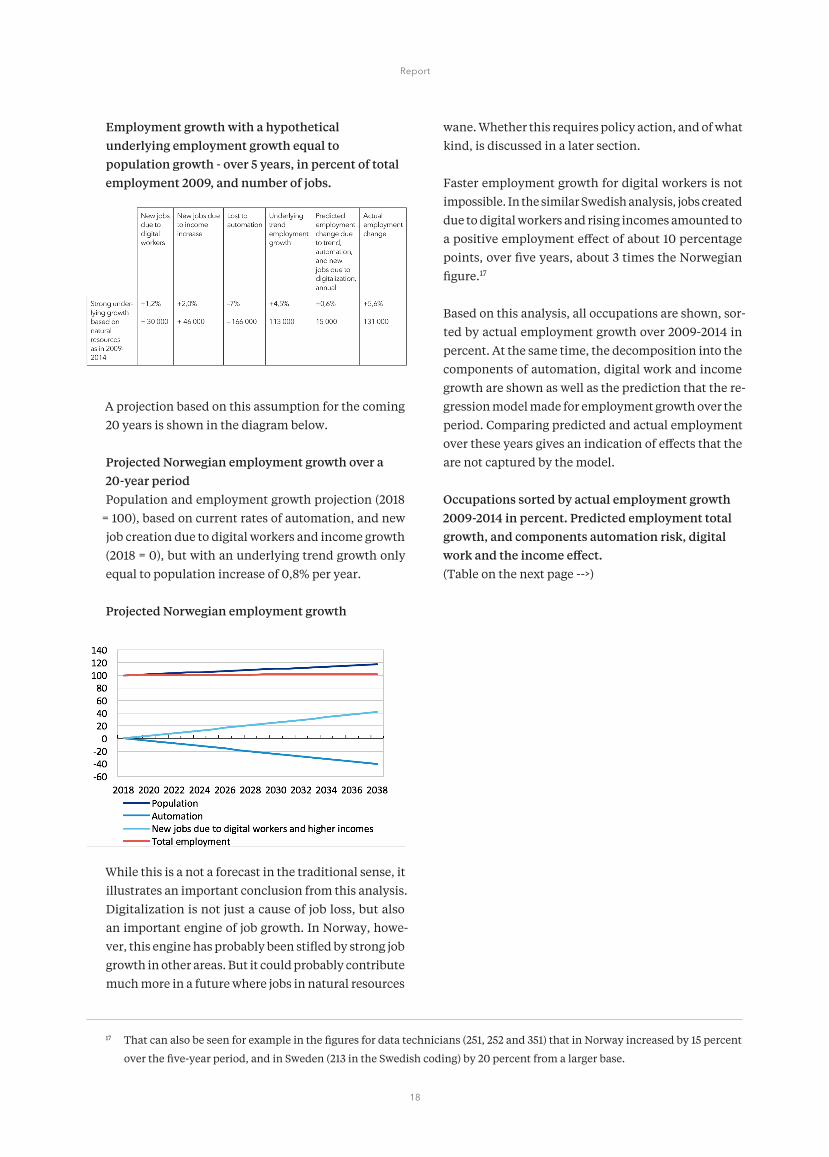
In order to project employment changes over the future 20 years, it seems unreasonable to assume a continuation of the boom in oil and gas that occurred up until 2014. Si-milarly, it would be unreasonable to base it on the decline over 2014-2016. Instead, we assume, as in the the table below, that the underlying trend employment growth equals the growth of the working age population, but all other effects remain the same. Over the years 2009-2014 this would have resulted in a much smaller total employment growth, only 0,6% for the 5 years combined.
16 This is calculated by multiplying the proxy variable for the employment potential for digital workers (i.e. the experts’ judgement
of this effect) for each occupation with the estimated regression coefficient (which captures how well the expert’s judgement
translates into actual employment changes). Finally, these effects are aggregated over all occupations to arrive at the total
employment effect shown in the table below.
18
Report
Employment growth with a hypothetical underlying employment growth equal to population growth - over 5 years, in percent of total employment 2009, and number of jobs.
A projection based on this assumption for the coming 20 years is shown in the diagram below.
Projected Norwegian employment growth over a 20-year periodPopulation and employment growth projection (2018
= 100), based on current rates of automation, and new job creation due to digital workers and income growth (2018 = 0), but with an underlying trend growth only equal to population increase of 0,8% per year.
Projected Norwegian employment growth
While this is a not a forecast in the traditional sense, it illustrates an important conclusion from this analysis. Digitalization is not just a cause of job loss, but also an important engine of job growth. In Norway, howe-ver, this engine has probably been stifled by strong job growth in other areas. But it could probably contribute much more in a future where jobs in natural resources
wane. Whether this requires policy action, and of what kind, is discussed in a later section.
Faster employment growth for digital workers is not impossible. In the similar Swedish analysis, jobs created due to digital workers and rising incomes amounted to a positive employment effect of about 10 percentage points, over five years, about 3 times the Norwegian figure.17
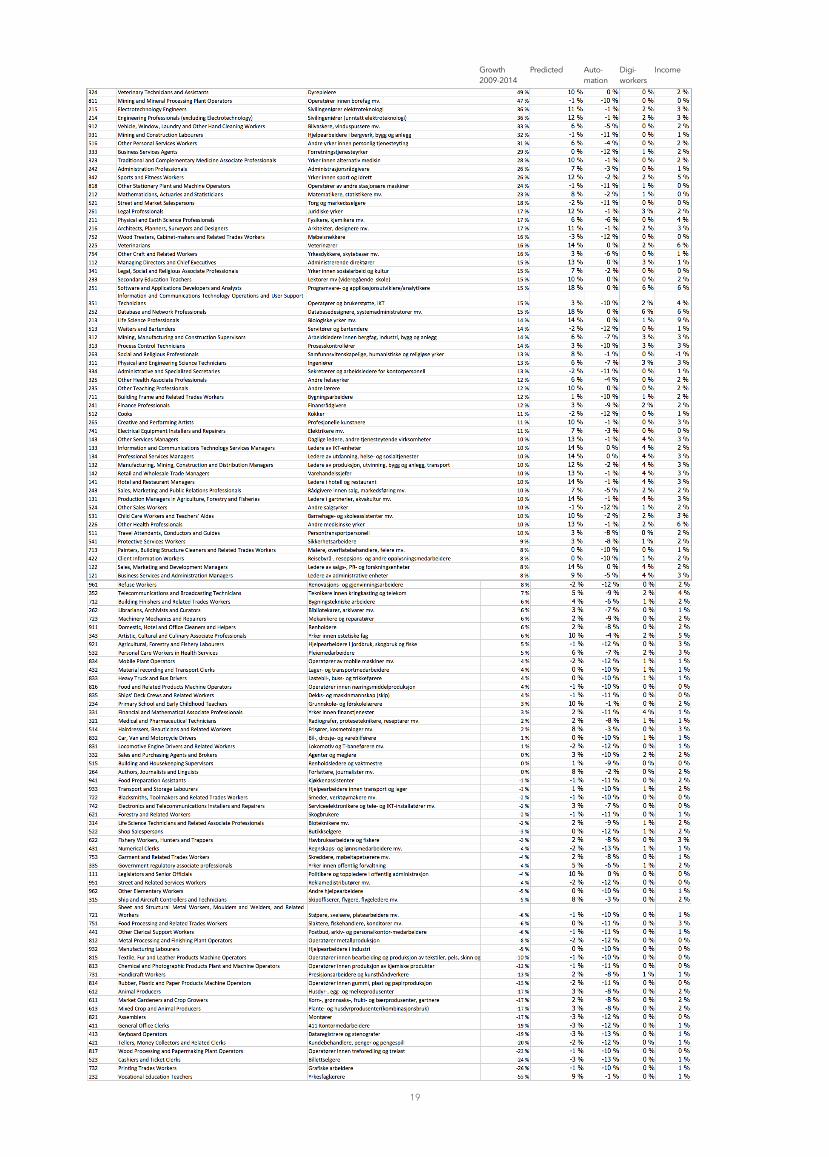
Based on this analysis, all occupations are shown, sor-ted by actual employment growth over 2009-2014 in percent. At the same time, the decomposition into the components of automation, digital work and income growth are shown as well as the prediction that the re-gression model made for employment growth over the period. Comparing predicted and actual employment over these years gives an indication of effects that the are not captured by the model.
Occupations sorted by actual employment growth 2009-2014 in percent. Predicted employment total growth, and components automation risk, digital work and the income effect.(Table on the next page -->)
17 That can also be seen for example in the figures for data technicians (251, 252 and 351) that in Norway increased by 15 percent
over the five-year period, and in Sweden (213 in the Swedish coding) by 20 percent from a larger base.
19
Report Growth 2009-2014
Auto-mation
Digi-workers
IncomePredicted

20
Report
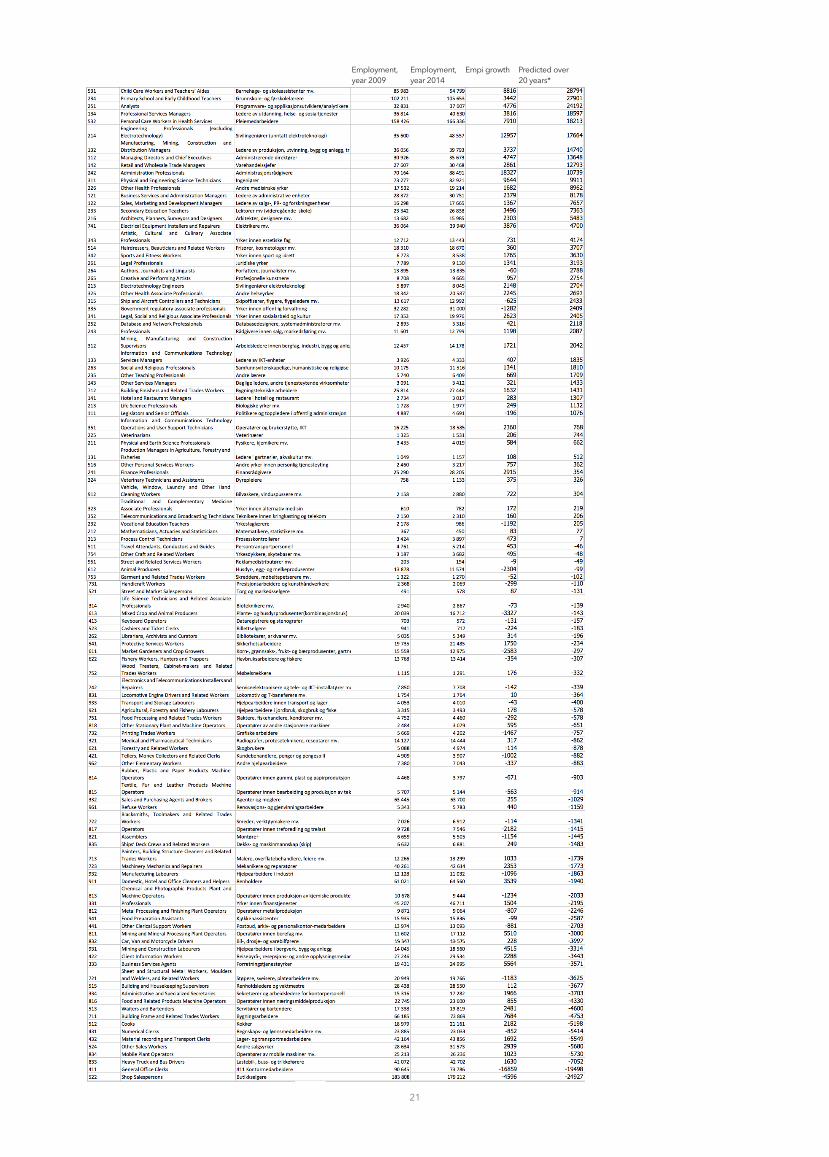
In the table below, the professions are instead sorted by the increase in the number of jobs in absolute num-bers predicted in 20 years based on the scenario in the diagram above. Over a 20-year period this implies a shortfall of jobs relative to population growth. However, these can be compensated by future reforms that are detailed in a later section.
Occupations sorted by predicted increase in the number of jobs over the coming 20 years.(Table on the next page -->)
21
ReportEmployment, year 2009
Employment, year 2014
Empi growth Predicted over 20 years*

22
Report
The predicted changes for some of these occupation probably require a deeper interpretation than can be provided here. One that sticks out should be explained. The number of vocational teachers (Yrkesfaglærere) has decreased significantly, apparently being replaced by regular teachers. The prediction in the table assumes that this trend is halted or even reversed. The Norwegi-an government has taken some steps in that direction.18
18 The Norwegian government announced the so called “yrkesfaglærerløftet” in 2013/14.

23
Report
Prior to industrialization underemployment was com-mon among those who did not have special skills or education. Human labor as such simply did not have much value over long periods. Industrialization created a demand for many with little skills who could operate a machine that competed with skilled craftsmen. In the future, these machines do not need operators anymore. As a result, unskilled human labour may again be hard to sell.
Fears of the consequences of robotization have mostly focused on the supply of jobs. As argued previously, the relevance of such fears cannot be assessed meaningfully without considering how well a country succeeds in lea-ding digitalization rather than being its victim. This in turn will depend on a country’s innovation momentum. Innovation policies may also determine the shape of an even more important outcome of digitalization than jobs
– its importance for productivity growth.
One reason that a country’s innovative capacity becomes more important is that digitalization often is a ”winner takes all” game. Whoever invents and invests first in di-gital platform technologies can quickly take a big chunk of the world market. Even non-platform technologies can be marketed worldwide faster thanks to digitaliza-tion. As a result, there is an unprecedented leverage to innovation, where being first can make a big difference to productivity and income growth. This matters even more for a country’s living standards than the number of jobs. But as Autor and Salomons showed, countries with a higher productivity growth are also better job generators. In this chapter we will therefore look more closely at Nor-way’s innovative potential in the face of digitalization. Then, possible consequences for jobs and equality are discussed.
Innovation and brain business
There are many ways, and a wealth of statistics, to descri-be Norway’s innovative capacity. Many of them examine inputs into the innovation process, rather than outputs
in terms of jobs in advanced business.
Therefore, instead of reproducing this from previous re-ports we draw on a new study “The Geography of Europe’s Brain Business Jobs” analyzes where knowledge intensi-ve business are started or flock and employ.19 These jobs are crucial for income and productivity growth. They also tend to attract even more such jobs. Identifying where talent flocks can be crucial for investors, businesses, as well as people who choose where to live and work. Start-ups and technological breakthroughs are more likely to succeed in countries that become hotspots for creative engineers, programmers, designers and other innovative, knowledge-intensive specialists. Such innovative hot-spots do not arise simply because many people who live there have university degrees, or for that matter, where successful regions have clustered in the past. Instead, hot spots arise where knowledge intensive firms find the best opportunities for future success and growth.
The new report does this by looking at detailed enter-prise employment statistics in 28 different European countries and their respective capital regions, exami-ning how many people work in specialized knowledge intensive companies.
Surprisingly, the geography of brain business jobs in Eu-rope no longer follows a simple division between North and South, West and East. Many countries in Eastern and Central Europe outpace their Southern European fellow EU-members in brain business job intensity. The brain jobs of the former planned economies of Eastern and Central Europe tend to be strongly focused to the capital regions. The Slovakian capital region of Bratislava has the highest share of brain business jobs in all of Europe, despite the fact that Slovakia as a nation has a mediocre concentration of brain business jobs – it ranks 18th amongst 28 European countries.
Consequences for Norwegian productivity and jobs
19 Fölster and Sanandaji (2017).

24
Report
Norway occupies the 7th place in the country ranking of brain business jobs, with 64.5 such jobs per 1000 working age population. In the ranking in this report Norway matches Germany in Tech, is better in IT, and much better in creative professions. But Norway is also uneven and lags far behind in Advanced service brain business jobs.
Score: 1-10, 10 = score of highest ranking capital region.
These statistics do not cover all aspects of Norway’s innovative capacity, but they match other observations that more or less confirm the overall conclusion that Norway does better than most European countries, but probably has an even greater potential.
For example, Norway has a smaller share of students in higher education in natural sciences and techno-logy than many European countries, just above 15% for Norway and above 25% for the European average.20 At the same time Norway appears to have a high and unmet demand for employees with technical educati-on or training according to NHO’s mapping of firm’s labour demand.21
Perhaps because of this unmet demand, and crowding out from the natural resource sector, research and de-velopment investments have stagnated in Norwegian industry at slightly more than one percent of gross pro-duct, while it has increased to around four percent in the other Nordic countries.22 Overall R & D investments in Norway amount to 1,7 percent of GDP, close to the European average and only half of those in the leading country Finland.23
The portion of businesses in Norway that are start-ups is also on the low side compared to other OECD co-untries, whilst the size of start-ups is somewhat larger. But both the EU Innovation Union Scoreboard and the most recent OECD country report for Norway (OECD,
20 Eurostat and NHO (2016).21 NHO’s Kompetansebarometer 2017.22 Official Norwegian reports (2015) and OECD.23 Norwegians also register fewer patents per capita that many Europeans, but actually lead in intellectual property filings for
trademarks and industrial designs.

25
Report
2013) show that only a small number of these evolve into large employers, thus implying that the portion of rapidly growing businesses is lower in Norway than in most OECD countries.24 While Norway scores well (6th place) on the OECD’s measure of how easy it is to start a new business in the “Ease of doing Business” ranking, the OECD also points out that Norway is rela-tively far from best practice in terms of the complexity of regulatory procedures. This corroborates the finding earlier that the number of administrative professionals has risen remarkably in Norway.
All this put together suggests that Norway could prepare itself even better for digitalization by investing more in innovation and easing potential barriers for knowledge intensive firms. The challenge is to attract brain busi-ness in spite of high wages and living expenses.
Consequences for jobs in Norway
Samfunnsøkonomisk analyse AS (1917) extrapolate a forecast of demand for different occupations in line with developments 2003-2014. Their main conclusion is that demand will increase for people with longer education. While this may be accurate, future demand is not de-terministic and not only steered by the requirements of new technology. Economic theory suggests that jobs and occupations change as a result of several factors. Apart from digitalization, what matters is:
A) How demand changes as a result of taste and other social trends.
B) What professions Norwegians choose to educate them-selves in, which determines firm’s ability to produce in Norway.
C) What new goods and services are possible as a result of new technology, and how this changes production costs, and what the demand for these innovations is.
D) How Norwegian companies succeed in competing with others in the world market. Apart from innovati-on this also depends on wage policies, taxes and trade agreements.
Many of these factors are in turn influenced by the way in which education systems, the labor market, tax systems and other organizations are organized in Norway. As an
illustration of how different these factors can play out in countries that are similarly exposed to digitalization, the diagram below compares three high employment countries – Norway, Switzerland and Sweden. Switzer-land has continually reformed in ways that stimulate employment. Sweden has done so more recently, since the crisis of the mid 1990ties, and has gradually returned to high employment. Norway still has a high employment rate, but may need to reform more in order to maintain it.
Employment ratePer cent. Age 15-74
Source: Macroband/Eurostat
Rapid structural change in itself often results in mis-match. People whose jobs are automated may not have education and experience for the new jobs that could be created. A long-term issue may be that many of the jobs that might arise are constrained by limited private wil-lingness to pay. For example, research and development may have large positive external effects, and is therefore partly financed by the state, rather than being a tax base. Likewise, pre-school teachers or nurses are tax financed. An important question in the longer run is therefore how to realize the potential for new jobs that people expect to be tax-financed, at the same time as automation mitigates against high taxes on labour. This is an issue that is acute in Nordic welfare states.
Technological advances and global trends are a challenge for any country that aims to boost productivity growth. But in many countries, the ICT- and globalisation-driven polarisation of the labour market has also resulted in a reallocation of labour to service sectors with lower produ-ctivity and lower wages. A key question is therefore not just how many jobs are created, but also at what wage and how equality is affected.
24 Official Norwegian Reports (NOU).

26
Report
Based on Norwegian wage data for 2016 for each profes-sion the labor force is divided into five quintiles.25 The employment growth for each quintile is shown in the diagram below. The first group contains the occupations with the lowest wages, and the fifth group those with the highest wages.
Total employment growth 2009-2014 for occupations divided into quintiles according to the average wage of their profession.(Group 1 consists of professions with the lowest wage, and group 5 of those with the highest wage)
Total employment growth
Source: Statistiska sentralbyrån and own calculations.
This pattern is similar to that found in many countries, for example by Goos, Manning och Salomons (2013) for the period since the mid-1990ties. Often the weakest growth has been in the third quintile, with higher growth in the first and fifth quintile. Compared to those countries – like the US – the Norwegian shift has been more favourable. By far most job growth has occurred in the high wage groups. Instead the second quintile has seen the least growth.
The changing composition must be put into the context of total employment growth, which was 5,9 percent over the five-year period combined. Since the working-age population grew by a similar amount, the overall em-
ployment rate was fairly stable. In the table below we calculate how much each group changed in size relative to the change in overall employment, both in percent and in actual headcounts.
Group 1 - 2,9% -13 400Group 2 - 4,7% -22 400Group 3 - 3,1% -13075Group 4 5,0% 21900Group 5 5,4% 24400
A common pattern is that countries with a weak labor market seem to see more of a polarizing pattern, while those with stable or improving employment are better able to maintain equality in the sense that the volume of low income jobs does not grow as much. For exam-ple, Sweden experienced more polarization during the 1990ties. But after 2006 overall employment improved and the overall wage group composition changed more in line with the Norwegian pattern.
This is also reflected in studies that analyse the connecti-on between income inequality and the share of working age people in employment. Higher employment rates are a powerful equalizing force.26
One should note, however, that income inequality in the wake of digitalization can also come about indire-ctly as a consequence of induced behavioural change. For example, working hours per person and year have fallen in most countries, but people with higher incomes now work more than others, which accentuates income differentials. One explanation may be that it pays more for high income groups to work more due to a widening productivity gap. This makes it profitable for high inco-me earners to replace leisure with more work, which economist call the substitution effect. Against this, the income effect works the other way around, making it less important to earn more at the margin. Yet, the income effect may have become diluted for the well-paid. Several studies indicate that work has become a status marker, quite the opposite of what was the case when Thorstein
Polarisation of employment and wages
25 For 111 professions at the 3-digit level, comprising about 2,5 million in work. 26 For example, this is shown for the case of Sweden in Bengtsson, Edin och Holmlund (2014).
27
Report
Veblen 1899 wrote his book ”The Leisure Class”. In ad-dition, many of the tasks for better educated have also become more creative and rewarding. Numerous studies show that people with higher incomes perceive their work more fun and spend less time with leisure time at home.
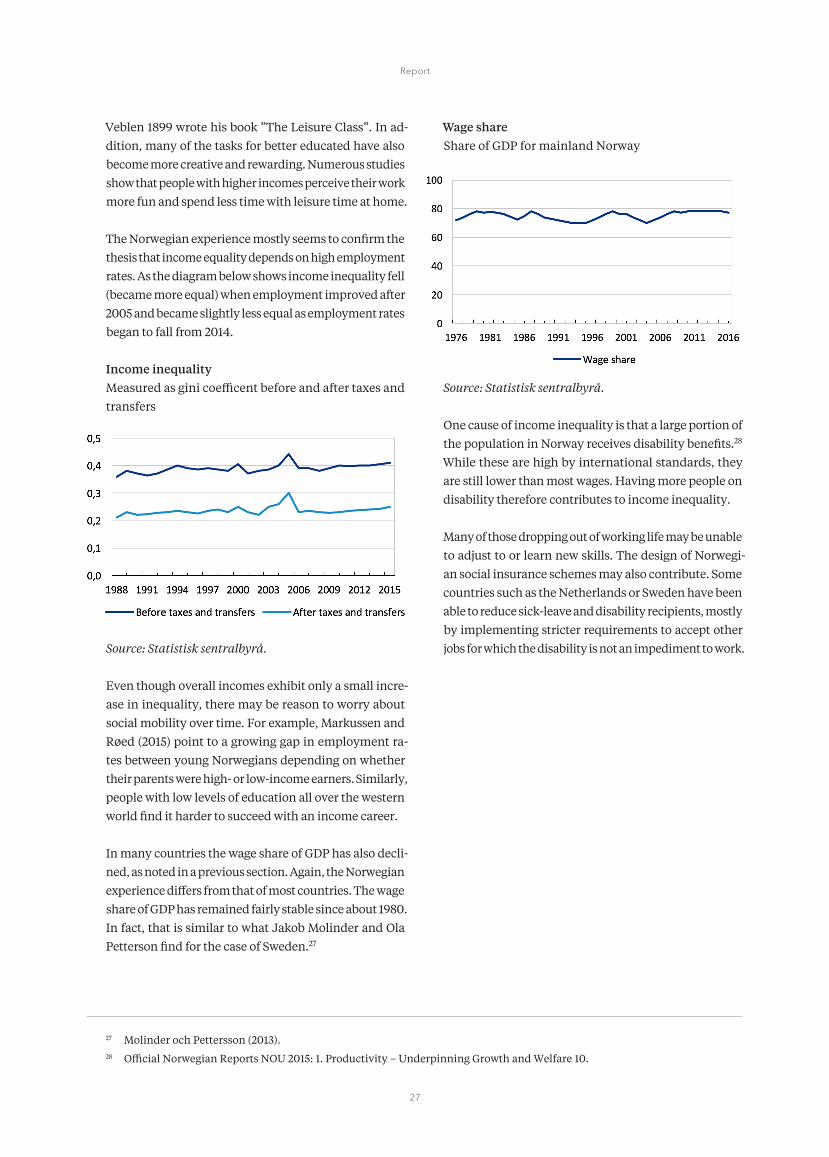
The Norwegian experience mostly seems to confirm the thesis that income equality depends on high employment rates. As the diagram below shows income inequality fell (became more equal) when employment improved after 2005 and became slightly less equal as employment rates began to fall from 2014.
Income inequalityMeasured as gini coefficent before and after taxes and transfers
Source: Statistisk sentralbyrå.
Even though overall incomes exhibit only a small incre-ase in inequality, there may be reason to worry about social mobility over time. For example, Markussen and Røed (2015) point to a growing gap in employment ra-tes between young Norwegians depending on whether their parents were high- or low-income earners. Similarly, people with low levels of education all over the western world find it harder to succeed with an income career.
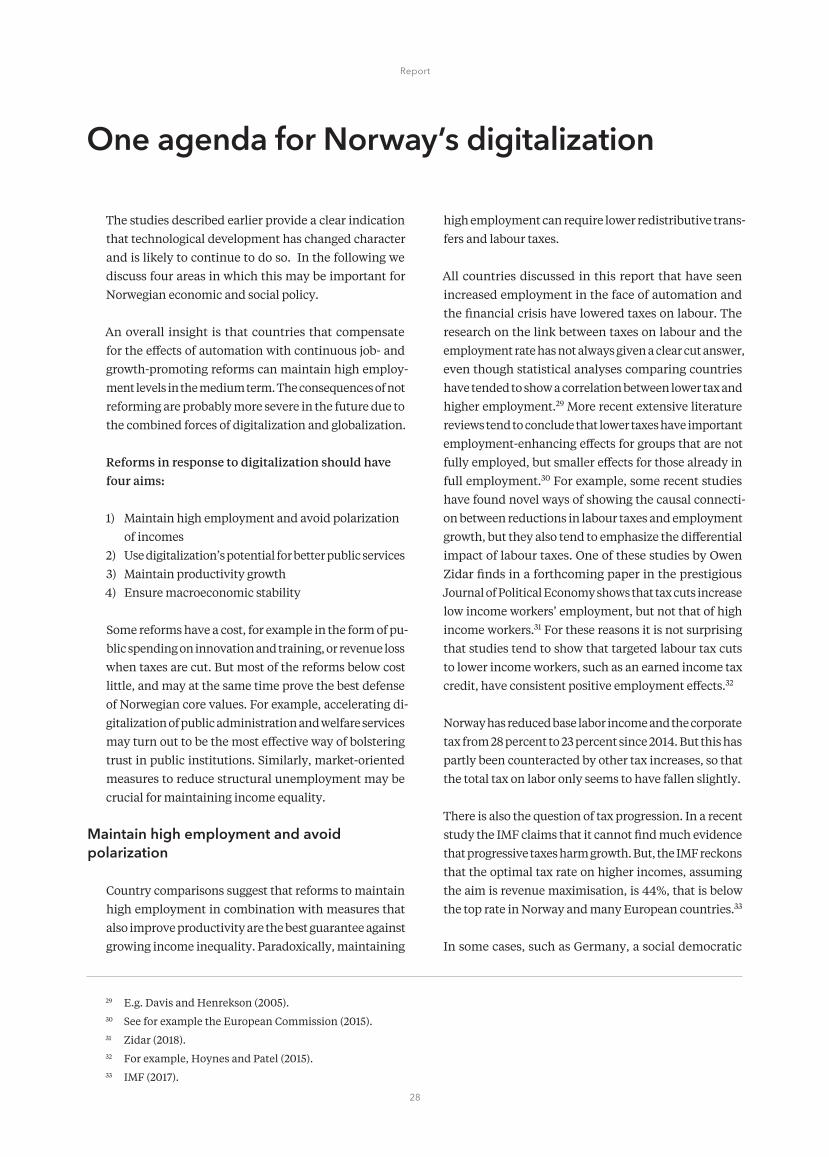
In many countries the wage share of GDP has also decli-ned, as noted in a previous section. Again, the Norwegian experience differs from that of most countries. The wage share of GDP has remained fairly stable since about 1980. In fact, that is similar to what Jakob Molinder and Ola Petterson find for the case of Sweden.27
Wage shareShare of GDP for mainland Norway
Source: Statistisk sentralbyrå.
One cause of income inequality is that a large portion of the population in Norway receives disability benefits.28 While these are high by international standards, they are still lower than most wages. Having more people on disability therefore contributes to income inequality.
Many of those dropping out of working life may be unable to adjust to or learn new skills. The design of Norwegi-an social insurance schemes may also contribute. Some countries such as the Netherlands or Sweden have been able to reduce sick-leave and disability recipients, mostly by implementing stricter requirements to accept other jobs for which the disability is not an impediment to work.
27 Molinder och Pettersson (2013).28 Official Norwegian Reports NOU 2015: 1. Productivity – Underpinning Growth and Welfare 10.
28
Report
The studies described earlier provide a clear indication that technological development has changed character and is likely to continue to do so. In the following we discuss four areas in which this may be important for Norwegian economic and social policy.
An overall insight is that countries that compensate for the effects of automation with continuous job- and growth-promoting reforms can maintain high employ-ment levels in the medium term. The consequences of not reforming are probably more severe in the future due to the combined forces of digitalization and globalization.
Reforms in response to digitalization should have four aims:
1) Maintain high employment and avoid polarization of incomes2) Use digitalization’s potential for better public services3) Maintain productivity growth4) Ensure macroeconomic stability
Some reforms have a cost, for example in the form of pu-blic spending on innovation and training, or revenue loss when taxes are cut. But most of the reforms below cost little, and may at the same time prove the best defense of Norwegian core values. For example, accelerating di-gitalization of public administration and welfare services may turn out to be the most effective way of bolstering trust in public institutions. Similarly, market-oriented measures to reduce structural unemployment may be crucial for maintaining income equality.
Maintain high employment and avoid polarization
Country comparisons suggest that reforms to maintain high employment in combination with measures that also improve productivity are the best guarantee against growing income inequality. Paradoxically, maintaining
high employment can require lower redistributive trans-fers and labour taxes.
All countries discussed in this report that have seen increased employment in the face of automation and the financial crisis have lowered taxes on labour. The research on the link between taxes on labour and the employment rate has not always given a clear cut answer, even though statistical analyses comparing countries have tended to show a correlation between lower tax and higher employment.29 More recent extensive literature reviews tend to conclude that lower taxes have important employment-enhancing effects for groups that are not fully employed, but smaller effects for those already in full employment.30 For example, some recent studies have found novel ways of showing the causal connecti-on between reductions in labour taxes and employment growth, but they also tend to emphasize the differential impact of labour taxes. One of these studies by Owen Zidar finds in a forthcoming paper in the prestigious Journal of Political Economy shows that tax cuts increase low income workers’ employment, but not that of high income workers.31 For these reasons it is not surprising that studies tend to show that targeted labour tax cuts to lower income workers, such as an earned income tax credit, have consistent positive employment effects.32
Norway has reduced base labor income and the corporate tax from 28 percent to 23 percent since 2014. But this has partly been counteracted by other tax increases, so that the total tax on labor only seems to have fallen slightly.
There is also the question of tax progression. In a recent study the IMF claims that it cannot find much evidence that progressive taxes harm growth. But, the IMF reckons that the optimal tax rate on higher incomes, assuming the aim is revenue maximisation, is 44%, that is below the top rate in Norway and many European countries.33
In some cases, such as Germany, a social democratic
One agenda for Norway’s digitalization
29 E.g. Davis and Henrekson (2005).30 See for example the European Commission (2015).31 Zidar (2018).32 For example, Hoynes and Patel (2015).33 IMF (2017).
29
Report
government under Gerhard Schröder implemented a major tax reform that reduced tax rates for labour inco-me across the board (which was then followed up by the famous Hartz reforms). Other countries have focused more on targeted tax reductions. Sweden, for example, implemented tax deductions for household services and a sizeable earned income tax credit, mostly over the years 2006-2010.
Apart from research, the contrast with countries that have increased taxes on labour and suffered, such as France, suggests that gradually lower taxes on at least labour inco-me (at least for some groups) may be a necessary part of the recipe for maintaining high employment levels. This does not necessarily mean that the overall tax burden has to be lowered.
Some argue that taxes on capital could be raised instead, in the form of capital gains tax or a ”robot tax”. Economic research mostly discards these suggestions, for a simple reason. Most of such taxes will essentially be a tax on pro-duction investment. Their effect in a free-trading world will mostly be to move production to other countries. Also, there are practical issues. Defining what a ”robot” is for tax purposes is quite difficult. For similar reasons, countries have often abolished some taxes on capital, such as inheritance tax, as they are difficult to define and enforce. In sum, most countries will likely move to lower rather than higher taxes on capital. This in itself puts additional downward pressure on labour taxes, both to avoid excessive automation and to avoid leakage or conversion of labour income to capital income.
Instead economists tend to encourage taxes on consump-tion and non-movable property that is individually ow-ned (rather than by producing companies). Tax on con-sumption has often meant raising VAT, or targeted taxes on environmentally detrimental consumption. But some countries have gone further by introducing what is often called a ”consumption tax” – usually in a form that looks like an income tax, but allows deduction for investments. The effect of such a deduction is not necessarily to redu-ce the marginal tax on labour income, but to encourage investment by charging the tax first when income is actually used for consumption. In that way investment is stimulated which can both promote employment and productivity growth. This type of tax system has also become known under the misleading term “Hall-Ra-
bushka flat tax” after a book by the economists Hall and Rabushka. Later research and implementation by some 10 countries in various forms has shown that such a tax very well can be, and often is, progressive. Studies of the effect of these types of consumption tax have not been straightforward, but generally find significant positive effects. One of the most recent studies develops a novel methodology that allows conclusions about causality and finds large positive GDP growth effects in 7 of the 8 studied countries (Adhikari and Alm, 2017).
Another alternative to labour taxes is a tax on non-mova-ble property. This is usually a real estate tax that should be designed to be predictable and avoid discouraging building or moving to a new property. A so called ”box” model can fulfill these requirements relatively well. It would apply an annual tax to the value of property in the ”box”, but allows sales and purchases of property that remain in the box without tax consequences.34
Social insurance in the digital age
Lower taxes on labour income are not the only way to compensate for increasing competition from robots. The design of unemployment-, sick-leave and retirement transfers can also make an important difference.
An increasingly common claim is that if full employment becomes a more elusive goal, then working could be made more voluntary through a universal basic income. It is rarely noted, however, that most western countries are actually in the process of introducing a basic inco-me, albeit by another name. Forty years ago people in many western countries died on average roughly at the age when they were eligible for retirement. Today they live on average twenty years longer. In many cases these large groups of retired people are healthy and use their retirement as a ”basic income”.
This development may be a reasonable way of letting people above 65 years of age choose to work depending on their health and other circumstances. The elderly of-ten possess considerable know-how that can come to good use even if they only work part time. Therefore, it is important to provide good incentives for such work, for example by applying reduced social insurance taxes (in line with lower benefits).
34 For a comprehensive discussion see Lodin and Englund (2017).

30
Report
Norway has reformed pensions in the private sector in a way that improves incentives to work past 62 years of age. This has also had an important positive effect on the share of people working past 62.35 But in the public sector this reform has not taken place, and the average retirement age there has not improved.
Allowing a “basic income” for people of working age would, however, create an insoluble dilemma. If the ba-sic income is set to a generous level, like a low wage, it would become wildly expensive. If it is set at a low level, like social assistance, it will in many cases be lower than current transfers. Income differences would rise.
In both cases there is a risk that a growing share of the population would not participate in the labour market. Children might grow up in areas where few people work, and with no obvious reason to finish school. Social cohe-sion in a country might be put in jeopardy. In addition, there are practical issues. Should alcoholics or drug ad-dicts really just receive an unconditional basic income without any attempt at rehabilitation?
Norway has an internationally large share of working age people on sick leave and some 10 percent of Norwegians are on disability pensions, more than in most countries. In Sweden and the Netherlands that had similarly high numbers various reforms combining stricter rules with more rehabilitation have led to a significant reduction in sick leave.
Social insurances should not just combine security with sound economic incentives. They should also be admi-nistratively easy to handle and to understand, and they should fit the digital age where more people may come to work intermittently or for several employers or customers rather than being employed for long periods of time by a single employer. These objectives can be met by moving to a more transparent system where entitlements are more closely tied to contributions.
Some twenty countries around the world have moved to introduce savings elements into other social insurances than just the pension system. The central idea is that a large part of taxes and transfers does not actually redis-tribute between individuals’ life time wages, but between different periods in each individual’s life. Moving some
elements of the latter redistribution from a tax-transfer system to a (mandatory) individual saving, can reduce the marginal tax on labour without sacrificing econo-mic security. Such diverse economists as Joseph Stiglitz and Martin Feldstein have studied and recommended a partial conversion of unemployment insurance along these lines.36
Under such systems, people are required to save a fraction of their wages in designated accounts instead of paying a similar amount in social insurance tax. If they become unemployed, a monthly sum can be withdrawn from the individual account, which replaces state unemployment benefits.
Only when the individual account is exhausted, or falls below an insured balance, then the government would step in with a transfer. Due to this insurance function, income equality need not suffer. Positive account balan-ces after working life would be converted into retirement income. Negative account balances would be forgiven at retirement, or if the individual dies. The virtue of such a system is that when a person becomes unemployed, drawing from an account with a positive balance reduces personal wealth by an equal amount. This means that the costs of unemployment are fully borne by the individual. Yet, these systems would provide similar protection as the existing state unemployment benefit system, without the adverse incentives.
These savings account based systems can be introduced as a complement to other social insurances. For example, Austria introduced an unemployment account in 2003, instead of raising unemployment compensation and em-ployment security. Employers set aside 1,5 percent of an employee’s wage on an account. The account follows the employee to new jobs. If the employee becomes unem-ployed, he or she can choose to withdraw the balance for education or other purposes. Otherwise the balance remains in the account and is eventually converted into an addition to pension rights.
Some countries such as Singapore have also applied sa-vings account to a wider set of social insurances. One thorough study simulates introduction of a comprehen-sive system in Denmark in a form that guarantees that no one loses out compared to the current system, and yet
35 See Hernæs, Markussen, Piggot, and Røed (2016).36 For example Stiglitz and Yun (2005).

31
Report
37 For example, Bovenberg, Lans, Hansen and Birch Sørensen (2012). For an overview see Fölster and Gidehag (2017):
https://timbro.se/valfard/valfard-att-lita-pa-en-otryggare-framtid/ 38 Enligt t.ex. Svenskt Näringslivs index för företagsklimatet.
incentives improve considerably.37
Importantly, in the context of this paper, account-based social insurances tend to be transparent and simpler to use for people who work in a digital economy and who might have many different income streams.
Use digital technology to make doing business easier
Most often economists consider the ease of doing business, sometimes also referred to as ”the business environment”38 as a dimension that may be important for productivity growth or high growth start-ups. By ease of doing business is meant administrative and institutional conditions that determine the profitability of starting, running and in-vesting in a business. Examples are measures that reduce the costs and risks associated with running a business and complying with regulations such as lead times for building permits, barriers to entry and unfair competition, how well schooling meets the needs of local employers, as well as lower and simpler handling of taxes and charges to faci-litate new enterprise. The World Bank compiles many of these in a measure ”Ease of doing business” and publishes lists of simplifications for new entrepreneurs and start-up companies that Norway could implement.
Yet it is often forgotten that the ease of doing business can also be an important determinant of structural unem-ployment. There are four reasons for this. First, during a recession a number of companies go out of business and jobs are axed. A better business environment may, all else equal, give rise to a higher flow of business start-ups and investments by existing companies. As a result, companies that close or downsize during a recession are more rapidly replaced in a favourable business environment. Periods of unemployment are therefore shorter. Unemployed peo-ples’ human capital does not erode as much, and stigma-tization and possibly passivisation associated with long-term unemployment is less prevalent. Consequently, fewer people end up in long-term structural unemployment.
Second, a better business environment can, as the result of a larger, regular inflow of new enterprises and investments also create a broader spectrum of jobs on offer. Some of these job offers may concern labour that is in short supply, and may not generate new jobs overall. But the probabi-lity increases that jobs of varied character will be on offer,
some of which fit people who would otherwise end up in structural unemployment. In that way, a better business climate can lead to more start-ups that create the very jobs in which the structurally unemployed can be sufficiently productive.
Third, a poor business climate is often a greater obstacle to running a business for groups that are more frequently af-fected by structural unemployment. For some of these, em-ployment discrimination can contribute to unemployment. Starting a firm can then be an alternative. However, young people and immigrants may also find it more difficult to deal with the bureaucratic red tape that an entrepreneur is often confronted with. Many in these groups have limited resources, contacts and knowledge of regulations and may therefore be deterred from starting their own business by regulatory risk and complexity.
Fourth, a better business environment can attract more pe-ople to self-employment as an alternative to employment. This means that an employer can expand by engaging subcontractors instead of by employing people. The risks that follow from employing someone in the presence of job security laws are thereby eliminated. Empirical research into employment protection suggests that the job security laws present a particularly serious obstacle to groups that are often over-represented in structural unemployment, such as immigrants.
As a result of these four mechanisms it is not surprising that studies also find causal effects, for example of a better local business environment on the employment rate of non-European immigrants to Sweden (Fölster, Gidehag and Jansson, 2016).
Many countries struggle to improve their business environ-ment, but digitalization offers new tools. Digital technology often gives high pay-offs to whoever is first. Administrative and regulatory obstacles may often determine in which country startups manage to develop and commercialize innovations first. Smart digitalization of public adminis-tration can speed up these processes significantly.
A particular observation is that a lot of the new jobs created by digitalization can be attributed to increased complexity. These jobs can also contribute of regulatory costs, bureau-cratic superstructure and negative external effects elsew-
32
Report
39 Forzatti and Mattson (2015).
here, for example, if public authorities use digitalization to demand ever more information from businesses, even when its use is limited.
According to the so-called Global Simplicity Index, un-necessary complexity is estimated to cost the world’s largest companies, the largest 200 in the Fortune list, an average of one billion dollars a year. Using digital techn-ology to reduce unnecessary complexity and speed up administrative procedures could be a good way to lower the cost of doing business, and stimulate technological development at the same time.
In sum, there are several instruments that can be used to compensate for job losses due to digitalization. They are worthwhile pursuing, not just to maintain the employ-ment rate as such, but perhaps even more important, to avoid accelerating income inequality.
Use the potential for digitalization of public service
It has usually been considered crucial for good welfare that many people work in the welfare sector and that the overall employment rate is high in order to raise tax revenue to pay for their wages. Higher GDP growth has been seen as less important as it increases wages, but does not automatically increase the number of hands and feet working in welfare services. However, if robo-tization progresses rapidly, it may be more important than in previous decades to maintain good GDP growth in order to be able to finance the robotization and capital equipment that increasingly produces welfare services. In the short run, it is even more important to make use of the help that digitalizations can already offer to improve quality in welfare services. This is not just an economic matter. It may also be the best way to maintain trust in the extensive Nordic welfare institutions.
Innovation in old age care and health careA recent study of digital innovations in old age care that are already invented and available concluded that the efficiency gains they afford can more or less compensate for the expected 30 percent cost increase that is expec-ted in Sweden until 2030 due to demographic change.39 Presumably Norway could achieve the same.
In addition, these digital innovations also hold the promi-
se of great quality improvements. Some examples are that the all too frequent human error in distributing medicati-on to people in old age care could be reduced; that falling accidents could be reduced; and that old people would become less isolated if they had access to voice steered tablet computers with which they can contact friends and relatives as well as their nurses or doctors.
Similarly, in health care, solutions that are already su-ccessful promise large cost savings and quality impro-vements. For example, Banner Health, a healthcare orga-nization with 28 hospitals scattered in the United States manages and controls its intensive care units through a kind of Command Center in Phoenix. This monitors all patients in acute care in all 28 hospitals, and has access to all the necessary specialists and can consult them even when they are thousands of miles away. This has led to large cost savings, higher survival rates and shorter pa-tient time in intensive care.
Similar technology allows more patients to be treated at home with intensive digital surveillance. Computers also make predictions about patients’ health deterioration before staff locally even detect them. Patients with chro-nic diseases, who stand for a large share of total hospital costs, need much less hospital care.
Alas, the fact that digital technology can be used in this way, does not automatically mean that it will be used any time soon. Here Norway could make a big push forward.
Innovation in educationNorway is middle ranking in PISA scores, the OECD’s measure of school quality, but spends more than most countries on primary and secondary education. Spen-ding on tertiary education is also high, but enrolment in science and engineering is low.
Longer education programs are not always the answer. A number of studies already find ”excess education”. Lar-ge groups of well-trained graduates may find work, but often in jobs that do not match their qualifications. The possible impact of labour market training and practice has also deteriorated. For example, in Sweden, where labour market training programs have always been con-sidered important, they no longer increase the likelihood of getting a job, compared to similar people who do not get such training.

33
Report
40 Forzatti and Mattson (2015).41 Sandström, C. (2014).
As more occupations become obsolete, it is even more important to quickly and flexibly learn new skills for those whose jobs are automated. A digital revolution in teaching may be of help. Digital teachers and learning programs have improved dramatically.
One likely development is that digital learning, which in its infancy in the early 1990s did not become a hit, now finds its role in the education system. In today’s educa-tion system, a bottleneck is that teachers first need to be trained, and subsequently transmit knowledge to the student. As knowledge becomes more specialized and advances faster, it becomes more of a challenge to trans-mit the lastest know-how quickly, especially in smaller countries like Norway.
Therefore, digital teachers, programs that both convey knowledge and follow the student’s progress, can become important teaching aids. On digital learning platforms, simulations often work well, which means that even practical skills can be conveyed.
An example of a successful Swedish digital teacher for grades 7-9 is Schoolido. But digital teachers can be even more important in work life. Shorter, digital training mo-dules could be produced by employers, bransch organi-sations, schools and universities in cooperation and used both for students and for employees’ life-long learning, and of course also for unemployed in training programs.
Productivity growth - A more effective innovation strategy
Productivity growth is presumably affected by many factors, such as the quality of the education system and how the business environment affects incentives to in-vest. Tax considerations may affect firms’ investment decisions or foreign and Norwegian “brain business” wor-kers’ decision where to locate. All these factors therefore impact on the competitiveness of Norwegian enterpri-se. Apart from these more familiar policy prescriptions, some innovative ways of stimulating productivity growth should also be considered. The remainder of this section on productivity growth gives one such example.
In a study by Block and Keller, the most important Ame-rican innovations over the past 40 years were investiga-ted.40 A remarkable result is that universities account for
only about six percent of these innovations. The Reform Institute published a similar study for Sweden, conduc-ted by Christian Sandström.41 This also confirmed that universities accounts for a minor part of important inn-ovations, while individual inventors account for a large part, despite the fact that they tend to receive scant en-couragement from current innovation policies.
Another result of the US study is that cooperation betwe-en public authorities and individual innovators has be-come the main source of important innovations. Among other things, small businesses that have been assigned to SBIR (Small Business Innovation Research) now account for more than 20 percent of these important innovations. SBIR stipulates that authorities that allocate research grants or assignments must provide at least 2.5 percent of these to small businesses, usually in allocations of up to five million kronor for the first phase and up to SEK 12 million for the second phase if the goals were met in the first phase.
Partly as a result of studies such as these the US govern-ment has revamped its innovation strategy, asking all its state authorities to stimulate innovation through the use of Grand Challenge innovation competititons. Currently close to 800 such competitions are in progress, and acco-rding to evaluations they also prove to be more successful than traditional research funding.
One example is DARPA that has stimulated dramatic innovations such as autonomous vehicles through inn-ovation competitions. In spite of these successes, few Eu-ropean countries have caught on. As an exception, Britain has recently begun to offer Grand Challenge innovation competitions, for example in the form of the so-called Longitude Prize 2014.
Macroeconomic policy
All over the western world productivity growth has slowed over the course of this millennium, causing some econ-omists such as Lawrence Summers to speak of ”secular stagnation”. Among the possible causes that receive some support are an ageing work force, and a higher savings rate in particular by households with higher incomes. But digitalization may also play in. During Industriali-zation innovations often required major investments in new factories, which resulted in a sharp rise in demand
34
Report
during business cycles. Many of today’s innovations in-stead reduce the need for both capital investments and employees. They still drive growth, but with a significa-ntly smaller investment boom.
In part, innovations can also give rise to social benefits that are not captured by national accounts. Spotify, for example, displaced jobs and investment in the record and CD industry, but creates few jobs and requires little investment. The value to the customer of switching to Spotify instead of buying CDs has not been counted as GDP growth. In the national accounts the net effect has probably been to reduce GDP.
In spite of the fact that investment booms are rarer, digital equipment continues to fall in price and at the same time stands for a growing share of consumer purchases. This presses measured inflation in many countries. Central banks react to this with low interest rates.
The result has been an increased frequency of cycles of credit expansion and collapse. In the developed world, consumers and companies have taken on more debt. Debt is used to finance the purchase of assets, and the greater availability of credit pushes asset prices higher. From time to time, however, lenders lose faith in borrowers’ ability to repay and stop lending; a fire sale of assets can follow, further weakening the belief in the creditworthi-ness of borrowers.
Central banks then step in to cut interest rates even furth-er or buy assets directly in “quantitative easing” programs. This brings the crisis to a temporary halt but each cycle seems to result in higher debt levels and asset prices. The combined valuation of bonds and equities in the developed world is higher than ever before.
Without speculating about when the financial system could be due for another crisis, economic policy should be based on the assumption that financial crises will con-tinue to be more common, partly due to digitalization. Such crises affect even countries like Norway with little state debt. During a financial crisis demand for exports is likely to fall and asset prices could fall, causing hou-seholds to save more and spend less.
Thus digitalization in combination with other forces make it more important to take macro- and micropru-dential measures that reduced risks for the country and individuals during financial crises. In the case of Norway
this probably mostly means avoiding overextended bor-rowing for housing.
For countries that are able to adapt to digitalization with the necessary reforms, the future outlook should look rosy. Major technological improvements make for enor-mous improvements in healthcare, education or care of elderly. Production costs for many goods and services decrease significantly and quality is improved. It can therefore also be cheaper to provide a good material stan-dard even for people with small incomes. Thus, even a return to a situation where human labour as such is not in much demand need not be a disaster. Anyone who believes Norway can be at the forefront of the necessary reforms has every reason to be optimistic.
35
Report
Adhikari, B. and J. Alm (2017) Evaluating the economic effects of flat tax reforms using synthetic control met-hods. Working Papers in Public Finance, Working Paper 01/2017. University of Wellington, New Zealand.
Acemoglu, D. and D. Autor (2011) “Skills, tasks and te-chnologies: Implications for employment and earnings,” Handbook of Labor Economics, 4: 1043–1171.
Acemoglu, D. and P. Restrepo (2016) The Race Betwe-en Machine and Man: Implications of Technology for Growth, Factor Shares and Employment. NBER Working Paper No. 22252.
Acemoglu, D. and P. Restrepo (2017) Robots and Jobs: Evidence from US Labor Markets. NBER Working Paper No. 23285.
Adermon, A. och M. Gustavsson (2015) Teknisk utve-ckling och jobbpolarisering. SNS Analys nr. 28, mars 2015. SNS, Stockholm.
Adermon, A. och M. Gustavsson (2015) Job Polarization and Task-Biased Technological Change – Evidence from Sweden, 1975–2005. Scandinavian Journal of Economics, 117 (3) 878-917.
Arbetsförmedlingen (2014) Arbetsmarknadsrapport 2014. Stockholm.
Arbetsförmedlingen (2015) Var finns jobben? Bedömning för 2015 och en långsiktig utblick. Stockholm
Arntz, M., T. Gregory, and U. Zierahn (2016) The Risk of Automation for Jobs in OECD Countries. OECD Social, Employment and Migration Working Papers, No. 189, OECD.
Atkinson, R. D. (2017) Robots, Automation, and Jobs: A Primer for Policymakers. ITIF, 2017.
Atkinson, R. D. and J. Wu (2017) False Alarmism: Techno-logical Disruption and the U.S. Labor Market, 1850–2015. ITIF Work series, 2017.
Autor, D. H., D. Dorn, and G. H. Hanson (2013) The China
Syndrome: Local Labor Market Effects of Import Compe-tition in the United States. American Economic Review 103 (6) 2121–68.
Autor, D. H. (2014) Polanyi’s Paradox and the Shape of Employment Growth MIT, NBER and JPAL. Presented at Jackson Hole September 3, 2014.
Autor, D., F. Levy, and R.J. Murnane (2003) The skill content of recent technological change: An empirical exploration. The Quarterly Journal of Economics, vol. 118, no. 4, 1279–1333.
Autor, D., D. Dorn, och G. H. Hanson (2013) Untang-ling Trade and Technology: Evidence from Local Labor Markets. Centre for Monetary and Financial Studies (CEMFI); Institute for the Study of Labor (IZA), IZA Dis-cussion Paper No. 7329.
Autor, D. and A. Salomons (2017) Does Productivity Growth Threaten Employment? Robocalypse Now? Paper presented at the European Central Bank Annual Confe-rence, Sintra, Portugal, 27 June 2017.
Azmat, G., A. Manning, and J. Van Reenen (2012) Priva-tization and the Decline of the Labour’s Share: Interna-tional Evidence from Network Industries, Economica, 79, 470–92.
Barro, R., and X. Sala-i-Martin (1995) Economic Growth. McGraw Hill.
Bentolila, S., and G. Saint-Paul (2003) Explaining Movements in the Labor Share. B.E. Journal of Macroe-conomics, vol. 1, p.9, 2003.
Bengtsson, N., P.-A. Edin och B. Holmlund (2014) Löner, sysselsättning och inkomster – ökar klyftorna i Sverige? Rapport till Finanspolitiska rådet 2014/1.
Block, F. och M. Keller (2008) Where do Innovations come from? Transformations in the U.S. National Innovation System, 1970-2006. The Information Technology & Inn-ovation Foundation.
Bloom, N., M. Draca, and J. Van Reenen (2016) Trade
References
36
Report
Induced Technical Change? The Impact of Chinese Im-ports on Innovation, IT and Productivity, The Review of Economic Studies, 83 (1) 87–117.
Boston Consulting Group (2015) The Robotics Revolution: The Next Great Leap in Manufacturing.
A.L. Bovenberg, M. I. Hansen and P. Birch Sørensen (2012) Efficient Redistribution of Lifetime Income through Wel-fare Accounts, Fiscal Studies, vol. 33, no. 1, pp. 1–37.
Brynjolfsson, E. och A. McAfee (2014) The Second Machi-ne Age - Work, Progress, and Prosperity in a Time of Bril-liant Technologies. Norton, New York.
Cappelli, P. (2014) Skill Gaps, Skill Shortages and Skill Mismatches: Evidence for the US. NBER Working Paper No. 20382.
Chui, M., J. Manyika, and M. Miremadi (2016) Where machines could replace humans—and where they can’t (yet). McKinsey Quarterly, July 2016.
Davis, S. J. and M. Henrekson (2005) Tax Effects on Work Activity, Industry Mix and Shadow Economy Size: Evi-dence from Rich-Country Comparisons. In Ramón Gó-mez-Salvador et al., eds., Labour Supply and the Incen-tives to Work in Europe. Cheltenham, UK: Edward Elgar.
European Commission (2015) Study on the effects and incidence of labour taxation - Final report. Taxation Pa-pers nr. 56, 2015.
Ford, M. (2015) The Rise of the Robots, Basic Books, New York.
Forzati, M. and C. Mattson (2015) Effekter af digitala tjän-ster för äldrevård, en ekonomisk studie. Acreo Swedish ICT AB på uppdrag av Svenska Stadsnätsföreningen.
Frey, C. B. and M. A. Osborne (2013) The Future of Em-ployment: How Susceptible are Jobs to Computerisation? Mimeo. Oxford Martin School.
Fölster, S. (2014) Vartannat jobb automatiseras inom 20 år – utmaningar för Sverige. Stiftelsen för Strategisk Forskning, Stockholm.
Fölster, S. (2015) Så kan nya jobb skapas. Dagens Arbete 21 januari, 2015.
Fölster, S. and N. Sanandaji (2017) The Geography of Eu-rope’s Brain Business Jobs. ECEPR.
Fölster, S., Jansson, L. and A. Nyrenström Gidehag (2016) The effect of local business climate on employment. Journal of Entrepreneurship and Public Policy, Vol. 5 Issue: 1, pp.2-24.
Frey, C. B. och M. A. Osborne (2013) The Future of Em-ployment: How Susceptible are Jobs to Computerisation? September 17, 2013. University of Oxford.
Gershuny, J. och K. Fisher (2014) Post-industrious socie-ty: Why work time will not disappear for our grandchil-dren, by Jonathan Gershuny and Kimberley Fisher, Cen-tre for Time Use.
Goos, M., A. Manning, and A. Salomons (2014) Explaining Job Polarization: Routine-Biased Technological Change and Offshoring. American Economic Review, vol 4, nr 8, 2509-26.
Goos, M. and A. Manning (2007) Lousy and Lovely Jobs: The Rising Polarization of Work in Britain. The Review of Economics and Statistics, 89(1): 118-133.
Graetz, G. and G. Michaels (2015) Robots at Work. CEP Discussion Paper No 1335.
Hoynes, H. W. and A. J. Patel (2017) Effective Policy for Reducing Poverty and Inequality? The Earned Income Tax Credit and the Distribution of Income. Journal of Human Resources July 7, 2017 1115-7494R1.
International Federation of Robotics (2014) World Robo-tics: Industrial Robots.
IMF (2017) Fiscal Monitor: Tackling Inequality, October 2017.
Kahneman, D. et al. (2006) Would you be happier if you were richer? A focusing illusion, Science, 2006.
Keynes, J. M. (1930) Economic Possibilities for our Grandchildren, in Essays in Persuasion. Palgrave Mac-Millan.
Karabarbounis, L., and B. Neiman (2012) Declining Labor Shares and the Global Rise in Corporate Saving. NBER Working Paper No. 18154.

37
Report
Karabarbounis, L. och B. Neiman (2013) The global de-cline of the labor share, NBER Working Paper nr. 19136.
Levy, F. och R. Murnane (2004) The New Division of La-bor: How Computers are Creating the Next Job Market. Princeton: Princeton University Press.
Levy, F. and R. Murnane. (2013). Dancing with robots: Human skills for computerized work. NEXT Report.
Lodin, S. and P. Englund (2017) 2017:4 Yes box! En ESO-rapport om en ny modell för kapital- och bostads-beskattning. ESO, Finansdepartementet, Stockholm.
Markussen, S. (2015) Hvordan sikre jobb til alle i fremti-den? Frischsenteret for samfunnsøkonomisk forskning.
Markussen, S. and Røed, K. (2016) Ulikhet og sosial mobi-litet. I Frønes, I. & Kjølsrud, L. (red.) Det norske samfunn. 7. utg. Oslo: Gyldendal Akademisk.
Hernæs, E., Markussen, S., Piggot, J., Røed, K. (2016) Pen-sion reform and labor supply. Journal of Public Econo-mics 142 (2016), 39–55.
Hernæs, E. (2017): Yrkesaktivitet og pensjonsuttak etter pensjonsreformen. Frischsenteret.
Michaels, G., A. Natraj and J. Van Reenen (2014) Has ICT Polarized Skill Demand? Evidence from Eleven Countries over Twenty-Five Years. Review of Economics and Sta-tistics, 96(1) 60–77.
Molinder, J. och O. Pettersson (2013) Arbetskostnadsan-delens utveckling i Sverige. Ekonomisk Debatt, 41-7, s. 18-28.
NHOs årskonferanse (2016) Remix – Det Nye Arbetslivet.
NHOs Kompetansebarometer 2017.
Official Norwegian Reports Productivity (2015) Under-pinning Growth and Welfare 10, NOU 2015: 1.
Pajarinen, M., P. Rouvinen and A. Ekeland, (2014) Compu-terization and the Future of Jobs in Norway. ETLA and Statistics Norway.
Pajarinen, M., Petri Rouvinen and A. Ekeland, (2015) Computerization threatens one-third of finnish and nor-
wegian employment. ETLA Muistio Brief, 34, 22 April 2015.
Samfunnsøkonomisk analyse AS (1917) Framskrivinger av arbeidslivets reelle kompetansebehov. Rapport 59-2017 på uppdrag av LO.
Sandström, C. (2014) Var skapades Sveriges 100 främsta innovationer? Reforminstitutet, Stockholm.
SINTEF (2015) Effekter av teknologiske endringer på norsk nærings- og arbeidsliv.
Summers, L. (2014) Reflections on the new ’Secular Stag-nation hypothesis’, Vox CEPR’s Policy Portal, 30 October.
Summers, L. (2014) U.S. Economic Prospects: Secular Stagnation, Hysteresis, and the Zero Lower Bound. Bu-siness Economics, Vol. 49, No. 2, National Association for Business Economics.
Stiglitz, J. and J. Yun (2005) Integration of unemploy-ment insurance with retirement insurance. Elsevier, vol. 89(11-12), 2037-2067.
Vinnova and Esprit (2013) Det Innovativa Sverige – Sve-rige som kunskapsnation i en internationell context. Stockholm.
Veblen, T. (1899) The theory of the leisure class: An eco-nomic study of institutions. Aakar Books.
Världsbanken (2014) Sweden’s business climate – oppor-tunities for entrepreneurship through improved regu-lations.
World Bank (2016) World Development Report 2016: Di-gital Dividends.
Zidar, O. (2018) “Tax Cuts for Whom? Heterogeneous Effe-cts of Income Tax Changes on Growth and Employment”, forthcoming in the Journal of Political Economy.
Åberg, R. (2013), Tjugohundratalets arbetsmarknad – fort-satt uppkvalificering eller jobbpolarisering? Ekonomisk Debatt 41(2), 6–15.
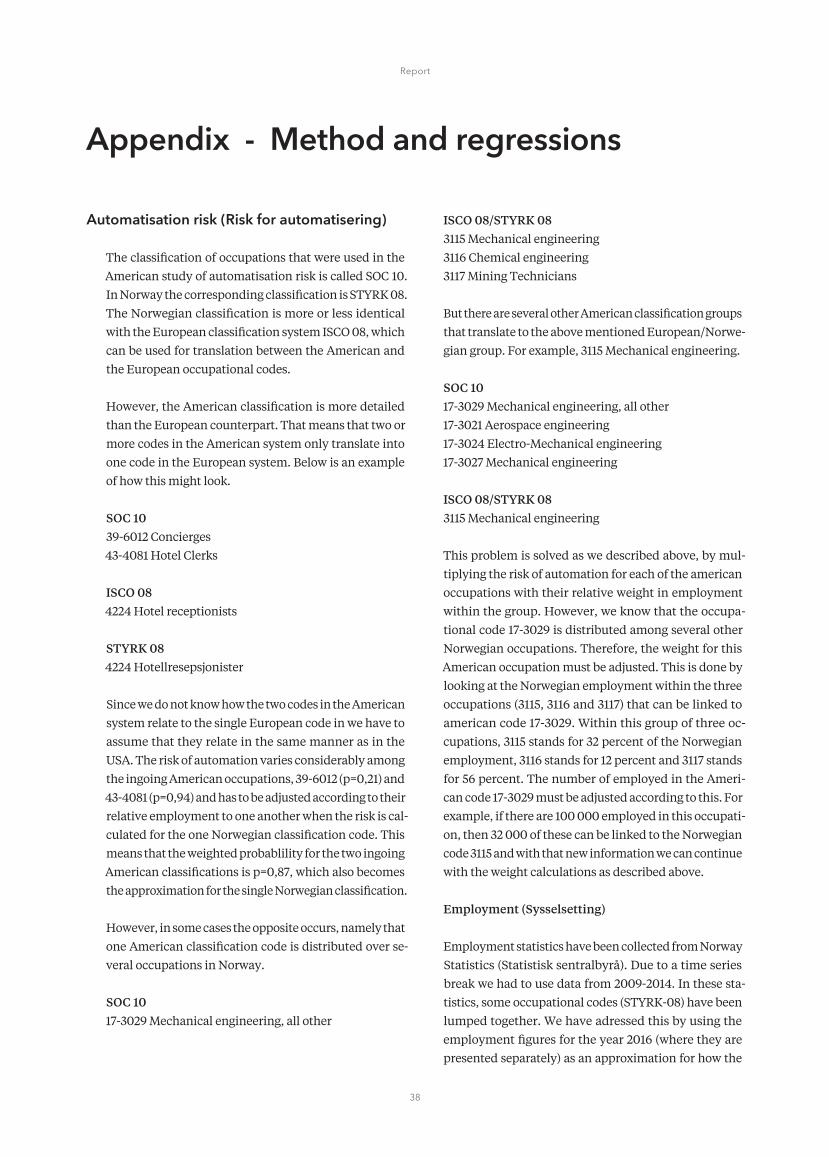
38
Report
Automatisation risk (Risk for automatisering)
The classification of occupations that were used in the American study of automatisation risk is called SOC 10. In Norway the corresponding classification is STYRK 08. The Norwegian classification is more or less identical with the European classification system ISCO 08, which can be used for translation between the American and the European occupational codes.
However, the American classification is more detailed than the European counterpart. That means that two or more codes in the American system only translate into one code in the European system. Below is an example of how this might look.
SOC 1039-6012 Concierges43-4081 Hotel Clerks
ISCO 084224 Hotel receptionists
STYRK 084224 Hotellresepsjonister
Since we do not know how the two codes in the American system relate to the single European code in we have to assume that they relate in the same manner as in the USA. The risk of automation varies considerably among the ingoing American occupations, 39-6012 (p=0,21) and 43-4081 (p=0,94) and has to be adjusted according to their relative employment to one another when the risk is cal-culated for the one Norwegian classification code. This means that the weighted probablility for the two ingoing American classifications is p=0,87, which also becomes the approximation for the single Norwegian classification.
However, in some cases the opposite occurs, namely that one American classification code is distributed over se-veral occupations in Norway.
SOC 1017-3029 Mechanical engineering, all other
ISCO 08/STYRK 083115 Mechanical engineering3116 Chemical engineering3117 Mining Technicians
But there are several other American classification groups that translate to the above mentioned European/Norwe-gian group. For example, 3115 Mechanical engineering.
SOC 1017-3029 Mechanical engineering, all other17-3021 Aerospace engineering17-3024 Electro-Mechanical engineering17-3027 Mechanical engineering
ISCO 08/STYRK 083115 Mechanical engineering
This problem is solved as we described above, by mul-tiplying the risk of automation for each of the american occupations with their relative weight in employment within the group. However, we know that the occupa-tional code 17-3029 is distributed among several other Norwegian occupations. Therefore, the weight for this American occupation must be adjusted. This is done by looking at the Norwegian employment within the three occupations (3115, 3116 and 3117) that can be linked to american code 17-3029. Within this group of three oc-cupations, 3115 stands for 32 percent of the Norwegian employment, 3116 stands for 12 percent and 3117 stands for 56 percent. The number of employed in the Ameri-can code 17-3029 must be adjusted according to this. For example, if there are 100 000 employed in this occupati-on, then 32 000 of these can be linked to the Norwegian code 3115 and with that new information we can continue with the weight calculations as described above.
Employment (Sysselsetting)
Employment statistics have been collected from Norway Statistics (Statistisk sentralbyrå). Due to a time series break we had to use data from 2009-2014. In these sta-tistics, some occupational codes (STYRK-08) have been lumped together. We have adressed this by using the employment figures for the year 2016 (where they are presented separately) as an approximation for how the
Appendix - Method and regressions

39
Report
bundled occupation codes relate to one another in the years 2014 and 2009.
Payroll (lønn)
Payroll statistics have been collected from Norway Statis-tics. The payroll figures are from 2016 and are presented in 4-digit occupational codes. But as we measure employ-ment in 3-digit occupational codes, we had to recalibrate the payroll numbers to a 3-digit level. We have done this by a weighted average for the included 4-digit occupati-onscodes for each of the 3-digit occupationsgroups. Then the occupations are sorted according to their payroll le-vels in five groups. The first group consists of the occupa-tions with the lowest payroll, and the fifth group is the one with the highest. We have arranged the groups so that approximately the same number of employed exist within each group in the starting year (2009). That means there should be approximately 450 000 employed people within each group. This also means there is a different numbers of occupations within each group. Group 1 (lo-west payroll) includes 27 occupations, group 2 includes 19, group 3 includes 24, group 4 includes 18 and group 5 (highest payroll) includes 23 occupations.
Regressions
A simple regression of how well the risk of automation according to Frey and Osborne explains employment change is shown in the table below.
The interpretation of the automation risk coefficients (-0.16 and -0.17) is as follows. The average non-weighted automation risk (20 years) for all occupations is 53 per-cent. During the five years covered by the estimation, the average employment reduction due to automation has been 8,5-9 percent (-0.16 * 53 or -0.17 * 53). If automation continues at the same rate, this would imply 34-36 per-cent lost jobs over 20 years.
Regression of employment increase 2009-2014 as a function of automation risk and youth share
* significant at 10% level, ** significant at 5% level, *** significant at 1 percent level.
Various other control variables have been tested but make little difference. In the corresponding Swedish study, the youth share was a more important variable, but does not appear to be so in Norway.Another regression equation is estimated with the em-ployment increase 2009-2014 as dependent variable, and as independent variables automation risk, potential for digital workers, potential income effect, and the propor-tion of young people. In the baseline regression, the con-stant is high, which would mean an underlying trend of an average employment increase of 9 percent over five years. If taken at face value, this could reflect increasing demand in the wake of oil price increases. By compari-son, the second regression assuming that employment growth in the absence of automation and digitization is equal to zero, essentially omitting the constant. In our view, however, this is not an economically meaningful specification in this context.
Regression of employment increase 2009 to 2014 as a function of several variables.
* significant at 10% level, ** significant at 5% level, *** significant at 1 percent level.

40
Report
nho.no