Embed Size (px)
Citation preview
Northwestern University H. D. Espinosa ME 495
Testing of MEMS Materials Using Thermal Actuation, AFM Image Correlation and
Capacitance Measurement
Students: Y. Chen, B. Peng, and Z. He
Mentor: Y. Zhu
March 20, 2003
Northwestern University H. D. Espinosa ME 495
Introduction
• The reliability of MEMS devices is a major issue and it can only be addressed by direct measurements on small specimens with dimensions on the same order of magnitude as the fabricated micro-devices
• Knowledge on bulk material behavior fails to describe material response in
this size regime
• Various techniques have been developed in the past to address the issues of mechanical integrity and evaluation of the elastic properties of polysilicon.
• Tensile tests are less vulnerable to geometry-induced errors and the measurements are easier to interpret from an error analysis point of view

Northwestern University H. D. Espinosa ME 495
Experimental setupA Actuation Pads S Sensing Pads
S
S
A
A
V
Thermal Actuator Load Sensor
High-ResolutionAFM Imaging ofSpecimen Film
Specimen
+Vo
-Vo
VsenseS
Three components: Thermal actuator , specimen, load sensor
Scheme of the MEMS tensile testing device
Northwestern University H. D. Espinosa ME 495
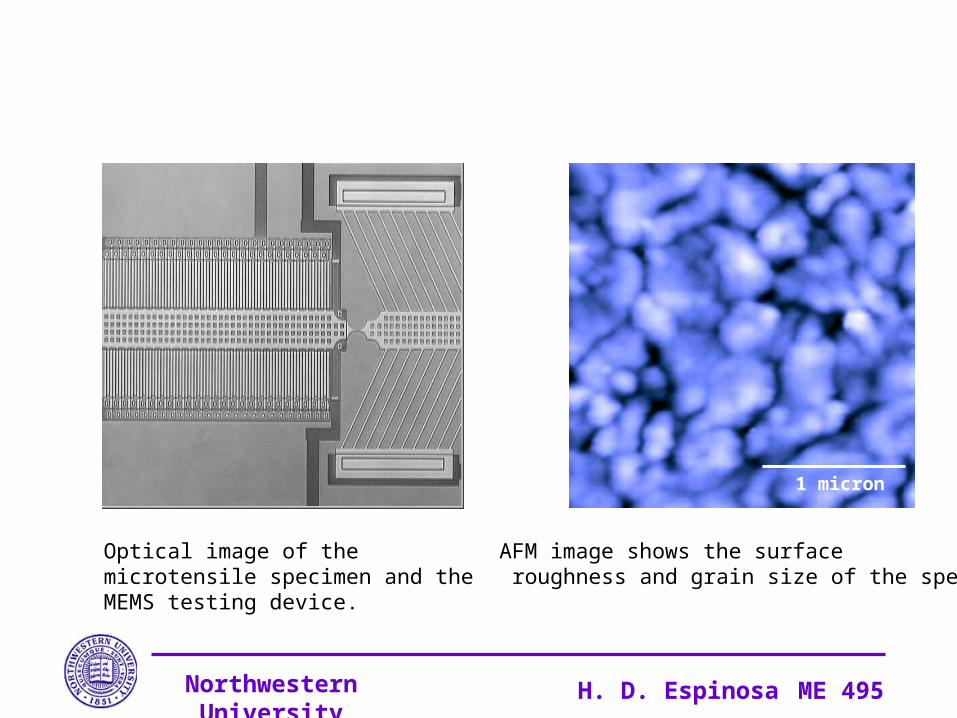
AFM image shows the surface roughness and grain size of the specimen
Optical image of the microtensile specimen and the MEMS testing device.
1 micron
Northwestern University H. D. Espinosa ME 495
Experiment
Step 1: Characterize the system error by scanning the same area at
zero loading to eliminate the results of the shifting and minimize the measuring error
Step2: Using AFM records of deformed and undeformed
specimen configurations to measure the strains of the surface of the specimen
Northwestern University H. D. Espinosa ME 495
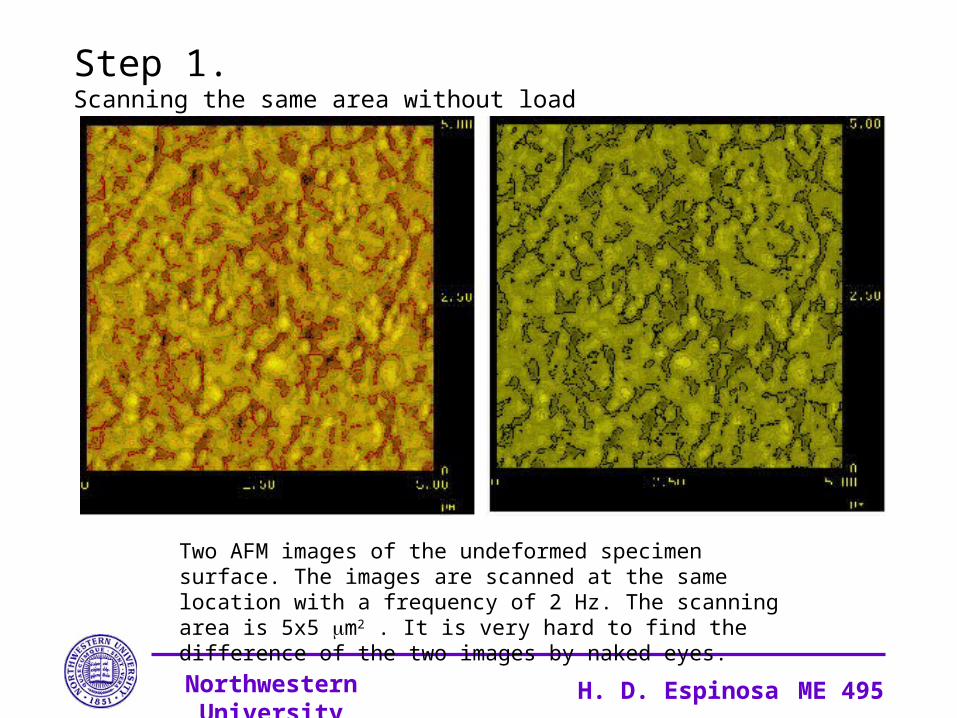
Step 1.Scanning the same area without load
Two AFM images of the undeformed specimen surface. The images are scanned at the same location with a frequency of 2 Hz. The scanning area is 5x5 m2 . It is very hard to find the difference of the two images by naked eyes.
Northwestern University H. D. Espinosa ME 495
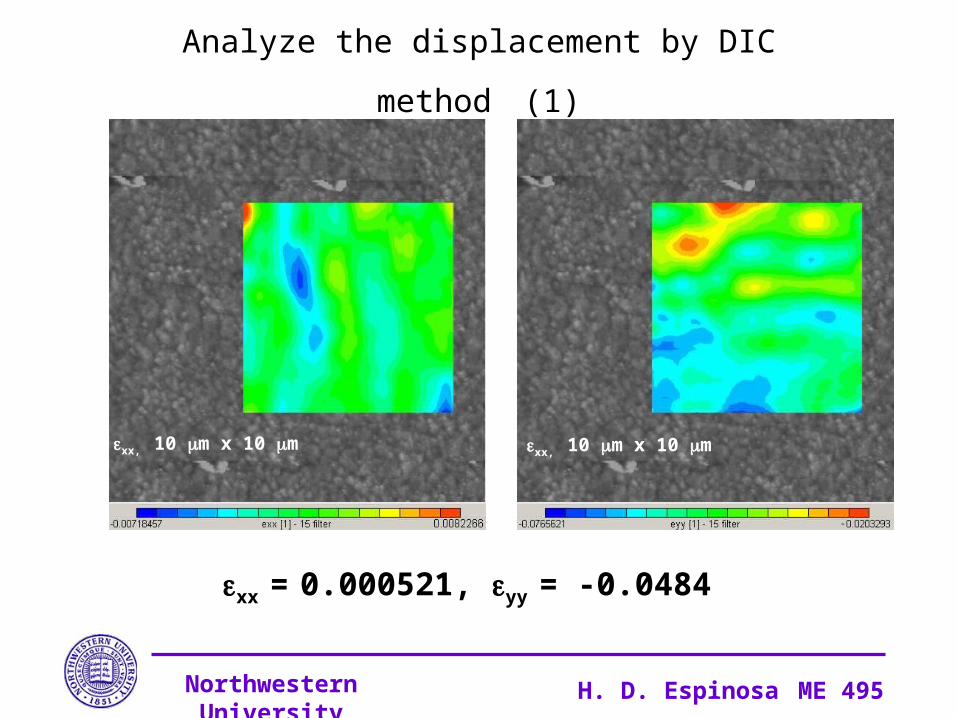
Analyze the displacement by DIC method (1)
xx, 10 m x 10 m xx, 10 m x 10 m
xx = 0.000521, yy = -0.0484
Northwestern University H. D. Espinosa ME 495
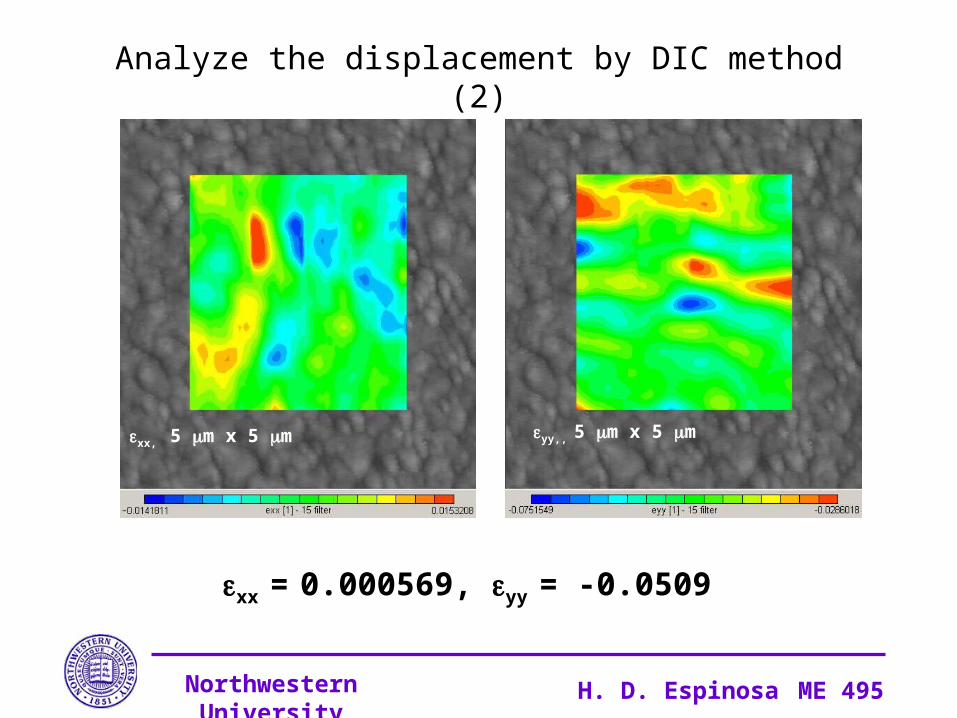
Analyze the displacement by DIC method (2)
xx, 5 m x 5 m yy,, 5 m x 5 m
xx = 0.000569, yy = -0.0509
Northwestern University H. D. Espinosa ME 495
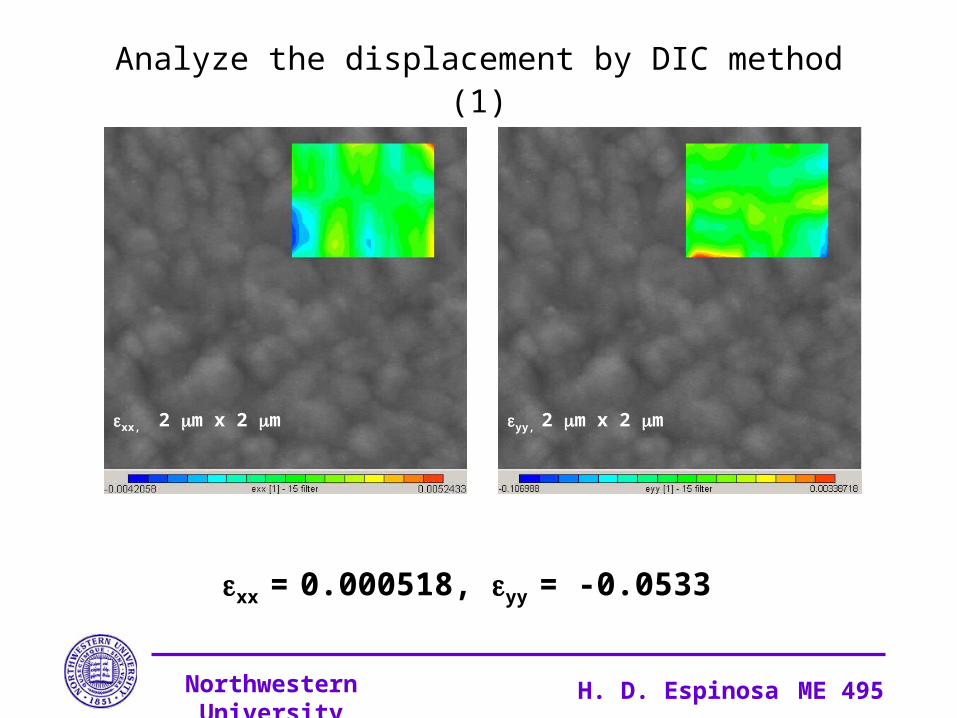
Analyze the displacement by DIC method (1)
xx, 2 m x 2 m yy, 2 m x 2 m
xx = 0.000518, yy = -0.0533
Northwestern University H. D. Espinosa ME 495
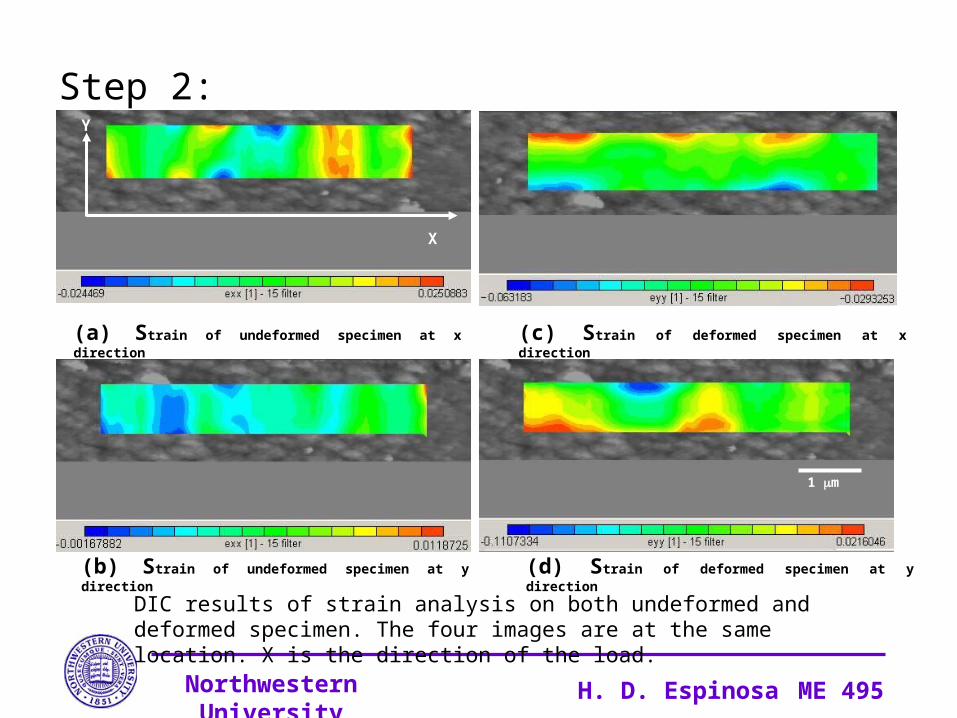
(a) Strain of undeformed specimen at x direction
(b) Strain of undeformed specimen at y direction
(c) Strain of deformed specimen at x direction
(d) Strain of deformed specimen at y direction
X
Y
1 m
Step 2:
DIC results of strain analysis on both undeformed and deformed specimen. The four images are at the same location. X is the direction of the load.
Northwestern University H. D. Espinosa ME 495
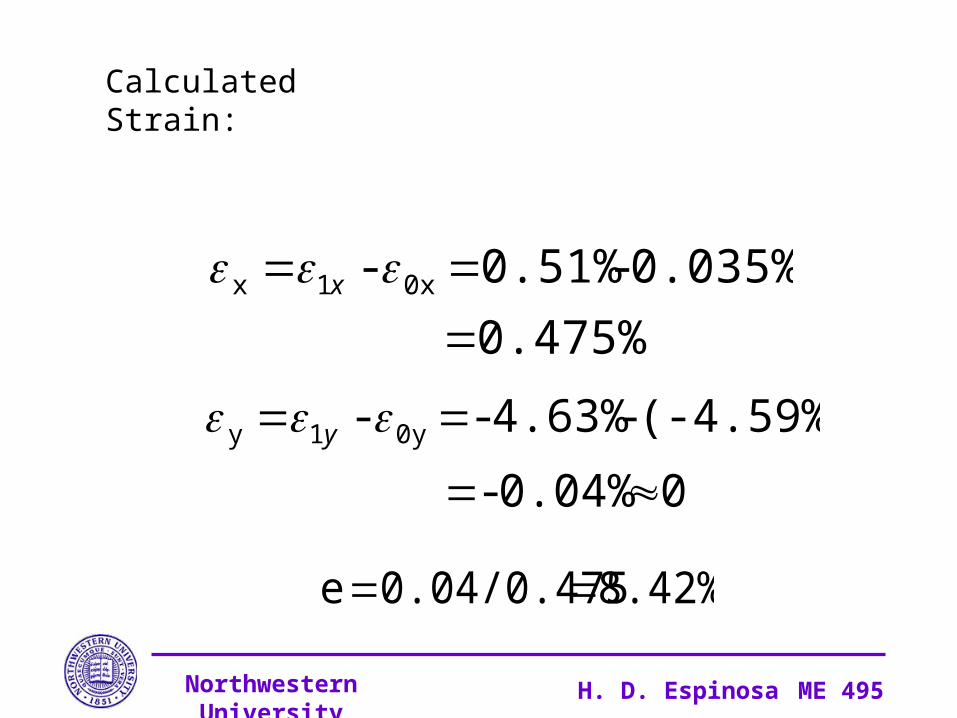
0.475%
0.035%-0.51% - 0x1x
x
0 0.04%-
(-4.59%)-4.63%- - 0y1y
y
Calculated Strain:
8.42%0.04/0.475e
Northwestern University H. D. Espinosa ME 495
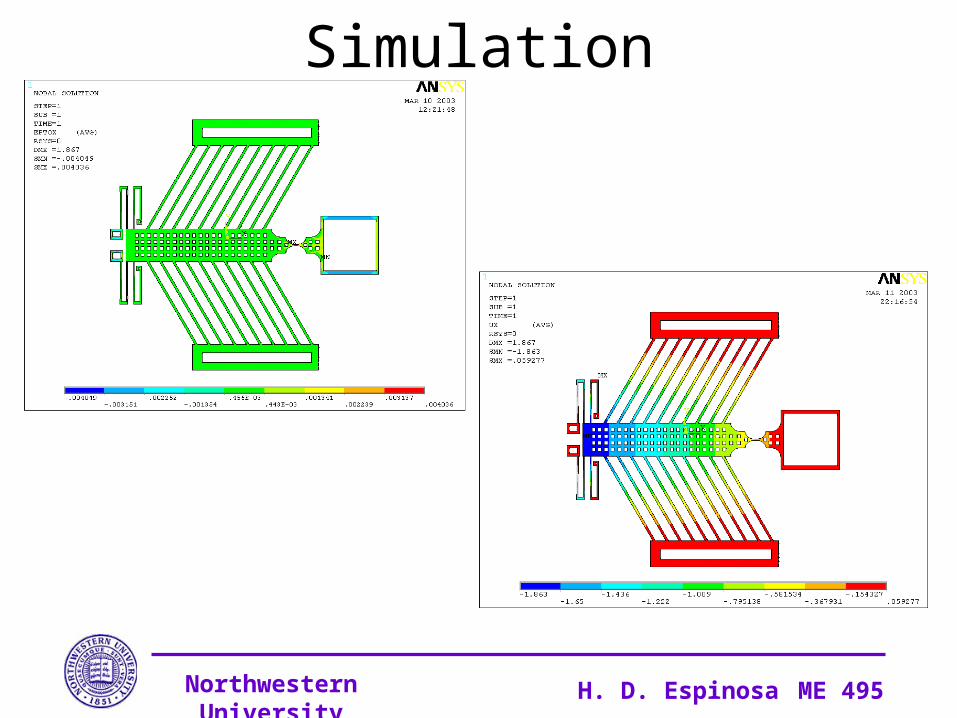
Simulation
Northwestern University H. D. Espinosa ME 495
Conclusion• The absence of surface developed charges makes the use of a probe
microscope possible in the regime of small interaction forces between the film and the AFM probe.
• This technique is less vulnerable to geometry-induced errors and the measurements are easier to interpret from an error analysis point of view.
• Although there is an initial drifting of the AFM image at zero load, the strain of the specimen can be compensated by subtract the measured strain by the initial shifting
• Future work will be conducting measurements at various voltages (loads) to find the sensitivity of the strain measurement.