Embed Size (px)
Citation preview

NORTHWEST TERRITORIES:
COMMUNITY RECREATION
NEEDS ASSESSMENT
BUILDING HEALTHY COMMUNITIES IN THE NWT REPORT

NORTHWEST TERRITORIES: COMMUNITY RECREATION NEEDS ASSESSMENT
BUILDING HEALTHY COMMUNITIES IN THE NWT REPORT
prepared by
World Leisure Professional Services http://www.worldleisure.org/Consultation/main.html
Research Team
Samuel V. Lankford, Ph.D. Director, World Leisure Professional Services
E-mail: [email protected]: 001-319-273-6840 Fax: 001-319-273-5958
Larry Neal, Ed.D.
Pacific Northwest World Leisure Professional Services Representative E-mail: [email protected]
Oksana Grybovych, M.Sc.
University of Northern Iowa
Angie Meredith, B.A. University of Northern Iowa
presented to
Northwest Territories Municipal and Community Affairs
- 2004 -

ACKNOWLEDGEMENTS
The World Leisure Professional Services (WPS) acknowledges the significant contribution and vision of the following professionals: Chris Szabo, Ian Legaree and Gary Schauerte of the NWT MACA. Without their professionalism and vision a study such as this would not have been possible.
We would also like to thank all the NWT Sport and Recreation partners for helping us to collect the data.
Building Healthy Communities in the NWT Report World Leisure Professional Services http://www.worldleisure.org

EXECUTIVE SUMMARY This study focuses on assessing recreation needs of fourteen communities of the Northwest Territories (Canada) including (in alphabetical order): Enterprise, Fort Good Hope, Ford Liard, Fort McPherson, Fort Providence, Fort Resolution, Fort Simpson, Fort Smith, Hay River, Inuvik, Jean Marie River, Nahanni Butte, Trout Lake and Wrigley. Until now, there has been no research done on recreation activities and needs in these communities. Data collected is of the utmost importance, due to the sole fact that communities themselves developed questions that were included in the survey questionnaire addressing issues and needs considered as the most appropriate towards analysis of recreation and its role in community development. Furthermore, study results can be used to develop and implement recreation activities plan appropriate for each and single community. Total 1560 survey questionnaires were completed and analyzed giving wealth of information regarding recreation behaviors, benefits and constraints of study participants. Survey questionnaires were distributed through various sources including community meetings, recreation centers, schools and local sporting events. Respondents were asked to fill out the survey at the time of the event and hand it in immediately after completion. This method helped to increase the response rate, as respondents were not allowed to turn in surveys at a later period of time. Approximately 15 surveys were excluded from the analysis because completion rates of those individual surveys were less than 50%. Results were found to be significant and substantial for each community and as a whole. Due to the fact that communities surveyed differ significantly in size, the study grouped all fourteen communities in three major groups: small, medium and large communities. 19 surveys completed by the NWT Youth Council members were included in analysis as the “small community”. Therefore, the report refers to “fifteen communities surveyed”. In regard to characteristics of respondents, different gender, age and ethnic groups were represented rather equally. Overall, slight majority of study participants were female (59%), age bracket of 15 to 24 years old (39%), aboriginal (67.9%). Comparison of these characteristics with the NWT Bureau of Statistics data confirmed that the survey sample adequately represented the overall population of the Northwest Territories. Survey questionnaire utilized for this study, asked respondents to evaluate appropriateness of recreation sites and resources, estimate the role of leisure and recreation in community everyday life, describe their favorite recreation activities, describe leisure participation, comment upon benefits and constraints of leisure/recreation participation, community volunteering etcetera.
Building Healthy Communities in the NWT Report World Leisure Professional Services http://www.worldleisure.org

Eighty-nine percent of respondents said recreation is “important” to their quality of life. Further, in general study participants indicated that their communities had enough of the recreation resources (parks/fields/trails, facilities, volunteers, programs and leaders/coaches). At the same time, facilities were considered insufficient (47.4% answering “insufficient”). Within community groups, four out of six small-size communities expressed dissatisfaction with the adequacy of facilities in their communities (both Enterprise community and the NWT Youth Council were dissatisfied with almost all recreation resources except for parks/fields/trails). When asked about their recreation behaviors, 65.7% of respondents said they have participated in a recreation activity in the previous year. Those who did not participate, said they had no time or no interest to participate in programs offered. Within large communities, one-third of respondents said there is lack of information regarding recreation opportunities. In regard to information sources concerning recreation activities within their communities, the top promotional mediums included (in order): word of mouth (32%), bulletin boards (24%), radio (16%), newspapers (15%) and posters (13). Improved publicity could therefore increase the word of mouth throughout communities, reaching a wider range of participants. Activities that showed most participation among study participants, were: general activities: spending time with friends/family (89%), watching television (88%),
reading (83%), watching videos (83%), walking/running/jogging (82%); cultural, art of drama activities: attending a concert or play (55%), crafts (53%), dancing
(52%); special community events: Canada Day (92%), carnivals (89%), Christmas games (84%); physical activities/sports: swimming (58%), volleyball (56%), soccer (54%), organized
team sports (53%), basketball (52%), softball (51%); on the land and water activities/sports: bicycling (80%), camping/going out on the land
(77%), boating (75%), snowmobiling (72%), fishing (70%), hiking/backpacking (56%). The top five favorite recreation activities included soccer, volleyball, ice hockey, basketball and swimming. Majority of respondents (59%) stated that it was very important or important in their lives. In regard to participation patterns, forty percent of respondents said they participated in their favorite recreation activity once a month, versus fifteen percent who almost never participated. Furthermore, respondents were asked to identify activities they have not participated in but would like to try. Five activities (out of the list of 101) showed the most significance among all communities: dog sledding, kayaking, snowshoeing, broomball, and cross country skiing. The survey questionnaire also asked respondents whether they have participated in the Arctic Winter Games, Territorial or Regional Trials. Only 28% have participated in this event. Among them 83% were athletes, 11% were volunteers, and 6% were coaches. Respondents-participants of the AWG indicated that the strongest benefit was that the Games build excitement and involvement of the people in the community. One of the unique features of this study is that it asked participants to comment upon their perceptions of leisure/recreation participation benefits and constraints. First, survey respondents
Building Healthy Communities in the NWT Report World Leisure Professional Services http://www.worldleisure.org

were asked to rate the 11 benefits of recreation on a 5-point Likert-type scale (5=strongly agree, 4=agree, 3=don’t agree or disagree, 2=disagree, 1=strongly disagree). Two major factors were determined: interaction within community and personal development/growth. Items that scored highest were (in order by mean scores) “to have fun”, “provides a physical challenge”, “a chance to meet new people” and “provides mental stimulation”. Second, respondents were asked to rate the 20 constraints on a 5-point Likert-type scale (5=strongly agree, 4=agree, 3=don’t agree or disagree, 2=disagree, 1=strongly disagree). Within the constraints category, three main factors were determined: social/physical issues and constraints, personal issues and constraints, and program issues and constraints. Personal issues, such as work and school commitments and cost of equipment, were identified as the main constrains to leisure. Another distinctive feature of this study was its assessment of the role of recreation to community development. Respondents were asked to rate the 14 statements about recreation and community satisfaction on a 5-point Likert-type scale (5=strongly agree, 4=agree, 3=don’t agree or disagree, 2=disagree, 1=strongly disagree). Factor analysis revealed three major factors influencing respondents’ perception of the role of recreation in community development (in order): positive outcomes, negative outcomes and impact of recreation. Within Factor 1 (“positive thoughts on community”), small communities scored highest on “the future of the community looks positive” (mean score=3.51), medium communities agreed that “people of this community continually look for new solutions to problems” (mean score=3.46), and large communities scored the highest on other items listed (in order): “the community has good leaders” (mean score=3.51), “I am satisfied with the quality of life in this community” (mean score=3.36), “there is an adequate number of recreation opportunities here in this community” (mean score=3.17) and “this community is an ideal place to live because of recreation” (mean score=3.17). Within Factor 2 (“negative thoughts on community”), only four out of fifteen communities (Nahanni Butte, Fort Liard, Fort Simpson and Inuvik) disagreed with the statement “not much can be said in favor of this community”, versus eleven others who agreed. The other statement that “people will not work together to get things done” scored high among all communities surveyed. Finally, within Factor 3 (“impact of recreation”), all communities agreed that recreation plays a positive role in community development. Finally, respondents were asked if they volunteer in their community and why or why not. Overall, the response to this question was very well split down the middle (55% “yes” versus 45% “no”). Those who responded they do not volunteer, indicated the four major reasons as follows: no time, no opportunities to volunteer, no interest, and laziness. Further, despite commonalities between communities, community groups differed in their answers: prevalent reason of non-participation in volunteering within large communities was the lack of information regarding activities, followed by the lack of time. Within medium and small communities, lack of information did not appear as significant.
Overall, the study collected a wealth of information on various issues. A number of respondents expressed their appreciation of the survey, along with hopes for changes. Majority of study participants gave extensive comments on questions asked. All their ideas were analyzed and included in this report.
Building Healthy Communities in the NWT Report World Leisure Professional Services http://www.worldleisure.org

TABLE OF CONTENTS LIST OF TABLES......................................................................................................................................................i LIST OF FIGURES................................................................................................................................................. iii LIST OF APPENDIXES ..........................................................................................................................................iv 1. INTRODUCTION......................................................................................................................................8 1.1. PURPOSE OF THE STUDY .....................................................................................................................8 1.2. METHODOLOGY .....................................................................................................................................8 1.3. SURVEY RESPONSE ...............................................................................................................................8 2. CHARACTERISTICS OF RESPONDENTS...........................................................................................11 2.1. GENDER..................................................................................................................................................11 2.2. AGE..........................................................................................................................................................13 2.3. ETHNICITY.............................................................................................................................................15 3. ASSESSMENT OF RECREATION PROGRAMS, FACILITIES AND RESOURCES.........................17 3.1. RECREATION AND QUALITY OF LIFE .............................................................................................17 3.2. ADEQUACY OF RESOURCES..............................................................................................................19 3.3. RECREATION PARTICIPATION RATES ............................................................................................22 4. RECREATION BEHAVIORS .................................................................................................................23 4.1. FAVORITE RECREATION ACTIVITIES .............................................................................................23
4.1.1. LIST OF FAVORITE RECREATION ACTIVITIES...................................................................................23 4.1.2. FREQUENCY OF PARTICIPATION IN A FAVORITE RECREATION ACTIVITY ..............................24 4.1.3. IMPORTANCE OF A FAVORITE RECREATION ACTIVITY ................................................................25
4.2. LEISURE PARTICIPATION/ACTIVITIES RESPONDENTS PARTICIPATE IN ...............................26 4.2.1. GENERAL RECREATION ACTIVITIES ...................................................................................................26 4.2.2. CULTURAL, ART OR DRAMA ACTIVITIES ..........................................................................................28 4.2.3. SPECIAL COMMUNITY EVENTS ............................................................................................................30 4.2.4. PHYSICAL ACTIVITIES/SPORTS.............................................................................................................32 4.2.5. ON THE LAND AND WATER ACTIVITIES/SPORTS .............................................................................34
4.3. ACTIVITIES DESIRED BY RESPONDENTS.......................................................................................36 5. BENEFITS OF PARTICIPATION IN RECREATION PROGRAMS ....................................................37 6. CONSTRAINTS TO PARTICIPATION IN RECREATION PROGRAMS ...........................................40 7. PROGRAM INFORMATION..................................................................................................................44 8. ARCTIC WINTER GAMES....................................................................................................................47 8.1. AWG PARTICIPATION RATES............................................................................................................47 8.2. AWG BENEFITS.....................................................................................................................................50 9. VOLUNTEERISM...................................................................................................................................52 10. CONTRIBUTION OF RECREATION TO COMMUNITY DEVELOPMENT .....................................55 11. ANALYSIS OF OPEN-ENDED QUESTIONS, BY COMMUNITY......................................................60 REFERENCES ........................................................................................................................................................71 APPENDIXES.........................................................................................................................................................72
Building Healthy Communities in the NWT Report World Leisure Professional Services http://www.worldleisure.org

LIST OF TABLES TABLE 1.1. NUMBER OF SURVEYS BY COMMUNITY (N=1560).......................................................................9 TABLE 1.2. COMMUNITY GROUPING TABLE ....................................................................................................10TABLE 2.1. COMPARISON OF SURVEY GENDER DATA WITH THE NWT CENSUS....................................11 TABLE 2.2. GENDER OF RESPONDENTS, BY COMMUNITY (PERCENTAGES) ............................................12 TABLE 2.3. COMPARISON OF SURVEY AGE DATA WITH THE NWT CENSUS............................................13TABLE 2.4. AGE OF RESPONDENTS, BY COMMUNITY (PERCENTAGES) ....................................................14 TABLE 2.5. COMPARISON OF SURVEY ETHNICITY DATA WITH THE NWT CENSUS...............................15TABLE 2.6. ETHNIC BACKGROUND OF RESPONDENTS, BY COMMUNITY (PERCENTAGES).................16 TABLE 3.1. IMPORTANCE OF RECREATION PROGRAMS TO THE QUALITY OF LIFE, BY COMMUNITY
(PERCENTAGES) ..............................................................................................................................................18 TABLE 3.2. ADEQUACY OF RECREATION RESOURCES, BY COMMUNITY (PERCENTAGES).................20 TABLE 3.3. PARTICIPATION IN A COMMUNITY RECREATION PROGRAM OR ACTIVITY, .....................22 BY COMMUNITY (PERCENTAGES)......................................................................................................................22 TABLE 4.1. TOP 3 FAVORITE RECREATION ACTIVITIES * .............................................................................23 TABLE 4.2. PARTICIPATION IN A FAVORITE RECREATION ACTIVITY, BY COMMUNITY
(PERCENTAGES) ..............................................................................................................................................24 TABLE 4.3. IMPORTANCE OF A FAVORITE RECREATION ACTIVITY, BY COMMUNITY
(PERCENTAGES) ..............................................................................................................................................25 TABLE 4.4. PARTICIPATION IN GENERAL RECREATION ACTIVITIES, BY COMMUNITY (MEAN
SCORES*)...........................................................................................................................................................27 TABLE 4.5. PARTICIPATION IN CULTURAL, ART OR DRAMA ACTIVITIES, BY COMMUNITY (MEAN
SCORES*)...........................................................................................................................................................29 TABLE 4.6. PARTICIPATION IN SPECIAL COMMUNITY EVENTS (PERCENTAGES) ..................................30 TABLE 4.7. EXPLORES PARTICIPATION RATES IN SPECIAL COMMUNITY EVENTS, BY COMMUNITY..
.............................................................................................................................................................................30TABLE 4.7. PARTICIPATION IN SPECIAL COMMUNITY EVENTS, BY COMMUNITY (MEAN SCORES*)
.............................................................................................................................................................................31TABLE 4.8. PARTICIPATION IN PHYSICAL ACTIVITIES/SPORTS (PERCENTAGES)...................................32 TABLE 4.9. PARTICIPATION IN PHYSICAL ACTIVITIES/SPORTS, BY COMMUNITY (MEAN SCORES*)33TABLE 4.10. PARTICIPATION IN THE LAND AND WATER ACTIVITIES (PERCENTAGES) .......................34 TABLE 4.11. PARTICIPATION IN THE LAND AND WATER ACTIVITIES, BY COMMUNITY (MEAN
SCORES*)...........................................................................................................................................................35 TABLE 4.12. TOP 10 ACTIVITIES DESIRED BY RESPONDENTS......................................................................36 TABLE 5.1. BENEFITS OF PARTICIPATION IN RECREATION PROGRAMS (PERCENTAGES)...................38 TABLE 5.2. BENEFITS OF PARTICIPATION IN RECREATION PROGRAMS, BY COMMUNITY (MEAN
SCORES*)...........................................................................................................................................................39 TABLE 6.1. REASONS FOR NON-PARTICIPATION IN LEISURE ACTIVITIES (PERCENTAGES)................41 TABLE 6.2. REASONS FOR NON-PARTICIPATION IN LEISURE ACTIVITIES, BY COMMUNITY (MEAN
SCORES*)...........................................................................................................................................................42 TABLE 7.1. SOURCES OF PROGRAM INFORMATION*.....................................................................................45 TABLE 7.2. SOURCES OF PROGRAM INFORMATION, BY COMMUNITY (PERCENTAGES)......................46 TABLE 8.1. PARTICIPATION IN THE ARCTIC WINTER GAMES, BY COMMUNITY (PERCENTAGES) ....48 TABLE 8.2. ROLE IN THE ARCTIC WINTER GAMES, BY COMMUNITY (PERCENTAGES) ........................49 TABLE 8.3. BENEFITS OF PARTICIPATION IN THE ARCTIC WINTER GAMES (PERCENTAGES) ............50 TABLE 8.4. BENEFITS OF PARTICIPATION IN THE ARCTIC WINTER GAMES, BY COMMUNITY (MEAN
SCORES*)...........................................................................................................................................................51
Building Healthy Communities in the NWT Report World Leisure Professional Services http://www.worldleisure.org
i

TABLE 9.1. VOLUNTEER PARTICIPATION, BY COMMUNITY (PERCENTAGES) ........................................53 TABLE 9.2. DOES BEING ACTIVE IN RECREATION HELP TO BECOME A COMMUNITY VOLUNTEER,
BY COMMUNITY (PERCENTAGES) ..............................................................................................................54 TABLE 10.1. FACTOR 1: POSITIVE THOUGHTS ON COMMUNITY, BY COMMUNITY (MEAN SCORES*)
.............................................................................................................................................................................56TABLE 10.2. FACTOR 2: NEGATIVE THOUGHTS ON COMMUNITY, BY COMMUNITY (MEAN SCORES*)
.............................................................................................................................................................................57TABLE 10.3. FACTOR 3: IMPACTS AND BENEFITS OF RECREATION, BY COMMUNITY (MEAN
SCORES*)...........................................................................................................................................................58
Building Healthy Communities in the NWT Report World Leisure Professional Services http://www.worldleisure.org
ii

LIST OF FIGURES FIGURE 1.1. DISTRIBUTION OF RESPONSES BY COMMUNITY (N=1560) ......................................................9 FIGURE 2.1. GENDER OF RESPONDENTS (N=1328)...........................................................................................11 FIGURE 2.2. AGE OF RESPONDENTS (N=1328)...................................................................................................13 FIGURE 2.3. ETHNIC BACKGROUND OF RESPONDENTS (N=1428) ...............................................................15 FIGURE 3.1. IMPORTANCE OF RECREATION ACTIVITIES TO THE QUALITY OF LIFE (N=1530) ............17 FIGURE 3.2. ADEQUACY OF RECREATION RESOURCES (PERCENTAGES).................................................19 FIGURE 4.1. MOST COMMONLY PARTICIPATED GENERAL RECREATION ACTIVITIES .........................26 FIGURE 7.1. TOP 5 SOURCES OF PROGRAM INFORMATION..........................................................................44 FIGURE 8.1. PARTICIPATION IN THE ARCTIC WINTER GAMES....................................................................47 FIGURE 8.2. ROLE IN THE ARCTIC WINTER GAMES........................................................................................48 FIGURE 9.1. VOLUNTEER PARTICIPATION........................................................................................................52
Building Healthy Communities in the NWT Report World Leisure Professional Services http://www.worldleisure.org
iii

LIST OF APPENDIXES
APPENDIX 1. COMPREHENSIVE SURVEY ......................................................................................................72 APPENDIX 2. LISTING OF FAVORITE RECREATION ACTIVITIES .............................................................79 APPENDIX 3. LISTING OF GENERAL RECREATION ACTIVITIES ..............................................................80 APPENDIX 4. PARTICIPATION IN GENERAL RECREATION ACTIVITIES, BY COMMUNITY (PERCENTAGES) ..................................................................................................................................................81 PARTICIPATION IN GENERAL RECREATION ACTIVITIES, BY COMMUNITY (PERCENTAGES), CONT. 82 APPENDIX 5. PARTICIPATION IN CULTURAL, ART OR DRAMA ACTIVITIES, BY COMMUNITY (PERCENTAGES) ..................................................................................................................................................83 APPENDIX 6. FACTOR ANALYSIS OF LEISURE BENEFITS .........................................................................85 APPENDIX 7. FACTOR ANALYSIS OF LEISURE CONSTRAINTS ................................................................86 APPENDIX 8. FACTOR ANALYSIS OF THOUGHTS REGARDING COMMUNITIES ..................................87
Building Healthy Communities in the NWT Report World Leisure Professional Services http://www.worldleisure.org
iv

1. INTRODUCTION
1.1. PURPOSE OF THE STUDY The main purpose of this study is to assess recreation needs of the fifteen communities surveyed1. Respondents were asked to estimate how their recreation needs are being met in their communities and give comments upon improvement of the current situation. Various questions were asked to evaluate appropriateness of recreation sites and resources and to estimate the role of leisure and recreation in community everyday life. The survey covered several components of recreation and sports, such as adequacy of resources, favorite leisure activities, benefits and constraints of leisure/recreation participation, community volunteering, impacts of recreation on community development and others.
1.2. METHODOLOGY “Building Healthy Communities in the NWT: Community Recreation Needs Surveys” (see Appendix 1) were distributed throughout fifteen different communities in the Northwest Territories. Communities-participants of the study included (in alphabetical order): Enterprise, Fort Good Hope, Ford Liard, Fort McPherson, Fort Providence, Fort Resolution, Fort Simpson, Fort Smith, Hay River, Inuvik, Jean Marie River, Nahanni Butte, Trout Lake and Wrigley. Furthermore, 19 surveys were completed by the NWT Youth Council members. Survey questionnaires were distributed through various sources including community meetings, recreation centers, schools and local sporting events.
1.3. SURVEY RESPONSE In total, from the fifteen communities surveyed, 1560 surveys were completed. Respondents were asked to fill out the survey at the time of the event and hand it in immediately after completion. This method helped to increase the response rate, as respondents were not allowed to turn in surveys at a later period of time. Approximately 15 surveys were excluded from the analysis because completion rates of those individual surveys were less than 50%.
1 Originally, fourteen communities were included in the study. NWT Youth Council members were surveyed separately. Due to the small number of responses, the group was included in the analysis alongside with other communities. Therefore this report refers to fifteen communities surveyed.
Building Healthy Communities in the NWT Report World Leisure Professional Services http://www.worldleisure.org
8

Figure 1.1. depicts distribution of responses by community.
Figure 1.1. Distribution of responses by community (n=1560)
050
100150200250300350400
Hay R
iver
Inuvik
Fort Sim
pson
Fort Good H
ope
Fort Pro
viden
ce
Fort Smith
Fort McP
herson
Fort Liar
d
Fort Res
olution
Nahan
ni Butte
Wrigley
Trout L
ake
NWT Youth
Jean
Mari
e Rive
r
Enterpris
e
Source: Building Healthy Communities in the NWT Survey, 2002-2003.
Table 1.1. shows the exact number of surveys by community.
Table 1.1. Number of surveys by community (n=1560)
Community Number of responses
Hay River 362 Inuvik 330 Fort Simpson 258 Fort Good Hope 114 Fort Providence 102 Fort Smith 88 Fort McPherson 75 Fort Liard 55 Fort Resolution 48 Nahanni Butte 33 Wrigley 30 Trout Lake 20 NWT Youth Council 19 Jean Marie River 15 Enterprise 11
Total 1560 Source: Building Healthy Communities in the NWT Survey, 2002-2003.
Building Healthy Communities in the NWT Report World Leisure Professional Services http://www.worldleisure.org
9

Given the fact that all communities participating in the study differ by size, the study collapsed all responses obtained, in the three major groups: small-size community responses, middle-size community responses, and large-size community responses (data source: NWT Bureau of Statistics). NWT Youth Council responses were included in the small-size community group. Community groupings by size are given in Table 1.2.
Table 1.2. Community grouping table
Community Population 2001, inhabitants
Small communities Jean Marie River 50 Enterprise 61 Trout Lake 70 Nahanni Butte 107 Wrigley 165 NWT Youth Council* Medium communities Fort Resolution 525 Fort Liard 530 Fort Good Hope 549 Fort Providence 753 Fort McPherson 761 Large communities Fort Simpson 1,163 Fort Smith 2,185 Inuvik 2,894 Hay River 3,510
**Note: NWT Youth Council responses were included in the small-size community group Source: NWT Bureau of Statistics, 2002.
Building Healthy Communities in the NWT Report World Leisure Professional Services http://www.worldleisure.org
10

2. CHARACTERISTICS OF RESPONDENTS
2.1. GENDER According to the NWT Bureau of Statistics, the population of Northwest Territories is rather equally distributed with 52% males and 48% females (Community Population Estimates by Gender, NWT, July 1, 2002. NWT Bureau of Statistics). The study also had a good mix of gender. Slight majority of study participants were female (880 respondents, or 59%). 606 study participants were male (41% respectively). Out of 1560 surveyed, only 5% chose not to fill in the demographic information (not included in the figure). Figure 2.1. shows gender of respondents. Table 2.1. compares the gender distribution of study participants with the overall population of Northwest Territories (Community Population Estimates by Gender, NWT, July 1, 2002. NWT Bureau of Statistics). As the table depicts, study sample represents the overall population of the Northwest Territories.
Figure 2.1. Gender of respondents (n=1328)
male41%
female59%
Source: Building Healthy Communities in the NWT Survey, 2002
Gender characteristics of respondents by community aall communities had a good mix of gender, with thmembers, who were predominantly female.
Building Healthy Communities in the NWT Report World Leisure Professional Services http://www.worldleisure.org
Table 2.1. Comparison of survey gender data with the NWT census
Gender Survey participants
NWT population
Male 41% 52%
Female 59% 48%
Source: NWT Bureau of Statistics, 2002.
-2003.
re given in Table 2.2. As the table depicts, e exception of the NWT Youth Council
11

Table 2.2. Gender of respondents, by community (percentages)
Community Male Female Small communities Jean Marie River 53 47 Enterprise 43 57 Trout Lake 50 50 Nahanni Butte 48 52 Wrigley 35 65 NWT Youth Council 11 89 Medium communities Fort Resolution 37 63 Fort Liard 53 47 Fort Good Hope 50 50 Fort Providence 38 62 Fort McPherson 50 50 Large communities Fort Simpson 38 62 Fort Smith 44 56 Inuvik 36 64 Hay River 40 60
Overall 41 59 Source: Building Healthy Communities in the NWT Survey, 2002-2003.
Building Healthy Communities in the NWT Report World Leisure Professional Services http://www.worldleisure.org
12
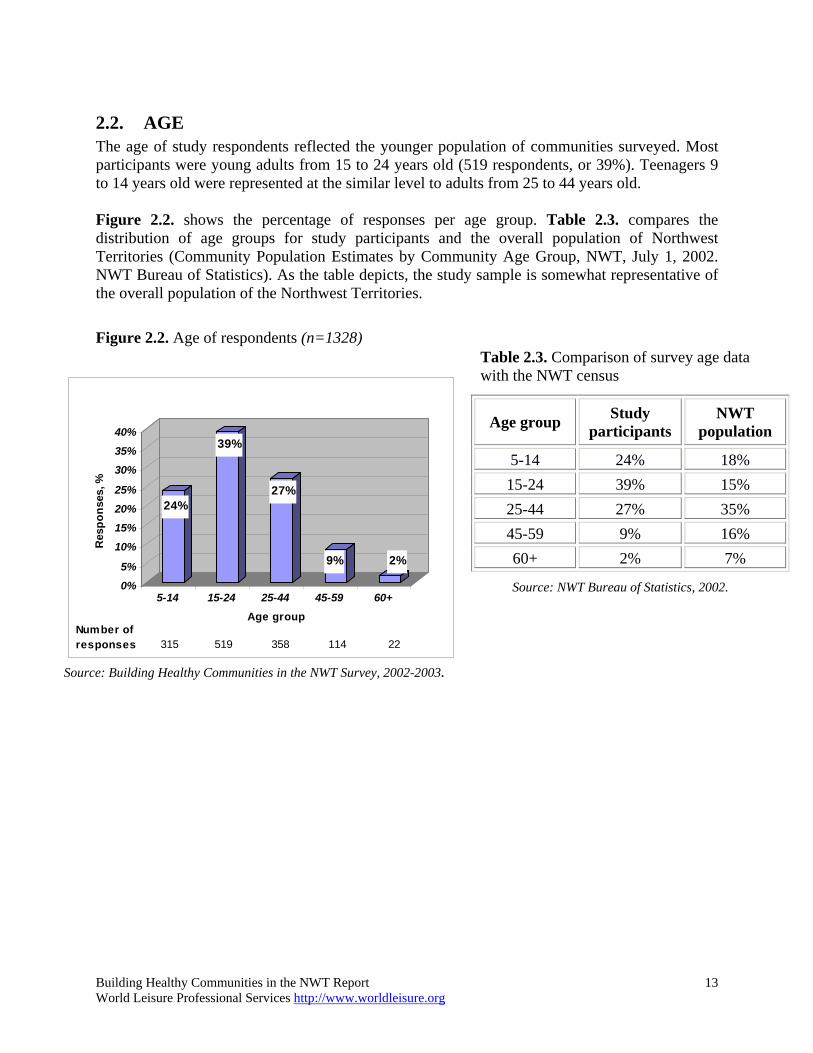
2.2. AGE The age of study respondents reflected the younger population of communities surveyed. Most participants were young adults from 15 to 24 years old (519 respondents, or 39%). Teenagers 9 to 14 years old were represented at the similar level to adults from 25 to 44 years old. Figure 2.2. shows the percentage of responses per age group. Table 2.3. compares the distribution of age groups for study participants and the overall population of Northwest Territories (Community Population Estimates by Community Age Group, NWT, July 1, 2002. NWT Bureau of Statistics). As the table depicts, the study sample is somewhat representative of the overall population of the Northwest Territories.
Figure 2.2. Age of respondents (n=1328)
Age group Study participants
NWT population
5-14 24% 18% 15-24 39% 15% 25-44 27% 35% 45-59 9% 16% 60+ 2% 7%
Table 2.3. Comparison of survey age data with the NWT census
Source: NWT Bureau of Statistics, 2002.
24%
39%
27%
9% 2%
0%5%
10%15%20%25%
30%35%40%
Res
pons
es, %
5-14 15-24 25-44 45-59 60+Age group
Number of responses 315 519 358 114 22
Source: Building Healthy Communities in the NWT Survey, 2002-2003.
Building Healthy Communities in the NWT Report World Leisure Professional Services http://www.worldleisure.org
13

Age characteristics of respondents by community are given in the Table 2.4.
Table 2.4. Age of respondents, by community (percentages)
Community 5-14 15-24 25-44 45-59 60+
Small communities
Jean Marie River 25 25 50 Enterprise 17 17 50 17 Trout Lake 31 13 31 13 13 Nahanni Butte 23 19 46 8 4 Wrigley 19 24 43 14 NWT Youth Council 83 17 Medium communities Fort Resolution 3 41 38 13 5 Fort Liard 31 36 24 5 5 Fort Good Hope 12 33 28 19 8 Fort Providence 11 38 39 11 Fort McPherson 29 45 13 10 3 Large communities Fort Simpson 12 30 42 15 1 Fort Smith 10 64 20 6 Inuvik 26 40 29 4
Hay River 42 41 12 5 Overall 24 39 27 9 2
Source: Building Healthy Communities in the NWT Survey, 2002-2003.
Building Healthy Communities in the NWT Report World Leisure Professional Services http://www.worldleisure.org
14
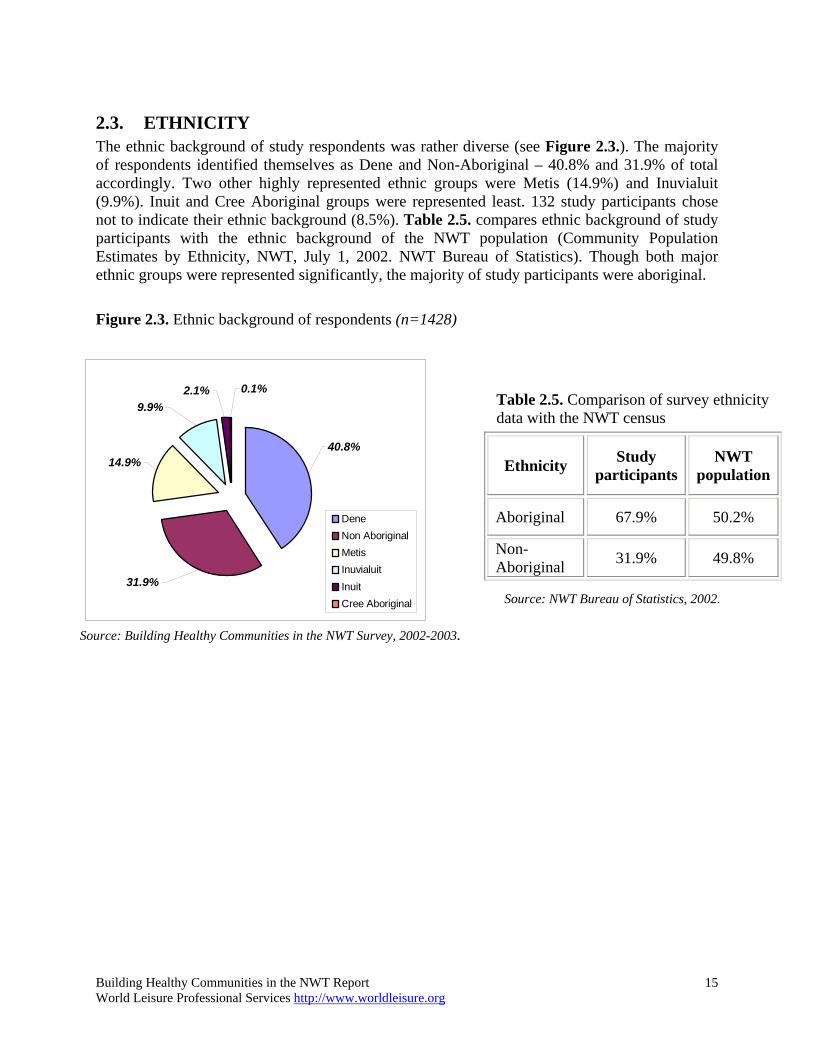
2.3. ETHNICITY The ethnic background of study respondents was rather diverse (see Figure 2.3.). The majority of respondents identified themselves as Dene and Non-Aboriginal – 40.8% and 31.9% of total accordingly. Two other highly represented ethnic groups were Metis (14.9%) and Inuvialuit (9.9%). Inuit and Cree Aboriginal groups were represented least. 132 study participants chose not to indicate their ethnic background (8.5%). Table 2.5. compares ethnic background of study participants with the ethnic background of the NWT population (Community Population Estimates by Ethnicity, NWT, July 1, 2002. NWT Bureau of Statistics). Though both major ethnic groups were represented significantly, the majority of study participants were aboriginal.
Figure 2.3. Ethnic background of respondents (n=1428)
40.8%
31.9%
14.9%
9.9%0.1%2.1%
DeneNon AboriginalMetisInuvialuitInuitCree Aboriginal
Source: Building Healthy Communities in the NWT Survey, 2002-2003.
Building Healthy Communities in the NWT Report World Leisure Professional Services http://www.worldleisure.org
Table 2.5. Comparison of survey ethnicity data with the NWT census
Ethnicity Study participants
NWT population
Aboriginal 67.9% 50.2%
Non-Aboriginal 31.9% 49.8%
Source: NWT Bureau of Statistics, 2002.
15

Table 2.6. expands on ethnical background of survey respondents and examines it by community.
Table 2.6. Ethnic background of respondents, by community (percentages)
Community Inuvialuit Dene Metis Inuit Non-Aboriginal
Cree Aboriginal
Small communities Jean Marie River 14 86 Enterprise 17 83 Trout Lake 100 Nahanni Butte 97 3 Wrigley 69 12 19 NWT Youth Council 5 68 26 Medium communities Fort Resolution 2 61 28 9 Fort Liard 74 11 15 Fort Good Hope 5 70 15 10 Fort Providence 1 79 15 1 3 Fort McPherson 73 10 2 15 Large communities Fort Simpson 5 43 10 3 38 Fort Smith 6 29 20 1 39 2 Inuvik 35 18 8 3 36 Hay River 3 15 25 3 55
Overall 9.9 40.8 14.9 2.1 31.9 0.1 Source: Building Healthy Communities in the NWT Survey, 2002-2003.
Building Healthy Communities in the NWT Report World Leisure Professional Services http://www.worldleisure.org
16

3. ASSESSMENT OF RECREATION PROGRAMS, FACILITIES AND RESOURCES
3.1. RECREATION AND QUALITY OF LIFE Respondents were asked to evaluate the importance of recreation to their quality of life on a 4-point Likert-type scale (4=very important, 3=important, 2=not important, 1=no opinion). Out of 1560 respondents, only 168 (10.8%) indicated their attitude towards the importance of recreation to their quality of life as either “not important” or “no opinion”. Figure 3.1. illustrates that recreation activities promote a quality of life in the Northwest Territories (89% of respondents said that recreation was “very important” or “important” to their quality of life).
Figure 3.1. Importance of recreation activities to the quality of life (n=1530)
Very Important,
42.5%
Important, 46.5%
Not Important,
6.5%
No Opinion,
4.4%
Source: Building Healthy Communities in the NWT Survey, 2002-2003.
Table 3.1. shows detailed distribution of responses by community (in percentages) along with mean scores on a 4-point scale. All communities surveyed scored high on importance of recreation activities to the quality of life. However, there are minor differences between community groups. Small communities scored higher overall (mean score=3.40), followed by medium-size communities (mean score=3.30) and large-size communities (mean score=3.24).
Building Healthy Communities in the NWT Report World Leisure Professional Services http://www.worldleisure.org
17

Further, the Enterprise community scored the lowest (mean score=2.5), rating the importance of recreation activities as either “not important” or “no opinion” (50%). This could be of concern to the Recreation Department of the community. Possible explanations of these results could be sought in comments to open-ended questions within the Enterprise Community (see Chapter 11 of this report).
Table 3.1. Importance of recreation programs to the quality of life, by community (percentages)
Community Very important Important Not
importantNo
opinion Mean
scores* Jean Marie River 60.0 40.0 3.60 Wrigley 56.7 36.7 6.7 3.50 Trout Lake 52.6 42.1 5.3 3.47 Nahanni Butte 56.3 37.5 6.3 3.44 NWT Youth Council 52.6 36.8 10.5 3.42 Enterprise 10.0 40.0 40.0 10.0 2.50
Overall for small communities 52.0 38.4 7.2 2.4 3.40
Fort Resolution 59.6 34.0 6.4 3.53 Fort Good Hope 44.7 45.6 4.4 5.3 3.30 Fort Providence 52.0 32.7 7.1 8.2 3.29 Fort McPherson 42.5 43.8 8.2 5.5 3.23 Fort Liard 34.0 58.5 3.8 3.8 3.23 Overall for medium communities 46.5 42.3 6.0 5.2 3.30
Inuvik 41.2 48.9 6.2 3.7 3.28 Fort Simpson 40.6 48.4 7.5 3.5 3.26 Hay River 38.9 49.6 6.5 5.1 3.22 Fort Smith 37.5 48.9 6.8 6.8 3.17
Overall for large communities 39.9 49.0 6.7 4.4 3.24
Overall for all communities 42.5 46.5 6.5 4.4 3.27 *Scale 1-4: 1=no opinion, 2=not important, 3=important, 4=very important
Source: Building Healthy Communities in the NWT Survey, 2002-2003.
Building Healthy Communities in the NWT Report World Leisure Professional Services http://www.worldleisure.org
18

3.2. ADEQUACY OF RESOURCES Respondents were asked whether they believe their community has enough recreation resources, including: parks/fields/trails, facilities, volunteers, programs, and leaders/coaches. Overall, study participants indicated that their communities had enough of the resources. Most of the answers were very well split down in the middle. However, facilities were considered insufficient (47.4% answering “insufficient”). Figure 3.2. illustrates distribution of responses concerning adequacy of recreation resources.
Figure 3.2. Adequacy of recreation resources (percentages)
51.5
47.4
57.552.0 52.7
48.5
52.6
42.548.0 47.3
0
10
20
30
40
50
60
70
parks/fields/tra
ils
facilities
volunteers
programs
leaders/coaches
Recreation resource
Impo
rtant
/ Not
impo
rtant
, %
yesno
Source: Building Healthy Communities in the NWT Survey, 2002-2003.
Table 3.2. further explores satisfaction with resources by each community surveyed. The results are especially interesting for the situation within small communities. Four out of six small-size communities expressed dissatisfaction with the adequacy of facilities in their communities. Furthermore, both Enterprise community and the NWT Youth Council were dissatisfied with almost all recreation resources except for parks/fields/trails. Jean Marie River and Trout Lake communities are also concerned about the condition of parks, fields and trails within their communities. More, Jean Marie River community members indicated that leaders and coaches in their community are not adequate.
Building Healthy Communities in the NWT Report World Leisure Professional Services http://www.worldleisure.org
19

Table 3.2. Adequacy of recreation resources, by community (percentages)
Parks/ Fields/ Trails Facilities Volunteers Programs Leaders /
Coaches Community yes no yes no yes no yes no yes no
Jean Marie River 14.3* 85.7 40.0 60.0 53.3 46.7 40.0 60.0 28.6 71.4 Enterprise 60.0 40.0 22.2 77.8 30.0 70.0 25.0 75.0 12.5 87.5 Trout Lake 30.0 70.0 45.0 55.0 65.0 35.0 33.3 66.7 50.0 50.0 Nahanni Butte 53.1 46.9 21.9 78.1 63.3 36.7 38.7 61.3 44.4 55.6 Wrigley 34.6 65.4 28.6 71.4 51.7 48.3 39.1 60.9 53.6 46.4 NWT Youth Council 31.6 68.4 29.4 70.6 29.4 70.6 16.7 83.3 6.3 93.8
Small communities 39.2 60.8 30.8 69.2 55.8 44.2 37.0 63.0 43.0 57.0
Fort Resolution 15.6 84.4 36.2 63.8 48.9 51.1 40.0 60.0 39.5 60.5 Fort Liard 44.0 56.0 57.1 42.9 41.2 58.8 39.6 60.4 40.8 59.2 Fort Good Hope 37.9 62.1 42.7 57.3 50.0 50.0 42.1 57.9 37.4 62.6 Fort Providence 57.3 42.7 44.1 55.9 37.1 62.9 46.8 53.2 47.9 52.1 Fort McPherson 31.0 69.0 48.6 51.4 32.9 67.1 34.8 65.2 34.8 65.2 Medium communities 39.7 60.3 45.3 54.7 42 58 41.3 58.7 40.3 59.7
Fort Simpson 43.8 56.2 49.0 51.0 58.8 41.2 51.1 48.9 60.0 40.0 Fort Smith 72.3 27.7 50.6 49.4 75.0 25.0 60.7 39.3 58.3 41.7 Inuvik 58.2 41.8 52.3 47.7 59.7 40.3 57.7 42.3 53.0 47.0 Hay River 62.9 37.1 49.3 50.7 69.2 30.8 63.2 36.8 64.3 35.7 Large communities 57.5 42.5 50.3 49.7 64.2 35.8 58.3 41.7 59.3 40.7
Overall 51.5 48.5 47.4 52.6 57.5 42.5 52.0 48.0 52.7 47.3 *Note: figures highlighted in red and italicized, represent community’ dissatisfaction with the adequacy of recreation resources
Source: Building Healthy Communities in the NWT Survey, 2002-2003.
The survey questionnaire asked respondents to comment how to improve the current situation regarding community recreation resources. A brief summary of their answers is given below. More detailed information on each community separately is given in Chapter 11 of this report.
Parks/Fields/Trails Overwhelmingly, survey respondents indicated a strong need to maintain/upgrade existing trails and fields, and develop new trails for hiking, bicycling or walking. Middle-size communities also indicated a need for playgrounds within their communities. Maps and signs are considered a need in large communities.
Building Healthy Communities in the NWT Report World Leisure Professional Services http://www.worldleisure.org
20

Facilities The majority of survey respondents indicated the need to upgrade existing facilities and build new ones. Operation hours of facilities are generally considered inadequate and should be changed. Large communities strongly wish to have new swimming pools, sports arenas and courts for various sport programs.
Volunteers All communities surveyed feel a strong lack of volunteers. However, to stimulate volunteering, it was also noted that volunteers should be rewarded and appreciated. Within large communities, survey respondents were eager to volunteer, but they were not aware of programs and volunteer positions. Therefore, wider publicity could be of assistance. Many respondents also proposed to encourage high school students and parents to participate in community volunteering.
Programs The main concern expressed by the majority of study participants was regarding the lack of recreation programs targeted towards various age groups. There is a need to develop programs for children, youth and adults, running throughout the year. When programs are there, they are believed to be poorly publicized and thus not known to the public. Also, there is a need to develop/promote aboriginal/traditional recreation activities.
Leaders/Coaches All communities surveyed indicated the need for more qualified leaders and coaches who could be role models for youth. Furthermore, there is a need to organize local training courses for coaches and encourage community members and especially parents to get involved.
Building Healthy Communities in the NWT Report World Leisure Professional Services http://www.worldleisure.org
21

3.3. RECREATION PARTICIPATION RATES Respondents were asked if anyone in their household has participated in a community recreation program within the previous year. Out of 1560 survey respondents, 939 or 65.7% said they have participated in a recreation activity in the previous year, versus 490 or 34.3% who have not. Eight percent of respondents did not answer the question. Table 3.3. depicts participation levels in a community recreation program, by community.
Table 3.3. Participation in a community recreation program or activity,
by community (percentages)
Community Yes No
Small communities Trout Lake 70 30 NWT Youth Council 65 35 Wrigley 62 39 Nahanni Butte 59 41 Enterprise 50 50 Jean Marie River 46 54 Medium communities Fort Liard 80 20 Fort Providence 69 31 Fort McPherson 61 39 Fort Resolution 58 42 Fort Good Hope 58 42 Large communities Fort Simpson 70 30 Hay River 69 31 Fort Smith 66 34 Inuvik 63 37
Overall 65.7 34.3 Source: Building Healthy Communities in the NWT Survey, 2002-2003.
When answering “no”, respondents were asked to elaborate. The majority of respondents said they have no time or no interest to participate in programs offered. Within large and medium-size communities, one-third of respondents indicated they don’t know of any programs they can participate in. Interestingly, this issue did not appear in small-size communities.
Building Healthy Communities in the NWT Report World Leisure Professional Services http://www.worldleisure.org
22

4. RECREATION BEHAVIORS
4.1. FAVORITE RECREATION ACTIVITIES 4.1.1. LIST OF FAVORITE RECREATION ACTIVITIES This survey question provoked respondents to list their favorite recreation activities (see Appendix 2 for an entire listing of all activities submitted by respondents). Table 4.1. shows the top 3 of these activities. Ice hockey showed the most significance over all communities.
Table 4.1. Top 3 favorite recreation activities *
Recreation activities
Number of responses Percentage
Soccer 141 14 Volleyball 122 12 Ice hockey 121 12 *Note: Respondents could choose more than one response
Source: Building Healthy Communities in the NWT Survey, 2002-2003.
Building Healthy Communities in the NWT Report World Leisure Professional Services http://www.worldleisure.org
23

4.1.2. FREQUENCY OF PARTICIPATION IN A FAVORITE RECREATION ACTIVITY
Respondents were asked to indicate how often they participate in their favorite recreation activity (daily, a few times a week, once a week, once a month, almost never). Overall, the strongest response was “a few times a week”, with 40%. Otherwise, 15% participated daily, 13% participated once a week, 12% participated once a month, and 19% almost never participated in their favorite recreation activity. Table 4.2. explores participation rates by community.
Table 4.2. Participation in a favorite recreation activity, by community (percentages)
Community Daily A few times a week
Once a week
Once a month
Almost never
Jean Marie River 20 33 13 20 13 Enterprise 9 18 45 27 Trout Lake 10 30 15 25 20 Nahanni Butte 13 31 6 25 25 Wrigley 3 34 3 28 31 NWT Youth Council 16 21 11 37 16 Small communities 12 25 11 30 22 Fort Resolution 8 22 19 16 35 Fort Liard 25 34 8 17 17 Fort Good Hope 18 25 22 14 22 Fort Providence 14 29 19 12 26 Fort McPherson 19 34 8 16 23 Medium communities 17 28 15 15 24
Fort Simpson 13 40 18 11 19 Fort Smith 19 46 11 9 15 Inuvik 13 50 11 9 17 Hay River 17 48 12 8 15 Large communities 15 46 13 9 17
Overall 15 40 13 12 19 Source: Building Healthy Communities in the NWT Survey, 2002-2003.
Building Healthy Communities in the NWT Report World Leisure Professional Services http://www.worldleisure.org
24

4.1.3. IMPORTANCE OF A FAVORITE RECREATION ACTIVITY Respondents were asked to evaluate importance of their favorite activity on a 3-point Likert-type scale of very important, important, or sometimes important. Overwhelmingly, respondents stated that it was very important or important in their lives (82%). The remaining 18% said their favorite recreation activity was sometimes important (see Table 4.3.).
Table 4.3. Importance of a favorite recreation activity, by community (percentages)
Community Very important Important Sometimes
important
Small communities Jean Marie River 36 43 21 Enterprise 22 22 56 Trout Lake 50 20 25 Nahanni Butte 35 39 26 Wrigley 38 41 21 NWT Youth Council 32 42 26
Medium communities Fort Resolution 51 38 11 Fort Liard 37 47 16 Fort Good Hope 45 39 15 Fort Providence 38 40 22 Fort McPherson 47 41 12
Large communities Fort Simpson 40 46 14 Fort Smith 45 37 18 Inuvik 38 41 21 Hay River 43 38 19
Overall 41 41 18 Source: Building Healthy Communities in the NWT Survey, 2002-2003.
Building Healthy Communities in the NWT Report World Leisure Professional Services http://www.worldleisure.org
25

4.2. LEISURE PARTICIPATION/ACTIVITIES RESPONDENTS PARTICIPATE IN
In this section of the survey, respondents were asked to rate how often they participate in each of the following leisure and sport activities: (1) general activities, (2) cultural, art or drama activities, (3) special community events, (4) physical activities/sports, (5) on the land/water activities. The possible answers were: most frequently, sometimes, or not at all. The findings are described below. 4.2.1. GENERAL RECREATION ACTIVITIES Of the fourteen general activities listed in the survey questionnaire (see Appendix 3), five activities showed the most participation. These activities included: spending time with friends/family (93%), watching television (92%), watching videos (87%), reading (86%) and walking/running/jogging (85%) (see Figure 4.1.). An interesting note is that four of these activities are individual, meaning there may be no need for other people in order to participate in the activity. Another concern is that at least three out of five activities mentioned, are sedentary (not physically active). Table 4.4. explores participation rates in general recreation activities, by community. It also compares participation rates of small, medium and large-size community groups. For a complete listing of answers, see Appendix 4. Both tables depict that other rather highly participated general recreation activities are playing video games, volunteering time for the community and visiting elders (all three scored 63% on participation), followed by playing bingo or cards (55%), taking a class at a community center (38%), practicing self-defense (37%), geode/scouting programs (18%) and cadet programs (16% participation).
Figure 4.1. Most commonly participated general recreation activities
Source: Building Healthy Communities in the NWT Survey, 2002-20
92% 87%93% 86% 85%
Building Healthy Communities in the NWT Report World Leisure Professional Services http://www.worldleisure.org
03.
26

Table 4.4. Participation in general recreation activities, by community (mean scores*)
Community
Cad
et p
rogr
ams
Gui
de/s
cout
ing
prog
ram
s
Jogg
ing/
run
ning
/w
alki
ng
Pla
ing
bing
o or
y
card
s
Pla
ing
vide
o y ga
mes
Prac
ticin
g se
lf-de
fenc
e
Rea
ding
Spen
ding
time
with
frie
nds
/fam
ily
Tak
ing
a cl
ass a
t a
cty
cen
omm
uni
ter
Usi
ng a
com
pute
r /
et
Inte
rn
Vis
iting
eld
ers
Vol
unte
erin
g tim
e fo
r m
y co
mm
unity
Wat
chin
g te
levi
sion
Wat
chin
g vi
deos
Jean Marie River 1.20 1.27 2.07 1.93 2.07 1.80 2.67** 2.50 2.07 2.00 2.36 2.07 2.29 2.27Enterprise 1.10 1.10 1.40 1.40 1.20 1.10 1.73 1.64 1.20 1.20 1.45 1.40 1.50 1.40Trout Lake 1.12 1.12 2.00 1.78 2.05 1.88 2.40 2.60 1.68 2.15 2.05 2.00 2.40 2.40Nahanni Butte 1.00 1.07 2.00 1.45 1.53 1.24 2.24 2.70 1.29 1.65 2.11 2.00 2.23 2.11Wrigley 1.37 1.23 2.15 1.92 1.60 1.40 2.23 2.50 1.46 1.92 2.12 1.88 2.16 2.04NWT Youth Council 1.18 1.24 2.06 1.79 2.11 1.28 2.50 2.67 1.61 2.22 2.06 2.06 2.44 2.39Mean scores for small communities 1.17 1.17 2.00 1.71 1.76 1.44 2.31 2.51 1.53 1.90 2.06 1.94 2.22 2.15
Fort Resolution 1.14 1.05 2.02 1.91 1.61 1.30 2.20 2.51 1.50 2.14 2.00 1.98 2.22 2.02Fort Liard 1.19 1.34 2.33 1.80 1.89 1.60 2.50 2.56 1.57 2.33 1.85 1.85 2.19 2.28Fort Good Hope 1.28 1.21 1.96 1.73 1.79 1.43 2.09 2.43 1.39 1.89 1.93 1.74 2.27 2.17Fort Providence 1.12 1.18 2.18 2.22 1.78 1.47 2.47 2.57 1.44 2.09 2.01 1.86 2.28 2.11Fort McPherson 1.07 1.13 2.16 1.76 1.81 1.34 1.94 2.48 1.51 1.93 1.82 1.60 2.34 2.11Mean scores for medium communities 1.17 1.18 2.12 1.90 1.78 1.43 2.23 2.50 1.46 2.04 1.93 1.79 2.27 2.14
Fort Simpson 1.21 1.14 2.19 1.68 1.76 1.40 2.36 2.51 1.41 2.18 1.65 1.82 2.24 2.06Fort Smith 1.27 1.15 2.26 1.52 1.79 1.52 2.30 2.54 1.54 2.36 1.53 1.71 2.24 2.21Inuvik 1.24 1.32 2.17 1.69 1.90 1.50 2.29 2.58 1.52 2.25 1.83 1.75 2.30 2.21Hay River 1.32 1.26 2.20 1.60 1.96 1.59 2.28 2.64 1.47 2.36 1.64 1.78 2.38 2.33Mean scores for large communities 1.26 1.24 2.19 1.64 1.88 1.51 2.31 2.58 1.48 2.28 1.69 1.77 2.31 2.22
Overall mean scores 1.23 1.22 2.16 1.71 1.85 1.49 2.29 2.56 1.48 2.19 1.78 1.79 2.29 2.19 *Scale 1-3: 1=not at all, 2=sometimes, 3=most frequently
**Note: figures highlighted in red and italicized, represent high mean scores Source: Building Healthy Communities in the NWT Survey, 2002-2003.
Building Healthy Communities in the NWT Report World Leisure Professional Services http://www.worldleisure.org
27

4.2.2. CULTURAL, ART OR DRAMA ACTIVITIES Respondents were asked to identify cultural, art, or drama activities in which they participate. Only three activities scored over 50% on participation: crafts (57%), attending a concert or play (57%) and dancing (56%). Three other popular arts activities were playing a musical instrument (37%), beading/quill work/tufting (36%) and carving or painting (36%). Overall scores on participation were low across all communities. However, low participation rates could be explained by a lack of these programs in communities. In open-ended questions, many survey respondents stated they would like to see more cultural and art programs and facilities within their communities. Table 4.5. explores participation rates in cultural, art or drama activities, by community. It also compares participation rates of small, medium and large-size community groups. Interestingly, small-size communities scored higher on their participation in cultural, art or drama activities. Participation rates within medium and large communities were somewhat similar. For a complete listing of answers, see Appendix 5.
Building Healthy Communities in the NWT Report World Leisure Professional Services http://www.worldleisure.org
28

Table 4.5. Participation in cultural, art or drama activities, by community (mean scores*)
Community
Att
endi
ng a
co
ncer
t or
play
Bea
ing,
d
quill
wor
k,
tuft
ing
Car
ving
or
pg
aint
in
Cra
fts
Dan
cing
Dru
mm
ing
Part
icip
atin
g in
a
dram
atic
pl
ay
Play
ing
a m
usic
al
inst
rum
ent
Qui
lting
Jean Marie River 2.07 1.93 1.73 2.07 2.20 1.73 1.33 1.60 1.60Enterprise 1.30 1.20 1.30 1.50 1.50 1.20 1.20 1.30 1.20Trout Lake 1.72 2.00 1.63 2.11 1.71 1.41 1.24 1.59 1.33Nahanni Butte 1.62 1.57 1.34 1.60 1.66 1.10 1.10 1.11 1.18Wrigley 1.58 1.76 1.48 1.60 1.80 1.44 1.32 1.52 1.46NWT Youth Council 1.82 1.50 1.39 1.72 2.00 1.89 1.28 1.39 1.17Mean scores for small communities 1.69 1.69 1.47 1.75 1.81 1.44 1.24 1.40 1.32
Fort Resolution 1.56 1.50 1.44 1.70 1.86 1.55 1.19 1.35 1.12Fort Liard 1.72 1.81 1.72 1.79 1.78 1.61 1.30 1.47 1.33Fort Good Hope 1.65 1.56 1.44 1.61 1.61 1.52 1.26 1.37 1.22Fort Providence 1.71 1.65 1.48 1.88 1.93 1.42 1.19 1.51 1.19Fort McPherson 1.58 1.49 1.36 1.72 1.56 1.14 1.24 1.36 1.15Mean scores for medium communities 1.65 1.60 1.47 1.74 1.74 1.44 1.23 1.41 1.20
Fort Simpson 1.61 1.31 1.34 1.65 1.63 1.20 1.16 1.36 1.15Fort Smith 1.73 1.28 1.37 1.55 1.72 1.25 1.18 1.76 1.20Inuvik 1.72 1.50 1.40 1.75 1.72 1.29 1.24 1.48 1.20Hay River 1.66 1.29 1.45 1.64 1.63 1.22 1.34 1.63 1.21Mean scores for large communities 1.67 1.36 1.40 1.67 1.67 1.24 1.25 1.53 1.19
Overall mean scores 1.67 1.44 1.42 1.69 1.70 1.30 1.24 1.49 1.20 *Scale 1-3: 1=not at all, 2=sometimes, 3=most frequently
Source: Building Healthy Communities in the NWT Survey, 2002-2003.
Building Healthy Communities in the NWT Report World Leisure Professional Services http://www.worldleisure.org
29

4.2.3. SPECIAL COMMUNITY EVENTS Within communities, special events are held on specific dates. Survey data showed different levels of participation among different events. The four most popular events were Canada Day (92% participation), carnivals (89% participation), summer festivals (76% participation) and Christmas games (74% participation). Other events were not so popular among respondents. Hamlet Days had the lowest participation rate (43%). See Table 4.6. for participation rates of special community events.
Table 4.6. Participation in special community events (percentages)
Special community events
Most frequently Sometimes Not at all Mean
score* Canada Day 54 38 8 2.46 Carnivals 45 44 11 2.34 Summer festivals 31 45 24 2.07 Christmas games 31 43 26 2.05 Spring games 27 42 30 1.97 Traditional games 26 39 35 1.90 Treaty days 26 32 42 1.84 Summer activities/ Sneaker day 24 35 41 1.83
Hamlet days 14 29 57 1.57 *Scale 1-3: 1=not at all, 2=sometimes, 3=most frequently
Source: Building Healthy Communities in the NWT Survey, 2002-2003.
Table 4.7. explores participation rates in special community events, by community. It also compares participation rates of small, medium and large-size community groups. Within special community events group, all community groups scored comparably. The lowest score was attributed to the Hamlet days, within small-size communities.
Building Healthy Communities in the NWT Report World Leisure Professional Services http://www.worldleisure.org
30

Table 4.7. Participation in special community events, by community (mean scores*)
Community Canada Day Carnivals Christmas
games Hamlet
days Spring games
Summer active/
Sneaker day
Summer festivals
Traditional games
Treaty days
Jean Marie River 2.60** 2.60 2.07 1.79 2.14 1.79 1.93 2.00 2.07Enterprise 1.60 1.60 1.50 1.10 1.00 1.10 1.10 1.00 1.00Trout Lake 2.45 2.55 1.85 1.55 2.25 2.15 1.70 2.30 2.40Nahanni Butte 2.32 2.41 1.70 1.26 2.00 1.74 1.71 1.55 2.07Wrigley 2.26 2.37 2.00 1.48 2.00 1.69 2.00 2.15 2.37NWT Youth Council 2.56 2.53 2.11 1.50 2.16 1.94 2.53 2.56 2.32 Mean scores for small communities 2.34 2.40 1.88 1.45 2.00 1.78 1.88 1.97 2.14
Fort Resolution 2.30 2.30 1.91 1.49 1.91 1.70 1.89 2.09 2.00Fort Liard 2.65 2.30 2.10 1.67 2.15 2.02 2.13 2.18 2.33Fort Good Hope 2.33 2.25 2.15 1.68 2.25 2.10 2.27 2.21 2.08Fort Providence 2.50 2.57 2.11 1.66 2.13 1.89 2.16 2.17 2.37Fort McPherson 2.57 2.53 2.22 1.56 2.24 1.91 2.31 2.04 1.66Mean scores for medium communities 2.46 2.40 2.12 1.63 2.16 1.95 2.18 2.15 2.10
Fort Simpson 2.44 2.27 1.94 1.62 1.92 1.72 2.02 1.80 1.92Fort Smith 2.61 2.31 1.94 1.53 1.81 1.77 2.22 1.89 1.76Inuvik 2.60 2.37 2.19 1.70 2.05 1.90 2.21 1.98 1.71Hay River 2.38 2.27 2.03 1.41 1.74 1.73 1.90 1.63 1.57Mean scores for large communities 2.48 2.31 2.05 1.56 1.89 1.78 2.05 1.80 1.72
Overall mean score 2.46 2.34 2.05 1.57 1.97 1.83 2.07 1.90 1.85
*Scale 1-3: 1=not at all, 2=sometimes, 3=most frequently **Note: figures highlighted in red and italicized, represent high mean scores
Source: Building Healthy Communities in the NWT Survey, 2002-2003.
Building Healthy Communities in the NWT Report World Leisure Professional Services http://www.worldleisure.org
31

4.2.4. PHYSICAL ACTIVITIES/SPORTS The top six sports that respondents participated in (most frequently and sometimes), were (in order): swimming (62%), volleyball (60%), soccer (58%), organized team sports (57%), basketball (55%), and softball (54%). See Table 4.8. for overall participation rates and Table 4.9. for participation rates, by community.
Table 4.8. Participation in physical activities/sports (percentages)
Physical activities/ sports
Most frequently Sometimes Not at all Mean
score* Soccer 28 30 42 1.85 Swimming 22 40 38 1.84 Volleyball 24 36 40 1.83 Organized team sports 23 34 43 1.80 Softball 19 35 46 1.74 Basketball 17 38 45 1.72
*Scale 1-3: 1=not at all, 2=sometimes, 3=most frequently Source: Building Healthy Communities in the NWT Survey, 2002-2003.
The lowest mean scores were attributed to Arctic sports (mean score=1.44), Dene games (mean score=1.43), wrestling (mean score=1.35), broomball (mean score=1.32) and speed skating (mean score=1.31). However, low participation rates could probably be explained by the lack of respective facilities and programs within communities. Interestingly, activities that scored lowest on participation, appeared to be activities desired by communities (see section 4.3., Table 4.12. for the list of activities desired by respondents and Chapter 11 for analysis of open-ended questions).
Building Healthy Communities in the NWT Report World Leisure Professional Services http://www.worldleisure.org
32

Table 4.9. Participation in physical activities/sports, by community (mean scores*)
Community
Arc
tic sp
orts
Bad
min
ton
Bas
ketb
all
Bro
omba
ll
Den
e ga
mes
Fitn
ess
prog
ram
s
Floo
r ho
ckey
Ice
hock
ey
Org
aniz
ed
team
spor
ts
Socc
er
Soft
ball
Swim
min
g
Spee
d sk
atin
g
Vol
leyb
all
Wre
stlin
g
Jean Marie River 1.60 1.73 1.87 2.00 1.93 1.87 1.87 1.80 2.00 1.93 1.93 1.87 1.40 2.07 1.33Enterprise 1.10 1.20 1.30 1.20 1.10 1.20 1.30 1.20 1.20 1.20 1.20 1.20 1.20 1.10 1.10Trout Lake 1.18 1.76 1.82 1.24 2.00 1.33 1.50 1.29 1.59 1.76 2.12 2.17 1.24 1.88 1.61Nahanni Butte 1.12 1.42 1.04 1.79 1.35 1.48 1.18 1.50 1.30 1.29 1.66 1.61 1.19 1.96 1.22Wrigley 1.52 1.79 1.79 1.60 1.73 1.54 1.52 1.64 1.54 1.73 1.96 1.73 1.24 1.85 1.20NWT Youth Council 1.22 1.67 1.94 1.17 1.94 1.39 1.67 1.61 1.72 1.67 1.89 1.89 1.44 2.00 1.28Mean scores for small communities 1.30 1.62 1.61 1.54 1.69 1.48 1.48 1.53 1.55 1.60 1.83 1.77 1.28 1.87 1.29
Fort Resolution 1.47 1.74 1.50 1.12 1.61 1.51 1.45 1.57 1.55 1.76 1.62 1.83 1.24 1.76 1.26Fort Liard 1.57 1.56 1.86 1.51 1.90 1.67 1.73 1.73 1.73 2.10 1.92 2.22 1.73 2.00 1.69Fort Good Hope 1.34 1.37 1.60 1.29 1.72 1.48 1.68 1.71 1.67 1.72 1.62 1.55 1.32 1.80 1.30Fort Providence 1.36 1.61 1.54 1.35 1.74 1.64 1.68 1.73 1.80 1.81 1.71 1.70 1.25 1.91 1.37Fort McPherson 1.49 1.66 1.75 1.27 1.30 1.63 1.96 1.97 1.72 2.14 1.86 1.96 1.33 1.79 1.45Mean scores for medium communities 1.42 1.56 1.64 1.31 1.65 1.58 1.72 1.75 1.71 1.88 1.73 1.79 1.35 1.85 1.40
Fort Simpson 1.30 1.58 1.54 1.31 1.38 1.73 1.51 1.56 1.70 1.73 1.65 1.83 1.23 1.57 1.25Fort Smith 1.33 1.69 1.81 1.18 1.36 1.81 1.50 1.82 2.05 2.05 1.71 1.94 1.20 1.95 1.25Inuvik 1.58 1.62 1.77 1.33 1.31 1.75 1.63 1.65 1.83 1.86 1.72 1.82 1.36 1.88 1.35Hay River 1.52 1.66 1.90 1.28 1.28 1.73 1.62 1.84 1.97 1.95 1.79 1.90 1.33 1.91 1.40Mean scores for large communities 1.47 1.63 1.77 1.30 1.32 1.74 1.59 1.71 1.86 1.87 1.73 1.86 1.30 1.82 1.33
Overall mean score 1.44 1.61 1.72 1.32 1.43 1.68 1.61 1.71 1.80 1.85 1.74 1.84 1.31 1.83 1.35
*Scale 1-3: 1=not at all, 2=sometimes, 3=most frequently Source: Building Healthy Communities in the NWT Survey, 2002-2003
Building Healthy Communities in the NWT Report World Leisure Professional Services http://www.worldleisure.org
33

4.2.5. ON THE LAND AND WATER ACTIVITIES/SPORTS The top six land and water activities were (in order): bicycling (84%), camping/going out on the land (82%), boating (79%), snowmobiling (77%), fishing (74%) and hiking/backpacking (60%). Table 4.10. shows participation rates of the top six on the land and water activities.
Table 4.10. Participation in the land and water activities (percentages)
Land and water activities/ sports
Most frequently Sometimes Not at all Mean
score* Bicycling 41 43 16 2.24 Camping/Going out on the land 34 48 18 2.15
Snowmobiling 39 38 23 2.15 Boating 28 51 21 2.07 Fishing 24 50 26 1.97 Hiking/backpacking 20 40 40 1.81
*Scale 1-3: 1=not at all, 2=sometimes, 3=most frequently Source: Building Healthy Communities in the NWT Survey, 2002-2003.
The lowest mean scores were attributed to the following on the land and water activities (in order): kayaking/canoeing (mean score=1.58), skateboarding/rollerblading (mean score=1.54), cross country skiing (mean score=1.48), snow shoeing (mean score=1.46) and dog sledding/mushing (mean score=1.29). Repeating the pattern observed with the physical activities/sports, on the land and water activities that scored lowest, were those most desired by survey respondents (see section 4.3., Table 4.12. for the list of activities desired by respondents and Chapter 11 for analysis of open-ended questions). Therefore, low participation rates could be merely attributed to the lack of respective programs within communities.
Building Healthy Communities in the NWT Report World Leisure Professional Services http://www.worldleisure.org
34

Table 4.11. Participation in the land and water activities, by community (mean scores*)
Community
Bic
yclin
g
Boa
ting
Cam
ping
/ go
ing
out o
n th
e la
nd
Cro
ss c
ount
ry
skiin
g
Dog
sled
ding
/ m
ushi
ng
Fish
ing
Hik
ing/
ba
ckpa
ckin
g
Hun
ting
Kay
akin
g/
cano
eing
Skat
eboa
rdin
g/r
olle
rbla
ding
Snow
mob
iling
Snow
shoe
ing
Jean Marie River 2.20 2.40 2.47 1.73 1.53 2.29 1.93 2.13 1.87 1.60 2.20 2.00Enterprise 1.55 1.50 1.40 1.10 1.10 1.40 1.30 1.20 1.20 1.10 1.40 1.10Trout Lake 2.37 2.58** 2.55 1.83 1.58 2.60 2.15 2.10 2.16 1.58 2.80 2.16 Nahanni Butte 2.17 2.30 1.93 1.44 1.00 1.77 1.66 1.80 1.14 1.04 2.14 1.08Wrigley 2.21 2.25 2.29 1.73 1.42 2.14 2.11 2.11 1.86 1.48 2.08 1.85NWT Youth Council 2.22 2.32 2.06 1.33 1.22 2.11 1.71 1.83 1.56 1.28 2.42 1.56Mean scores for small communities 2.17 2.28 2.16 1.56 1.30 2.07 1.86 1.92 1.63 1.34 2.23 1.63
Fort Resolution 2.07 2.14 2.18 1.37 1.43 1.95 1.61 1.93 1.44 1.24 2.20 1.47Fort Liard 2.48 2.15 2.33 1.36 1.46 2.02 1.94 2.04 1.70 1.46 2.19 1.70Fort Good Hope 1.79 2.18 2.13 1.41 1.25 1.91 1.70 1.96 1.46 1.21 2.12 1.44Fort Providence 2.39 2.25 2.29 1.45 1.28 2.04 1.74 1.91 1.61 1.34 2.37 1.54Fort McPherson 2.33 2.01 2.15 1.51 1.47 1.86 1.77 1.81 1.56 1.53 2.26 1.68Mean scores for medium communities 2.18 2.16 2.21 1.43 1.35 1.95 1.74 1.92 1.55 1.34 2.23 1.55
Fort Simpson 2.23 2.04 2.05 1.43 1.12 2.00 1.84 1.72 1.52 1.34 1.94 1.33Fort Smith 2.38 1.87 2.14 1.55 1.18 1.87 1.76 1.68 1.60 1.62 2.02 1.40Inuvik 2.17 2.13 2.18 1.49 1.32 1.97 1.81 1.77 1.63 1.56 2.20 1.49Hay River 2.37 1.93 2.14 1.50 1.34 1.97 1.78 1.59 1.57 1.94 2.19 1.38Mean scores for large communities 2.27 2.01 2.13 1.49 1.26 1.97 1.80 1.69 1.58 1.64 2.12 1.40
Overall mean score 2.24 2.07 2.15 1.48 1.29 1.97 1.79 1.77 1.58 1.54 2.15 1.46 *Scale 1-3: 1=not at all, 2=sometimes, 3=most frequently
**Note: figures highlighted in red and italicized, represent high mean scores Source: Building Healthy Communities in the NWT Survey, 2002-2003.
Building Healthy Communities in the NWT Report World Leisure Professional Services http://www.worldleisure.org
35
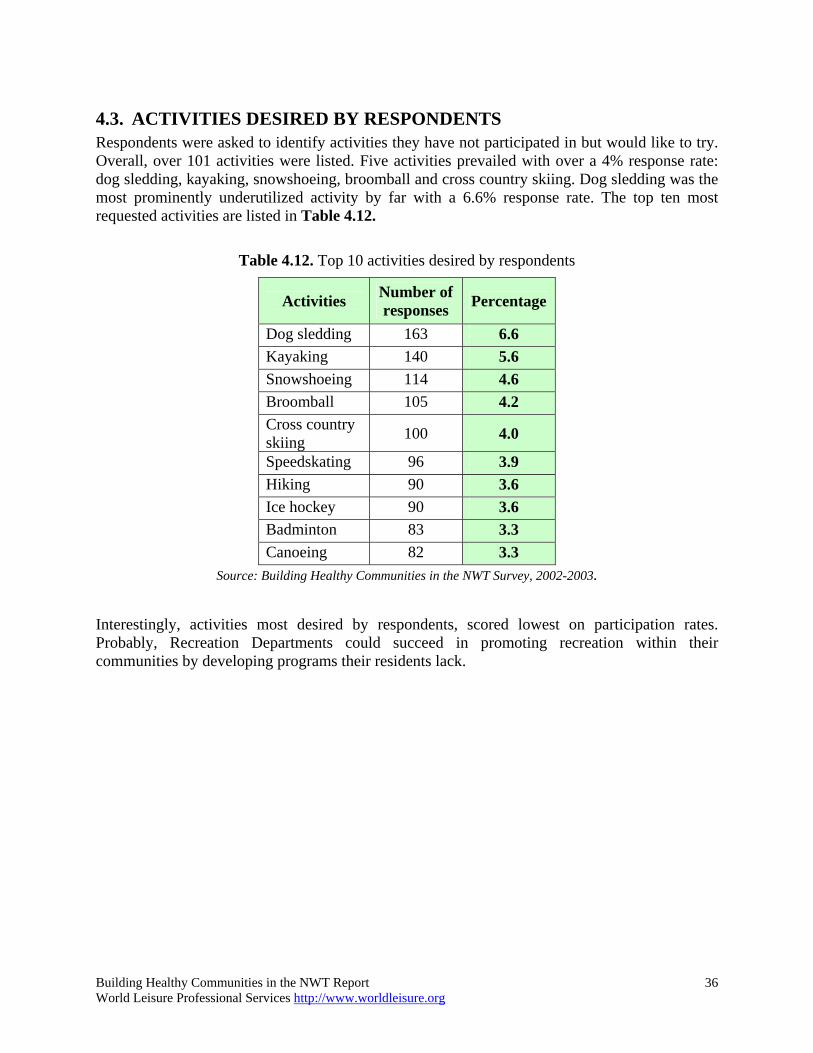
4.3. ACTIVITIES DESIRED BY RESPONDENTS Respondents were asked to identify activities they have not participated in but would like to try. Overall, over 101 activities were listed. Five activities prevailed with over a 4% response rate: dog sledding, kayaking, snowshoeing, broomball and cross country skiing. Dog sledding was the most prominently underutilized activity by far with a 6.6% response rate. The top ten most requested activities are listed in Table 4.12.
Table 4.12. Top 10 activities desired by respondents
Activities Number of responses Percentage
Dog sledding 163 6.6 Kayaking 140 5.6 Snowshoeing 114 4.6 Broomball 105 4.2 Cross country skiing 100 4.0
Speedskating 96 3.9 Hiking 90 3.6 Ice hockey 90 3.6 Badminton 83 3.3 Canoeing 82 3.3
Source: Building Healthy Communities in the NWT Survey, 2002-2003.
Interestingly, activities most desired by respondents, scored lowest on participation rates. Probably, Recreation Departments could succeed in promoting recreation within their communities by developing programs their residents lack.
Building Healthy Communities in the NWT Report World Leisure Professional Services http://www.worldleisure.org
36

5. BENEFITS OF PARTICIPATION IN RECREATION PROGRAMS Recreation participation offers enormous benefits to those involved. One of the mail goals of this study was to assess benefits and constraints coming from recreation participation within the communities of the Northwest Territories. Therefore, survey respondents were asked to rate the 11 benefits of participation in recreation programs on a 5-point Likert-type scale (5=strongly agree, 4=agree, 3=don’t agree or disagree, 2=disagree, 1=strongly disagree). Interpretation of the factor analysis results revealed two major categories of leisure benefits: interaction within community (Factor 1), and personal development/growth (Factor 2). Distribution of items among the two factors looks as follows: Factor 1 – interaction within community (in order by mean scores): “gives me
leadership skills”, “helps me work with others in my community”, “provides understanding of other people”, “makes me want to be a role model for others”, “makes me want to do better at school or work”, “helps me solve problems”, “makes me want to volunteer in my community”;
Factor 2 - personal development items (in order by mean scores): “to have fun”, “provides a physical challenge”, “a chance to meet new people”, “provides mental stimulation”.
Personal development items (Factor 2) were recognized as the most valuable recreation benefits. Within this group, the number one benefit was “to have fun” (mean score=4.61), followed by “recreation provides a physical challenge” (mean score=4.27), “a chance to meet new people” (mean score=4.25) and “recreation provides mental stimulation” (mean score=3.99). Within Factor 1 (interaction within community) items on “gives me leadership skills”, “helps me work with others in my community” and “provides understanding of other people” scored highest. Overall, all mean scores were higher than 3.5. Table 5.1. provides the list of all benefits and how strongly respondents agreed each factor is an important benefit. Results of the factor analysis are given in Appendix 6.
Building Healthy Communities in the NWT Report World Leisure Professional Services http://www.worldleisure.org
37

Table 5.1. Benefits of participation in recreation programs (percentages)
Participation benefits Strongly agree Agree Neutral Disagree Strongly
disagreeMean score*
Interaction within community Gives me leadership skills 29.2 47.6 17.7 4.2 1.4 3.99 Helps me work with others in my community 27.1 51 15.9 4.2 1.8 3.97
Provides understanding of other people 20.7 51.8 21.9 4.4 1.2 3.86 Makes me want to be a role model for others 24.5 41.1 24.5 6.9 3.2 3.77
Makes me want to do better at school or work 22.5 60.8 26.5 6.8 3.4 3.72
Helps me solve problems 17 40.6 30.9 8.3 3.1 3.60 Makes me want to volunteer in my community 16.2 41.7 30.1 8.4 3.6 3.58
Personal development To have fun 67 28 3 1 1 4.61 Provides a physical challenge 39 52.2 6.6 1.3 1 4.27 A chance to meet new people 37 54.4 6.3 1.3 1 4.25 Provides mental stimulation 27.7 49.8 18.1 3 1.4 3.99
*Scale 1-5: 1=strongly disagree, 2=disagree, 3=don’t agree or disagree, 4=agree, 5=strongly agree Source: Building Healthy Communities in the NWT Survey, 2002-2003.
Table 5.2. explores benefits of participation in recreation programs, by community. In general, mean scores were high among all communities. Enterprise community scored lowest on all the 11 items, furthermore, several items scored below 3.0 (in order): “provides understanding of other people” (mean score=2.9), “gives me leadership skills” (mean score=2.9), “makes me want to do better at school or work” (mean score=2.8), “makes me want to be a role model for others” (mean score=2.7).
Building Healthy Communities in the NWT Report World Leisure Professional Services http://www.worldleisure.org
38
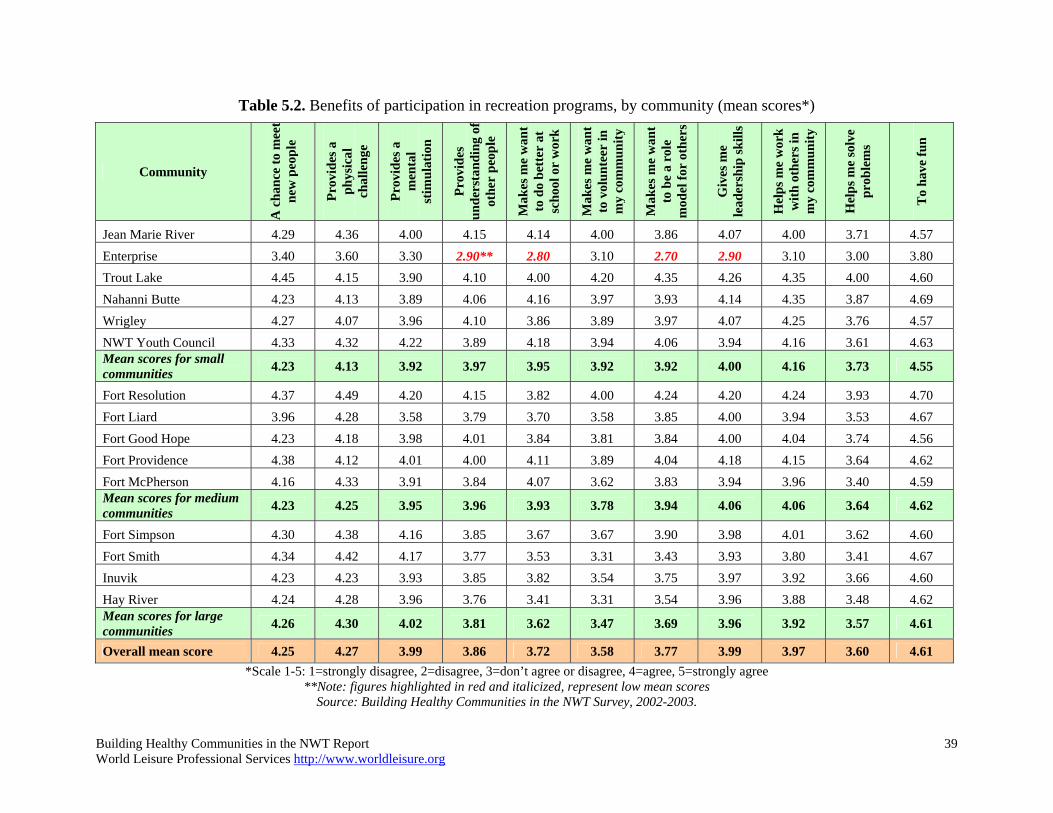
Table 5.2. Benefits of participation in recreation programs, by community (mean scores*)
Community
A c
hanc
e to
mee
t ne
w p
eopl
e
Prov
ides
a
phys
ical
ch
alle
nge
Prov
ides
a
men
tal
stim
ulat
ion
Prov
ides
un
ders
tin
g of
an
dot
her
peo
le
p
Mak
es m
e w
ant
to d
o be
tter
at
scho
ol o
r w
ork
Mak
es m
e w
ant
t in
o
volu
ntee
rm
y co
mm
unity
Mak
es m
e w
ant
to b
e a
role
mod
el fo
r ot
hers
Giv
es m
e le
ader
ship
skill
s
Hel
ps m
e w
ork
ws i
n ith
oth
erm
y co
mm
unity
Hel
ps m
e so
lve
prob
lem
s
To
have
fun
Jean Marie River 4.29 4.36 4.00 4.15 4.14 4.00 3.86 4.07 4.00 3.71 4.57Enterprise 3.40 3.60 3.30 2.90** 2.80 3.10 2.70 2.90 3.10 3.00 3.80Trout Lake 4.45 4.15 3.90 4.10 4.00 4.20 4.35 4.26 4.35 4.00 4.60Nahanni Butte 4.23 4.13 3.89 4.06 4.16 3.97 3.93 4.14 4.35 3.87 4.69Wrigley 4.27 4.07 3.96 4.10 3.86 3.89 3.97 4.07 4.25 3.76 4.57NWT Youth Council 4.33 4.32 4.22 3.89 4.18 3.94 4.06 3.94 4.16 3.61 4.63Mean scores for small communities 4.23 4.13 3.92 3.97 3.95 3.92 3.92 4.00 4.16 3.73 4.55
Fort Resolution 4.37 4.49 4.20 4.15 3.82 4.00 4.24 4.20 4.24 3.93 4.70Fort Liard 3.96 4.28 3.58 3.79 3.70 3.58 3.85 4.00 3.94 3.53 4.67Fort Good Hope 4.23 4.18 3.98 4.01 3.84 3.81 3.84 4.00 4.04 3.74 4.56Fort Providence 4.38 4.12 4.01 4.00 4.11 3.89 4.04 4.18 4.15 3.64 4.62Fort McPherson 4.16 4.33 3.91 3.84 4.07 3.62 3.83 3.94 3.96 3.40 4.59Mean scores for medium communities 4.23 4.25 3.95 3.96 3.93 3.78 3.94 4.06 4.06 3.64 4.62
Fort Simpson 4.30 4.38 4.16 3.85 3.67 3.67 3.90 3.98 4.01 3.62 4.60Fort Smith 4.34 4.42 4.17 3.77 3.53 3.31 3.43 3.93 3.80 3.41 4.67Inuvik 4.23 4.23 3.93 3.85 3.82 3.54 3.75 3.97 3.92 3.66 4.60Hay River 4.24 4.28 3.96 3.76 3.41 3.31 3.54 3.96 3.88 3.48 4.62Mean scores for large communities 4.26 4.30 4.02 3.81 3.62 3.47 3.69 3.96 3.92 3.57 4.61
Overall mean score 4.25 4.27 3.99 3.86 3.72 3.58 3.77 3.99 3.97 3.60 4.61 *Scale 1-5: 1=strongly disagree, 2=disagree, 3=don’t agree or disagree, 4=agree, 5=strongly agree
**Note: figures highlighted in red and italicized, represent low mean scores Source: Building Healthy Communities in the NWT Survey, 2002-2003.
Building Healthy Communities in the NWT Report World Leisure Professional Services http://www.worldleisure.org
39
6. CONSTRAINTS TO PARTICIPATION IN RECREATION PROGRAMS
Besides numerous benefits of participation in recreation programs, there are many reasons people do not participate in leisure, or do not participate as often as they would like. Survey respondents were asked to rate the 20 constraints preventing them from participation in recreation activities, on a 5-point Likert-type scale (5=strongly agree, 4=agree, 3=don’t agree or disagree, 2=disagree, 1=strongly disagree). Interpretation of the factor analysis results revealed three major categories of leisure constraints: social and physical issues and constraints (Factor 1), personal issues and constraints (Factor 2), and program issues and constraints (Factor 3). Distribution of items among the three factors looks as follows: Factor 1 – social /physical issues and constraints items (in order by mean scores): “I
am shy about participating in public”, “I don’t have transportation”, “I don’t have the physical abilities”, “I don’t have artistic or creative abilities”, “I am physically unable to participate”, “my friends or family don’t want me to go”;
Factor 2 – personal issues and constraints items (in order by mean scores): ”work/school commitments”, “the price of recreation/sports equipment”, “cost for recreation programs are too high”, “no program near my home”, “don’t know where to participate in the activity”, “no one to go with”, “I don’t know where I can learn skills”, “I don’t have child care”;
Factor 3 – programs issues and constraints items (in order by mean scores): “programs not offered on the right day or time for me”, “I don’t have any program information”, “programs are not interesting”, “I don’t like the instructor/coach”, “there isn’t anything for my family”, “the program is too long each day I go there”.
Personal issues, such as work and school commitments and cost of equipment, were identified as the main constrains to leisure. Within this group, work and school commitments scored highest (mean score=3.8). Table 6.1. illustrates how strongly respondents feel each constraint applies to them. Results of the factor analysis are given in Appendix 7.
Building Healthy Communities in the NWT Report World Leisure Professional Services http://www.worldleisure.org
40

Table 6.1. Reasons for non-participation in leisure activities (percentages)
Leisure constraints Strongly agree Agree Neutral Disagree Strongly
disagree Mean score*
Factor 1. Social/physical issues and constraints
I am shy about participating in public 7.4 19.1 22.9 32.7 17.9 2.65
I don’t have transportation 4.2 12.0 24.9 36.5 22.3 2.39
I don’t have the physical abilities 4.0 10.4 24.2 36.8 24.6 2.32
I don’t have artistic or creative abilities 3.3 11.5 23.3 37.5 24.4 2.32
I am physically unable to participate 3.5 7.0 22.6 37.8 29.1 2.18
My friends or family don’t want me to go 2.5 5.9 24.9 39.1 27.6 2.17
Factor 2. Personal issues and constraints
Works/school commitments 25.5 47.5 13.5 8.9 4.7 3.80
The price of recreation/sports equipment 14.6 31.3 25.6 20.7 7.7 3.24
Cost for recreation programs are too high 12.5 24.4 31.5 22.3 9.3 3.09
No program near my home 11.1 22.8 30.3 26.2 9.6 3.00
Don’t know where to participate in the activity 7.5 23.7 31.2 27.0 10.5 2.91
No one to go with 7.4 25.0 29.3 26.0 12.4 2.89
I don’t know where I can learn the skills 5.9 16.1 34.4 28.6 14.9 2.70
I don’t have child care 7.4 14.8 33.7 23.7 20.4 2.65
Factor 3. Program issues and constraints Programs not offered on the right day or time for me 9.7 33.7 25.1 21.4 10.1 3.12
I don’t have any program information 7.5 26.9 27.5 26.0 12.1 2.92
Programs are not interesting 7.5 19.1 27.6 28.8 17.0 2.71
I don’t like the instructor/coach 6.5 11.0 34.2 31.1 17.2 2.58
There isn’t anything for my family 6.5 12.0 30.4 32.3 18.8 2.55
The program is too long each day I go there 3.6 8.5 35.8 33.7 18.3 2.45 *Scale 1-5: 1=strongly disagree, 2=disagree, 3=don’t agree or disagree, 4=agree, 5=strongly agree
Source: Building Healthy Communities in the NWT Survey, 2002-2003.
Table 6.2. explores leisure constraints, by community. The top five constraints identified by survey respondents, are (in order): “work/school commitments” (mean score=3.8), “”the price of recreation/sports equipment” (mean score-3.24), “programs are not offered on the right day or time for me” (mean score=3.12), “cost for recreation programs are too high” (mean score=3.09) and “no program near my home” (mean score=3).
Building Healthy Communities in the NWT Report World Leisure Professional Services http://www.worldleisure.org
41
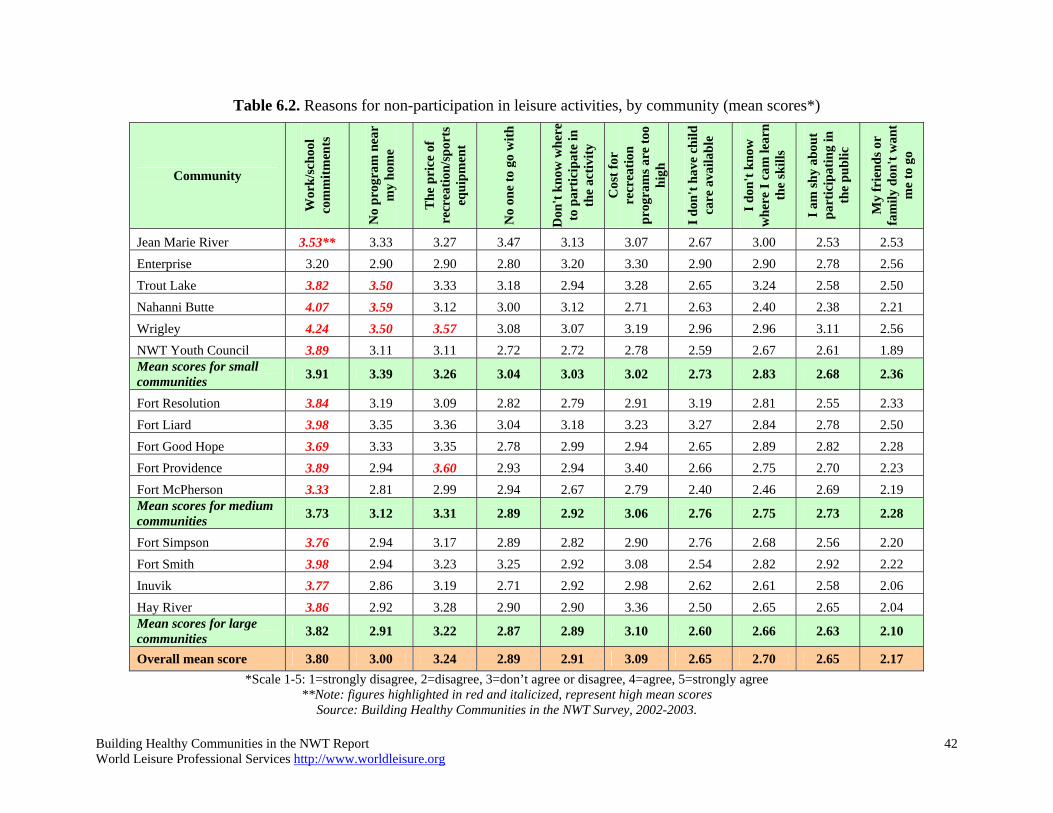
Table 6.2. Reasons for non-participation in leisure activities, by community (mean scores*)
Community
Wor
k/sc
hool
co
mm
itmen
ts
No
prog
ram
nea
r m
y ho
me
Tce
of
he p
rire
crea
tion/
spor
ts
equi
pmen
t
No
one
to g
o w
ith
Don
't kn
ow w
here
t
e in
o
part
icip
atth
e ac
tivity
Cos
t f
orr
atio
n ec
repr
ogra
ms a
re to
o hi
gh
I don
't ha
ve c
hild
ca
re a
vaila
ble
I't
kno
don
w
we
I cam
lear
n he
r the
skill
s
I am
shy
abou
t pa
rtic
ipat
ig
in
nth
e pu
blic
My
fds
or
rien
fam
ily d
on't
wan
t m
to g
e o
Jean Marie River 3.53** 3.33 3.27 3.47 3.13 3.07 2.67 3.00 2.53 2.53Enterprise 3.20 2.90 2.90 2.80 3.20 3.30 2.90 2.90 2.78 2.56Trout Lake 3.82 3.50 3.33 3.18 2.94 3.28 2.65 3.24 2.58 2.50Nahanni Butte 4.07 3.59 3.12 3.00 3.12 2.71 2.63 2.40 2.38 2.21Wrigley 4.24 3.50 3.57 3.08 3.07 3.19 2.96 2.96 3.11 2.56NWT Youth Council 3.89 3.11 3.11 2.72 2.72 2.78 2.59 2.67 2.61 1.89Mean scores for small communities 3.91 3.39 3.26 3.04 3.03 3.02 2.73 2.83 2.68 2.36
Fort Resolution 3.84 3.19 3.09 2.82 2.79 2.91 3.19 2.81 2.55 2.33Fort Liard 3.98 3.35 3.36 3.04 3.18 3.23 3.27 2.84 2.78 2.50Fort Good Hope 3.69 3.33 3.35 2.78 2.99 2.94 2.65 2.89 2.82 2.28Fort Providence 3.89 2.94 3.60 2.93 2.94 3.40 2.66 2.75 2.70 2.23Fort McPherson 3.33 2.81 2.99 2.94 2.67 2.79 2.40 2.46 2.69 2.19Mean scores for medium communities 3.73 3.12 3.31 2.89 2.92 3.06 2.76 2.75 2.73 2.28
Fort Simpson 3.76 2.94 3.17 2.89 2.82 2.90 2.76 2.68 2.56 2.20Fort Smith 3.98 2.94 3.23 3.25 2.92 3.08 2.54 2.82 2.92 2.22Inuvik 3.77 2.86 3.19 2.71 2.92 2.98 2.62 2.61 2.58 2.06Hay River 3.86 2.92 3.28 2.90 2.90 3.36 2.50 2.65 2.65 2.04Mean scores for large communities 3.82 2.91 3.22 2.87 2.89 3.10 2.60 2.66 2.63 2.10
Overall mean score 3.80 3.00 3.24 2.89 2.91 3.09 2.65 2.70 2.65 2.17 *Scale 1-5: 1=strongly disagree, 2=disagree, 3=don’t agree or disagree, 4=agree, 5=strongly agree
**Note: figures highlighted in red and italicized, represent high mean scores Source: Building Healthy Communities in the NWT Survey, 2002-2003.
Building Healthy Communities in the NWT Report World Leisure Professional Services http://www.worldleisure.org
42

Table 6.2. Reasons for non-participation in leisure activities, by community (mean scores*), cont.
Community
I don
't ha
ve th
e ph
ysic
al
abili
ties
I don
't ha
ve
tran
spo
tatio
n r
I am
phy
sica
lly
unab
le to
pa
rtic
ipat
e
I don
't ha
ve
artis
tic o
r cr
eativ
e ab
ilitie
s
Prog
ram
s are
no
t
inte
rest
ing
Prog
ram
s are
no
t off
ered
on
the
righ
t day
or
time
for
me
I don
't ha
ve a
ny
prog
ram
in
form
atio
n
I don
't lik
e th
e in
stru
ctor
/coa
ch
The
pro
gram
is
too
long
eac
h da
y I
g
o th
ere
The
re is
n't
any
ing
for
my
th fam
ily
Jean Marie River 2.47 2.53 2.40 2.60 2.67 2.80 2.80 2.60 2.53 2.53Enterprise 2.78 3.00 3.00 2.67 3.30 3.50 3.18 2.78 2.56 2.78Trout Lake 2.63 2.74 2.83 2.82 3.24 3.50 3.56 2.59 2.88 2.71Nahanni Butte 2.26 2.35 2.12 2.50 2.52 3.26 2.54 1.91 2.52 2.40Wrigley 2.69 2.81 2.77 2.88 3.12 3.46 3.44 3.35 2.85 3.38NWT Youth Council 2.35 2.65 2.38 2.19 2.88 2.93 3.00 2.53 2.31 2.25Mean scores for small communities 2.50 2.64 2.54 2.62 2.92 3.26 3.07 2.64 2.63 2.71
Fort Resolution 2.52 2.40 2.32 2.46 2.80 3.21 3.05 2.72 2.32 3.18Fort Liard 2.55 2.54 2.37 2.59 2.84 3.50 3.04 2.69 2.59 2.70Fort Good Hope 2.46 2.56 2.29 2.40 2.78 3.04 3.14 2.53 2.52 2.73Fort Providence 2.35 2.36 2.25 2.38 2.90 3.22 2.94 2.65 2.48 2.76Fort McPherson 2.47 2.32 2.34 2.46 2.72 2.86 2.79 2.45 2.34 2.29Mean scores for medium communities 2.45 2.44 2.30 2.44 2.81 3.13 2.99 2.59 2.46 2.69
Fort Simpson 2.27 2.33 2.15 2.27 2.76 3.14 2.96 2.53 2.42 2.66Fort Smith 2.42 2.44 2.16 2.35 2.77 2.93 2.77 2.67 2.43 2.54Inuvik 2.22 2.36 2.07 2.24 2.54 3.09 2.88 2.52 2.43 2.42Hay River 2.24 2.34 2.06 2.20 2.66 3.11 2.83 2.64 2.44 2.41Mean scores for large communities 2.26 2.35 2.10 2.24 2.65 3.09 2.87 2.58 2.43 2.49
Overall mean score 2.32 2.39 2.18 2.32 2.71 3.12 2.92 2.58 2.45 2.55 *Scale 1-5: 1=strongly disagree, 2=disagree, 3=don’t agree or disagree, 4=agree, 5=strongly agree
**Note: figures highlighted in red and italicized, represent high mean scores Source: Building Healthy Communities in the NWT Survey, 2002-2003.
Building Healthy Communities in the NWT Report World Leisure Professional Services http://www.worldleisure.org
43

7. PROGRAM INFORMATION Promoting programs is vital to their success. Respondents to the survey questionnaire were asked to identify their main sources of receiving program information. Below follows a brief description of information sources included in the survey questionnaire. media sources include radio, the community channel on TV, and newspapers;
social sources of program information include word of mouth from friends, family or neighbors;
community organizations sources include recreation centers, community offices, and post office boxes;
postings include bulletin boards, special program fliers, school fliers, posters, and post office offices.
Figure 7.1. Top 5 sources of program information
Word of M outh
32%
Bulletin Boards
24%
Radio16%
Newspapers15%
Posters13%
Source: Building Healthy Communities in the NWT Survey, 2002-2003.
The top promotional mediums that community members were aware of included (in order): word of mouth, bulletin boards, radio, newspapers, posters, community office, and recreation center (see Figure 7.1.). This implies that most community members find out about recreation programs through friends, family and acquaintances. Improved publicity could therefore increase the word of mouth throughout communities, reaching a wider range of participants. Furthermore, publicity was indicated as one of the most important issues to be addressed by Recreation
Building Healthy Communities in the NWT Report World Leisure Professional Services http://www.worldleisure.org
44

Departments, especially within large communities (see Chapter 11 of this report for detailed analysis of open-ended questions, by community). Table 7.1. ranks information sources by the number of responses. Table 7.2. expands on the issue and explores what sources of program information are being used in different communities.
Table 7.1. Sources of program information*
Information source Number of responses Percentage
Social Word of mouth 1039 67 Postings Bulletin boards 756 49 Posters 407 26 School fliers 222 14 Special program fliers 130 8 Media Radio 515 33 Newspaper 497 32 TV: Community channel 288 19
Community organizations Community office 360 23 Recreation centre 348 22 Post office boxes 290 19 *Note: Respondents could choose more than one response.
Source: Building Healthy Communities in the NWT Survey, 2002-2003.
Building Healthy Communities in the NWT Report World Leisure Professional Services http://www.worldleisure.org
45

Table 7.2. Sources of program information, by community (percentages)
Community
Rad
io
Bul
letin
bo
ards
New
spap
er
Wor
d of
m
outh
Rec
reat
ion
cent
er
Spec
ial
prog
ram
fli
ers
Scho
ol fl
iers
Com
mun
ity
Cha
nnel
Post
off
ice
boxe
s
Post
ers
Com
mun
ity
offic
e
Oth
er
Small communities Jean Marie River 12 19 9 19 12 5 5 0 2 2 14 2 Enterprise 13 7 20 13 13 7 20 7 Trout Lake 5 15 8 15 15 3 3 5 4 15 12 1 Nahanni Butte 2 15 5 20 17 2 5 0 0 10 21 3 Wrigley 6 17 8 22 6 3 2 1 8 17 9 1 NWT Youth Council 13 23 5 18 7 2 5 5 4 9 9
Medium communities Fort Resolution 10 21 3 22 8 1 2 1 2 4 14 11 Fort Liard 1 16 10 24 11 2 3 6 1 17 8 Fort Good Hope 23 22 3 22 2 1 1 4 1 2 13 5 Fort Providence 20 19 7 16 8 3 5 1 1 15 5 Fort McPherson 22 19 6 20 10 2 2 3 1 12 4 Large communities Fort Simpson 4 18 9 25 10 3 5 5 5 13 2 Fort Smith 3 15 12 21 7 3 10 6 6 11 4 2 Inuvik 9 13 11 20 6 2 3 7 13 4 12 2 Hay River 11 10 15 21 4 3 7 10 6 8 3 2
Source: Building Healthy Communities in the NWT Survey, 2002-2003.
Building Healthy Communities in the NWT Report World Leisure Professional Services http://www.worldleisure.org
46

8. ARCTIC WINTER GAMES
8.1. AWG PARTICIPATION RATES Respondents were asked if they have participated in the Arctic Winter Games, Territorial or Regional Trials. Thirty percent of respondents said they participated in the Artic Winter Games, versus seventy percent who have not (see Figure 8.1.).
Figure 8.1. Participation in the Arctic Winter Games
yes30%
no70%
Source: Building Healthy Communities in the NWT Survey, 2002-2003.
Table 8.1. explores participation rates, by community and community groups. Seemingly, large communities are in general more active participants of the Arctic Winter Games. Small communities scored lowest on participation. Enterprise community survey respondents overwhelmingly said they did not participate in the Games (100% negative response rate).
Building Healthy Communities in the NWT Report World Leisure Professional Services http://www.worldleisure.org
47

Table 8.1. Participation in the Arctic Winter Games, by community (percentages)
Community Yes No Small communities Jean Marie River 33 67 NWT Youth Council 28 72 Trout Lake 26 74 Wrigley 25 75 Nahanni Butte 17 83 Enterprise 100 Medium communities Fort Resolution 47 53 Fort Liard 36 64 Fort McPherson 34 66 Fort Good Hope 22 78 Fort Providence 22 78 Large communities Fort Smith 35 65 Inuvik 34 66 Fort Simpson 30 70 Hay River 29 71
Overall 30 70 Source: Building Healthy Communities in the NWT Survey, 2002-2003.
Of the respondents who have participated in the Games, 328 were athletes, 43 were volunteers and 24 were coaches (see Figure 8.2.).
Figure 8.2. Role in the Arctic Winter Games
Coach6%
Volunteer11%
Athlete83%
Source: Building Healthy Communities in the NWT Survey, 2002-2003.
Building Healthy Communities in the NWT Report World Leisure Professional Services http://www.worldleisure.org
48
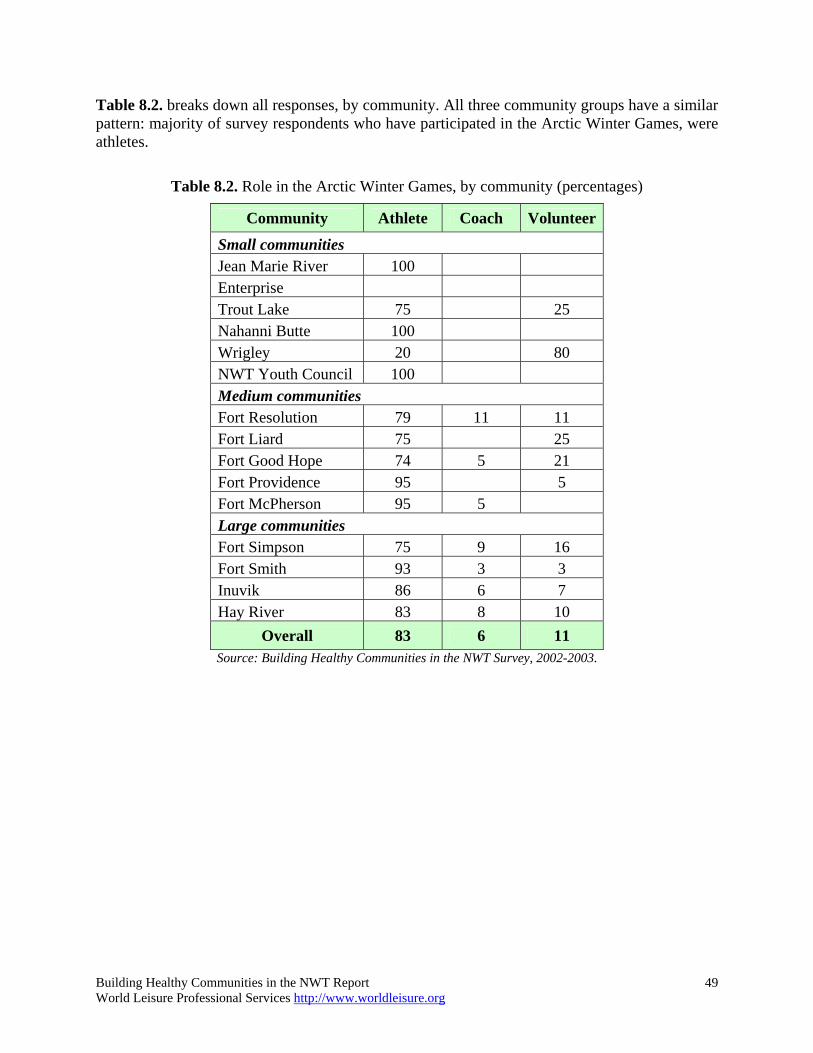
Table 8.2. breaks down all responses, by community. All three community groups have a similar pattern: majority of survey respondents who have participated in the Arctic Winter Games, were athletes.
Table 8.2. Role in the Arctic Winter Games, by community (percentages)
Community Athlete Coach Volunteer
Small communities Jean Marie River 100 Enterprise Trout Lake 75 25 Nahanni Butte 100 Wrigley 20 80 NWT Youth Council 100 Medium communities Fort Resolution 79 11 11 Fort Liard 75 25 Fort Good Hope 74 5 21 Fort Providence 95 5 Fort McPherson 95 5 Large communities Fort Simpson 75 9 16 Fort Smith 93 3 3 Inuvik 86 6 7 Hay River 83 8 10
Overall 83 6 11 Source: Building Healthy Communities in the NWT Survey, 2002-2003.
Building Healthy Communities in the NWT Report World Leisure Professional Services http://www.worldleisure.org
49

8.2. AWG BENEFITS Survey respondents who have participated in the Arctic Winter Games, were asked to rate the 8 possible benefits that come from participation in the Games, on a 5-point Likert-type scale (5=strongly agree, 4=agree, 3=don’t agree or disagree, 2=disagree, 1=strongly disagree). All items listed, scored high on their importance. However, the strongest benefit was that “the Games build excitement and involvement of the people in my community” (mean score=4.12). Other items that scored high on importance, were (in order by mean scores) “help people work with others” (mean score=4.07), “give people leadership skills” (mean score=4.04) and “help people be a role model for others” (mean score=4.01). See Table 8.3. for a complete listing of items along with mean scores on a 5-point scale.
Table 8.3. Benefits of participation in the Arctic Winter Games (percentages)
Benefits of participation in the AWG
Strongly agree Agree Don’t agree
or disagree Disagree Strongly disagree
Mean scores*
The Games build excitement and involvement of the people in my community
39.0 41.2 14.7 3.4 1.7 4.12
Help people work with others 32.9 48.0 13.9 3.6 1.6 4.07
Give people leadership skills 32.2 47.1 15.0 3.9 1.8 4.04
Help people be a role model for others 32.6 43.7 17.2 4.8 1.7 4.01
The Games bring my community together 34.0 39.1 19.7 4.9 2.1 3.98
Help provide an understanding of other people 29.8 44.0 19.7 4.5 2.1 3.95
Make youth want to do better at school or work 25.1 38.5 25.9 7.7 2.8 3.75
Make people want to volunteer in the community 21.6 41.5 27.1 7.5 2.2 3.73
*Scale 1-5: 1=strongly disagree, 2=disagree, 3=don’t agree or disagree, 4=agree, 5=strongly agree Source: Building Healthy Communities in the NWT Survey, 2002-2003.
Table 8.4. explores perceived benefits of participation in the Arctic Winter Games, by community. Survey respondents were uncertain of the two items offered: (AWG) “make youth want to do better at school or work” (mean score=3.75) and (AWG) “make people want to volunteer in the community” (mean score=3.73). Further, Enterprise community scored below 3.4 on all items listed.
Building Healthy Communities in the NWT Report World Leisure Professional Services http://www.worldleisure.org
50
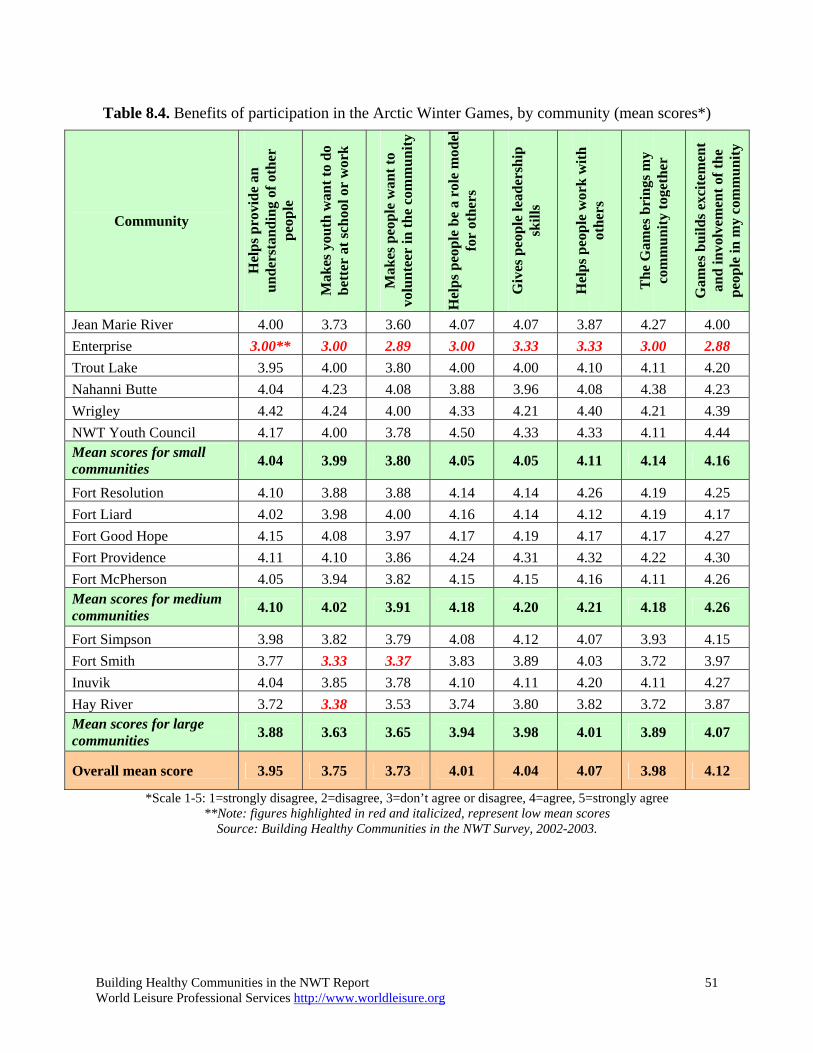
Table 8.4. Benefits of participation in the Arctic Winter Games, by community (mean scores*)
Community
Hel
ps p
rovi
de a
n un
ders
tand
ing
of o
ther
pe
ople
Mak
es y
outh
wan
t to
do
bett
er a
t sch
ool o
r w
ork
Mak
es p
eopl
e w
ant t
o vo
lunt
eer
in th
e co
mm
unity
Hel
ps p
eopl
e be
a r
ole
mod
el
for
othe
rs
Giv
es p
eopl
e le
ader
ship
sk
ills
Hel
ps p
eopl
e w
ork
with
ot
hers
The
Gam
es b
ring
s my
com
mun
ity to
geth
er
Gam
es b
uild
s exc
item
ent
and
invo
lvem
ent o
f the
pe
ople
in m
y co
mm
unity
Jean Marie River 4.00 3.73 3.60 4.07 4.07 3.87 4.27 4.00 Enterprise 3.00** 3.00 2.89 3.00 3.33 3.33 3.00 2.88 Trout Lake 3.95 4.00 3.80 4.00 4.00 4.10 4.11 4.20 Nahanni Butte 4.04 4.23 4.08 3.88 3.96 4.08 4.38 4.23 Wrigley 4.42 4.24 4.00 4.33 4.21 4.40 4.21 4.39 NWT Youth Council 4.17 4.00 3.78 4.50 4.33 4.33 4.11 4.44 Mean scores for small communities 4.04 3.99 3.80 4.05 4.05 4.11 4.14 4.16
Fort Resolution 4.10 3.88 3.88 4.14 4.14 4.26 4.19 4.25 Fort Liard 4.02 3.98 4.00 4.16 4.14 4.12 4.19 4.17 Fort Good Hope 4.15 4.08 3.97 4.17 4.19 4.17 4.17 4.27 Fort Providence 4.11 4.10 3.86 4.24 4.31 4.32 4.22 4.30 Fort McPherson 4.05 3.94 3.82 4.15 4.15 4.16 4.11 4.26 Mean scores for medium communities 4.10 4.02 3.91 4.18 4.20 4.21 4.18 4.26
Fort Simpson 3.98 3.82 3.79 4.08 4.12 4.07 3.93 4.15 Fort Smith 3.77 3.33 3.37 3.83 3.89 4.03 3.72 3.97 Inuvik 4.04 3.85 3.78 4.10 4.11 4.20 4.11 4.27 Hay River 3.72 3.38 3.53 3.74 3.80 3.82 3.72 3.87 Mean scores for large communities 3.88 3.63 3.65 3.94 3.98 4.01 3.89 4.07
Overall mean score 3.95 3.75 3.73 4.01 4.04 4.07 3.98 4.12
*Scale 1-5: 1=strongly disagree, 2=disagree, 3=don’t agree or disagree, 4=agree, 5=strongly agree **Note: figures highlighted in red and italicized, represent low mean scores
Source: Building Healthy Communities in the NWT Survey, 2002-2003.
Building Healthy Communities in the NWT Report World Leisure Professional Services http://www.worldleisure.org
51
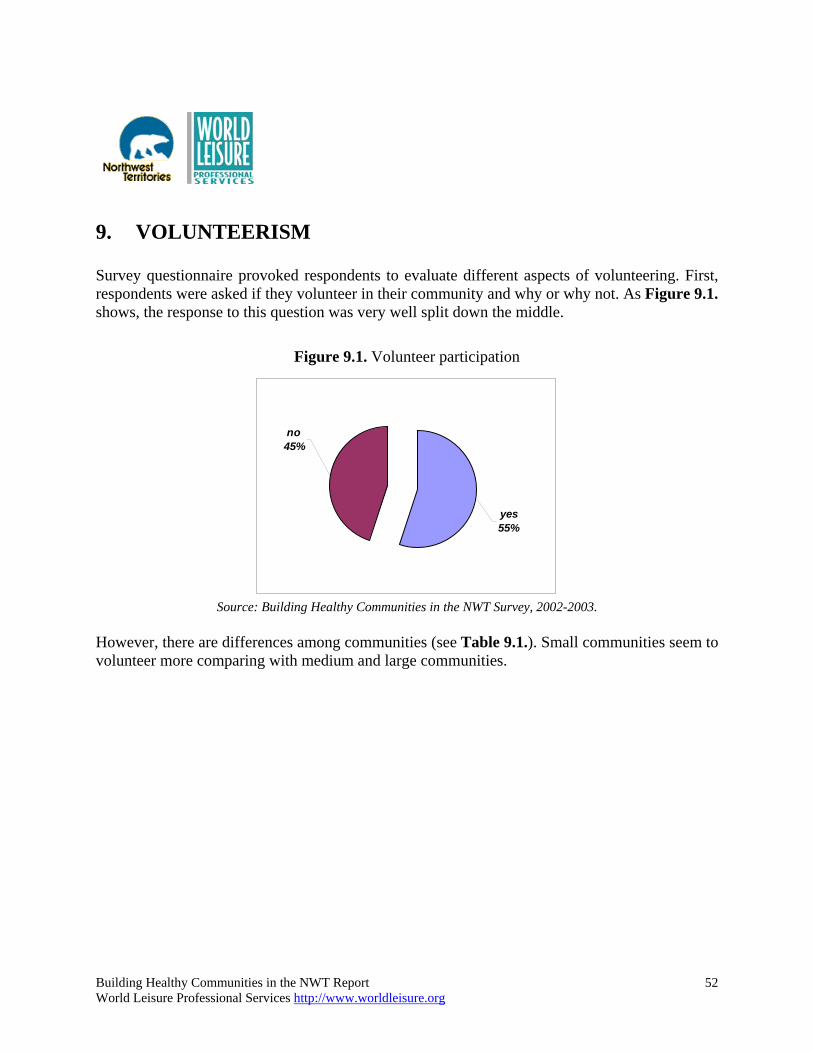
9. VOLUNTEERISM Survey questionnaire provoked respondents to evaluate different aspects of volunteering. First, respondents were asked if they volunteer in their community and why or why not. As Figure 9.1. shows, the response to this question was very well split down the middle.
Figure 9.1. Volunteer participation
yes55%
no45%
Source: Building Healthy Communities in the NWT Survey, 2002-2003.
However, there are differences among communities (see Table 9.1.). Small communities seem to volunteer more comparing with medium and large communities.
Building Healthy Communities in the NWT Report World Leisure Professional Services http://www.worldleisure.org
52

Table 9.1. Volunteer participation, by community (percentages)
Community Yes No Small communities Wrigley 88 12 Jean Marie River 85 15 Trout Lake 65 35 Nahanni Butte 59 41 NWT Youth Council 58 42 Enterprise 43* 57 Medium communities Fort Resolution 60 40 Fort Providence 58 42 Fort Good Hope 50 50 Fort Liard 38 62 Fort McPherson 36 64 Large communities Fort Simpson 65 35 Inuvik 53 47 Hay River 49 51 Fort Smith 46 54
Overall 54 46 *Note: figures highlighted in red and italicized, represent community volunteering lower than 50%
Source: Building Healthy Communities in the NWT Survey, 2002-2003. To explore the reasons of (non)volunteering, the survey questionnaire asked respondents to elaborate why they (don’t) engage in community volunteering.
In regard to motives of volunteering, the survey questionnaire had several choices available, and respondents could choose all that applied to them. The following answers were obtained (in order): forty percent of respondents said they volunteer to help others, thirty-seven percent said they give their time to their community and help with the youth, thirty-six percent said they volunteer to give something back to the community, and thirty-two percent just want to meet other people.
Those who responded they do not volunteer, indicated the four major reasons: respondents did not have time there were no opportunities to volunteer they did not want to participate they were just lazy
Building Healthy Communities in the NWT Report World Leisure Professional Services http://www.worldleisure.org
53

Further examination of non-participation reasons revealed an interesting fact: despite commonalities between communities, community groups differed in their answers. The prevalent reason of non-participation in volunteering within large communities was the lack of information regarding activities. The lack of time appeared to be the second factor. Probably, community recreation departments should pay more attention to publicity of volunteering activities within their communities, especially in large communities. Second, respondents were asked if they believe that being active in recreation helps them become a community volunteer. The majority of 80% agreed with the statement, versus twenty percent who did not. Table 9.2. depicts thoughts on this issue, by community.
Table 9.2. Does being active in recreation help to become a community volunteer, by community (percentages)
Community Yes No Small communities Jean Marie River 80 20 Enterprise 25 75 Trout Lake 72 28 Nahanni Butte 96 4 Wrigley 84 16 NWT Youth Council 93 7 Medium communities Fort Resolution 90 10 Fort Liard 69 31 Fort Good Hope 82 18 Fort Providence 81 19 Fort McPherson 84 16 Large communities Fort Simpson 88 12 Fort Smith 65 35 Inuvik 78 22 Hay River 75 25
Overall 80 20 Source: Building Healthy Communities in the NWT Survey, 2002-2003.
One more important issue was raised by survey respondents in regard to volunteering, - the need to encourage and attract more volunteers in communities. More, recognition and rewarding volunteers could help increase their motivation and involvement.
Building Healthy Communities in the NWT Report World Leisure Professional Services http://www.worldleisure.org
54

10. CONTRIBUTION OF RECREATION TO COMMUNITY DEVELOPMENT
Recreation has an enormous impact on community development. It can improve quality of life for residents and attract visitors as well. On the other hand, community development is beneficial on several levels for individuals and society. There are numerous studies discussing recreation’s contribution to community development. Hutchinson & Nogradi (1996) define the concept of community development as “a process of involving citizens in decision-making, resulting in changes in their lives and the local community”. Further, they define it as a process of assisting individuals and groups so that they may initiate a process of helping themselves. Pedlar (1996) discusses the concept of community as involving a sense of place, psychological involvement, social interactions, feelings of connectedness, sharing, and cooperation. It is vitally important to involve various stakeholder groups in community development issues (Hutchison & Nogradi, 1996). Involving members of the community provides a sense of ownership and opportunities for programs to evolve from the wants and needs of citizens. It not only brings the positive change to community, but also increase the sense of community among citizens. In this study, respondents were asked how they felt about their own community and its’ recreation development opportunities. Fourteen statements about recreation and community satisfaction were used. Respondents were asked to reply on a 5-point Likert-type scale (5=strongly agree, 4=agree, 3=don’t agree or disagree, 2=disagree, 1=strongly disagree). Factor analysis revealed three major factors influencing respondents’ perception of the role of recreation in community development, namely, positive outcomes (Factor 1), negative outcomes (Factor 2), and impacts and benefits of recreation (Factor 3). Tables 10.1. - 10.3. list statements allocated to each factor, along with mean scores obtained, by community. Results of the factor analysis are given in Appendix 8.
Building Healthy Communities in the NWT Report World Leisure Professional Services http://www.worldleisure.org
55

Table 10.1. Factor 1: positive thoughts on community, by community (mean scores*) Small communities Medium communities Large communities
Positive thoughts on community
Jean
Mar
ie R
iver
Tro
ut L
ake
Nah
anni
But
te
Wri
gley
Ent
erpr
ise
NW
T Y
outh
Mea
n sc
ore
Fort
Goo
d H
ope
Fort
Lia
rd
Fort
McP
hers
on
Fort
Pro
vide
nce
Fort
Res
olut
ion
Mea
n sc
ore
Fort
Sim
pson
Fort
Sm
ith
Hay
Riv
er
Inuv
ik
Mea
n sc
ore
Ove
rall
mea
n sc
ore
The community has good leaders 3.21 3.11 3.31 3.42 2.60 3.00 3.18 3.76 3.47 3.64 3.62 3.21 3.46 3.50 3.36 3.45 3.55 3.51 3.47
The future of the community looks positive 3.79 3.50 3.73 3.75 2.80 3.05 3.51 3.15 3.39 3.48 3.37 2.74 3.25 3.42 3.13 3.40 3.57 3.49 3.43
People of this community continually look for new solutions to problems
3.21 3.39 3.10 3.58 3.00 3.00 3.24 3.53 3.59 3.51 3.47 3.70 3.46 3.31 3.18 3.40 3.46 3.39 3.39
I am satisfied with the quality of life in this community 3.14 3.67 3.58 3.33 3.30 2.79 3.34 3.08 3.41 3.26 3.34 2.74 3.19 3.24 3.16 3.40 3.35 3.36 3.32
This community is an ideal place to live because of recreation
3.20 3.44 3.07 3.32 3.00 2.63 3.12 2.92 3.37 3.26 3.29 3.61 3.10 3.04 3.02 3.22 3.18 3.17 3.15
There is an adequate number of recreation opportunities here in this community
2.77 3.39 2.90 3.00 3.00 3.05 3.02 2.92 2.87 3.21 3.14 2.86 3.02 3.05 3.04 3.23 3.19 3.17 3.12
*Scale 1-5: 1=strongly disagree, 2=disagree, 3=don’t agree or disagree, 4=agree, 5=strongly agree **Note: figures highlighted in red and italicized represent low mean scores
Source: Building Healthy Communities in the NWT Survey, 2002-2003.
Building Healthy Communities in the NWT Report World Leisure Professional Services http://www.worldleisure.org
56

Table 10.2. Factor 2: negative thoughts on community, by community (mean scores*) Small communities Medium communities Large communities
Negative thoughts on community
Jean
Mar
ie R
iver
Tro
ut L
ake
Nah
anni
But
te
Wri
gley
Ent
erpr
ise
NW
T Y
outh
Mea
n sc
ore
Fort
Goo
d H
ope
Fort
Lia
rd
Fort
McP
hers
on
Fort
Pro
vide
nce
Fort
Res
olut
ion
Mea
n sc
ore
Fort
Sim
pson
Fort
Sm
ith
Hay
Riv
er
Inuv
ik
Mea
n sc
ore
Ove
rall
mea
n sc
ore
People will not work together to get things done 3.71 3.35 3.38 3.67 3.00 3.32 3.43 3.33 3.16 3.33 3.17 3.42 3.27 3.23 3.22 3.03 3.04 3.07 3.15
Not much can be said in favor of this community 3.36 3.28 2.89 3.25 3.00 3.26 3.16 3.06 2.89 3.15 3.07 3.12 3.06 2.72 3.11 3.04 2.82 2.80 2.90
*Scale 1-5: 1=strongly disagree, 2=disagree, 3=don’t agree or disagree, 4=agree, 5=strongly agree **Note: figures highlighted in red and italicized represent low mean scores
Source: Building Healthy Communities in the NWT Survey, 2002-2003.
Building Healthy Communities in the NWT Report World Leisure Professional Services http://www.worldleisure.org
57

Table 10.3. Factor 3: impacts and benefits of recreation, by community (mean scores*) Small communities Medium communities Large communities
Impacts and benefits of recreation
Jean
Mar
ie R
iver
Tro
ut L
ake
Nah
anni
But
te
Wri
gley
Ent
erpr
ise
NW
T Y
outh
Mea
n sc
ore
Fort
Goo
d H
ope
Fort
Lia
rd
Fort
McP
hers
on
Fort
Pro
vide
nce
Fort
Res
olut
ion
Mea
n sc
ore
Fort
Sim
pson
Fort
Sm
ith
Hay
Riv
er
Inuv
ik
Mea
n sc
ore
Ove
rall
mea
n sc
ore
Recreation helps make this a good place to live 4.20 4.13 4.20 4.12 3.38 4.37 4.14 4.00 98 4.11 3. 3.95 3.58 3.95 4.06 3.80 3.94 4.15 4.08 4.05
Recreation offers ways to be with friends and relatives 4.00 3.94 4.30 3.75 3.33 3.63 3.90 4.09 3.93 3.92 3.93 3.98 3.98 3.92 3.56 3.73 3.94 3.88 3.91
I feel I can volunteer in this community 4.00 4.00 3.79 3.96 2.90 3.79 3.81 3.68 3.67 3.42 3.95 4.00 3.74 3.83 3.53 3.57 3.70 3.73 3.74
There are opportunities for participating in volunteer activities in this community
3.07 3.83 3.70 3.71 3.30 3.47 3.57 3.71 3.59 3.89 3.61 3.71 3.70 3.77 3.63 3.52 3.72 3.72 3.70
Recreation is one of the most important services 3.79 3.61 3.53 4.00 2.90 3.53 3.61 3.78 3.65 3.88 3.71 3.63 3.74 3.67 3.47 3.45 3.73 3.63 3.66
Being in recreation programs allow me to have input into community decisions
3.36 3.61 3.47 3.54 2.44 3.47 3.41 3.50 3.43 3.49 3.54 3.43 3.49 3.28 3.19 3.28 3.48 3.35 3.39
*Scale 1-5: 1=strongly disagree, 2=disagree, 3=don’t agree or disagree, 4=agree, 5=strongly agree **Note: figures highlighted in red and italicized represent low mean scores
Source: Building Healthy Communities in the NWT Survey, 2002-2003.
Building Healthy Communities in the NWT Report World Leisure Professional Services http://www.worldleisure.org
58

FACTOR 1. Positive thoughts on community. Positive thoughts on community scored high overall. However, there are slight differences among community groups (see Table 10.1.). Small communities scored highest on “the future of the community looks positive” (mean score=3.51), medium communities agreed that “people of this community continually look for new solutions to problems” (mean score=3.46), and large communities scored the highest on other items listed (in order): “the community has good leaders” (mean score=3.51), “I am satisfied with the quality of life in this community” (mean score=3.36), “there is an adequate number of recreation opportunities here in this community” (mean score=3.17) and “this community is an ideal place to live because of recreation” (mean score=3.17). At the same time, several items scored below 3.0, indicating that respondents were closer to disagreement not agreement (see figures highlighted in red and italicized, Table 10.1.). The Enterprise community was not satisfied with the leaders (mean score=2.6) and also not sure about the positive future of the community (mean score=2.8). Within Fort Good Hope, respondents were somewhat dissatisfied with recreation facilities and recreation resources (both mean scores=2.92). Finally, recreation department of the Fort Resolution should consider community concerns regarding the quality of life (mean score=2.74), the positive future of community (mean score=2.74) and recreation opportunities (mean score=2.86). In regard to recreation opportunities within communities, five out of fifteen communities indicated a number of recreation opportunities in their community as inadequate. These results, along with respondents’ comments on other survey questions, should provide recreation management with the wealth of information on community recreation needs. FACTOR 2. Negative thoughts on community Within this factor, two items were offered for evaluation: “not much can be said in favor of this community” and “people will not work together to get things done”. They both are worded in a way that high scores represent negative perceptions of community, and low scores represent positive attitude towards community. Surprisingly, survey respondents showed a very critical attitude towards their communities. Only four out of fifteen communities (Nahanni Butte, Fort Liard, Fort Simpson and Inuvik) disagreed with the statement “not much can be said in favor of this community”, versus eleven others who agreed. The other statement that “people will not work together to get things done” scored high among all communities surveyed. FACTOR 3. Thoughts regarding impacts and benefits of recreation. Respondents were asked to rate 6 items regarding their perceptions on impacts and benefits of recreation within their communities. Overall, all communities surveyed scored high on all items. However, Enterprise community respondents were somewhat disagreeing with the items “being in recreation programs allow me to have input into community decisions” (mean score=2.44), “I feel I can volunteer in this community” (mean score=2.9) and “recreation is one of the most important services” (mean score=2.9).
Building Healthy Communities in the NWT Report World Leisure Professional Services http://www.worldleisure.org
59

11. ANALYSIS OF OPEN-ENDED QUESTIONS, BY COMMUNITY
SMALL COMMUNITIES Jean Marie River The most prevalent response from the Jean Marie River community was the need for a recreation coordinator and community leaders. The respondents feel that programs are lacking, and without a recreation coordinator nothing is being done. Recreation leadership is important to community development and involvement in activities. Children’s programming is also important to this community. Twenty percent of respondents feel that more coaches are needed. Respondents feel that children are missing out without recreation leadership. More programs need to be made available to residents, which can be done through a recreation coordinator.
The highest response in regards to parks, fields, and trails was that more trails are needed. Trails that can be used for hiking in the summer and cross-country skiing in the winter are most desirable.
Some concerns were mentioned about the maintenance of the ice rink and baseball field. New facilities or an appropriate maintenance plan is needed before the current facilities become decrepit. Twenty percent of respondents said hockey is their favorite sport, so this should be taken into consideration when thinking about the condition of the ice rink and whether to build a new one. Also, more activities scheduled at recreation facilities are desired. Dog sledding and kayaking/canoeing were requested by 20% of respondents as activities they would like to try.
About half of respondents have participated in community recreation activities in the last year, with activities such as basketball, broomball, and hockey. The respondents who hadn’t participated in community leisure opportunities said they didn’t because they didn’t have the time, there are no community programs, or they could not find a baby sitter. Most of these leisure constraints can be remedied. The city can offer a better variety of programs to reach more people or start a day care at the recreation site. The volunteerism rate in Jean Marie River is at 73%. This means people are willing to volunteer, but more volunteer awareness and opportunities are desired. Most people who do volunteer do so at carnivals and festivals. These events are a great opportunity to raise awareness and get the community involved. Those who don’t volunteer said it is because they don’t have the time or they are not aware of the programs.
Building Healthy Communities in the NWT Report World Leisure Professional Services http://www.worldleisure.org
60

Overall, Jean Marie River needs a new recreation coordinator that can raise community leisure involvement, involve youth, and provide more programs. The residents want to participate in leisure; they just need the opportunities and facilities to do so. Enterprise Overall, respondents within the Enterprise community rather poorly expressed their ideas on possible improvements of recreation services. However, they suggested having more trails and parks, as well as a gymnasium and a swimming pool. Out of the programs respondents participate in, hockey, parks programs and basketball are the most popular. Boating, camping and basketball are reported to be the most favorite programs among community members. On the other hand, hockey, skiing, snow mobiling are the most desirable activities, along with hiking, boating/canoeing/kayaking and Dene games. When respondents did not participate in any of the recreation programs offered, it was mainly because of the lack of time or a lack of interest in those programs of choice. Comments upon the latter revealed an idea to change operating hours of facilities and introduce a wider variety of programs to the community. Those programs already existing, were indicated as not inclusive. Furthermore, if changes were made they were not widely publicized which was another community concern. Trout Lake When asked about their recreation resources, Trout Lake respondents overwhelmingly replied that their community needs a bigger gym (45%), more hiking trails (40%) and a bigger baseball field (30%). Fifteen percent of respondents also suggested that a track and field arena and a skiing trail are needed. Tennis court and hockey ring were supported by the ten percent of respondents. Suggested programs in Trout Lake included coaching programs, more programs for teens and more for women, like exercise and jogging. The community agreed that out of town coaches and leaders are needed. The respondents want qualified people with outside training and new ideas to be coaches and recreation coordinators. Also, respondents noted that more people need to be active in the community through being leaders, coaches, and volunteers.
Volunteerism in Trout Lake among respondents is at 65%. Thirty percent of these people feel they need to be recognized more for their efforts. The major reason people do not volunteer is because of the lack of recognition. Some suggestions for increased recognition include volunteers wearing uniforms or being mentioned in newspapers/radio. This might enhance motivation for people to volunteer at community events. Of those who don’t volunteer, 43% say they don’t because they are busy with other things to do. Of those who do volunteer, the Spring Carnival and Feast activities reported the highest amount of volunteerism. Nahanni Butte The largest concern voiced by the respondents from this community is the need for a gymnasium. The residents want a place for youth activities and indoor sports. Nahanni Butte is worried about the opportunities for their children to participate in leisure and sport activities. Nineteen percent of respondents wanted more programs to be offered, but the need for a community gym is halting progress.
Building Healthy Communities in the NWT Report World Leisure Professional Services http://www.worldleisure.org
61

Survey respondents feel that more involvement and training is necessary for area coaches and leaders. Coaching workshops could be held to improve the quality of Nahanni Butte’s sports programs. Twenty two percent of respondents said they would volunteer if given the chance, but they were never asked. This is either a problem of awareness or lack of volunteering opportunities. Having a recreation coordinator could improve the volunteering rates in the community by planning programs and raising awareness. Overall, Nahanni Butte’s biggest problem is lack of an appropriate recreation facility to hold programs for various ages. Another concern was building a school playground. Wrigley Overwhelmingly, Wrigley respondents replied the community recreation services need to improve park maintenance (45%) and create extra trails for biking and walking (30%). When asked about improvement of existing facilities, most answers collapsed into a need of having a swimming pool (50%), arena and a skating rink. Out of programs most respondents participated in, cultural programs, soccer, volleyball, basketball and track and field were the most commonly cited. This is an interesting finding, as Wrigley community is if not the only one with the high percentage of community members (40%) participating in arts/cultural programs. That should be taken into consideration when developing a recreation/leisure strategic plan for the future. Most favorite recreation activities were soccer, boating/canoeing, volleyball and swimming. Furthermore, respondents were asked to indicate three activities they have not participated in but would like to try. Those were boating/canoeing/kayaking (25%), Dene games, hunting, fishing and biking (20% each choice). When not participated in a recreation program, the reason was either a lack of time or a lack of interest in what is being offered.
The large concern in community is the lack of programs targeted towards different age groups. Over 70% of respondents said they wish to see a wider variety of programs for kids, youth and adults. They also replied they feel lack of volunteers, but probably it’s because volunteer’s work is not being properly recognized. When volunteering themselves, most respondents did so at community organized events (80%). Answering whether Wrigley has enough leaders and coaches, the prevalent response was that to improve the situation, coaches/leaders should be role models for youth, and it would be a positive change if a community organized a training course for coaches. One of the major concerns regarding recreation needs of the Wrigley community was to make existing programs more inclusive, attract more volunteers and involve community into decision making process. Most of respondents were also dissatisfied with the work of a recreation coordinator. NWT Youth Council Youth survey respondents made a very valuable input in the study. Despite the small number of NWT Youth Council participants, all the comments collected showed high level of awareness of community recreation needs and offered some interesting ways to improve the situation.
Building Healthy Communities in the NWT Report World Leisure Professional Services http://www.worldleisure.org
62

Respondents originated from different communities, most of them were included in the study. Therefore, their opinions would be a useful add-in to the data obtained from each of the communities. The prevalent answer concerning improvement of parks/fields/trails, was the need to maintain all the mentioned recreation sites (80%) and create more parks and fields (30%). As for facilities, youth wants to have a fitness center (35%), a youth center (30%) and a community hall (25%). There is also a great need for more volunteers, more sports programs and more programs targeted on youth. Having those programs, communities would have to pay a separate attention to hiring and training coaches. Recreation activities most of respondents participated in within the previous year, were soccer, swimming, volleyball, baseball and camping. If not participating in any of the programs offered, it was because there was nothing interesting or there was no information on current events. Interestingly, the most common answer “I don’t have time” did not appear within the Youth Council, therefore, advertising current activities and creating a wider variety of recreation programs, would attract youth to participate in them. Favorite recreation activities respondents participate in, were volleyball (35%), soccer (30%), basketball (30%), hiking and camping (20%). Those activities respondents have never participated in but would like to try, were boating/kayaking/canoeing, skateboarding/rollerblading, camping/hiking, dog sledging, snow shoeing and soccer. The majority of respondents would like to see more youth programs organized within the community. They do volunteer in their communities (most of the time during community organized events), and when they don’t, it’s either because of the lack of time or the lack of information. It proves once again the need to advertise recreation programs and activities so that young members of each community would know about them. MEDIUM COMMUNITIES Fort Resolution Majority of respondents from the community (60%) would like to see the park upgraded. About 30% said there is a need for more trails for hiking, walking and biking. In regard to facilities, seventy percent of surveyed wish to have more facilities, including new youth center. About 40 percent said operating hours of recreation facilities should be changed. A big group of respondents expressed concern towards the lack of programs for various age groups as well as the need to develop summer programs for children. Fort Resolution also needs to develop a local training program for leaders and coaches, and to advertise volunteering to attract more volunteers. Furthermore, there was a general concern that volunteer work is not being rewarded and recognized. When asked about recreation activities they participate in, majority of respondents said they participated in local or aboriginal activities (50%), the rest enjoyed soccer. Main reasons of non-participation were the lack of information about recreation programs offered, lack of time or
Building Healthy Communities in the NWT Report World Leisure Professional Services http://www.worldleisure.org
63
interest in programs. Favorite recreation activities mentioned were outdoor activities and soccer (60% each), followed by hockey (50%), volleyball (40%) and walking (30%). Again, reasons preventing respondents to participate in their favorite recreation activities, were lack of information and lack of time. Probably community recreation department should pay more attention to advertising recreation programs and activities. The top 8 activities desired by respondents, were boating/canoeing/kayaking, dog sledding, carnivals, hockey, broomball, skating and skiing (all over 30%). In regard to volunteering, major group of survey respondents volunteer at community events and/or recreation/sports events. Those who do not volunteer, explained their choice by the lack of free time. Overall, residents-respondents of the Fort Resolution agreed that their community lack long-time recreation planning and community involvement in the planning process. They greatly appreciate survey as one of the means to assess community recreation needs, and wish their thoughts will be taken into consideration by the recreation department. Fort Liard In regard to recreation issues, 18% of respondents reported they would like to see more trails in the community. Also 32% desire more parks and playgrounds. Maintenance of parks is another issue addressed by 10% of those surveyed. An increase in park space and trails would have a positive impact on community. The respondents also noted the need for more volunteers in the community. Several respondents said they would volunteer, but never had an opportunity. Building and maintaining parks could become a volunteer effort in the community. Respondents expressed an aspiration for improved recreation facilities in the area. A multiuse facility with meeting rooms and a fitness center would increase recreation programming options. Programming is an area of concern because of the lack of age-specific programs offered. A recreation facility would provide a place for a wide variety of programs. Fort Liard desires more program variety and age specific programs, along with weekend or after school activities for youth. Coaching workshops, aboriginal activities, community support programs, and sports could all be offered at such a facility. Overall, an increase in variety of programs offered and enhanced park spaces are the biggest issues in this community. Fort Good Hope There are several recreation resources that need improvement. Fort Good Hope would like to see an extension of trails and parks in the area, along with better maintenance. Other recreation facilities desired by respondents include: a swimming pool (18%), a gymnasium (16%), a recreation center (12%), and a youth center (7%). The main issue with programming is the lack of age-specific opportunities. Another programming issue is the need for coaching instruction.
Building Healthy Communities in the NWT Report World Leisure Professional Services http://www.worldleisure.org
64

Volunteerism in Fort Good Hope is lacking, and could be improved if more programs are offered, and information was distributed about volunteer opportunities. Coaching instruction workshops would raise awareness and interest in coaching. A community recreation center would provide a facility for a variety of programs to be held, including age-appropriate programs, coaching workshops or volunteer opportunities. Respondents showed interest in tying new activities such as boating, kayaking, or canoeing and camping/hiking. These are other areas programming could be extended to in the future. Fort Providence The foremost concern of the Fort Providence residents is the lack of programming, especially programs targeting specific age groups. The respondents’ chief anxiety is the area’s youth having no programming options. They feel the community needs more age appropriate program opportunities and after school activities. A large part of the problem with youth programming is the lack of coaches for sports teams. Nineteen percent of respondents agreed that coaching workshops are needed to increase the number of coaches in the area. Implementing a satisfactory coaching program facilitated by a trained professional would provide the community a solution to two problems: the shortage of coaches, and it would increase the number of youth sports programs. The youth of the community expressed interest in building a BMX/skateboarding park. A program could be implemented to involve youth in the planning and building process of the BMX Park. This would be an opportunity to get youth involved in something they are interested in and providing a facility for them to feel ownership of.
Another important matter addressed by the community is adult programming. Twenty-one percent desired an indoor swimming pool and another 25% said they would like to see a fully equipped gym with an exercise equipment room. The adults in Fort Providence want a recreation gym they can use for adult programs and that is open in the evenings. Such a facility would provide a myriad of opportunities for community recreation programming.
When asked about the condition of parks, fields, and trails in Fort Providence, the highest response was that there are not enough walking and biking trails. Suggestions were made for trails to be developed along the highways. Trail development is beneficial to the community as a whole because they are available for a plethora of uses such as, walking, running, biking, cross country skiing, or snowmobiling. The volunteerism rate in Fort Providence is about 55%. Ten percent of volunteers reported that they are willing to work whenever needed at community events. Feast activities, Makenzie Daze, volunteering at the school, and helping with youth were the top volunteer activities listed. Twenty four percent of respondents believe there should be more volunteers in the community. This can be accomplished through extended community involvement with new volunteers, and an increase in parental involvement through children’s programs. However 16% of the respondents who don’t volunteer said they are willing but never had the opportunity to volunteer. An additional 25% of non-volunteers said they simply do not have the time because of work or home commitments. New volunteers could be recruited through schools, newspapers, or increasing programming to provide opportunities for those who have not previously had the chance to volunteer.
Building Healthy Communities in the NWT Report World Leisure Professional Services http://www.worldleisure.org
65

In conclusion, a community recreation center with a gymnasium, exercise equipment and a meeting space would provide this community with the opportunity to increase programming and community involvement in recreation. Fort McPherson One of the main concerns in Fort McPherson is volunteerism. Twelve percent of respondents said they would like to see more volunteers. The top two reasons for not volunteering are lack of time and lack of interest, followed by not having the chance to volunteer. People could be motivated to volunteer if they are recognized for their work, information about volunteer opportunities is made more widely known, or more programs are offered. More coaches and more training for coaches is another issue in this community. Qualified outside instructors could be brought into the community to facilitate coaching workshops to raise interest and ability of coaches.
The residents of Fort McPherson would like to see more recreation facilities, or an upgrade in current facilities. Soccer and hockey are the two activities with the highest participation rates, so these facilities should remain well-maintained. For future programming options, the respondents mentioned they would like to try camping, hiking, boating, kayaking or canoeing. Fort McPherson would also like to see more trails and upgraded parks. Another focus area for Fort McPherson is the lack of age-specific programming options. Age oriented programs are important for youth development and for programs to run smoothly. This community should implement more age-specific programs and appeal to potential volunteers to help run these programs. LARGE COMMUNITIES Fort Simpson The foremost concern raised at the community, is the need to have more trails for biking as well as pave trails for walking/jogging in summertime, and skiing in wintertime (almost 70%). In general, there is a concern that trails are not being maintained and upgraded, plus there is a lack of signs and maps of existing trails. Survey respondents feel the community should clean up nature areas and perhaps build a playground/recreation park for kids. In regard to facilities, more than fifty percent of surveyed said the community recreation department should open a year-round, full-size swimming pool/renovate existing pool. Other important facilities would be a skating rink and a skateboard park. Furthermore, facility management should adjust operation hours to attract wider range of community population, and make facilities more user-friendly. Over forty percent of respondents feel there is a lack of volunteers. To encourage community members to volunteer, the work of those who do volunteer, should be recognized and appreciated (a suggestion to introduce a volunteer appreciation program). Another suggestion was to involve high school students and parents, and to organize workshops for volunteers. There is also a lack of publicity on those activities people could help with.
Building Healthy Communities in the NWT Report World Leisure Professional Services http://www.worldleisure.org
66

In regard to programs, there is a concern that there are not enough recreation activities for various age groups (adult programs, kids/youth programs etc.). About 14% of respondents said the community needs to develop summer programs/camps for kids, as well as programs running throughout the wintertime. Around 35% of survey respondents said there are not enough leaders and coaches. The reason could be the absence of a local training program (40%), so it would be beneficial for the community to develop one. The top 10 recreation activities within the community are soccer, hockey, curling, skiing, swimming, basketball, badminton, skating, track and field, and volleyball. Out of those, soccer and ice hockey are the most popular. Community members who do not participate in any of recreation programs offered, mostly said they don’t have time for it (about 50%). Twenty-five percent said they don’t find programs interesting for them, and ten percent don’t have information regarding recreation in their community. Favorite recreation activities in Fort Simpson, as stated by respondents, are soccer, hockey, volleyball, swimming, basketball and walking. However, there is a concern of the lack of facilities for those programs, as well as the lack of programs themselves. In regard to recreation programs respondents have never participated in but would like to try, the top ten activities mentioned were canoeing, hockey, snowshoeing, rollerblading, volleyball, skiing, dog sledging, fitness, broomball and Arctic/Aboriginal sports. Large number of responses leads to a thought that community recreation department should develop some of those to popularize recreation. Survey respondents were asked whether they volunteer at their community. Over forty percent of those who do, said they volunteer at various community events. Twenty-five percent said they help coaching, and 17% volunteered at community carnivals. At the same time, there is a big number of people who don’t have time to volunteer (over half of those who responded negatively to the question). The two other popular answers about non-volunnteering were lack of interest and lack of information regarding programs to volunteer. Overall, there was a wealth of comments regarding recreation within the Fort Simpson community. Survey respondents are greatly dissatisfied with the work of the recreation director. They indicate the community needs a swimming pool and other recreation facilities, lacks programs for different age groups and community support in recreation development. Fort Smith The major concern of survey respondents regarding the possible improvement of parks, fields and trails is the lack of trails for biking, running and walking. About fifty percent of surveyed said the community would benefit from the new swimming pool, and twenty percent asked for a new arena. In regard to volunteers, majority of respondents think more volunteers is needed, and their work should be recognized. The same concern applies to leaders and coaches: more coaches are needed, and perhaps the community could develop a training program for leaders and coaches. Further on, Fort Smith recreation does not have enough programs for various age groups, and those that exist, are not well publicized.
Building Healthy Communities in the NWT Report World Leisure Professional Services http://www.worldleisure.org
67

The top four recreation activities in Fort Smith appeared to be aquatics/swimming, fitness, hockey and camping. Favorite recreation activities were running, swimming and golfing. However, a number of respondents indicated they don’t participate in their favorite recreation activity because of the poor organization. The top five activities respondents have not participated in but would like to try, were kayaking, snow shoeing, dog sledding, skiing and rollerblading. Survey respondents were asked whether they volunteer in their community. Out of those who answered positively, over half volunteered at community festivals, around forty percent helped at community events, and twenty-five percent volunteered at sports activities. Those who answered negatively, mainly did not have time to volunteer, or did not know about any programs they could help with. Overall, respondents of the Fort Smith community have raised an issue of increasing public awareness concerning the role of recreation in their community, and wish to see some changes made. Inuvik When asked about their recreation resources, about 40% of respondents said they wish to have more trails for biking and walking, 25% said fields need to be upgraded and maps and sings need to be installed on trails. Twenty-two percent of respondents want to have more parks; about fifteen percent said park maintenance should be improved. Finally, twelve percent said more green areas are needed.
Survey respondents indicated the following issues regarding recreation facilities, as significant within their community: a need to upgrade existing swimming pool and perhaps build a new one (35%), a need for a new fitness center (27%), a need to renovate existing youth center and perhaps build a new one (18%), a new arena (9%), courts for squash /tennis (6%) and a movie theater (4%).
In regard to volunteering, Inuvik community respondents stated that volunteers’ input into community life should be recognized. Almost 40% of respondents said the public should be informed of a need for volunteers, so they can participate. Half of respondents think youth should be involved in volunteering and overall community needs more volunteers.
Further on, sixty percent of survey respondents expressed the community need to have more recreation programs for various ages. Among programs that were offered, sports, fitness, arts/cultural programs, seasonal activities and aboriginal programs appeared to be the most important for residents-respondents. People also feel recreation programs could be better advertised and operating hours of facilities should be adjusted to suit recreation needs of a wider group of population. Regarding leaders and coaches, two-thirds of respondents think their community needs more coaches and leaders, therefore it would be beneficial to organize a local training program for them within the Inuvik.
The top 10 recreation activities respondents participated in within the previous year, were hockey, skating, aquatics/swimming, soccer, volleyball, curling, camping/hiking, baseball, skiing
Building Healthy Communities in the NWT Report World Leisure Professional Services http://www.worldleisure.org
68

and aboriginal sports. Besides identifying most popular recreation activities, the survey asked respondents to elaborate why they don’t participate in recreation. The most common answers were: no time (over 50%), no information on programs that are offered (40%), and nothing of interest (10%).
Soccer, volleyball, hockey, running/walking/jogging, basketball, aquatics/swimming and biking appear to be favorite recreation activities in the Inuvik. However, some respondents answered they do not have any favorite recreation activity because there is nothing of interest to them. Probably, a community recreation department could develop a wider range of various programs to attract more community members. To assess what programs should be addressed, survey respondents were asked to indicate three activities they have not participated in but would like to try. The following activities were mentioned most often: boating/canoeing/kayaking, dog mushing/dog sledding, snow shoeing, hockey, broomball, skating, hiking/camping/backpacking, arts and crafts, skiing, badminton and hiking. In regard to volunteering, forty percent of respondents said they volunteer at community events, thirty percent helped at community centers, twenty percent – at sports events, and ten percent of respondents volunteered during youth activities. Half of those who did not volunteer, said they don’t have time for it, thirty percent said they don’t know about any activities they could volunteer at, and twenty percent were not interested in volunteering. Overall, respondents of Inuvik community feel that their facilities, trails, fields, and parks are not well maintained and there seem to be a concern for the safety of the playground equipment for the children. Many respondents indicated racism as an issue within the community, as well as the lack of public awareness regarding recreation. Hay River Overwhelmingly, survey respondents agreed that their community needs more trails for biking and walking, and existing trails need to be maintained and upgraded (50% and 23% respectively). They also raised a problem of conserving nature areas around community (16%). Furthermore, community residents-respondents wish to have more parks and playgrounds, and strongly wish to have a fitness center (20%), swimming pool, courts for squash/tennis/badminton and a skating rink (15% each). Existed arena and other recreation facilities need to be updated (10% each), and a new youth center could be built (5% of respondents). In regard to volunteers, Hay River needs to attract more volunteers (60%) and recognize work of those volunteering (50%). There is a complaint on the absence of the local training course for coaches and leaders, and a suggestion to involve more youth in coaching. When asked to evaluate community recreation resources, majority of respondents said their community needs more programs for various age groups (60%). They wish to have a fitness program and more publicity for those programs offered. The top 5 recreation activities respondents participated in, were hockey (25%), aquatics/swimming (25%), golfing (10%), skating (10%) and track and field athletics (10%). Those who did not participate in any of recreation programs, did not have time to do so (30%),
Building Healthy Communities in the NWT Report World Leisure Professional Services http://www.worldleisure.org
69

did not know about any of programs available (30%) or did not find programs interesting for them (30%). Favorite recreation activities in Hay River, as stated by survey respondents, are walking/running (25%), biking (13%), fitness (12%), aquatics/swimming (10%), ice hockey and golfing (8% each). However, some of study participants indicated that community does not have enough recreation facilities and cost of participation is high. When asked about activity they would like to try, 7 activities appeared most often: boating/kayaking/canoeing (25%), camping/backpacking/hiking (15%), skiing (10%), arts and cultural activities (10%), fitness (9%), hockey (8%) and broomball (7%).
About 40% of respondents said they volunteer at recreation activities; 30% do social volunteering and 20% engage in community events. Sixty percent said they don’t have any time to volunteer, or don’t want to, and twenty-five percent don’t have any information of volunteering activities. Overall, there is quite a positive feeling about recreation and the community. However, there is a need to raise community awareness of importance of recreation to the quality of life, maintain existing facilities and develop inclusive recreation programs.
Building Healthy Communities in the NWT Report World Leisure Professional Services http://www.worldleisure.org
70
REFERENCES
1. Hutchinson, P. and Nogradi, G. (1996). The concept and nature of community development in recreation and leisure services. Journal of Applied Recreation Research, 21(2):93-130.
2. Mitra, A. and Lankford, S. (1999). Research methods in park, recreation, and leisure services. Sagamore Publishing, IL.
3. NWT Bureau of Statistics (2002). Community Population Estimates by Ethnicity. 4. NWT Bureau of Statistics (2002). Community Population Estimates by Gender. 5. NWT Bureau of Statistics (2002). Community Population Estimates by Community Age
Group. 6. Pedlar, A. (1996). Community development: what does it mean for recreation and
leisure? Journal of Applied Recreation Research, 21(1):5-23.
Building Healthy Communities in the NWT Report World Leisure Professional Services http://www.worldleisure.org
71

APPENDIXES
APPENDIX 1. COMPREHENSIVE SURVEY
Building Healthy Communities in the NWT Report World Leisure Professional Services http://www.worldleisure.org
72

Building Healthy Communities in the NWT Report World Leisure Professional Services http://www.worldleisure.org
73

Building Healthy Communities in the NWT Report World Leisure Professional Services http://www.worldleisure.org
74

Building Healthy Communities in the NWT Report World Leisure Professional Services http://www.worldleisure.org
75

Building Healthy Communities in the NWT Report World Leisure Professional Services http://www.worldleisure.org
76

Building Healthy Communities in the NWT Report World Leisure Professional Services http://www.worldleisure.org
77

Building Healthy Communities in the NWT Report World Leisure Professional Services http://www.worldleisure.org
78

APPENDIX 2. LISTING OF FAVORITE RECREATION ACTIVITIES
Badminton Outdoors Baseball Paintball
Basketball Ping Pong Bingo Reading
Boating Rock Climbing Cards Running
Cross Country Skiing Skating Cultural Events Skiing
Curling Snowmobiling Cycling Soccer Dancing Sports
Dog Mushing Swimming Drinking Television Exercise Tennis Fastball Track and Field Fishing Traveling Fitness Video Games
Floor Hockey Volleyball Golf Walking
Gymnastics Water Skiing Hiking Weight Lifting Hunting Work
Ice Hockey Yoga Ice Skating
Building Healthy Communities in the NWT Report World Leisure Professional Services http://www.worldleisure.org
79

APPENDIX 3. LISTING OF GENERAL RECREATION ACTIVITIES
Arctic Sports Diving Art Dodge Ball
Backpacking Dog Mushing Badminton Dog Sledding Baseball Drumming
Basketball Fastball Biking Festivals Boating Field Hockey Bowling Fishing Boxing Fitness
Broomball Floor Hockey Bungee Jumping Flying Cadet Program Fly Fishing
Camping Football Canada Day Gardening
Canoeing Girl Guides Carnivals Guide Programs Classes Gymnastics
Computer Hang Gliding Crafts Hiking
Cross Country Skiing Horse Back Riding Cub Scouts Hunting
Cultural Festivals Ice Climbing Dancing Ice Hockey
Building Healthy Communities in the NWT Report World Leisure Professional Services http://www.worldleisure.org
80
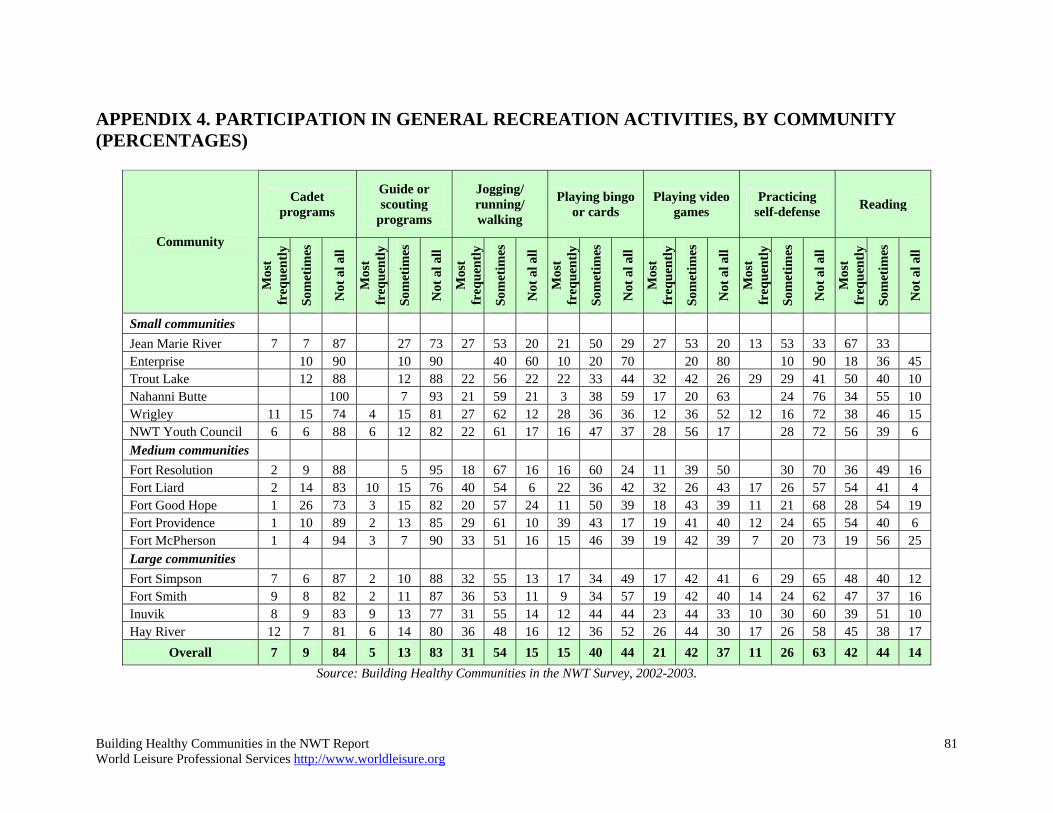
APPENDIX 4. PARTICIPATION IN GENERAL RECREATION ACTIVITIES, BY COMMUNITY (PERCENTAGES)
Cadet programs
Guide or scouting
programs
Jogging/ running/ walking
Playing bingo or cards
Playing video games
Practicing self-defense Reading
Community
Mos
t fr
eque
ntly
Som
etim
es
Not
al a
ll
Mos
t fr
eque
ntly
Som
etim
es
Not
al a
ll
Mos
t fr
eque
ntly
Som
etim
es
Not
al a
ll
Mos
t fr
eque
ntly
Som
etim
es
Not
al a
ll
Mos
t fr
eque
ntly
Som
etim
es
Not
al a
ll
Mos
t fr
eque
ntly
Som
etim
es
Not
al a
ll
Mos
t fr
eque
ntly
Som
etim
es
Not
al a
ll
Small communities Jean Marie River 7 7 87 27 73 27 53 20 21 50 29 27 53 20 13 53 33 67 33Enterprise 10 90 10 90 40 60 10 20 70 20 80 10 90 18 36 45Trout Lake 2 12 88 12 88 2 56 22 22 33 44 32 42 26 29 29 41 50 40 10Nahanni Butte 100 7 93 21 59 21 3 38 59 17 20 63 24 76 34 55 10Wrigley 11 15 74 4 15 81 27 62 12 28 36 36 12 36 52 12 16 72 38 46 15NWT Youth Council 6 6 88 6 12 82 22 61 17 16 47 37 28 56 17 28 72 56 39 6Medium communities Fort Resolution 2 9 88 5 95 18 67 16 16 60 24 11 39 50 30 70 36 49 16Fort Liard 2 14 83 10 15 76 40 54 6 22 36 42 32 26 43 17 26 57 54 41 4Fort Good Hope 1 26 73 3 15 82 20 57 24 11 50 39 18 43 39 11 21 68 28 54 19 Fort Providence 1 10 89 2 13 85 29 61 10 39 43 17 19 41 40 12 24 65 54 40 6Fort McPherson 1 4 94 3 7 90 33 51 16 15 46 39 19 42 39 7 20 73 19 56 25Large communities Fort Simpson 7 6 87 2 10 88 32 55 13 17 34 49 17 42 41 6 29 65 48 40 12Fort Smith 9 8 82 2 11 87 36 53 11 9 34 57 19 42 40 14 24 62 47 37 16Inuvik 8 9 83 9 13 77 31 55 14 12 44 44 23 44 33 10 30 60 39 51 10Hay River 12 7 81 6 14 80 36 48 16 12 36 52 26 44 30 17 26 58 45 38 17
Overall 7 9 84 5 13 83 31 54 15 15 40 44 21 42 37 11 26 63 42 44 14 Source: Building Healthy Communities in the NWT Survey, 2002-2003.
Building Healthy Communities in the NWT Report World Leisure Professional Services http://www.worldleisure.org
81

PARTICIPATION IN GENERAL RECREATION ACTIVITIES, BY COMMUNITY (PERCENTAGES), CONT.
Spending time with friends/ family
Taking a class at a
community center
Using a computer/ Internet
Visiting elders
Volunteering time for my community
Watching television
Watching videos
Community M
ost
freq
uent
ly
Som
etim
es
Not
al a
ll
Mos
t fr
eque
ntly
Som
etim
es
Not
al a
ll
Mos
t fr
eque
ntly
Som
etim
es
Not
al a
ll
Mos
t fr
eque
ntly
Som
etim
es
Not
al a
ll
Mos
t fr
eque
ntly
Som
etim
es
Not
al a
ll
Mos
t fr
eque
ntly
Som
etim
es
Not
al a
ll
Mos
t fr
eque
ntly
Som
etim
es
Not
al a
ll
Small communities Jean Marie River 57 36 7 20 67 13 27 47 27 36 64 21 64 14 36 57 7 27 73 Enterprise 9 45 45 20 80 20 80 9 27 64 10 20 70 10 30 60 40 60Trout Lake 65 30 5 21 26 53 30 55 15 21 63 16 20 60 20 55 30 15 55 30 15Nahanni Butte 74 22 4 4 21 75 15 35 50 33 44 22 28 45 28 30 63 7 32 46 21Wrigley 54 42 4 8 31 62 23 46 31 23 65 12 19 50 31 28 60 12 31 42 27NWT Youth Council 72 22 6 17 28 56 39 44 17 28 50 22 28 50 22 50 44 6 44 50 6Medium communities Fort Resolution 60 31 9 9 32 59 30 55 16 19 63 19 27 43 30 31 60 9 27 49 24Fort Liard 60 36 4 15 28 57 48 38 15 15 56 29 23 40 38 35 48 17 40 47 13Fort Good Hope 54 36 10 8 24 69 24 42 35 22 49 29 12 50 38 37 52 10 33 52 15Fort Providence 64 29 7 6 31 63 34 41 25 22 56 21 17 51 32 33 61 5 26 60 15Fort McPherson 59 30 11 15 21 64 22 49 29 15 51 33 15 29 56 38 58 4 28 56 17Large communities Fort Simpson 61 29 10 7 27 66 38 42 20 10 45 45 16 49 34 33 57 10 23 60 17Fort Smith 63 28 9 10 33 56 46 44 10 7 40 53 14 43 43 35 55 10 33 56 12Inuvik 65 28 7 10 32 58 39 46 15 15 52 33 12 50 37 39 51 9 32 57 11Hay River 70 25 6 12 23 65 48 40 12 12 41 47 16 46 38 44 51 5 40 54 7
Overall 64 29 8 10 28 62 38 43 19 15 48 37 16 47 37 38 54 9 32 55 13 Source: Building Healthy Communities in the NWT Survey, 2002-2003.
Building Healthy Communities in the NWT Report World Leisure Professional Services http://www.worldleisure.org
82

APPENDIX 5. PARTICIPATION IN CULTURAL, ART OR DRAMA ACTIVITIES, BY COMMUNITY (PERCENTAGES)
Attending a concert or
play
Beading, quill working, tufting
Carving or painting Crafts Dancing
Community M
ost
freq
uent
ly
Som
etim
es
Not
at a
ll
Mos
t fr
eque
ntly
Som
etim
es
Not
at a
ll
Mos
t fr
eque
ntly
Som
etim
es
Not
at a
ll
Mos
t fr
eque
ntly
Som
etim
es
Not
at a
ll
Mos
t fr
eque
ntly
Som
etim
es
Not
at a
ll
Small communities Jean Marie River 27 53 20 20 53 27 7 60 33 21 64 14 27 67 7 Enterprise 10 10 80 10 90 10 10 80 10 30 60 10 30 60 Trout Lake 11 50 39 32 37 32 16 32 53 33 44 22 18 35 47 Nahanni Butte 3 55 41 14 29 57 7 21 72 10 40 50 17 31 52 Wrigley 15 27 58 20 36 44 12 24 64 12 36 52 16 48 36 NWT Youth Council 12 59 29 11 28 61 39 61 17 39 44 22 56 22 Medium communities Fort Resolution 7 42 51 14 23 64 2 40 58 11 48 41 21 43 36 Fort Liard 16 40 44 21 40 40 13 46 41 17 46 38 18 41 41 Fort Good Hope 7 51 42 8 39 53 4 37 60 10 40 50 8 45 47 Fort Providence 11 49 40 12 41 47 9 30 61 13 61 26 19 55 26 Fort McPherson 10 38 52 11 26 63 9 19 73 15 41 44 13 31 57 Large communities Fort Simpson 6 50 45 4 23 73 5 23 72 12 41 47 8 47 45 Fort Smith 8 57 35 4 20 76 7 23 70 10 36 54 16 41 43 Inuvik 11 49 40 9 33 59 6 27 66 14 47 39 16 40 44 Hay River 9 48 43 4 21 75 6 32 61 10 45 46 12 40 48
Overall 9 48 43 8 28 64 7 29 64 12 45 43 13 43 44 Source: Building Healthy Communities in the NWT Survey, 2002-2003.
Building Healthy Communities in the NWT Report World Leisure Professional Services http://www.worldleisure.org
83

PARTICIPATION IN CULTURAL, ART OR DRAMA ACTIVITIES, BY COMMUNITY (PERCENTAGES), CONT.
Drumming Participating in a dramatic
play
Playing a musical
instrument Quilting
Community
Mos
t fr
eque
ntly
Som
etim
es
Not
at a
ll
Mos
t fr
eque
ntly
Som
etim
es
Not
at a
ll
Mos
t fr
eque
ntly
Som
etim
es
Not
at a
ll
Mos
t fr
eque
ntly
Som
etim
es
Not
at a
ll
Small communities Jean Marie River 20 33 47 13 7 80 20 20 60 13 33 53 Enterprise 10 90 10 90 10 10 80 10 90 Trout Lake 12 18 71 24 76 18 24 59 6 22 72 Nahanni Butte 3 3 93 3 3 93 4 4 93 4 11 86 Wrigley 16 12 72 4 24 72 16 20 64 8 29 63 NWT Youth Council 28 33 39 6 17 78 6 28 67 17 83 Medium communities Fort Resolution 9 36 55 2 14 84 7 21 72 12 88 Fort Liard 14 33 53 9 13 79 9 30 62 7 20 74 Fort Good Hope 11 30 59 6 15 80 7 22 71 3 17 80 Fort Providence 5 32 63 3 12 85 15 20 65 1 17 82 Fort McPherson 3 8 89 6 13 82 8 19 72 3 10 87 Large communities Fort Simpson 2 16 82 1 14 85 6 23 71 2 11 87 Fort Smith 6 13 81 2 13 84 20 35 45 5 11 84 Inuvik 6 16 78 3 17 80 10 28 62 3 15 82 Hay River 4 13 82 8 19 74 17 28 54 5 10 84
Overall 6 18 76 4 15 80 12 25 63 4 13 83 Source: Building Healthy Communities in the NWT Survey, 2002-2003.
Building Healthy Communities in the NWT Report World Leisure Professional Services http://www.worldleisure.org
84

APPENDIX 6. FACTOR ANALYSIS OF LEISURE BENEFITS
Leisure benefits Factor coefficient
Factor 1. Interaction within community
Makes me want to be a role model for others 0.807
Makes me want to volunteer in my community 0.798
Helps me work with others in my community 0.776
Makes me want to do better at school or work 0.774
Gives me leadership skills 0.762
Helps me solve problems 0.754
Provides understanding of other people 0.672
Factor 2. Personal development
Provides a physical challenge 0.828
A chance to meet new people 0.733
Provides mental stimulation 0.730
To have fun 0.698 Source: Building Healthy Communities in the NWT Survey, 2002-2003.
Building Healthy Communities in the NWT Report World Leisure Professional Services http://www.worldleisure.org
85

APPENDIX 7. FACTOR ANALYSIS OF LEISURE CONSTRAINTS
Leisure constraints Factor coefficient
Factor 1. Social/physical issues and constraints
I don’t have the physical abilities 0.846
I am physically unable to participate 0.800
I don’t have artistic or creative abilities 0.752
My friends or family don’t want me to go 0.736
I don’t have transportation 0.716
I am shy about participating in public 0.680
Factor 2. Personal issues and constraints
The price of recreation/sports equipment 0.752
Don’t know where to participate in the activity 0.746
Cost for recreation programs are too high 0.733
I don’t know where I can learn the skills 0.673
No one to go with 0.666
No program near my home 0.646
I don’t have child care available 0.553
Works/school commitments 0.525
Factor 3. Program issues and constraints
I don’t have any program information 0.768
Programs are not interesting 0.753
The program is too long each day I go there 0.746
Programs not offered on the right day or time for me 0.737
There isn’t anything for my family 0.730
I don’t like the instructor/coach 0.721 Source: Building Healthy Communities in the NWT Survey, 2002-2003.
Building Healthy Communities in the NWT Report World Leisure Professional Services http://www.worldleisure.org
86

APPENDIX 8. FACTOR ANALYSIS OF THOUGHTS REGARDING COMMUNITIES
Thoughts regarding communities Factor coefficient
Factor 1. Positive community thoughts
This community is an ideal place to live because of recreation 0.853 I am satisfied with the quality of life in this community 0.805 The future of the community looks positive 0.788 There is an adequate number of recreation opportunities here in this community 0.687
People of this community continually look for new solutions to problems 0.676
The community has good leaders 0.671 Factor 2. Negative community thoughts Not much can be said in favor of this community 0.861 People will not work together to get things done 0.822 Factor 3. Impacts and benefits of recreation There are opportunities for participating in volunteer activities in this community 0.796
Recreation offers ways to be with friends and relatives 0.776 I feel I can volunteer in this community 0.757 Being in recreation programs allow me to have input into community decisions 0.735
Recreation is one of the most important services here 0.732 Recreation helps make this a good place to live 0.617
Source: Building Healthy Communities in the NWT Survey, 2002-2003.
Building Healthy Communities in the NWT Report World Leisure Professional Services http://www.worldleisure.org
87