Embed Size (px)
Citation preview
Northwest Power and ConservationCouncil
Slide 1
Accelerating Energy Efficiency Accelerating Energy Efficiency
To Reduce the PNW Power To Reduce the PNW Power System's Carbon Footprint System's Carbon Footprint
Tom EckmanTom EckmanManager, Conservation ResourcesManager, Conservation Resources
Northwest Power and Conservation CouncilNorthwest Power and Conservation Council
Presented at Presented at Affordable Comfort NorthwestAffordable Comfort Northwest
February 3, 2009February 3, 2009
slide 2
Northwest Power and ConservationCouncil
Slide 2
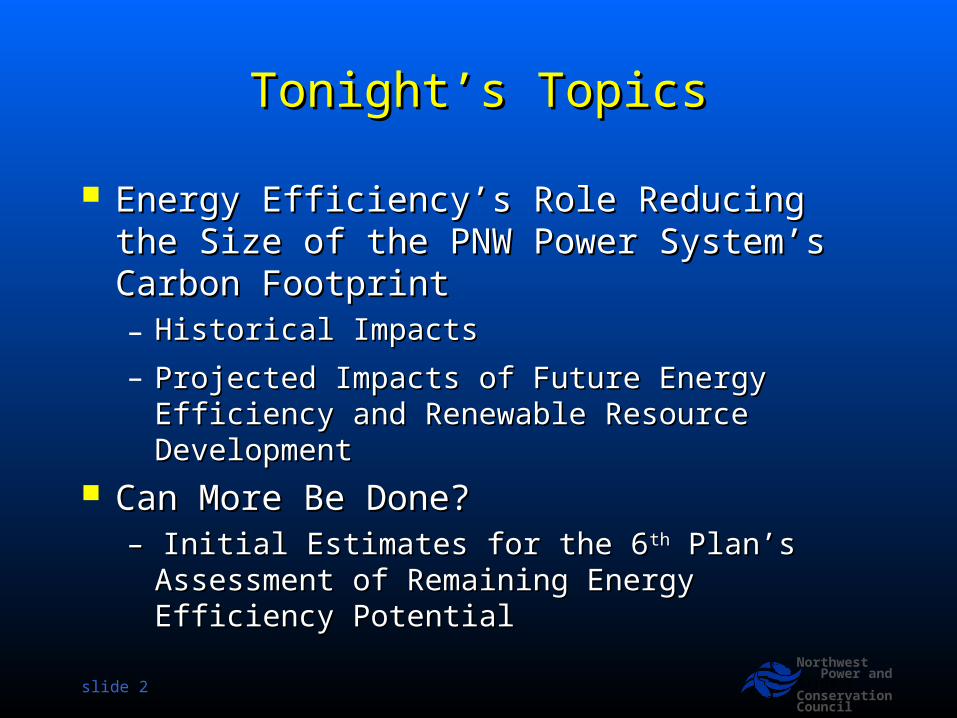
Tonight’s TopicsTonight’s Topics
Energy Efficiency’s Role Reducing the Size of Energy Efficiency’s Role Reducing the Size of the PNW Power System’s Carbon Footprint the PNW Power System’s Carbon Footprint – Historical ImpactsHistorical Impacts
– Projected Impacts of Future Energy Efficiency and Projected Impacts of Future Energy Efficiency and Renewable Resource Development Renewable Resource Development
Can More Be Done?Can More Be Done?– – Initial Estimates for the 6Initial Estimates for the 6thth Plan’s Assessment of Plan’s Assessment of
Remaining Energy Efficiency PotentialRemaining Energy Efficiency Potential
slide 3
Northwest Power and ConservationCouncil
Slide 3
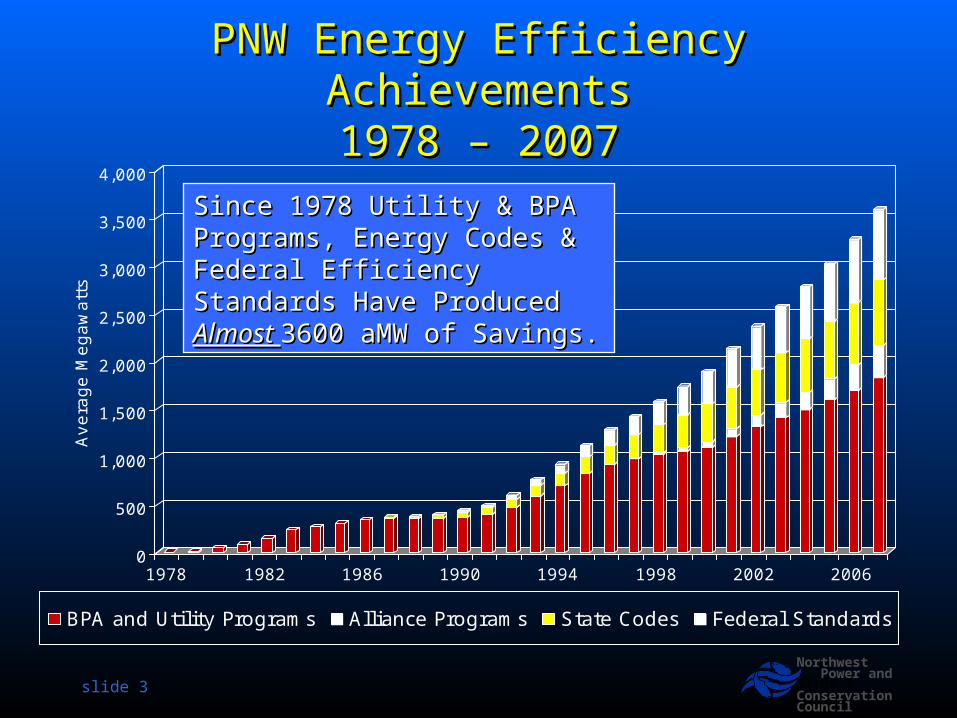
PNW Energy Efficiency PNW Energy Efficiency AchievementsAchievements1978 – 20071978 – 2007
0
500
1,000
1,500
2,000
2,500
3,000
3,500
4,000
Avera
ge M
egaw
att
s
1978 1982 1986 1990 1994 1998 2002 2006
BPA and Utility Programs Alliance Programs State Codes Federal Standards
Since 1978 Utility & BPA Since 1978 Utility & BPA Programs, Energy Codes & Programs, Energy Codes & Federal Efficiency Standards Have Federal Efficiency Standards Have Produced Produced Almost Almost 3600 aMW of 3600 aMW of Savings.Savings.
slide 4
Northwest Power and ConservationCouncil
Slide 4
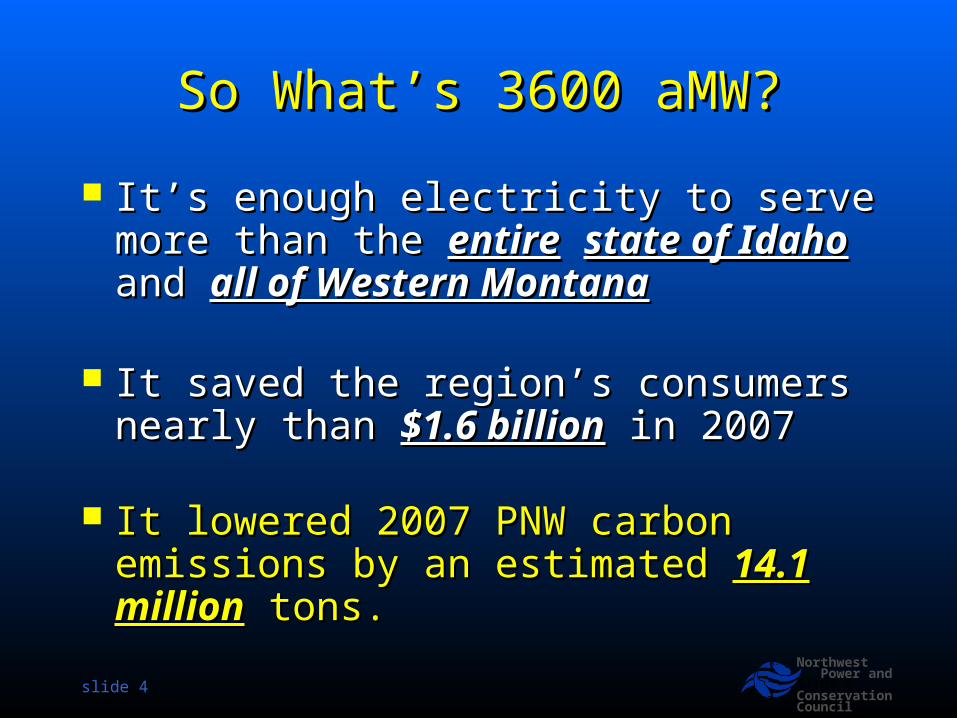
So What’s 3600 aMW?So What’s 3600 aMW?
It’s enough electricity to serve more It’s enough electricity to serve more than the than the entireentire state of Idahostate of Idaho and and all all of Western Montanaof Western Montana
It saved the region’s consumers nearly It saved the region’s consumers nearly than than $1.6 billion$1.6 billion in 2007 in 2007
It lowered 2007 PNW carbon emissions It lowered 2007 PNW carbon emissions by an estimated by an estimated 14.1 million14.1 million tons. tons.
slide 5
Northwest Power and ConservationCouncil
Slide 5
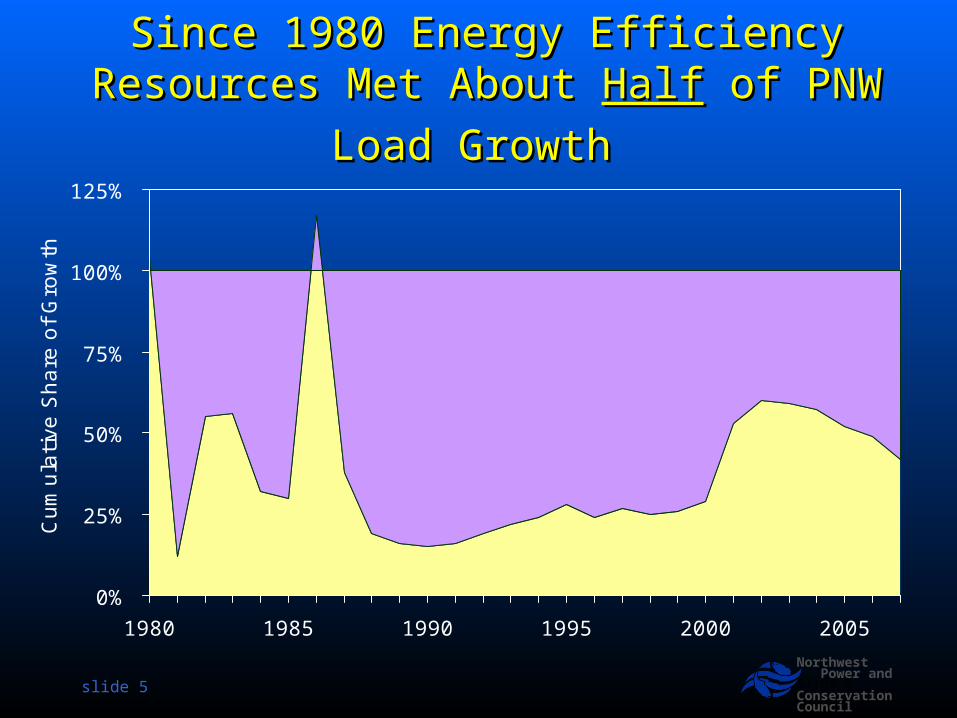
Since 1980 Energy Efficiency Resources Since 1980 Energy Efficiency Resources
Met About Met About HalfHalf of PNW Load Growth of PNW Load Growth
0%
25%
50%
75%
100%
125%
1980 1985 1990 1995 2000 2005
Cum
ula
tive
Share
of
Gro
wth
slide 6
Northwest Power and ConservationCouncil
Slide 6
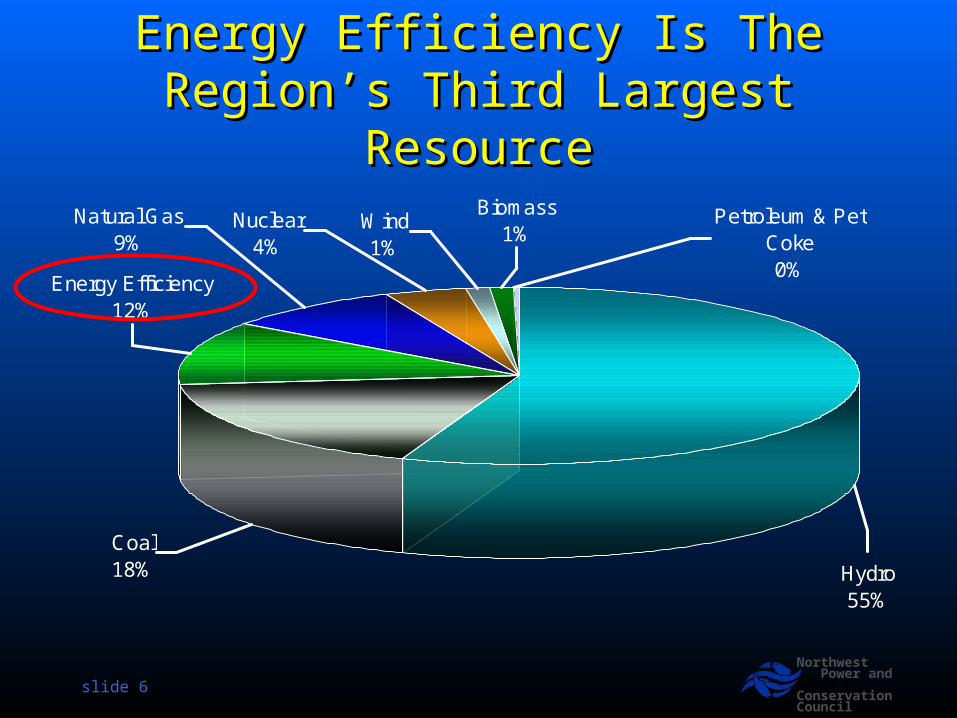
Energy Efficiency Is The Region’s Energy Efficiency Is The Region’s Third Largest ResourceThird Largest Resource
Energy Efficiency12%
Hydro55%
Coal18%
Biomass1%
Wind1%
Nuclear4%
Natural Gas9%
Petroleum & Pet Coke0%
slide 7
Northwest Power and ConservationCouncil
Slide 7
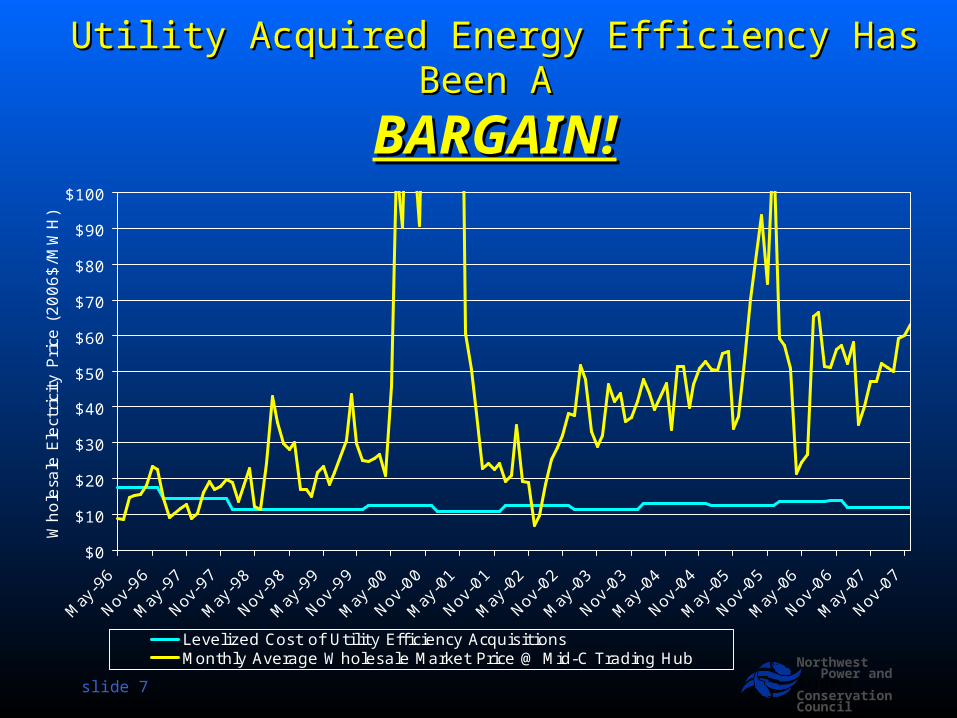
Utility Acquired Energy Efficiency Has Been AUtility Acquired Energy Efficiency Has Been A
BARGAIN!BARGAIN!
$0
$10
$20
$30
$40
$50
$60
$70
$80
$90
$100
May
-96
Nov-9
6
May
-97
Nov-9
7
May
-98
Nov-9
8
May
-99
Nov-9
9
May
-00
Nov-0
0
May
-01
Nov-0
1
May
-02
Nov-0
2
May
-03
Nov-0
3
May
-04
Nov-0
4
May
-05
Nov-0
5
May
-06
Nov-0
6
May
-07
Nov-0
7
Whole
sale
Ele
ctri
city
Pri
ce (
2006$/M
WH
)
Levelized Cost of Utility Efficiency AcquisitionsMonthly Average Wholesale Market Price @ Mid-C Trading Hub
slide 8
Northwest Power and ConservationCouncil
Slide 8
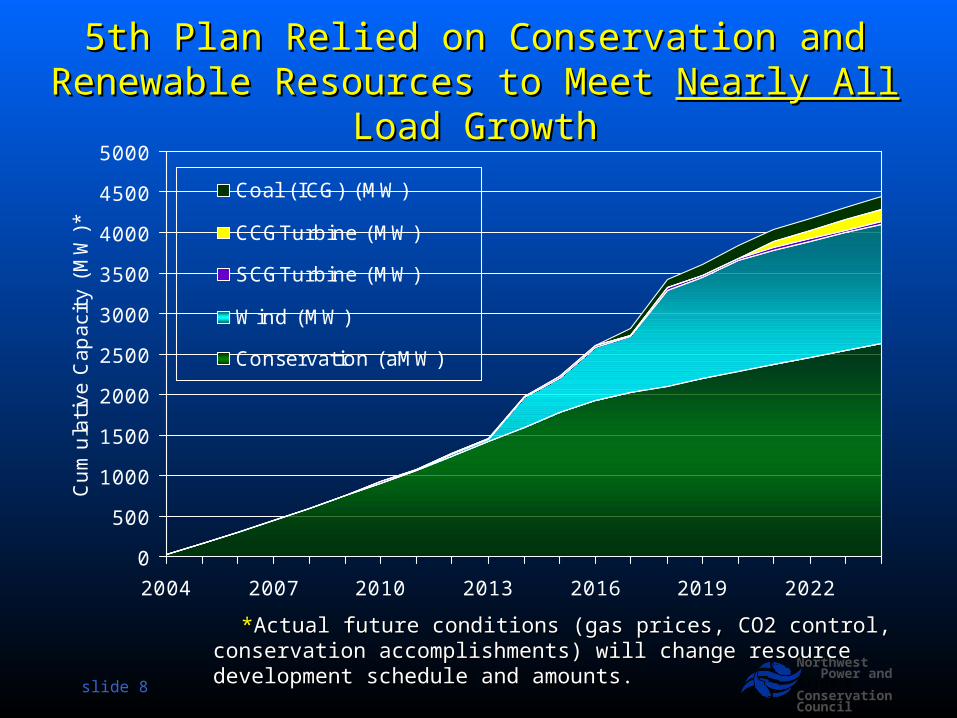
5th Plan Relied on Conservation and Renewable 5th Plan Relied on Conservation and Renewable Resources to Meet Resources to Meet Nearly AllNearly All Load Growth Load Growth
0
500
1000
1500
2000
2500
3000
3500
4000
4500
5000
2004 2007 2010 2013 2016 2019 2022
Cum
ula
tive
Cap
acit
y (M
W)*
Coal (ICG) (MW)
CCGTurbine (MW)
SCGTurbine (MW)
Wind (MW)
Conservation (aMW)
**Actual future conditions (gas prices, CO2 control, conservation Actual future conditions (gas prices, CO2 control, conservation accomplishments) will change resource development schedule and amounts.accomplishments) will change resource development schedule and amounts.
slide 9
Northwest Power and ConservationCouncil
Slide 9
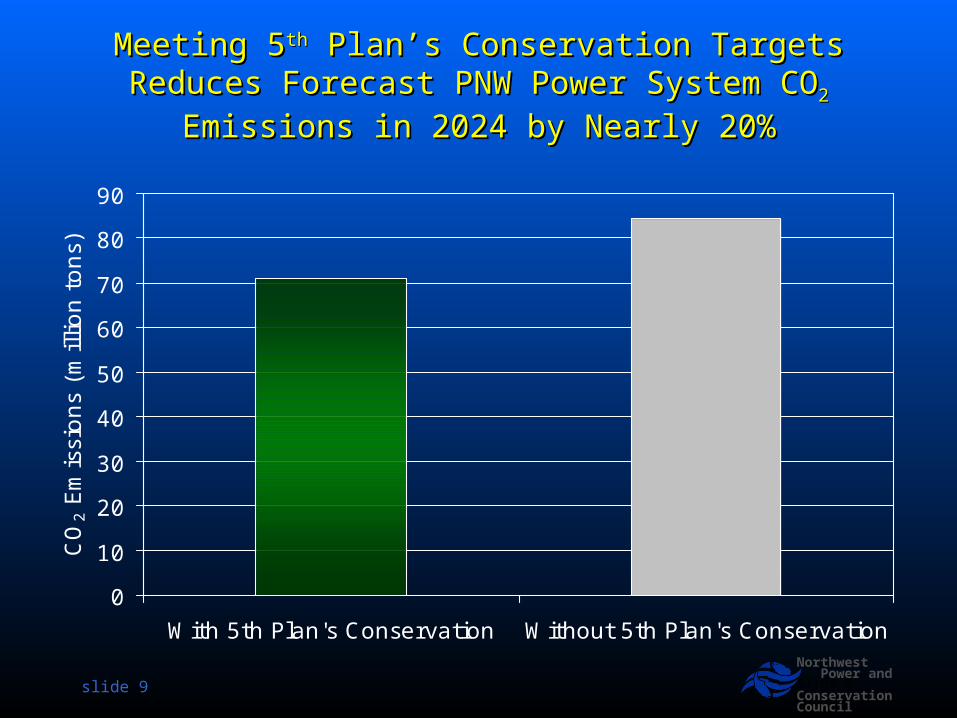
Meeting 5Meeting 5thth Plan’s Conservation Targets Reduces Plan’s Conservation Targets Reduces Forecast PNW Power System COForecast PNW Power System CO2 2 Emissions in 2024 by Emissions in 2024 by
Nearly 20%Nearly 20%
0
10
20
30
40
50
60
70
80
90
With 5th Plan's Conservation Without 5th Plan's Conservation
CO
2 E
mis
sions
(mill
ion t
ons)

slide 10
Northwest Power and ConservationCouncil
Slide 10
Why Worry?Why Worry?
slide 11
Northwest Power and ConservationCouncil
Slide 11
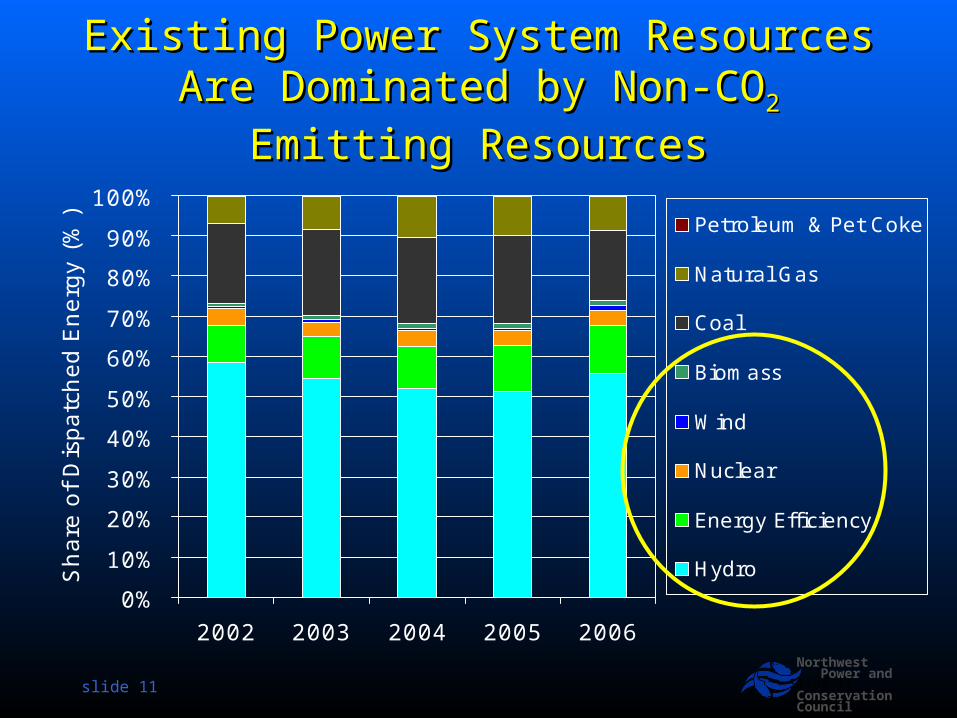
Existing Power System Resources Existing Power System Resources Are Dominated by Non-COAre Dominated by Non-CO2 2 Emitting Emitting
ResourcesResources
0%
10%
20%
30%
40%
50%
60%
70%
80%
90%
100%
2002 2003 2004 2005 2006
Sh
are
of
Dis
patc
hed E
nerg
y (
%)
Petroleum & Pet Coke
Natural Gas
Coal
Biomass
Wind
Nuclear
Energy Efficiency
Hydro
slide 12
Northwest Power and ConservationCouncil
Slide 12
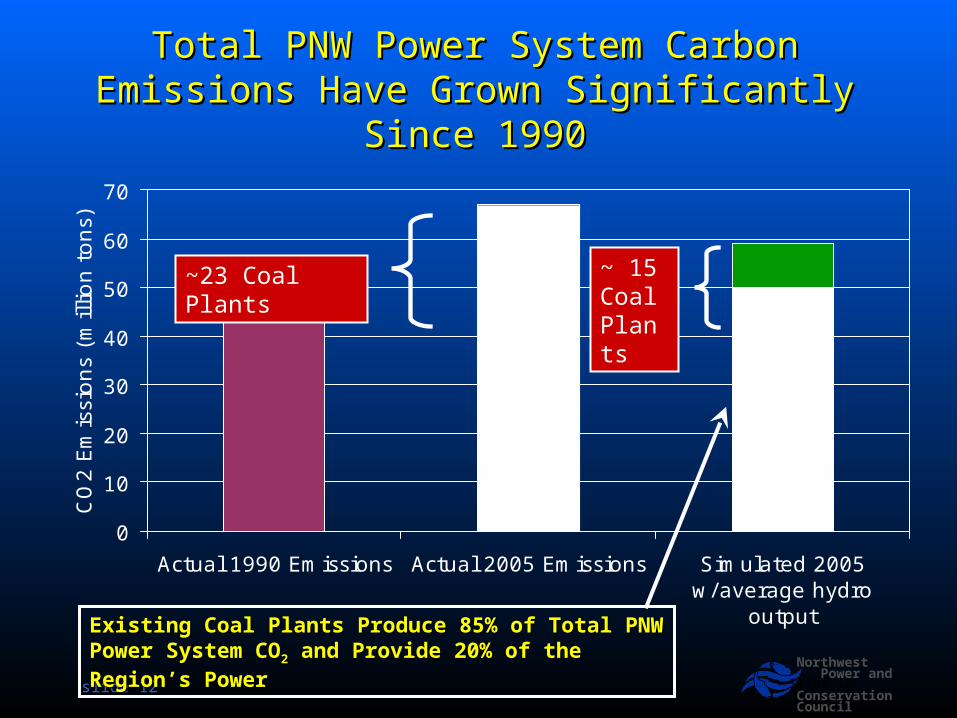
Total PNW Power System Carbon Emissions Total PNW Power System Carbon Emissions Have Grown Significantly Since 1990Have Grown Significantly Since 1990
0
10
20
30
40
50
60
70
Actual 1990 Emissions Actual 2005 Emissions Simulated 2005w/average hydro
output
CO
2 E
mis
sions
(mill
ion t
ons)
~ 15 Coal Plants
~23 Coal Plants
Existing Coal Plants Produce 85% of Total PNW Power Existing Coal Plants Produce 85% of Total PNW Power System COSystem CO22 and Provide 20% of the Region’s Power and Provide 20% of the Region’s Power
slide 13
Northwest Power and ConservationCouncil
Slide 13
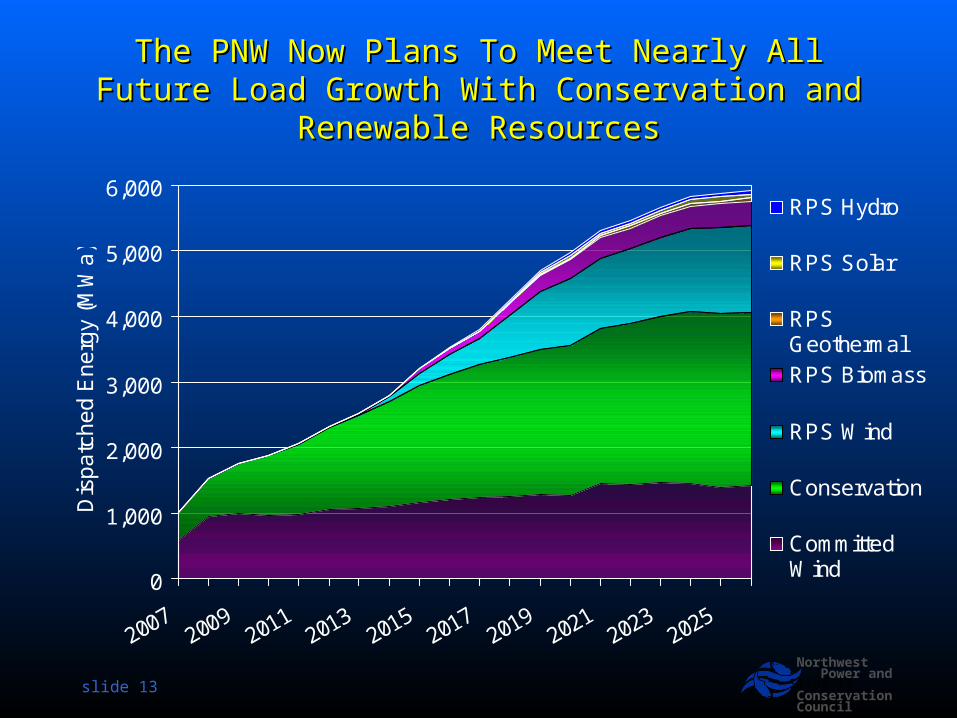
The PNW Now Plans To Meet Nearly All Future The PNW Now Plans To Meet Nearly All Future Load Growth With Conservation and Renewable Load Growth With Conservation and Renewable
ResourcesResources
0
1,000
2,000
3,000
4,000
5,000
6,000
20072009
20112013
20152017
20192021
20232025
Dis
pa
tch
ed
En
erg
y (M
Wa
)
RPS Hydro
RPS Solar
RPSGeothermalRPS Biomass
RPS Wind
Conservation
CommittedWind
slide 14
Northwest Power and ConservationCouncil
Slide 14
How Will This Impact the Power How Will This Impact the Power System’s Carbon Footprint?System’s Carbon Footprint?
slide 15
Northwest Power and ConservationCouncil
Slide 15
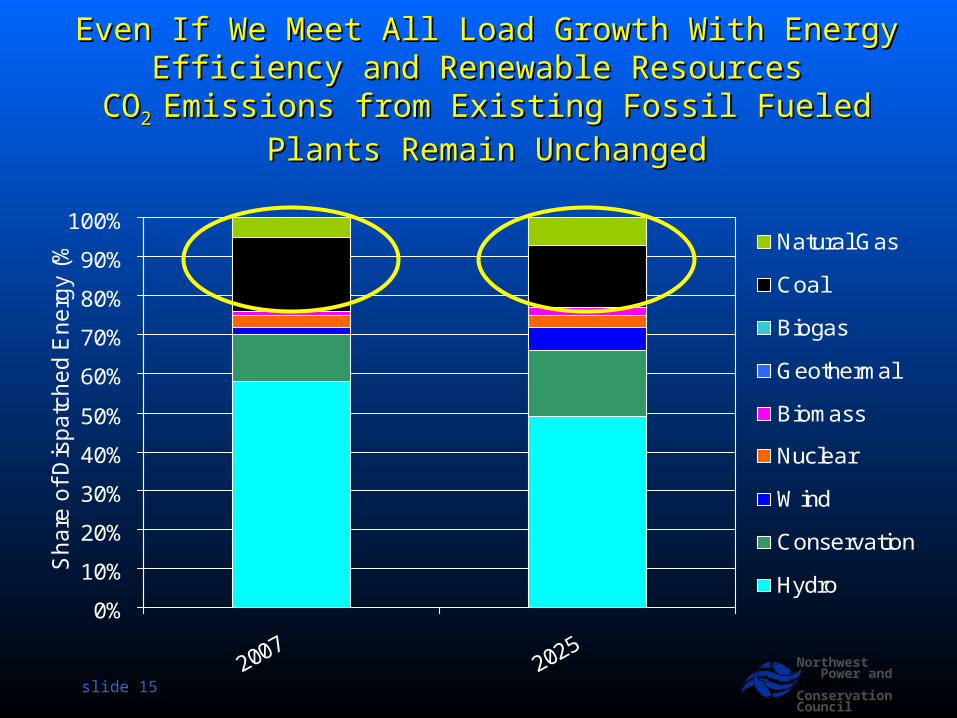
Even If We Meet All Load Growth With Energy Even If We Meet All Load Growth With Energy Efficiency and Renewable Resources Efficiency and Renewable Resources
COCO2 2 Emissions from Existing Fossil Fueled Plants Emissions from Existing Fossil Fueled Plants Remain UnchangedRemain Unchanged
0%
10%
20%
30%
40%
50%
60%
70%
80%
90%
100%
Sh
are
of
Dis
pa
tch
ed
En
erg
y (%
) Natural Gas
Coal
Biogas
Geothermal
Biomass
Nuclear
Wind
Conservation
Hydro
slide 16
Northwest Power and ConservationCouncil
Slide 16
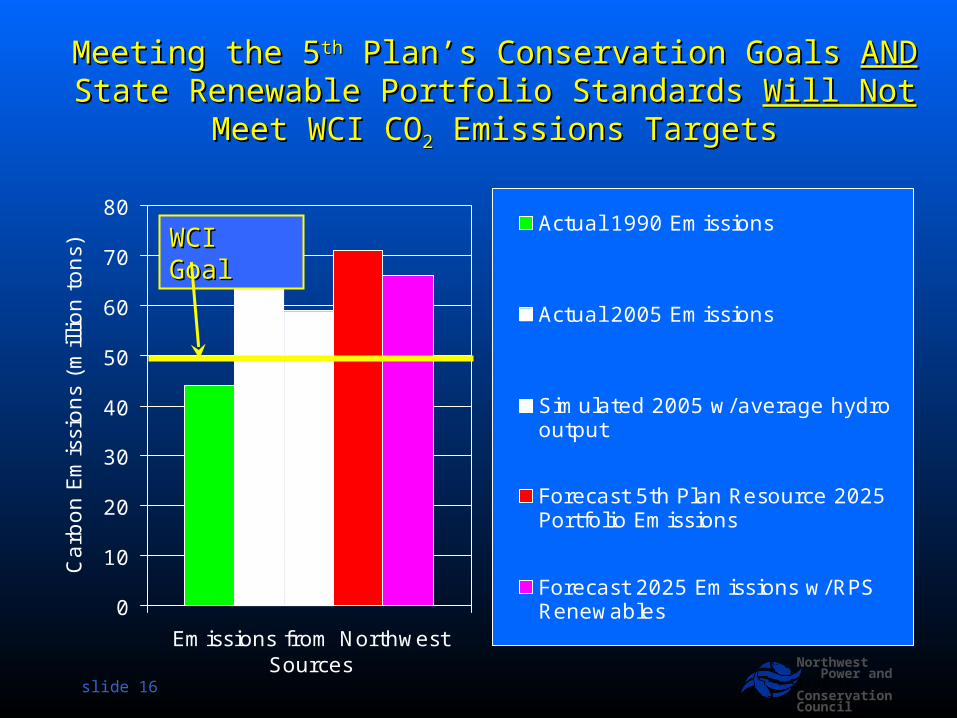
Meeting the 5Meeting the 5thth Plan’s Conservation Goals Plan’s Conservation Goals ANDAND State State Renewable Portfolio Standards Renewable Portfolio Standards Will NotWill Not Meet WCI CO Meet WCI CO22
Emissions TargetsEmissions Targets
0
10
20
30
40
50
60
70
80
Emissions from NorthwestSources
Carb
on E
mis
sions
(mill
ion t
ons)
Actual 1990 Emissions
Actual 2005 Emissions
Simulated 2005 w/average hydrooutput
Forecast 5th Plan Resource 2025Portfolio Emissions
Forecast 2025 Emissions w/RPSRenewables
WCI GoalWCI Goal

OK, So What’s The Answer?
slide 18
Northwest Power and ConservationCouncil
Slide 18
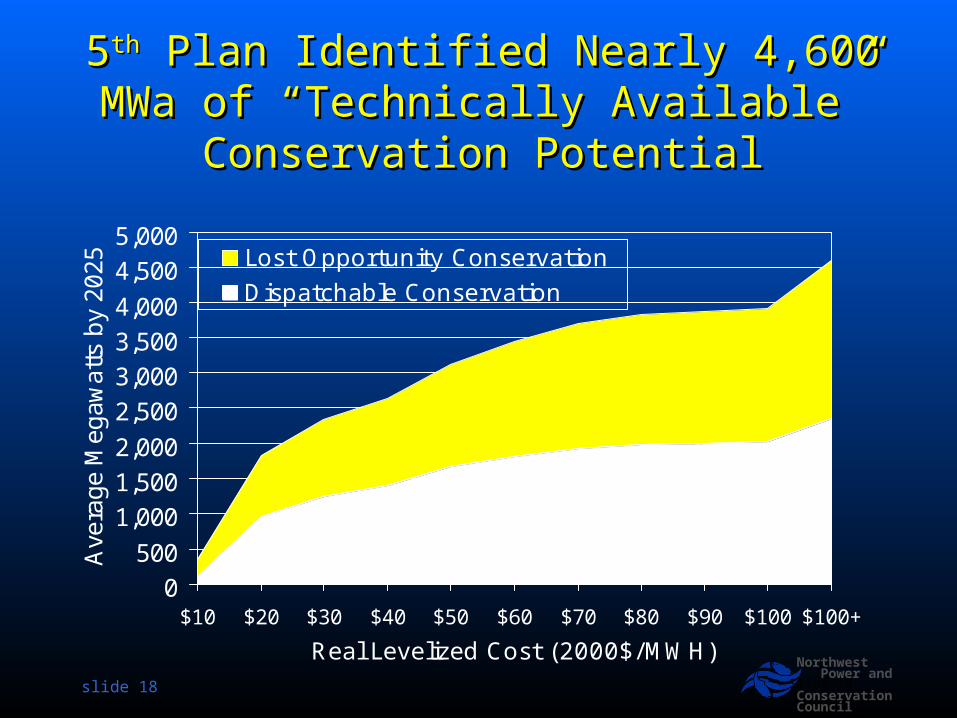
55thth Plan Identified Nearly 4,600 MWa Plan Identified Nearly 4,600 MWa of “Technically Available” of “Technically Available”
Conservation PotentialConservation Potential
0
500
1,000
1,500
2,000
2,500
3,000
3,500
4,000
4,500
5,000
$10 $20 $30 $40 $50 $60 $70 $80 $90 $100 $100+
Real Levelized Cost (2000$/MWH)
Ave
rag
e M
eg
aw
att
s b
y 2
02
5 Lost Opportunity Conservation
Dispatchable Conservation
slide 19
Northwest Power and ConservationCouncil
Slide 19
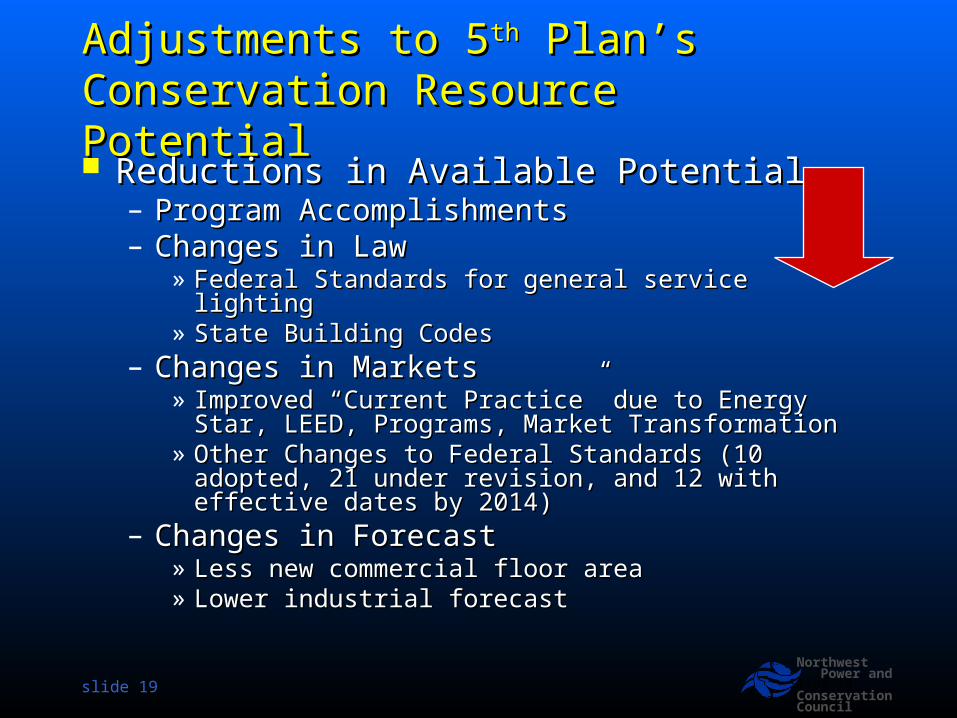
Adjustments to 5Adjustments to 5thth Plan’s Plan’s Conservation Resource PotentialConservation Resource Potential Reductions in Available PotentialReductions in Available Potential
– Program AccomplishmentsProgram Accomplishments– Changes in Law Changes in Law
» Federal Standards for general service lightingFederal Standards for general service lighting» State Building CodesState Building Codes
– Changes in MarketsChanges in Markets» Improved “Current Practice” due to Energy Star, LEED, Improved “Current Practice” due to Energy Star, LEED,
Programs, Market TransformationPrograms, Market Transformation» Other Changes to Federal Standards (10 adopted, 21 Other Changes to Federal Standards (10 adopted, 21
under revision, and 12 with effective dates by 2014)under revision, and 12 with effective dates by 2014)– Changes in ForecastChanges in Forecast
» Less new commercial floor areaLess new commercial floor area» Lower industrial forecastLower industrial forecast
slide 20
Northwest Power and ConservationCouncil
Slide 20
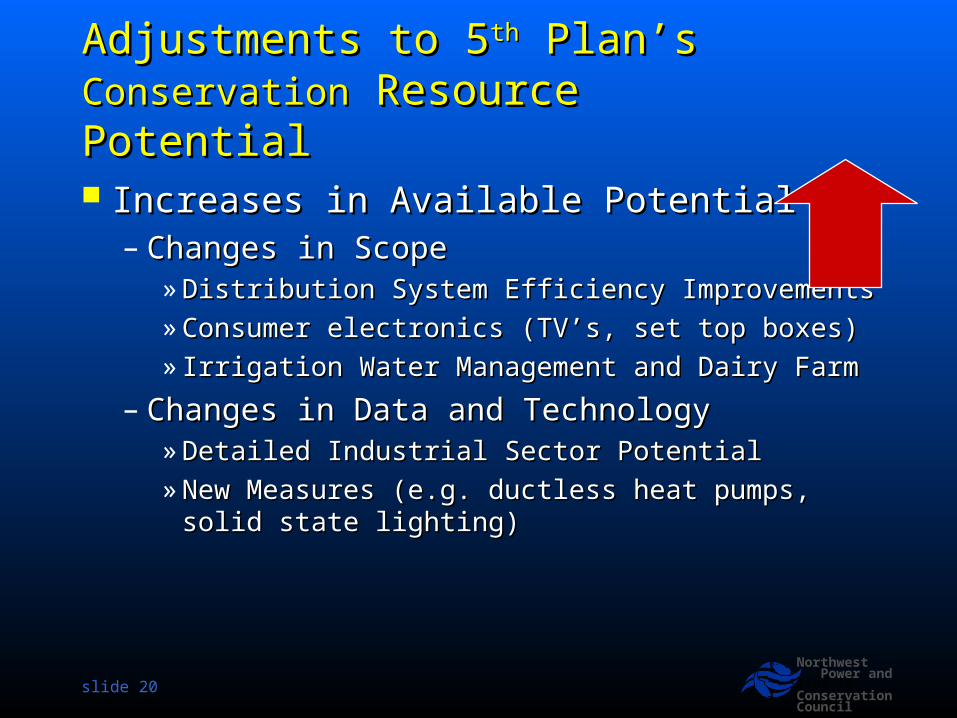
Adjustments to 5Adjustments to 5thth Plan’s Plan’s ConservationConservation Resource Potential Resource Potential
Increases in Available PotentialIncreases in Available Potential– Changes in ScopeChanges in Scope
» Distribution System Efficiency ImprovementsDistribution System Efficiency Improvements» Consumer electronics (TV’s, set top boxes)Consumer electronics (TV’s, set top boxes)» Irrigation Water Management and Dairy FarmIrrigation Water Management and Dairy Farm
– Changes in Data and TechnologyChanges in Data and Technology» Detailed Industrial Sector PotentialDetailed Industrial Sector Potential» New Measures (e.g. ductless heat pumps, solid New Measures (e.g. ductless heat pumps, solid
state lighting)state lighting)
slide 21
Northwest Power and ConservationCouncil
Slide 21
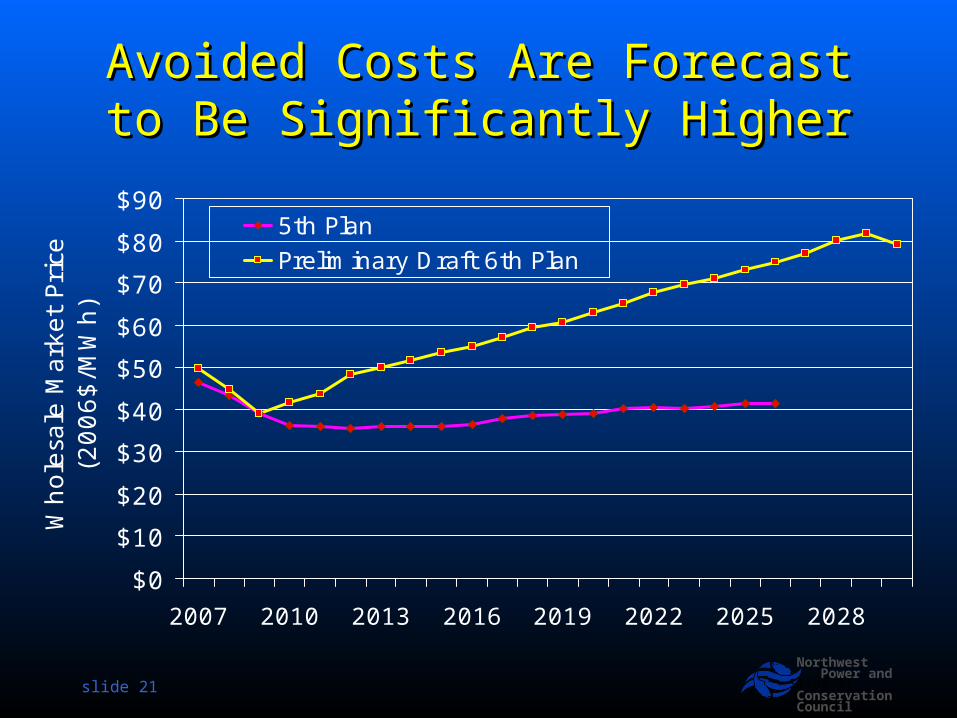
Avoided Costs Are Forecast to Avoided Costs Are Forecast to Be Significantly HigherBe Significantly Higher
$0
$10
$20
$30
$40
$50
$60
$70
$80
$90
2007 2010 2013 2016 2019 2022 2025 2028
Wh
ole
sale
Mark
et
Pri
ce
(20
06
$/M
Wh
)
5th Plan
Preliminary Draft 6th Plan
slide 22
Northwest Power and ConservationCouncil
Slide 22
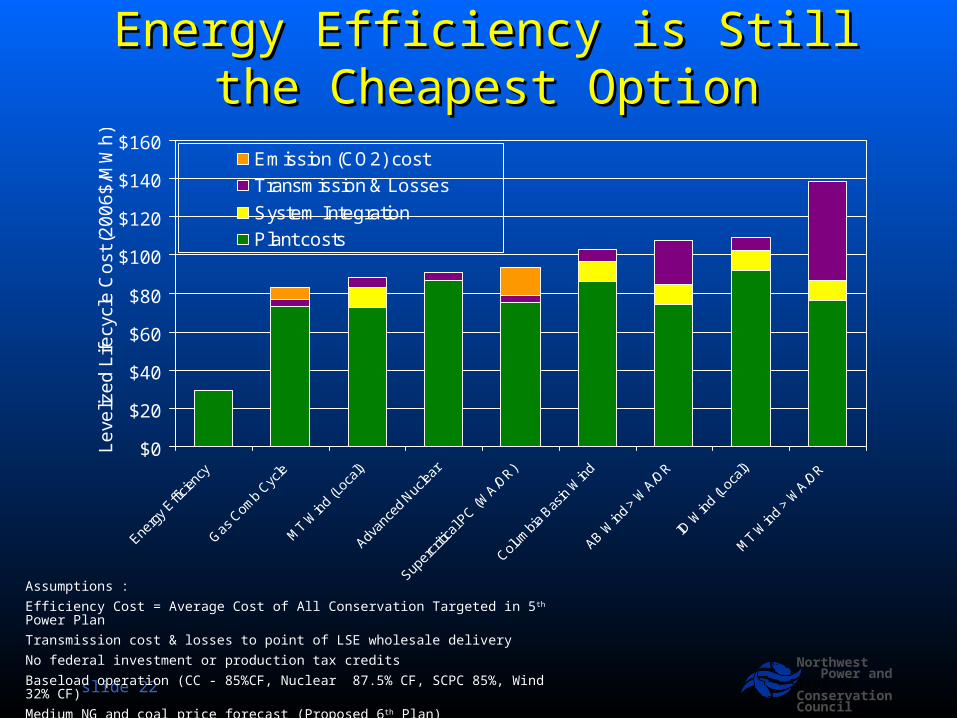
Energy Efficiency is Still the Energy Efficiency is Still the Cheapest OptionCheapest Option
Assumptions :
Efficiency Cost = Average Cost of All Conservation Targeted in 5th Power Plan
Transmission cost & losses to point of LSE wholesale delivery
No federal investment or production tax credits
Baseload operation (CC - 85%CF, Nuclear 87.5% CF, SCPC 85%, Wind 32% CF)
Medium NG and coal price forecast (Proposed 6th Plan)
Bingaman/Specter safety valve CO2 cost
$0
$20
$40
$60
$80
$100
$120
$140
$160
Energ
y Effic
iency
Gas C
omb
Cycle
MT
Wind
(Loc
al)
Advan
ced N
uclea
r
Super
critic
al PC (W
A/OR)
Colum
bia B
asin
Wind
AB Wind
> W
A/OR
ID W
ind (L
ocal)
MT
Wind
> W
A/OR
Le
veliz
ed
Life
cycl
e C
ost
(2
00
6$
/MW
h)
Emission (CO2) cost
Transmission & Losses
System Integration
Plant costs
slide 23
Northwest Power and ConservationCouncil
Slide 23
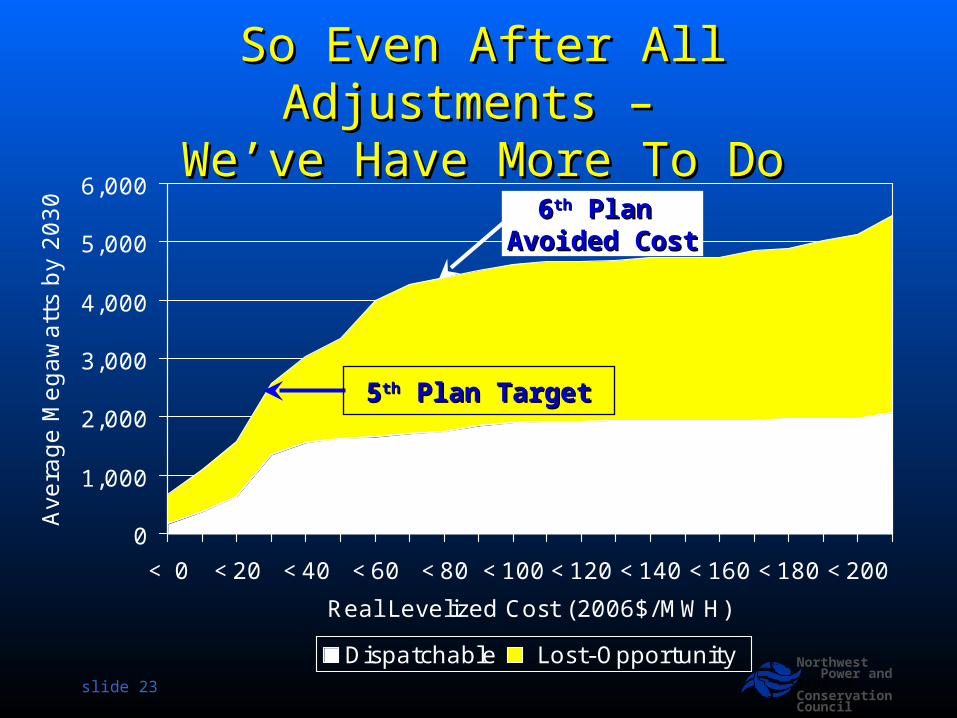
So Even After All Adjustments – So Even After All Adjustments – We’ve Have More To DoWe’ve Have More To Do
0
1,000
2,000
3,000
4,000
5,000
6,000
< 0 <20 <40 <60 <80 <100 <120 <140 <160 <180 <200
Real Levelized Cost (2006$/MWH)
Ave
rage M
egaw
att
s by
2030
Dispatchable Lost-Opportunity
55thth Plan Target Plan Target
66thth Plan Plan Avoided CostAvoided Cost
slide 24
Northwest Power and ConservationCouncil
Slide 24
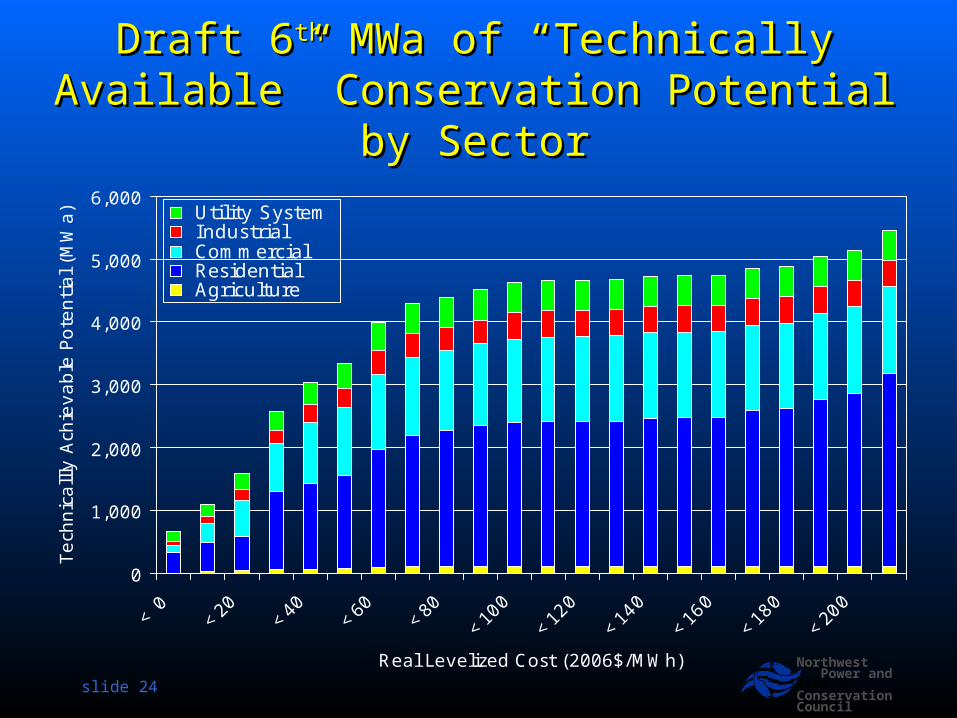
Draft 6Draft 6thth MWa of “Technically Available” MWa of “Technically Available” Conservation Potential by SectorConservation Potential by Sector
0
1,000
2,000
3,000
4,000
5,000
6,000
< 0
<20
<40
<60
<80
<10
0
<12
0
<14
0
<16
0
<18
0
<20
0
Real Levelized Cost (2006$/MWh)
Tech
nic
alll
y A
chie
vable
Pote
nti
al (M
Wa) Utility System
Industrial Commercial Residential Agriculture
slide 25
Northwest Power and ConservationCouncil
Slide 25
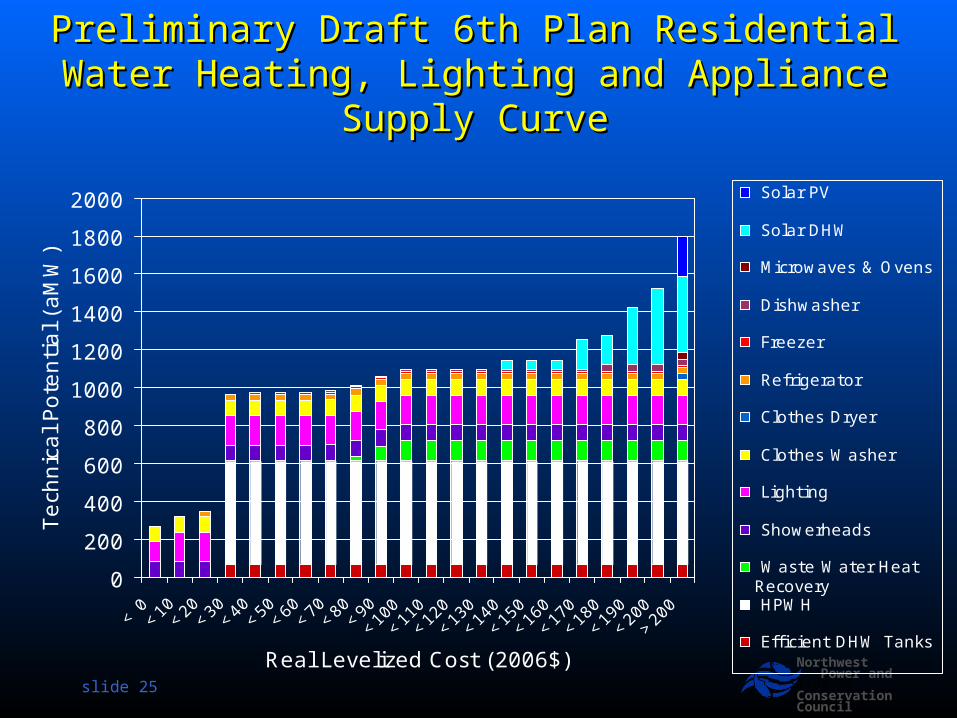
Preliminary Draft 6th Plan Residential Water Preliminary Draft 6th Plan Residential Water Heating, Lighting and Appliance Supply CurveHeating, Lighting and Appliance Supply Curve
0
200
400
600
800
1000
1200
1400
1600
1800
2000
< 0<10<20<30<40<50<60<70<80<90
<100
<110
<120
<130
<140
<150
<160
<170
<180
<190
<200
>200
Real Levelized Cost (2006$)
Tech
nic
al Pote
nti
al (a
MW
)
Solar PV
Solar DHW
Microwaves & Ovens
Dishwasher
Freezer
Refrigerator
Clothes Dryer
Clothes Washer
Lighting
Showerheads
Waste Water HeatRecovery HPWH
Efficient DHW Tanks
slide 26
Northwest Power and ConservationCouncil
Slide 26
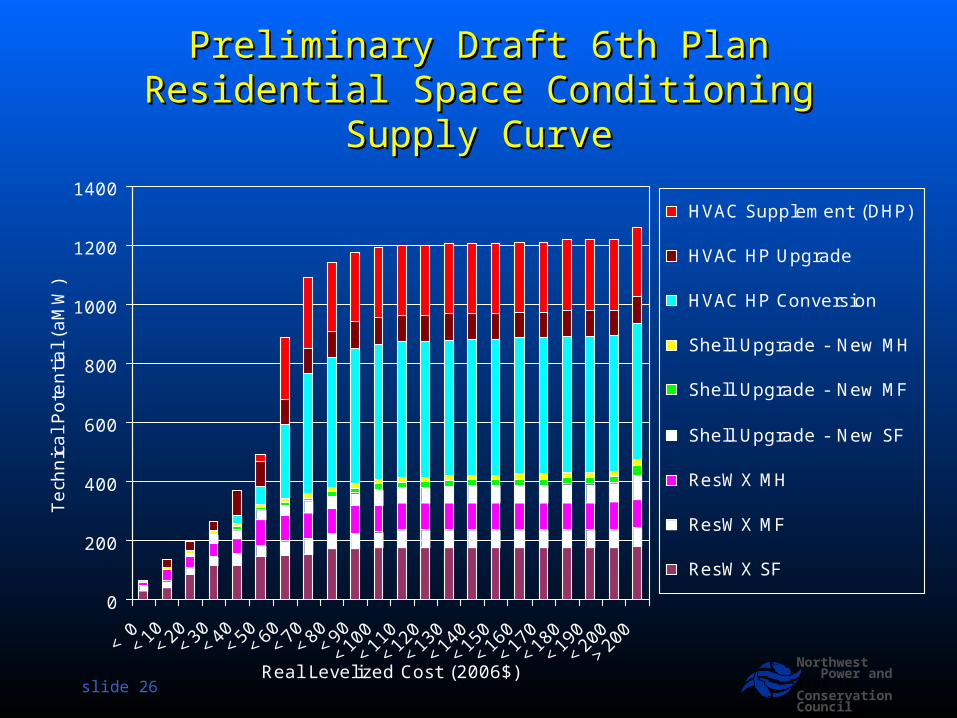
Preliminary Draft 6th Plan Residential Preliminary Draft 6th Plan Residential Space Conditioning Supply CurveSpace Conditioning Supply Curve
0
200
400
600
800
1000
1200
1400
< 0<10<20<30<40<50<60<70<80<90
<100
<110
<120
<130
<140
<150
<160
<170
<180
<190
<200
>200
Real Levelized Cost (2006$)
Tech
nic
al Pote
ntial (a
MW
)
HVAC Supplement (DHP)
HVAC HP Upgrade
HVAC HP Conversion
Shell Upgrade - New MH
Shell Upgrade - New MF
Shell Upgrade - New SF
ResWX MH
ResWX MF
ResWX SF
slide 27
Northwest Power and ConservationCouncil
Slide 27
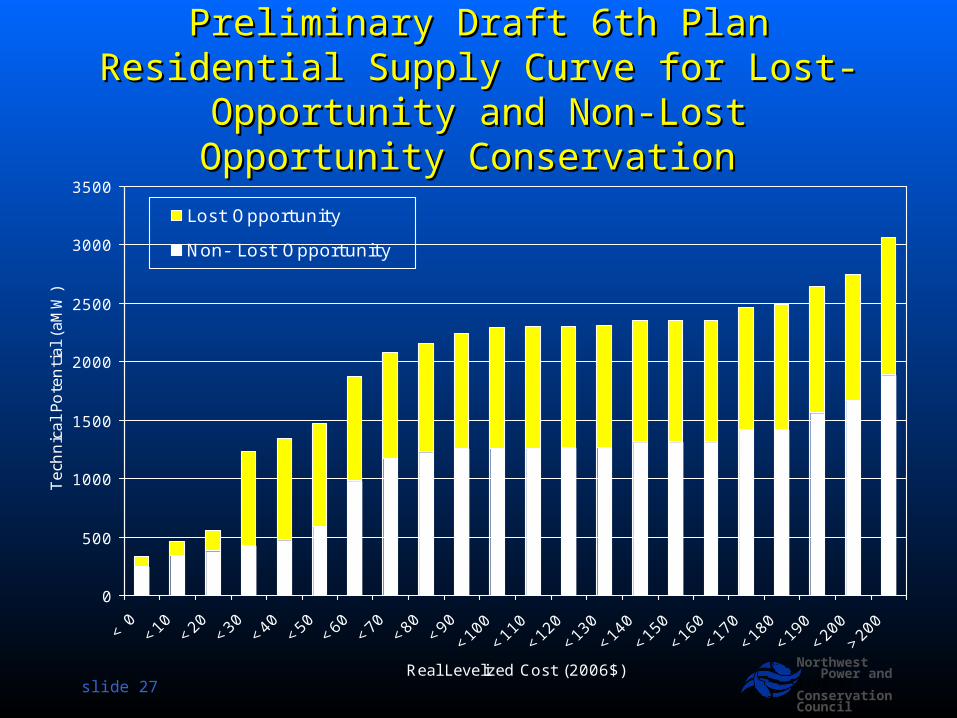
Preliminary Draft 6th Plan Residential Preliminary Draft 6th Plan Residential Supply Curve for Lost-Opportunity and Supply Curve for Lost-Opportunity and
Non-Lost Opportunity Conservation Non-Lost Opportunity Conservation
0
500
1000
1500
2000
2500
3000
3500
< 0<10 <20 <30 <40 <50 <60 <70 <80 <90
<100
<110
<120
<130
<140
<150
<160
<170
<180
<190
<200
>200
Real Levelized Cost (2006$)
Tec
hn
ical
Po
ten
tial
(aM
W)
Lost Opportunity
Non- Lost Opportunity
slide 28
Northwest Power and ConservationCouncil
Slide 28
Take This With YouTake This With You
Meeting Meeting ALLALL Regional Load Growth With Regional Load Growth With Conservation Conservation AND AND Renewable Resources Renewable Resources Will Not Meet WCI COWill Not Meet WCI CO22 Emissions Targets Emissions Targets
Technically Achievable Conservation Technically Achievable Conservation Potential Could Reduce Projected 2030 Potential Could Reduce Projected 2030 Loads By 3000 – 4000 MWaLoads By 3000 – 4000 MWa
It Will Require A Much Larger (2x-3x) It Will Require A Much Larger (2x-3x) Investment In Investment In Currently Currently Cost-Effective Energy Cost-Effective Energy Efficiency and New Technology To Reduce Efficiency and New Technology To Reduce Our Carbon Footprint To 1990 LevelsOur Carbon Footprint To 1990 Levels
slide 29
Northwest Power and ConservationCouncil
Slide 29
Any Questions?Any Questions?


![12] 1926. 63 - Law Library Digital Collectionsmoses.law.umn.edu/darrow/documents/Eckman v State.pdf · AUGUST TERM, 1926. 67 Eckman v. State, 191 Wis. 63. SUPREME COURT OF WISCONSIN](https://img.pdfslide.us/doc/110x75/5f02fcb17e708231d406fb79/12-1926-63-law-library-digital-v-statepdf-august-term-1926-67-eckman-v.jpg)