Embed Size (px)
Citation preview


NORTHWEST FIRE DISTRICT
PIMA COUNTY, ARIZONA
COMPREHENSIVE ANNUAL FINANCIAL REPORT for the fiscal year ended June 30, 2018
Northwest Fire District
5225 W. Massingale Road
Marana, AZ 85743
Phone 520-887-1010
Fax 520-887-1034
www.northwestfire.org
Prepared by the Finance Department of Northwest Fire District
David Gephart, Finance Director
Tabitha Walsh, Finance Supervisor
Debbi Hreblyn, Sr. Account Clerk
Michelle Harmon, Account Clerk
Raymond Thibault, Buyer


NORTHWEST FIRE DISTRICT
TABLE OF CONTENTS
Page
INTRODUCTORY SECTION
Letter of Transmittal 1
GFOA Certificate of Achievement 7
Organizational Chart 8
List of Elected and Appointed Officials 9
FINANCIAL SECTION
Independent Auditor’s Report 13
Management’s Discussion and Analysis 17
Basic Financial Statements
Government-wide Financial Statements
Statement of Net Position 27
Statement of Activities 29
Fund Financial Statements
Balance Sheet – Governmental Funds 30
Reconciliation of Balance Sheet – Governmental Funds to the Statement of Net Position 33
Statement of Revenues, Expenditures and Changes in Fund Balances –
Governmental Funds 34
Reconciliation of the Statement of Revenues, Expenditures and Changes in Fund Balances
– Governmental Funds to the Statement of Activities 37
Notes to Basic Financial Statements 39
REQUIRED SUPPLEMENTARY INFORMATION
Schedule of Changes in the Net Pension/OPEB Liability and Related Ratios
– Agent Retirement Plan (PSPRS) 67
Schedule of Pension/OPEB Contributions – Agent Retirement Plan (PSPRS) 69
Schedule of Proportionate Share of the Net Pension Liability (ASRS) 71
Schedule of Contributions – Cost Sharing Retirement Plan (ASRS) 72
Schedule of Revenues, Expenditures and Changes in Fund Balance – Budget and Actual
General Fund 73
Wildland Fund 74
Ambulance Fund 75
Grant Program Fund 76
Note to Required Supplementary Information 77

NORTHWEST FIRE DISTRICT
TABLE OF CONTENTS
Page
OTHER SUPPLEMENTARY INFORMATION
Schedule of Revenues, Expenditures and Changes in Fund Balance – Budget and Actual
Major Governmental Funds
Capital Improvements Fund 81
General Obligation Debt Service Fund 82
Capital Reserve Fund 83
Other Financial Schedules
Schedule of Property Tax Transactions 87
Schedule of Long-Term Debt Principal and Interest Transactions 88
Schedule of Future Bonded Debt Requirements 90
STATISTICAL SECTION
Financial Trends:
Net Position by Component 94
Changes in Net Position 96
Fund Balances of Governmental Funds 98
Changes in Fund Balances of Governmental Funds 100
Revenue Capacity:
Assessed Value and Estimated Actual Value of Taxable Property 102
Property Tax Rates – All Direct and Overlapping Governments 104
Principal Property Taxpayers 107
Property Tax Levies and Collections 108
Debt Capacity:
Ratios of Outstanding Debt by Type 110
Ratios of General Bonded Debt Outstanding 111
Direct and Overlapping General Obligation Debt Ratios 112
Direct and Overlapping Governmental Activities Debt 113
Legal Debt Margin Information 114
Demographic and Economic Information:
Demographic and Economic Statistics 116
Principal Employers 117
Operating Information:
Operating Indicators by Function 118
Full-Time Equivalent Employees by Function 120
Capital Asset Statistics by Function 122

NORTHWEST FIRE DISTRICT
TABLE OF CONTENTS
Page
SINGLE AUDIT SECTION
Report on Internal Control over Financial Reporting and on Compliance and Other Matters
Based on an Audit of Financial Statements Performed in Accordance with Government
Auditing Standards 127
Report on Compliance for Each Major Program and on Internal Control Over Compliance
Required by the Uniform Guidance 122
Schedule of Expenditures of Federal Awards 131
Notes to Schedule of Expenditures of Federal Awards 132
Schedule of Findings and Questioned Costs:
Section I – Summary of Auditors’ Results 133
Section II – Financial Statement Findings 134
Section III – Federal Award Findings and Questioned Costs 134
Summary Schedule of Prior Audit Findings 135

This page intentionally left blank

INTRODUCTORY SECTION

This page intentionally left blank

- 1 -
NORTHWEST FIRE DISTRICT SERVING RESIDENTS OF THE NORTHWEST FIRE DISTRICT, THE FLOWING WELLS COMMUNITY, AND THE TOWN OF MARANA
ADMINISTRATION/PREVENTION & LIFE SAFETY
5225 W. MASSINGALE ROAD
MARANA, AZ 85743
PHONE: (520) 887-1010 FAX: (520) 887-1034 www.northwestfire.org
November 14, 2018
To the Citizens and Board of Directors of Northwest Fire District:
Arizona Revised Statutes Article 9, §48-251 requires that all special districts with annual budgets
in excess of $1,000,000 publish within 240 days of the close of their fiscal year a complete set of
financial statements presented in conformance with generally accepted accounting principles
(GAAP) and audited in accordance with generally accepted auditing standards by a firm of licensed
certified public accountants. This report is published to fulfill that requirement for the fiscal year
ended June 30, 2018.
Management assumes full responsibility for the completeness and reliability of the information
contained in this report, based upon a comprehensive framework of internal control established for
this purpose. Because the cost of internal control should not exceed anticipated benefits, the
objective is to provide reasonable, rather than absolute, assurance that the financial statements are
free of material misstatements. As management, we assert that, to the best of our knowledge and
belief, this financial report is complete and reliable in all material respects.
Henry + Horne, a certified public accounting firm, have issued an unmodified (“clean”) opinion
on the Northwest Fire District financial statements for the year ended June 30, 2018. The
independent auditor’s report is located at the front of the financial section of this report.
Management’s discussion and analysis (MD&A) immediately follows the independent auditor’s
report and provides a narrative introduction, overview, and analysis of the basic financial
statements. MD&A complements this letter of transmittal and should be read in conjunction with
it.
The District is a special district established to provide a full range of fire protection and emergency
response services to its citizens. This report has been prepared in accordance with accounting
principles generally accepted in the United States of America and follows guidelines
recommended by the Government Finance Officers Association of the United States of America
and Canada.

- 2 -
Profile of the District
Northwest Fire District (NWFD) is the largest fire district in the State of Arizona and operates
under Arizona Revised Statutes (ARS) Title 48, Chapter 5. The District is a community service
organization funded through limited assessed value property taxes. It is governed by a five-
member Board of Directors, comprised of a Board Chair and four Directors, including a Vice-chair
and Clerk. All board members are elected at large and serve staggered four-year terms. The Board
hires a Fire Chief/Administrator to manage day-to-day operations of the District. The Board of
Directors is required to adopt an annual budget which serves as the foundation for financial
planning and control. The budget is prepared by fund, function, and department.
Northwest Fire District was formed in 1983 by
residents of the northwest metropolitan Tucson
area to ensure the community receives
consistent, high-quality emergency services at a
reasonable cost. On December 1, 1996, the
District expanded by merging with the Flowing
Wells Fire District.
Within its legal boundaries, NWFD provides
fire, emergency medical services (EMS) and
special operations response services to an area
of approximately 144 square miles and to a
population of approximately 116,788 people.
Over 34,000 reside in the Town of Marana and
the remainder resides in unincorporated Pima
County northwest of the City of Tucson.
Several industrial, commercial and residential
occupancies outside the legal boundaries are
served on a contractual basis. NWFD provides
services to a broad classification of population
densities including suburban, rural, and
wilderness. Approximately 16 miles of
Interstate 10 runs through the District. A
transcontinental Union Pacific railroad parallels
Interstate 10. NWFD protects property within
its boundaries assessed at a total of $1.137
billion.

- 3 -
Northwest Fire District is an internationally accredited, ISO Class 2, Special District providing a
broad level of professional proactive (prevention) and reactive (emergency) services to residents
and visitors.
Prevention services provided include:
• CPR and first aid classes
• Fire code inspection
• Fire investigation
• Plans review
• Fire education programs in elementary schools
• Infant/child car seat installation
• Certified babysitting classes
NWFD provides a wide variety of non-emergency services that include:
• Reptile removal
• Smoke detector battery replacement
• Invalid assists
• Community Assistance Programs aiding victims and family members following a
traumatic event such as a fire or death
Emergency services provided include:
• Fire suppression and rescue
• Emergency Medical Services at the Paramedic level
• Hazardous Materials response at the technician and specialist level
• Technical Rescue services at the technician level
NWFD operates ten fire engines (pumpers), six ambulances, two battalion chief trucks and cross
staffs one ladder truck from ten stations. The District is constantly staffed with 51 suppression
personnel per day, and has six support vehicles that are staffed when personnel are available
comprised of the following:
• Three water tenders
• Utility truck
• Light aircraft rescue firefighting (ARFF) truck
• Rehab vehicle
Northwest Fire District’s emergency response units are staffed consistently throughout the District
with trained and qualified personnel who were selected through competitive testing to obtain their
positions. All suppression personnel are required to be certified as a Firefighter I and II, pursuant
to the State of Arizona training requirements, Hazardous Materials Operations, and complete
NIMS 100, 200, 700 and 800 online programs. In addition, response personnel are, at a minimum,
Emergency Medical Technician-Basic certified as per Arizona Department of Health. Each fire

- 4 -
engine is staffed with a Captain, Engineer, Paramedic and Firefighter. The District’s staffing
policy requires four personnel on an engine/ladder and two on an ambulance.
Budget process
The District budgets all funds in accordance with the requirements of state law. All funds are
budgeted on the modified accrual basis of accounting.
The Board of Directors adopts the original budget by resolution prior to the beginning of the fiscal
year of the District. The Board resolution authorizing budgeted expenditures for each fund sets
the level by which actual expenditures should not exceed budgeted expenditures. Total personal
services, materials and services, capital outlay, and other expenditures for the fund are the levels
of control established by the resolution with the exception of the General Fund, where those same
appropriation levels are defined by division levels. The detailed budget document, however, is
required to contain more specific detailed information for the above-mentioned expenditure
categories, and management may transfer budgeted expenditures within all funds without Board
approval. However, transfers between funds require Board authorization, as do any transfers from
Contingency.
Budgeted expenditures lapse at year-end and may not be carried over to subsequent years.
Local economy
The Northwest Fire District operates in a diverse region that has seen significant growth over the
past eighteen years. Most of the development within NWFD is residential, including single and
multi-family dwellings. However, there is also a substantial and increasing presence of retail
occupancies along with a smaller percentage of warehouses and industrial-type facilities. Major
industries located within District boundaries include hospitals/healthcare, resorts/hospitality,
retail, and aerospace/defense contractors.
Because of its location in a region with a varied economic base, unemployment has been relatively
stable until the effect of the current recession was felt beginning in 2008. During the past ten
years, unemployment has risen from a low of 3.3% in Pima County to a high of 9.1%. Much of
this increase is due to the collapse of the construction industry. The good news is that all aggregate
indicators of economic activity are improving, with the current unemployment rate estimated to
be at 4.4%. Personal income, wages, and employment are growing at increasingly faster rates.
Unemployment is declining as are bankruptcies and residential foreclosures. Fortunately, demand
remains high for residential properties, driven by strong investor interest and a lack of supply.
The District’s population is expected to continue to grow in the next 20 years, although prior
growth estimates have been significantly curtailed. District management and staff are working
proactively and cooperatively with other governments, surrounding fire districts, and regional
planning groups to ensure continued ability to serve this future population.

- 5 -
Long-term financial planning and major initiatives
District management and its Board recognize the importance of strategic long-term financial
planning. Each year, forecasts are prepared to estimate the financial health of the District over the
next five years. The District Board also annually reviews and approves a comprehensive set of
financial policies, as well as a five-year Capital Improvement Program. Both documents provide
a framework for financial sustainability utilizing recommended practices from the GFOA and
industry leaders.
The five-year Capital Improvement Program (CIP) serves as a planning document to ensure that
facilities and equipment are well maintained and operating in peak condition. Under guidance
from the CIP committee and Board of Directors, the CIP process gives NWFD the ability to plan
for its capital needs and allocate short and long-term resources appropriately. As part of this
process, NWFD identifies and quantifies the operational costs associated with capital projects and
budgets resources accordingly. In addition, the fleet services division monitors the condition of
all vehicles and makes recommendations on their replacement. The NWFD maintains a vehicle
replacement policy which serves as its fleet replacement guide over a ten-year period.
NWFD has also been accredited by the Commission on Fire Accreditation International (CFAI)
through the Center for Public Safety Excellence (CPSE). During the accreditation process, an
independent committee of experts perform a comprehensive on-site evaluation to determine if the
agency is performing in a manner consistent with the needs of the community and relevant
standards/best practices. The District is one of only eleven fire departments/districts in the State
of Arizona to achieve this distinction, and one of two located in Southern Arizona. Accreditation
lasts for a period of five years, with required annual updates/reporting. The District was due for
re-accreditation in 2016-17 but was placed on deferred status. The District received full re-
accreditation status in August 2018.
Relevant financial policies
NWFD has adopted a comprehensive set of financial policies. The policies implemented have
been effective in protecting the District during the “Great Recession”, as the District has been able
to maintain service levels despite increases to operational costs (fuel, utilities, etc.) and
unwillingness by the Governing Board to increase the tax rate. Specifically, the policies 1)
requiring the adoption of a balanced budget and 2) not allowing one-time resource inflows to be
used for operating purposes, in addition to fund balance targets delineated by the policies have
kept the Governing Board and staff focused on increasing internal efficiencies, especially through
the leveraging of technologies.

- 6 -
Awards and Acknowledgements
Awards: The Government Finance Officers Association of the United States and Canada (GFOA)
awarded a Certificate of Achievement for Excellence in Financial Reporting to Northwest Fire
District for its comprehensive annual financial report for the fiscal year ended June 30, 2017. This
was the eleventh consecutive year that the District achieved this prestigious award. In order to be
awarded a Certificate of Achievement, a government must publish an easily readable and
efficiently organized comprehensive annual financial report. This report must satisfy both
generally accepted accounting principles and applicable legal requirements.
A Certificate of Achievement is valid for a period of one year only. We believe our current
comprehensive annual financial report continues to meet the Certificate of Achievement Program
requirements and we are submitting it to the GFOA to determine its eligibility for another
certificate.
Acknowledgements: We would like to express our sincere gratitude to the personnel of the
finance department who assisted and contributed to the preparation of this report. Appreciation is
also extended to Board Chair George Carter, the Board of Directors, the managers, employees and
citizens of the District whose continued support is vital to the financial health of Northwest Fire
District.
Respectfully Submitted,
Norman K. Bradley III David Gephart, CPA
Fire Chief/Administrator Finance Director

- 7 -

- 8 -

- 9 -
NORTHWEST FIRE DISTRICT
LIST OF ELECTED AND APPOINTED OFFICIALS
JUNE 30, 2018
Board of Directors
Term Expires
November 30, 2020
November 30, 2018
November 30, 2020
November 30, 2020
November 30, 2018
Administrative Offices
5225 W. Massingale Road
Marana, AZ 85743
Registered Agent
Michael J. Brandt
Fire Chief/Administrator
Legal Counsel
Benavidez Law Group, P.C.
7440 N. Oracle Road
Tucson, AZ 85704
George Carter, Chair
Bruce Kaplan, Vice-Chair
Becky Arend-Hicks, Clerk
Peg Green
David Talas

- 10 -
This page intentionally left blank

- 11 -
FINANCIAL SECTION

- 12 -
This page intentionally left blank

- 13 -

- 14 -

- 15 -

- 16 -
This page intentionally left blank

- 17 -
MANAGEMENT’S DISCUSSION AND ANALYSIS FISCAL YEAR ENDED JUNE 30, 2018
As management of the Northwest Fire District (District), we offer readers of the District financial
statements this narrative overview and analysis of financial activities for the fiscal year ended June 30,
2018. We encourage readers to consider the information presented here in conjunction with the
accompanying transmittal letter, the basic financial statements, and the accompanying notes to those
financial statements.
FINANCIAL HIGHLIGHTS
• The assets and deferred outflows of resources of Northwest Fire District exceeded its liabilities and
deferred inflows of resources at the close of the most recent fiscal year by $1,053,318 (net position).
No amount of the net position may be used to meet ongoing obligations of the District to citizens
and creditors because unrestricted net position carried a negative balance.
• Total net position of the District increased by $575,774, primarily due to revenues exceeding
expenses.
• As of the close of the current year, the governmental funds of the District reported combined ending
fund balances of $24,395,987, an increase of $12,844,447 in comparison with the prior year.
• At the end of the current fiscal year, unassigned fund balance for the General Fund was $5,164,700,
or 17.67% of total General Fund expenditures.
• The total long-term debt of the District increased by a net amount of $11,717,858. The increase is
primarily due to issuance of new general obligation debt.
OVERVIEW OF THE FINANCIAL STATEMENTS
This discussion and analysis is intended to serve as an introduction to the basic financial statements of the
District. These basic financial statements comprise three components: 1) government-wide financial
statements, 2) fund financial statements, and 3) notes to the financial statements. This report also contains
other supplementary information in addition to the basic financial statements themselves.
Government-wide financial statements. The government-wide financial statements (pages 27-29) are
intended to provide a broad overview in a manner similar to a private sector business.
The Statement of Net Position presents information on all assets, liabilities, and deferred inflows/outflows
of resources, with the difference reported as net position. Over time, increases or decreases in net position
may serve as a useful indicator of whether the financial position of the District is improving or deteriorating.
The Statement of Activities presents information showing how the net position of the District changed
during the most recent fiscal year. All changes in net position are reported as soon as the underlying event
giving rise to the change occurs, regardless of the timing of related cash flows. Thus, revenues and expenses
are reported in this statement for some items that will only result in cash flows in future fiscal periods (e.g.,
uncollected taxes and earned but unused vacation leave).
Fund financial statements. A fund is a grouping of related accounts that is used to maintain control over
resources that have been segregated for specific activities or objectives. Northwest Fire District, like other

- 18 -
state and local governments, uses fund accounting to ensure and demonstrate compliance with finance-
related legal requirements. All funds of the District are considered governmental funds.
Governmental funds – Governmental funds are used to account for essentially the same functions reported
as governmental activities in the government-wide financial statements. However, unlike the government-
wide financial statements, governmental fund financial statements focus on near-term inflows and outflows
of spendable resources, as well as on balances of spendable resources available at the end of the fiscal
year. Such information may be useful in assessing a government’s near-term financing requirements.
Because the focus of governmental funds is narrower than that of the government-wide financial statements,
it is useful to compare the information presented for governmental funds with similar information presented
for governmental activities in the government-wide financial statements. By doing so, readers may better
understand the long-term impact of the government’s near-term financing decisions. Both the
governmental fund balance sheet and the governmental fund statement of revenues, expenditures, and
changes in fund balance provide a reconciliation to facilitate this comparison between governmental funds
and governmental activities.
The District adopts an annual appropriated budget for the General Fund. A budgetary comparison statement
has been provided for the General Fund to demonstrate compliance with this budget.
The governmental fund financial statements can be found on pages 30-35 and 73-83 of this report.
Notes to the financial statements. The notes provide additional information that is essential to a full
understanding of the data provided in the government-wide and fund financial statements. The notes to the
financial statements can be found on pages 39-64 of this report.
GOVERNMENT-WIDE OVERALL FINANCIAL ANALYSIS
As noted earlier, net position may serve over time as a useful indicator of the financial position of a
government. In the case of Northwest Fire District, assets and deferred outflows of resources exceeded
liabilities and deferred inflows by $1,053,318 at the close of the most recent fiscal year.
The largest portion of net position of the District ($7,126,330, or 676.56%) reflects its investment in capital
assets (e.g., land, buildings, vehicles, and equipment), less any debt used to acquire those assets that is still
outstanding. The District uses these capital assets to provide services to residents; consequently, the assets
are not available for future spending. Although the investment in capital assets is reported net of related
debt, it should be noted that the resources needed to repay this debt must be provided from other sources,
since capital assets themselves cannot be used to liquidate these liabilities.
The next-largest balance of net position ($2,188,440, or 207.77%) reflects its restricted net position,
primarily comprised of unexpended grant and bond monies that cannot legally be utilized for any purpose
other than what the grantor or bond documents dictate.
The remaining balance of net position (-$8,261,452, or -784.33%) is unrestricted and may be used to meet
ongoing obligations of the District to citizens and creditors. Unrestricted net position is negative due to
implementation of GASB Statement No. 68, which requires the District to recognize pension liabilities.
- 19 -
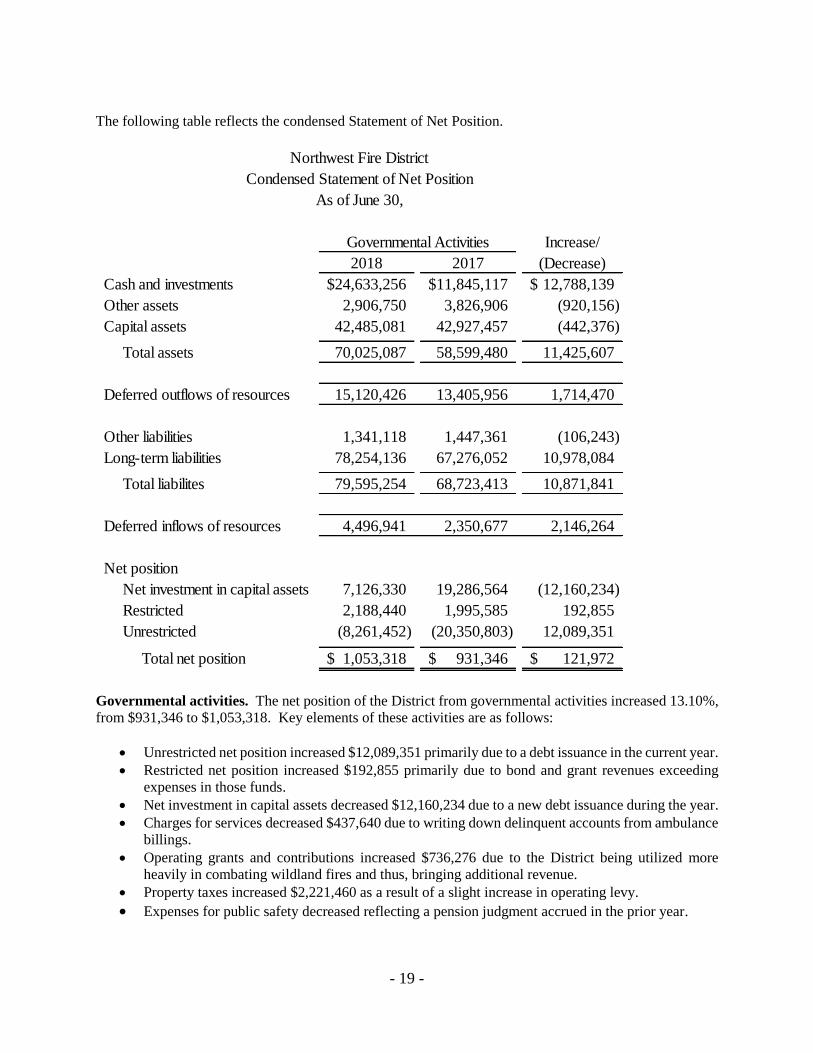
The following table reflects the condensed Statement of Net Position.
Increase/
2018 2017 (Decrease)
Cash and investments 24,633,256$ 11,845,117$ 12,788,139$
Other assets 2,906,750 3,826,906 (920,156)
Capital assets 42,485,081 42,927,457 (442,376)
Total assets 70,025,087 58,599,480 11,425,607
Deferred outflows of resources 15,120,426 13,405,956 1,714,470
Other liabilities 1,341,118 1,447,361 (106,243)
Long-term liabilities 78,254,136 67,276,052 10,978,084
Total liabilites 79,595,254 68,723,413 10,871,841
Deferred inflows of resources 4,496,941 2,350,677 2,146,264
Net position
Net investment in capital assets 7,126,330 19,286,564 (12,160,234)
Restricted 2,188,440 1,995,585 192,855
Unrestricted (8,261,452) (20,350,803) 12,089,351
Total net position 1,053,318$ 931,346$ 121,972$
Governmental Activities
Northwest Fire District
Condensed Statement of Net Position
As of June 30,
Governmental activities. The net position of the District from governmental activities increased 13.10%,
from $931,346 to $1,053,318. Key elements of these activities are as follows:
• Unrestricted net position increased $12,089,351 primarily due to a debt issuance in the current year.
• Restricted net position increased $192,855 primarily due to bond and grant revenues exceeding
expenses in those funds.
• Net investment in capital assets decreased $12,160,234 due to a new debt issuance during the year.
• Charges for services decreased $437,640 due to writing down delinquent accounts from ambulance
billings.
• Operating grants and contributions increased $736,276 due to the District being utilized more
heavily in combating wildland fires and thus, bringing additional revenue.
• Property taxes increased $2,221,460 as a result of a slight increase in operating levy.
• Expenses for public safety decreased reflecting a pension judgment accrued in the prior year.

- 20 -
Increase/
2018 2017 (Decrease)
Revenues
Program revenues
Charges for services 2,477,942$ 2,915,582$ (437,640)$
Operating grants and contributions 2,595,746 1,859,470 736,276
General revenues
Property taxes 33,127,433 30,905,973 2,221,460
Fire district assistance tax 402,130 398,246 3,884
Investment earnings 206,572 71,261 135,311
Miscellaneous 19,336 8,012 11,324
Total revenues 38,829,159 36,158,544 2,670,615
Expenses
Public safety 37,067,135 45,119,860 (8,052,725)
Interest on long-term debt 1,186,250 808,138 378,112
Total expenses 38,253,385 45,927,998 (7,674,613)
Increase/(Decrease) in net position 575,774 (9,769,454) 10,345,228
Prior period adjustment (453,802) - (453,802)
Beginning net position 931,346 10,700,800 (9,769,454)
Ending net position 1,053,318$ 931,346$ 121,972$
Governmental Activities
Condensed Statement of Activities
For the year ended June 30,
FINANCIAL ANALYSIS OF GOVERNMENTAL FUNDS
As noted earlier, the District uses fund accounting to ensure and demonstrate compliance with finance-
related legal requirements.
Governmental funds. The focus of governmental funds is to provide information on near-term inflows,
outflows, and balances of spendable resources. Such information is useful in assessing the District’s
financing requirements. In particular, unassigned fund balances may serve as a useful measure of the
District’s net resources available for discretionary use as they represent the portion of fund balance which
has not yet been limited to use for a particular purpose by either an external party, the District itself, or a
group or individual that has been delegated authority to assign resources for use for particular purposes by
the District Board of Directors.
At June 30, 2018, Northwest Fire District’s governmental funds reported combined fund balances of
$24,395,987, an increase of $12,844,447, or 211.19%, in comparison with the prior year. Approximately
21.17% of this amount ($5,164,700) constitutes unassigned fund balance, which is available for spending
at the District’s discretion. The remainder of the fund balance is either nonspendable, restricted, or

- 21 -
assigned to indicate that it is 1) not in spendable form ($76,899), 2) restricted for particular purposes
($2,029,957), or 3) assigned for particular purposes ($17,124,431).
General Fund. The General Fund accounts for all the financial resources of the District not accounted for
in any other fund. At the end of June 30, 2018, total fund balance was $7,329,781, of which $76,899 was
nonspendable because of prepaid items, $2,088,182 was assigned for medical self-insurance costs, and
$5,164,700 was unassigned for financial reporting purposes. As a measure of the fund’s liquidity, it may
be useful to compare both unassigned and total fund balance to the fund’s expenditures. Unassigned fund
balance represents 17.67% of the total general fund expenditures, while the total fund balance represents
25.08% of total general fund expenditures. Total fund balance of the fund decreased by $209,442, resulting
from increased repairs, maintenance, and supply costs.
Wildland Fund. The Wildland Fund accounts for the resources and requirements specific to the District’s
wildfire suppression activity. The primary source of income is federal/state government reimbursements
for out-of-district activities. Primary expenditures are wages and related expenditures, travel, and supplies.
At the end of June 30, 2018, total fund balance was $339,785, which is a decrease of $9,237 from the prior
year due wildland fire expenditures exceeding reimbursements.
Ambulance Fund. The Ambulance Fund accounts for the resources and requirements specific to the
District’s ambulance transport activity. The primary source of income is ambulance billings. Primary
expenditures are wages and related expenditures, travel, and supplies. At the end of June 30, 2018, total
fund balance was $125,409, which is a decrease of $126,549 from the prior year due to the fund slightly
underperforming revenue estimates.
Capital Improvements Fund. The Capital Improvements Fund accounts for financial resources to be used
for the acquisition or construction of major capital assets. The primary sources of income are from property
taxes, bond proceeds, and charges for services. The primary expenditures are capital expenditures. At the
end of June 30, 2018, total fund balance was $13,363,562, which is an increase of $13,017,124 from the
prior year primarily due to the issuance of general obligation bonds.
GO Debt Service Fund. The GO Debt Service Fund accounts for the property tax levy dedicated to the
payment of principal and interest on general obligation bonds.
Capital Reserve Fund. The Capital Reserve Fund accounts for reserves set aside for significant capital
purchases anticipated to be made in future years. It is funded through budgeted transfers from other funds.
Grant Program Fund. The Grant Program Fund accounts for all the grants awarded to the District from
various governmental and non-governmental sources, and related expenditures.
BUDGETARY HIGHLIGHTS
Changes or variances from the original to the final budget for the General Fund were due to reallocating
capacity from unfilled vacancies to areas of need. A schedule showing the original and final budget amounts
compared to the actual financial activity for the General Fund is provided in this report as required
supplementary information. The significant variances are summarized as follows:
• The positive variance of $7,163,837 for expenditures is primarily attributed to not utilizing
contingency funds for operations.

- 22 -
• The negative variance of $114,130 for support resources is primarily attributed to increased repair,
maintenance and supply costs.
• The negative variance of $73,768 for Administration is primarily due to a paid time off payout for
the former fire chief.
• The negative variance of $25,178 for Community safety services is primarily due to bringing part-
time community assistance program employees on as full-time employees in January.
For more detailed information, see budget to actual comparisons on page 73.
CAPITAL ASSET AND DEBT ADMINISTRATION
Capital assets. As of June 30, 2018, the investment in capital assets for governmental activities amounts
to $42,485,081 (net of accumulated depreciation). This investment in capital assets includes land and
improvements, buildings and improvements, vehicles, furniture and equipment. The total decrease in capital
assets for the current fiscal year was $442,376, or -1.03%.
Major capital events during the current fiscal year included the following:
• Purchase of new land for stations 37 and 41
• Purchase of two new KME Custom Pumpers
• Purchase of a new ambulance
• Purchase of a new medical drug dispensing machine for station 34
• Installation of a new keyless access system for increased security at all District locations
For more detailed information, see page 49 in the notes to the financial statements. The following table is
a summarized reconciliation of the changes in capital assets.
2018 2017
Beginning balance 42,927,457$ 43,547,647$
Additions 3,108,380 2,792,316
Retirements (294,350) (1,002,904)
Depreciation (3,256,406) (2,409,602)
Ending balance 42,485,081$ 42,927,457$
Northwest Fire District
Changes in Capital Assets
Year Ended June 30,
The District depreciates all capital assets except for land and construction in progress.

- 23 -
Long-term debt. At the end of the current fiscal year, the District had total debt outstanding of
$35,358,751. The entire amount of the debt is backed by the full faith and credit of the District. The District
has been issued an “AA-” rating from Standard & Poor’s.
Increase/
2018 2017 (Decrease)
General Obligation Bonds 35,358,751$ 23,640,893$ 11,717,858$
35,358,751$ 23,640,893$ 11,717,858$
Governmental
Activities
Northwest Fire District
Outstanding Debt
As of June 30,
Additional information regarding the long-term debt of the District can be found in the notes to the financial
statements on pages 50-51 of this report.
ECONOMIC FACTORS AND NEXT YEAR’S BUDGETS AND RATES
The local housing market continues to stabilize in foreclosures and prices, and assessed values appear to
have bottomed out five years ago. Builders and developers have begun reinvesting in the community, as
evidenced by a new premium factory outlet mall which opened in the District in October 2015. District
assessed values hit a high of $1.218 billion in 2009/10, declined to $943 million in 2013/14, and currently
is estimated at $1.137 billion. The Board of Directors has been consistent in its approach of attempting to
maintain service levels through a combination of operational budget reductions, self-insuring District health
benefits, utilizing a separation incentive plan, capital expenditure deferments, and tax levy maintenance.
However, the District has now reached the point where tax levy maintenance is no longer feasible given
inflation. As a result, the operational tax rates have increased from $2.1124 in 2009/10 to $2.7095 for
2018/19.
Next year’s budget reflects an increase in personnel expenditures due to expiration of a SAFER grant which
helped fund new suppression employees, as well as new station building construction projects funded
through the new bond issuance.
FINANCIAL CONTACT
The financial statements of the District are designed to present users (citizens, taxpayers, customers,
investors, and creditors) with a general overview of the finances of the District and to demonstrate
accountability. If you have questions regarding the report or need additional financial information, please
contact the Finance Director of the District at 5225 W. Massingale Road, Tucson, AZ 85743.

- 24 -
This page intentionally left blank

- 25 -
BASIC FINANCIAL STATEMENTS

- 26 -
This page intentionally left blank

The accompanying notes are an integral part of the financial statements.
- 27 -
NORTHWEST FIRE DISTRICT STATEMENT OF NET POSITION
JUNE 30, 2018
Governmental
Activities
ASSETS
Cash and investments $ 24,633,256
Accounts receivable 1,123,828
Property taxes receivable 1,706,023
Prepaid expenses 76,899
Capital assets
Land, improvements, and construction in progress 7,310,334
Other capital assets (net of accumulated depreciation) 35,174,747
Total Assets 70,025,087
DEFERRED OUTFLOWS OF RESOURCES
Pension plan items 15,120,426
Total Deferred Outflows of Resources 15,120,426
LIABILITIES
Accounts payable and accrued expenses 1,327,929
Unearned revenue 13,189
Noncurrent liabilities:
Due within one year:
Bonds payable 2,470,000
Compensated absences 1,700,000
Due in more than one year:
Bonds payable, net of unamortized premium 32,888,751
Compensated absences 1,920,840
Net OPEB liability 310,536
Net pension liability 38,964,009
Total Liabilities 79,595,254
DEFERRED INFLOWS OF RESOURCES
Pension plan items 4,496,941
Total Deferred Inflows of Resources 4,496,941
NET POSITION
Net investment in capital assets 7,126,330
Restricted for:
Debt Service 1,172,773
Grants 1,015,667
Unrestricted (8,261,452)
Total Net Position $ 1,053,318

- 28 -
This page intentionally left blank

The accompanying notes are an integral part of the financial statements.
- 29 -
NORTHWEST FIRE DISTRICT STATEMENT OF ACTIVITIES
YEAR ENDED JUNE 30, 2018
Governmental
Activities
EXPENSES
Public safety
Salaries and wages $ 19,695,263
Employee benefits 7,696,501
Materials and supplies 1,635,044
Professional services 1,092,826
Utilities and communications 1,637,818
Insurance 129,923
Repairs and maintenance 1,476,894
Lease agreements 152,427
Depreciation 3,550,439
Interest on long-term debt 1,384,806
Total program expenses 38,451,941
PROGRAM REVENUES
Charges for services 2,477,942
Operating grants and contributions 2,595,746
Total program revenues 5,073,688
Net program expenses (33,378,253)
GENERAL REVENUES
Property taxes 33,127,433
Fire district assistance tax 402,130
Investment earnings 206,572
Miscellaneous 19,336
Total general revenues 33,755,471
Change in net position 377,218
Net position, July 1, 2017, as restated 477,544
Net position, June 30, 2018 $ 854,762

The accompanying notes are an integral part of the financial statements.
- 30 -
NORTHWEST FIRE DISTRICT BALANCE SHEET – GOVERNMENTAL FUNDS
JUNE 30, 2018
ASSETS
Cash and investments $ 7,886,143 $ 118,602 $ -
Accounts receivable 30,571 412,563 478,896
Property taxes receivable 1,524,004 - -
Prepaids 76,899 - -
Due from other funds 207,103 - -
Total Assets $ 9,724,720 $ 531,165 $ 478,896
LIABILITIES
Accounts payable $ 524,629 $ 22,419 $ 14,065
Accrued payroll and related benefits 509,634 7,715 -
Unearned revenue 9,823 - -
Due to other funds - - 207,103
Total Liabilities 1,044,086 30,134 221,168
DEFERRED INFLOWS OF RESOURCES
Unavailable revenue - property taxes 1,350,853 - -
Unavailable revenue - wildland billings - 161,246 -
Unavailable revenue - ambulance billings - - 132,319
Total Deferred Inflows of Resources 1,350,853 161,246 132,319
FUND BALANCES
Nonspendable:
Prepaid items 76,899 - -
Restricted for:
Debt service - - -
Grant expenditures - - -
Assigned to:
Medical self insurance 2,088,182 - -
Wildland - 339,785 -
Ambulance - - 125,409
Capital expenditures - - -
Unassigned: 5,164,700 - -
Total Fund Balances 7,329,781 339,785 125,409
Total Liabilities, Deferred Inflows of Resources, and Fund Balances $ 9,724,720 $ 531,165 $ 478,896
General Wildland Ambulance

The accompanying notes are an integral part of the financial statements.
- 31 -
$ 13,568,192 $ 990,754 $ 1,207,493 $ 862,072 $ 24,633,256
4,777 - - 197,021 1,123,828
- 182,019 - - 1,706,023
- - - - 76,899
- - - - 207,103
$ 13,572,969 $ 1,172,773 $ 1,207,493 $ 1,059,093 $ 27,747,109
$ 209,407 $ - $ - $ 16,346 $ 786,866
- - - 23,714 541,063
- - - 3,366 13,189
- - - - 207,103
209,407 - - 43,426 1,548,221
- 158,483 - - 1,509,336
- - - - 161,246
- - - - 132,319
- 158,483 - - 1,802,901
- - - - 76,899
- 1,014,290 - - 1,014,290
- - - 1,015,667 1,015,667
- - - - 2,088,182
- - - - 339,785
- - - - 125,409
13,363,562 - 1,207,493 - 14,571,055
- - - - 5,164,700
13,363,562 1,014,290 1,207,493 1,015,667 24,395,987
$ 13,572,969 $ 1,172,773 $ 1,207,493 $ 1,059,093 $ 27,747,109
Grant
GO
Capital Debt Capital
TotalsImprovements Service Reserve Program

- 32 -
This page intentionally left blank

The accompanying notes are an integral part of the financial statements.
- 33 -
NORTHWEST FIRE DISTRICT RECONCILIATION OF BALANCE SHEET – GOVERNMENTAL FUNDS TO THE STATEMENT OF NET POSITION
JUNE 30, 2018
Fund Balances $ 24,395,987
The Statement of Net Position reports receivables at their net realizable value. However,
receivables not available to pay for current-period expenditures are reported as
unavailable revenue in governmental funds. 1,802,901
Capital assets are not financial resources in governmental funds, but are reported in the
Statement of Net Position at their net depreciable value. 42,485,081
Pension/OPEB contributions subsequent to the measurement date, assumption changes, and
differences between expected and actual experience are not available resources, and
therefore, are not reported in the funds. 10,623,485
Long-term liabilities not payable in the current year are not reported as governmental fund
liabilities. Interest on long-term debt is not accrued in the governmental funds, but
is recognized as an expenditure when paid. These liabilities consist of the following:
Accrued compensated absences payable (3,620,840)
Bonds payable (35,358,751)
Net OPEB liability (310,536)
Net pension liability (38,964,009) (78,254,136)
Net position of governmental activities $ 1,053,318

The accompanying notes are an integral part of the financial statements.
- 34 -
NORTHWEST FIRE DISTRICT STATEMENT OF REVENUES, EXPENDITURES AND CHANGES IN FUND BALANCES –
GOVERNMENTAL FUNDS
YEAR ENDED JUNE 30, 2018
REVENUES
Taxes and assessments $ 29,411,580 $ - $ -
Charges for services 1,258,948 - 2,156,082
Intergovernmental - 839,448 -
Donations 1,215 - -
Interest earned 68,541 - -
Miscellaneous 16,379 - -
Total Revenues 30,756,663 839,448 2,156,082
EXPENDITURES
Public safety:
Administration 3,347,591 - -
Emergency operations 19,567,594 848,685 2,072,411
Community safety services 1,242,393 - -
Support resources 5,041,038 - 210,220
Capital outlay 24,800 - -
Debt service - - -
Total Expenditures 29,223,416 848,685 2,282,631
REVENUES OVER (UNDER)
EXPENDITURES 1,533,247 (9,237) (126,549)
OTHER FINANCING SOURCES/(USES)
Sale of general capital assets - - -
General obligation bonds issued - - -
Premium on bond issuance - - -
Transfers in/(out) (1,742,689) - -
Total Other Financing Sources (Uses) (1,742,689) - -
NET CHANGE IN FUND BALANCES (209,442) (9,237) (126,549)
FUND BALANCES, Beginning of year 7,539,223 349,022 251,958
FUND BALANCES, End of year $ 7,329,781 $ 339,785 $ 125,409
WildlandGeneral Ambulance

The accompanying notes are an integral part of the financial statements.
- 35 -
$ - $ 4,009,873 $ - $ - $ 33,421,453
88,781 - - - 3,503,811
- 145,359 - 1,562,186 2,546,993
- - - - 1,215
138,031 - - - 206,572
- 2,957 - - 19,336
226,812 4,158,189 - 1,562,186 39,699,380
- 1,975 - - 3,349,566
7,146 - - 1,740,869 24,236,705
- - - - 1,242,393
- - - - 5,251,258
3,057,419 - - 26,160 3,108,379
198,556 3,778,820 - - 3,977,376
3,263,121 3,780,795 - 1,767,029 41,165,677
(3,036,309) 377,394 - (204,843) (1,466,297)
316 - - - 316
12,780,000 - - - 12,780,000
1,530,428 - - - 1,530,428
1,742,689 - - - -
16,053,433 - - - 14,310,744
13,017,124 377,394 - (204,843) 12,844,447
346,438 636,896 1,207,493 1,220,510 11,551,540
$ 13,363,562 $ 1,014,290 $ 1,207,493 $ 1,015,667 $ 24,395,987
Capital
Improvements
Grant
Program
GO
Totals
Capital
ReserveService
Debt

- 36 -
This page intentionally left blank

The accompanying notes are an integral part of the financial statements.
- 37 -
NORTHWEST FIRE DISTRICT RECONCILIATION OF THE STATEMENT OF REVENUES, EXPENDITURES AND CHANGES IN
FUND BALANCES OF GOVERNMENTAL FUNDS TO THE STATEMENT OF ACTIVITIES
YEAR ENDED JUNE 30, 2018
Net change in fund balances - total governmental funds $ 12,844,447
Amounts reported for governmental activities in the Statement of Activities are different
because:
Revenues in the Statement of Activities that do not provide current financial resources
are not reported as revenues in the funds. (870,221)
Governmental funds do not report expenditures for unpaid compensated absences
since they do not require the use of current financial resources. However, the Statement
of Activities reports such expenses when incurred, regardless of when settlement
ultimately occurs. (192,436)
Capital outlays are reported as expenditures in governmental funds. However, the
Statement of Activities allocates the cost of capital outlay over their estimated useful
lives as depreciation expense.
Expenditures for capital assets $ 3,108,379
Loss on disposition of capital assets (34,053)
Less current year depreciation (3,516,702) (442,376)
Governmental funds report pension/OPEB contributions as expenditures. However, they are
reported as deferred outflows of resources in the Statement of Net Position. The
change in the net pension/OPEB liability, adjusted for deferred pension/OPEB items, is reported
as pension/OPEB expense in the Statement of Activities. 954,218
Proceeds from the issuance of long-term debt provide current financial resources to
governmental funds and are reported as revenues. In the same way, repayments of
long-term debt use current financial resources and are reported as expenditures in
governmental funds. However, neither the receipt of debt proceeds nor the payment of
debt principal affect the Statement of Activities, but are reported as increases and
decreases in noncurrent liabilities in the Statement of Net Position.
Amortization $ 212,570
Issuance of general obligation debt (12,780,000)
Premium on bond issuance (1,530,428)
Principal repayments 2,380,000 (11,717,858)
Change in net position of governmental activities. $ 575,774

- 38 -
This page intentionally left blank

- 39 -
NORTHWEST FIRE DISTRICT NOTES TO BASIC FINANCIAL STATEMENTS
YEAR ENDED JUNE 30, 2018
SUMMARY OF SIGNIFICANT ACCOUNTING POLICIES
Reporting Entity
Northwest Fire District (District), a Suburban Fire Protection District, is an Arizona Special Taxing District
operating under Arizona Revised Statutes Title 48, Chapter Five, and provides fire protection to residents of
the northwest unincorporated Tucson area and residents of the Town of Marana.
The power and authority given to the District is vested in a Board of Directors, each member being elected for
a four-year term. The Board of Directors has the statutory authority to adopt and modify the budget; levy taxes;
control all assets, including facilities and properties; authorize borrowing, or long-term debt issuances; sign
contracts, and develop the programs to be provided. The responsibility and accountability over all funds and
fiscal matters are vested in the Board of Directors. The District is responsible for its debts and is entitled to
surpluses. No separate agency receives a financial benefit from nor imposes a financial burden on the District.
The Board of Directors appoints the Fire Chief of the District. The activities under the purview of the Fire
Chief are within the scope of the reporting entity and the Fire Chief is accountable to the Board of Directors for
the activities being managed.
The District is the primary, special purpose government responsible for all fire protection within its service
areas. As a result, all significant activities have been included in the government-wide financial statements.
The District’s financial statements represent those of a stand-alone government, as there are no component
units.
Government-wide and Fund Financial Statements
The government-wide financial statements report information on all of the governmental activities of the
District. Eliminations have been made to minimize the double counting of internal activities. Governmental
activities are financed primarily through property taxes, investment earnings, grants and contributions, and
charges for services to other governments.
The Statement of Activities presents a comparison between direct expenses of the public safety program of the
District and program revenues. Direct expenses are those that are specifically associated with the public safety
function and, therefore, are clearly identifiable to that function. Program revenues include: 1) charges to
customers or applicants for goods, services, or privileges provided, 2) operating grants and contributions, and
3) capital grants and contributions. Property taxes, investment earnings, insurance refunds, and other items that
are not properly classified as program revenues, are presented as general revenues.
Measurement Focus, Basis of Accounting, and Financial Statement Presentation
The accounting and financial reporting treatment is determined by the applicable measurement focus and basis
of accounting. Measurement focus indicates the type of resources being measured such as current financial
resources or economic resources. The basis of accounting indicates the timing of transactions or events for
recognition in the financial statements.

- 40 -
NORTHWEST FIRE DISTRICT NOTES TO BASIC FINANCIAL STATEMENTS
YEAR ENDED JUNE 30, 2018
SUMMARY OF SIGNIFICANT ACCOUNTING POLICIES (Continued)
Measurement Focus, Basis of Accounting, and Financial Statement Presentation (Continued)
The government-wide financial statements are reported using the economic resources measurement focus and
the accrual basis of accounting. Revenues are recorded when earned and expenses are recorded when a liability
is incurred, regardless of the timing of related cash flows. Property taxes are recognized as revenues in the year
for which they are levied. Grants and similar items are recognized as revenue as soon as all eligibility
requirements imposed by the provider have been met.
The governmental fund financial statements are reported using the current financial resources measurement
focus, and the modified accrual basis of accounting. Revenues are recognized as soon as they are both
measurable and available. Revenues are considered to be available when they are collectible within the current
period or soon enough thereafter to pay liabilities of the current period. For this purpose, the government
considers revenues to be available if they are collected within 60 days of the end of the current fiscal period.
Expenditures generally are recorded when a liability is incurred, as under accrual accounting. However, debt
service expenditures, as well as expenditures related to compensated absences, and claims and judgments, are
recorded only when payment is due. General capital asset acquisitions are reported as expenditures in
governmental funds. Issuance of long-term debt and acquisitions under capital leases are reported as other
financing sources.
Real and personal property taxes are levied on or before the third Monday in August that become due and
payable in two equal installments. The first installment is due on the first day in October and becomes
delinquent after the first business day of November. The second installment is due on the first day of March of
the next year and becomes delinquent after the first business day of May. A lien assessed against real and
personal property attaches on the first day of January preceding assessment and levy. All property taxes are
billed and collected by Pima County and remitted to the District. In the governmental fund financial statements,
property taxes are reflected as revenues in the fiscal period for which they were levied, provided they are due,
or past due and receivable within the current period, and collected within the current period or expected to be
collected soon enough thereafter to be used to pay liabilities of the current period (60 days). Otherwise they
are reported as deferred revenues.
Intergovernmental revenues are recognized as revenues when all eligibility requirements are met. There are,
however, essentially two types of intergovernmental revenues. In one, monies must be expended on the specific
purpose or project before any amounts will be paid to the District; therefore, all eligibility requirements are
determined to be met when the underlying expenditures are recorded. In the other, monies are virtually
unrestricted as to the purpose of the expenditure and are usually revocable only for failing to comply with
prescribed requirements; therefore, all eligibility requirements are determined to be met at the time of receipt
or earlier if the susceptible to accrual criteria are met.
When both restricted and unrestricted resources are available for use, it is the policy of the District to use
restricted resources first, then unrestricted resources as they are needed.

- 41 -
NORTHWEST FIRE DISTRICT NOTES TO BASIC FINANCIAL STATEMENTS
YEAR ENDED JUNE 30, 2018
SUMMARY OF SIGNIFICANT ACCOUNTING POLICIES (Continued)
Measurement Focus, Basis of Accounting, and Financial Statement Presentation (Continued)
The District reports the following major governmental funds:
• The General Fund is the primary operating fund of the District. It accounts for all financial resources
of the District, except those required to be accounted for in another fund, either legally or by Board
direction. The principal revenue source is property taxes. Primary expenditures are for public safety.
• The Wildland Fund accounts for financial resources to be used for the operation of the District Wildland
program. The principal revenue source is state and federal wildland fire suppression billings. Primary
expenditures are wages and related costs, travel and supplies.
• The Ambulance Fund accounts for financial resources to be used for the operation of the District
Ambulance Transport program. The principal revenue source is ambulance transport billings. Primary
expenditures are wages and related costs, supplies and services.
• The Capital Improvements Fund accounts for financial resources to be used for the acquisition or
construction of major capital assets. The principal revenue source is property taxes, while primary
expenditures are for capital outlay.
• The General Obligation Debt Service Fund accounts for repayment of general obligation debt. The
principal revenue source is property taxes, while primary expenditures are for principal and interest
debt service payments.
• The Capital Reserve Fund accounts for reserves specific to future capital needs of the District. The
principal revenue source is property taxes. There are no expenditures in this fund.
• The Grant Program Fund accounts for grants received by the District. Primary revenues are grants
from intergovernmental agencies. Primary expenditures are personnel costs and capital outlay.
Use of Estimates
The preparation of financial statements in conformity with accounting principles generally accepted in the
United States of America requires management to make estimates and assumptions that affect reported amounts
of certain assets, liabilities, revenues and expenses as of and for the year ended June 30, 2018. Actual results
may differ from such estimates.
Cash and Investments
The District considers cash on hand, demand deposits and short-term highly liquid investments with a maturity
of three months or less, when purchased, to be cash and cash equivalents. Investments maintained in the Pima
County Investment Pool, are carried at cost, which approximates fair value, and are classified as a cash
equivalent. Fair value of the investments in the pool is the same as the value of the pool shares. Short-term
investments classified as cash equivalents are carried at amortized cost. Fair value is defined as the amount at
which an investment could be exchanged between willing parties, other than in a forced or liquidation sale.

- 42 -
NORTHWEST FIRE DISTRICT NOTES TO BASIC FINANCIAL STATEMENTS
YEAR ENDED JUNE 30, 2018
SUMMARY OF SIGNIFICANT ACCOUNTING POLICIES (Continued)
Receivables and Deferred Inflows of Resources
All accounts and property tax receivables are shown net of any allowance for uncollectible accounts. Property
taxes receivable for the governmental fund types, which have been remitted within 60 days subsequent to year
end, are considered measurable and available and recognized as revenues. All other property taxes are offset
by deferred property tax inflows of resources and, accordingly, have not been recorded as revenue. Real and
personal property taxes are levied upon all taxable property within the District and become liens against the
property on the first day of January preceding assessment and levy.
Federal and state grants and contracts are recorded as intergovernmental receivables and revenues when the
related expenditures are incurred. The portion of reimbursement in excess of expenditures and amounts not
remitted within 60 days subsequent to year end, are recorded as unavailable revenues.
All other revenues are recognized when earned.
Prepaid Items
Certain payments to vendors reflect costs applicable to future accounting periods and are recorded as prepaid
items in both the government-wide and fund financial statements under the consumption method.
Capital Assets
Capital assets are stated at cost or estimated historical cost. Donated items are recorded at acquisition value at
date of donation. Estimated acquisition value of donated assets is determined based on engineering estimates
of current cost, appraised value, or price indexed cost.
Normal maintenance and repairs are charged to operations as incurred. Major additions, improvements and
replacements are capitalized. Gains or losses from sales or retirements of capital assets are included in
operations.
Capital assets include land, buildings, improvements, equipment, and other tangible assets costing over $5,000
and that have initial useful lives extending beyond a single reporting period.
Depreciation is computed on assets in service, using the straight-line method over their estimated useful lives:
Land and construction in progress non-depreciable
Vehicles, furniture and equipment 5-15 years
Buildings and facilities 5-50 years

- 43 -
NORTHWEST FIRE DISTRICT NOTES TO BASIC FINANCIAL STATEMENTS
YEAR ENDED JUNE 30, 2018
SUMMARY OF SIGNIFICANT ACCOUNTING POLICIES (Continued)
Deferred Outflows and Inflows of Resources
The Statement of Net Position and balance sheet include a separate section for deferred outflows of resources
and deferred inflows of resources. Deferred outflows of resources represent a consumption of net position that
applies to future periods that will be recognized as an expense or expenditure in future periods. Deferred inflows
of resources represent an acquisition of net position or fund balance that applies to future periods and will be
recognized as a revenue in future periods.
Postemployment Benefits
For purposes of measuring the net pension and other postemployment benefits (OPEB) assets and liabilities,
deferred outflows of resources and deferred inflows of resources related to pensions and OPEB, and pension
and OPEB expense, information about the plans’ fiduciary net position and additions to/deductions from the
plans’ fiduciary net position have been determined on the same basis as they are reported by the plans. For this
purpose, benefit payments (including refunds of employee contributions) are recognized when due and payable
in accordance with the benefit terms. Investments are reported at fair value.
Compensated Absences
It is the policy of the District to permit employees to accumulate earned but unused paid time off. A liability is
reported for paid time off that the District will pay upon termination or retirement. None of the liability for
compensated absences is expected to be liquidated with expendable available financial resources. Accordingly,
compensated absences are accrued as a liability only in the government-wide financial statements. The General
Fund and Wildland Fund have typically been used to liquidate the liability for compensated absences in prior
years.
Long-Term Debt
In the government-wide financial statements, long-term debt is reported as a liability in the Statement of Net
Position. Bond premiums and discounts are deferred and amortized over the life of the related debt. Bonds
payable are reported net of applicable bond premium or discount.
In the fund financial statements, bond premiums and discounts are recognized when incurred and not deferred.
The face amount of the debt issued, premiums and discounts received on debt issuances, are reported as other
financing sources and uses. Issuance costs, whether or not withheld from the actual debt proceeds received, are
reported as debt service expenditures.
Fund Balance
Fund balance is divided into five classifications based primarily on the extent to which the District is bound to
observe constraints imposed upon the use of the resources in the governmental funds. The classifications are
as follows:

- 44 -
NORTHWEST FIRE DISTRICT NOTES TO BASIC FINANCIAL STATEMENTS
YEAR ENDED JUNE 30, 2018
SUMMARY OF SIGNIFICANT ACCOUNTING POLICIES (Continued)
Fund Balance (Continued)
Nonspendable The nonspendable fund balance category includes amounts that cannot be spent because they
are not in spendable form, or are legally or contractually required to be maintained intact. The “not in
spendable form” criterion includes items that are not expected to be converted to cash.
Restricted Fund balance is reported as restricted when constraints placed on the use of resources are either
externally imposed by creditors (such as through debt covenants), grantors, contributors, laws or regulations
of other governments or is imposed by law through constitutional provisions or enabling legislation. Enabling
in legislation authorizes the District to assess, levy, charge, or otherwise mandate payment of resources and
includes a legally enforceable requirement that those resources be used only for the specific purposes stipulated
in the legislation. Legal enforceability means that the District can be compelled by an external party – such
as citizens, public interest groups, or the judiciary to use resources created by enabling legislation only for the
purposes specified by the legislation.
Committed The committed fund balance classification includes amounts that can be used only for the specific
purposes imposed by formal action (resolution) of the Board of Directors. Those committed amounts cannot
be used for any other purpose unless the Board of Directors removes or changes the specified use by taking
the same type of action (resolution) it employed to previously commit those accounts. In contrast to fund
balance that is restricted by enabling legislation, committed fund balance classification may be redeployed for
other purposes with appropriate due process. Constraints imposed on the use of committed amounts are
imposed by the Board of Directors, separate from the authorization to raise the underlying revenue; therefore,
compliance with these constraints is not considered to be legally enforceable. Committed fund balance also
incorporates contractual obligations to the extent that existing resources in the fund have been specifically
committed for use in satisfying those contractual requirements.
Assigned Amounts in the assigned fund balance classification are intended to be used by the District for
specific purposes but do not meet the criteria to be classified as restricted or committed. Assigned amounts
represent intended uses established by the Board of Directors or a District official delegated that authority by
District Charter, formal Board Action (resolution), or by Arizona Revised Statutes.
Unassigned Unassigned fund balance is the residual classification for the General Fund and includes all
spendable amounts not contained in the other classifications. In other governmental funds, the unassigned
classification is used only to report a deficit balance resulting from overspending for specific purposes for
which amounts had been restricted, committed, or assigned.
The District applies restricted resources first when expenditures are incurred for purposes for which either
restricted or unrestricted (committed, assigned, and unassigned) amounts are available. Similarly, within
unrestricted fund balance, committed amounts are reduced first followed by assigned, and then unassigned
amounts when expenditures are incurred for purposes for which amounts in any of the unrestricted fund balance
classifications could be used.

- 45 -
NORTHWEST FIRE DISTRICT NOTES TO BASIC FINANCIAL STATEMENTS
YEAR ENDED JUNE 30, 2018
SUMMARY OF SIGNIFICANT ACCOUNTING POLICIES (Continued)
Net Position
Net position represents the difference between assets, liabilities, and deferred outflows/inflows of resources.
Net investment in capital assets consists of capital assets, net of accumulated depreciation, reduced by the
outstanding balances of any borrowing used for the acquisition, construction or improvement of those assets.
Net position is reported as restricted when there are limitations imposed on their use either through enabling
legislation or through external restrictions imposed by creditors, grantors or laws or regulations of other
governments.
STEWARDSHIP, COMPLIANCE, AND ACCOUNTABILITY
Budgetary Information
The District budgets all funds in accordance with the requirements of state law. All funds are budgeted on the
modified accrual basis of accounting.
The Board of Directors adopts the original budget by resolution prior to the beginning of the fiscal year of the
District. The Board resolution authorizing budgeted expenditures for each fund sets the level by which actual
expenditures should not exceed budgeted expenditures. Total personal services, materials and services, capital
outlay, and other expenditures for the fund are the levels of control established by the resolution except for the
General Fund, where those same appropriation levels are defined by division levels. The detailed budget
document, however, is required to contain more specific detailed information for the above-mentioned
expenditure categories, and management may transfer budgeted expenditures within all funds without Board
approval. However, transfers between funds do require Board authorization, as do any transfers from
Contingency.
Budgeted expenditures lapse at year-end and may not be carried over to subsequent years.
Excess of Expenditures over Budget
At June 30, 2018, the District had expenditures in funds that exceeded the budget; however, this does not
constitute a violation of any legal provisions.

- 46 -
NORTHWEST FIRE DISTRICT NOTES TO BASIC FINANCIAL STATEMENTS
YEAR ENDED JUNE 30, 2018
SUMMARY OF SIGNIFICANT ACCOUNTING POLICIES (Continued)
NEW ACCOUNTING PRONOUNCEMENT
For the year ended June 30, 2018 the District implemented the provisions of GASB Statement No. 75, Accounting
and Financial Reporting for Postemployment Benefits Other than Pensions, as amended by GASB Statement No.
85, Omnibus 2017. GASB Statement No. 75 establishes standards for measuring and recognizing net assets or
liabilities, deferred outflows of resources, deferred inflows of resources, and expenses/expenditures related to
other postemployment benefits (OPEB) provided through defined benefit OPEB plans. In addition, Statement
No. 75 requires disclosure of information related to OPEB.
INTERFUND RECEIVABLES AND PAYABLES
For the year ended June 30, 2018, interfund balances are as follows:
General Fund $ - $ 207,103
Ambulance Fund 207,103 -
$ 207,103 $ 207,103
Due To Due From
At June 30, 2018, the Ambulance Fund had a negative cash balance in the pooled cash account. Negative cash
on deposit was reduced by interfund borrowing from other funds. The interfund borrowing is expected to be paid
within one year.
CHANGE IN ACCOUNTING PRINCIPLE
Net position as of July 1, 2017, has been restated as follows for the implementation of GASB Statement No.75,
Accounting and Financial Reporting for Postemployment Benefits Other Than Pensions (OPEB), as amended by
GASB Statement No.85, Omnibus 2017.
Net position as previously reported at June 30, 2017 $ 931,346 Prior period adjustment - implementation of GASB 75:
Net OPEB liability (measurement date as of June 30, 2016) (511,602)
Deferred outflows - District contributions made during fiscal
year 2017 71,606
Deferred inflows of OPEB (13,806)
Total prior period adjustment (453,802)
Net position as restated, July 1, 2017 $ 477,544

- 47 -
NORTHWEST FIRE DISTRICT NOTES TO BASIC FINANCIAL STATEMENTS
YEAR ENDED JUNE 30, 2018
CASH AND INVESTMENTS
The District maintains a cash and investment pool that is available for use by all funds. Each fund’s portion of
this pool is displayed on the Statement of Net Position as part of “cash and investments”. Cash and investments
are comprised of the following at June 30, 2018:
Cash
Cash on hand $ 500
Deposits with financial institutions 2,996,144
Investments
Local government investment pool 21,636,612
$ 24,633,256
Fair Value
Deposits
Custodial credit risk is the risk that in the event of bank failure, the District’s deposits may not be returned.
Arizona Revised Statutes require collateral for demand deposits, certificates of deposit and repurchase agreements
at 101 percent of all deposits not covered by federal depository insurance.
At June 30, 2018, deposits with financial institutions have a bank value of $3,234,452, and a book value of
$2,996,144. The difference of $238,308 represents deposits in transit, outstanding checks, and other reconciling
items at June 30, 2018. At June 30, 2018, none of the District’s bank balance was exposed to custodial credit risk
as uninsured and collateralized with securities held by the pledging financial institution’s trust department.
Investments
The District invests money into a Pima County Local Government Investment Pool. No oversight is provided for
the Pima County investment pool, nor does the structure of the pool provide for shares. Participation in the Pima
County investment pool is involuntary. Participants in the pool are not required to categorize the value of shares
in accordance with the fair value hierarchy.
The amounts invested with the County Treasurer were as follows at June 30, 2018:
Local Government Investment Pool Fair Value Rating Rating Agency
County Treasurer $ 21,636,612
$ 21,636,612
Not applicableUnrated

- 48 -
NORTHWEST FIRE DISTRICT NOTES TO BASIC FINANCIAL STATEMENTS
YEAR ENDED JUNE 30, 2018
CASH AND INVESTMENTS (Continued)
Fair Value Measurements
The District categorizes its fair value measurements within the fair value hierarchy established by generally
accepted accounting principles. The hierarchy is based on the valuation inputs used to measure the fair value of
an asset.
• Level 1 inputs are quoted prices in active markets for identical assets
• Level 2 inputs are significant other observable inputs
• Level 3 inputs are significant unobservable inputs
Credit risk
Arizona Revised Statutes have the following requirements for credit risk:
1) Commercial paper must be rated P1 by Moody’s Investors Service or A1 or better by Standard and Poor’s
rating service.
2) Corporate bonds, debentures, and notes must be rated A or better by Moody’s Investors Service or
Standard and Poor’s rating service.
3) Fixed income securities must carry one of the two highest ratings by Moody’s Investors Service and
Standard and Poor’s rating service. If only one of the above-mentioned services rates the security, it must
carry the highest rating of that service.
The formal investment policy of the District does not further restrict its investment choices.
Custodial credit risk – Investments
The District’s investment in the State and County Treasurer’s investment pools represents a proportionate interest
in the pool’s portfolio; however, the District’s portion is not identified with specific investments and is not subject
to custodial credit risk.
Concentration of credit risk
Arizona Revised Statutes do not include any requirements for concentration of credit risk.
Interest rate risk
Arizona Revised Statutes require that public monies invested in securities and deposits have a maximum maturity
of 5 years and that public operating fund monies invested in securities and deposits have a maximum maturity of
3 years. Investments in repurchase agreements must have a maximum maturity of 180 days.

- 49 -
NORTHWEST FIRE DISTRICT NOTES TO BASIC FINANCIAL STATEMENTS
YEAR ENDED JUNE 30, 2018
CASH AND INVESTMENTS (Continued)
The formal investment policy of the District explicitly limits investment maturities as a means of managing
exposure to fair value loss arising from interest rates.
At June 30, 2018, the District had the following investments in debt securities:
Local Government Investment Pool
County Treasurer $ 21,636,612
$ 21,636,612
0.74
Weighted Average
Maturity in YearsAmount
Foreign currency risk
Arizona Revised Statutes do not allow foreign investments.
The District does not have a formal investment policy with respect to custodial credit risk, concentration of credit
risk, or foreign currency risk for investments.
CAPITAL ASSETS
The changes in capital assets for the year ended June 30, 2018 were as follows:
NON-DEPRECIABLE
Land and improvements $ 5,822,720 $ 1,198,658 $ - $ 7,021,378
Construction in progress 51,714 237,242 - 288,956
Total non-depreciable 5,874,434 1,435,900 - 7,310,334
DEPRECIABLE
Buildings 41,351,019 11,018 (13,615) 41,348,422
Equipment 21,571,965 1,661,462 (280,735) 22,952,692
Total depreciable 62,922,984 1,672,480 (294,350) 64,301,114
ACCUMULATED DEPRECIATION
Buildings (11,748,604) (1,461,007) 7,274 (13,202,337)
Equipment (14,121,357) (2,055,696) 253,023 (15,924,030)
Total accumulated depreciation (25,869,961) (3,516,703) 260,297 (29,126,367)
Total capital assets being depreciated 37,053,023 (1,844,223) (34,053) 35,174,747
Capital assets, net of depreciation $ 42,927,457 $ (408,323) $ (34,053) $ 42,485,081
Beginning Ending
Balance Increases Decreases Balance

- 50 -
NORTHWEST FIRE DISTRICT NOTES TO BASIC FINANCIAL STATEMENTS
YEAR ENDED JUNE 30, 2018
LONG-TERM DEBT
General Obligation Bonds
General obligation bonds are direct obligations and pledge the full faith and credit of the District. The District
has outstanding general obligation bonds payable from a $10,950,000 issuance of callable bonds dated May 13,
2010 with interest rates ranging from 4.00-6.12%, an $8,215,000 issuance of 2014 refunding bonds dated
December 3, 2014 with interest rates ranging from 2.00-4.00%, an $8,300,000 issuance of 2016 refunding bonds
dated June 9, 2016 with interest rates ranging from 2.00-4.00%, and a $12,780,000 issuance dated August 3, 2017
with interest rates ranging from 2.00%-5.00%. The issuance of $10,950,000 was a single issuance split between
Build America Bonds ($8,000,000) and tax-exempt bonds ($2,950,000).
Principal and interest on all long-term debt is paid semi-annually. The bonds are repaid from limited property
taxes and used to fund station construction projects.
On November 8, 2016, voters of the District approved and authorized the issuance of general obligation bonds in
an amount not to exceed $23,610,000. As of June 30, 2018, $12,780,000 has been issued in relation to this
additional capacity, leaving $10,830,000 available to be issued in future years.
Annual debt service requirements to maturity for general obligation bonds are as follows:
2019 $ 2,470,000 $ 1,386,867 $ 3,856,867
2020 2,240,000 1,315,637 3,555,637
2021 2,310,000 1,245,841 3,555,841
2022 2,390,000 1,164,173 3,554,173
2023 2,485,000 1,069,303 3,554,303
2024-28 10,260,000 3,816,735 14,076,735
2029-33 6,485,000 1,834,318 8,319,318
2034-36 4,170,000 422,000 4,592,000
$ 32,810,000 $ 12,254,874 $ 45,064,874
June 30,
Ending
Governmental Activities
Principal Interest Total
Fiscal Year

- 51 -
NORTHWEST FIRE DISTRICT NOTES TO BASIC FINANCIAL STATEMENTS
YEAR ENDED JUNE 30, 2018
LONG-TERM DEBT (Continued)
Changes in Long-term Liabilities
Long-term liability activity for the year ended June 30, 2018, was as follows:
Due Within
One Year
Governmental activities
Series 2010A General Obligation Bonds $ 8,000,000 $ - $ (495,000) $ 7,505,000 $ 515,000
Series 2014 Refunding Bonds 6,340,000 - (835,000) 5,505,000 850,000
Series 2016 Refunding Bonds 8,070,000 - (690,000) 7,380,000 705,000
Series 2017 General Obligation Bonds - 12,780,000 (360,000) 12,420,000 400,000
Unamortized deferred amounts 1,230,893 1,530,428 (212,570) 2,548,751 -
23,640,893 14,310,428 (2,592,570) 35,358,751 2,470,000 Compensated absences 3,428,404 1,801,493 (1,609,057) 3,620,840 1,700,000 Net opeb liability - 310,536 - 310,536 - Net pension liability 40,206,755 - (1,242,746) 38,964,009 -
$ 67,276,052 $ 16,422,457 $ (5,444,373) $ 78,254,136 $ 4,170,000
Outstanding
July 1,
2017
Outstanding
June 30,
2018
Matured/
Redeemed
During YearIssued
The General Fund and Wildland Fund have typically been used to liquidate the liability for pensions/OPEB in
prior years.

- 52 -
NORTHWEST FIRE DISTRICT NOTES TO BASIC FINANCIAL STATEMENTS
YEAR ENDED JUNE 30, 2018
OPERATING LEASE
During the year, the District utilized five-year operating leases for its non-response vehicles. The total cost for
the leases was $111,601 for the year ended June 30, 2018. Future minimum lease payments for the leases are as
follows:
$ 114,204
114,204
114,204
114,204
114,204
$ 571,020
2022
2023
Total
Amounts
DueJune 30
Year Ending
2019
2020
2021
TRANSFERS
Interfund transfer activity for fiscal year ended June 30, 2018 is as follows:
General $ - $ 1,742,689
Capital Improvements 1,742,689 -
$ 1,742,689 $ 1,742,689
Transfers In Transfers Out
The transfers from the General Fund were made to record budgeted contributions to the Capital Improvement
Fund.
RISK MANAGEMENT
The District is exposed to various risks of loss related to torts; theft of, damage to, and destruction of assets; errors
and omissions; injuries to employees, and natural disasters. The District carries commercial insurance for all such
risks of loss, including workers’ compensation and employees’ health and accident insurance. Settled claims
resulting from these risks have not exceeded commercial insurance coverage in any of the past three fiscal years.
The District is self-insured for employee health coverage and reduces its ultimate risk through specific excess reinsurance. Reinsurance coverage is for specific losses more than $150,000 and aggregate losses in excess of 125% of estimated costs. Losses exceeding specific policy limits are the responsibility of the carrier. The District establishes a liability for claims that have been reported but not settled, as well as incurred but not reported; however, the District has not established a claim liability based on estimates of the ultimate cost of claims.

- 53 -
NORTHWEST FIRE DISTRICT
NOTES TO BASIC FINANCIAL STATEMENTS
YEAR ENDED JUNE 30, 2018
PENSIONS AND OTHER POSTEMPLOYMENT BENEFITS
Plan Descriptions
The District contributes to the pension plans described below. The plans are component units of the State of
Arizona.
At June 30, 2018, the District reported $4,838,688 of pension and other postemployment benefits (OPEB)
expenditures in the governmental funds for all plans to which it contributes.
A. Arizona State Retirement System
Plan Description. District employees not covered by the other pension plans described after this section
participate in the Arizona State Retirement System (ASRS). The ASRS administers a cost-sharing multiple-
employer defined benefit pension plan, a cost-sharing multiple-employer defined benefit health insurance
premium benefit (OPEB) plan, and a cost-sharing multiple-employer defined benefit long-term disability (OPEB)
plan. The Arizona State Retirement System Board governs the ASRS according to the provisions of A.R.S. Title
38, Chapter 5, Articles 2 and 2.1. The ASRS issues a publicly available financial report that includes its financial
statements and required supplementary information. The report is available on the ASRS website at
www.azasrs.gov.
Benefits Provided. The ASRS provides retirement, health insurance premium supplement, long-term disability,
and survivor benefits. State statute establishes benefit terms. Retirement benefits are calculated on the basis of
age, average monthly compensation, and service credit as follows:
Retirement Initial
Membership Date:
Before July 1, 2011 On or After July 1, 2011
Years of service and
age required to
receive benefit
Sum of years and age equals 80
10 years age 62
5 years age 50*
Any years, age 65
30 years, age 55
25 years, age 60
10 years, age 62
5 years, age 50*
Any years, age 65
Final average salary is
based on
Highest 36 months of last
120 months
Highest 60 months of last
120 months
Benefit percent per
year of service
2.1% to 2.3% 2.1% to 2.3%
*With actuarially reduced benefits

- 54 -
NORTHWEST FIRE DISTRICT NOTES TO BASIC FINANCIAL STATEMENTS
YEAR ENDED JUNE 30, 2018
PENSIONS AND OTHER POSTEMPLOYMENT BENEFITS (Continued)
Retirement benefits for members who joined the ASRS prior to September 13, 2013, are subject to automatic
cost-of-living adjustments based on excess investment earnings. Members with a membership date on or after
September 13, 2013, are not eligible for cost-of-living adjustments. Survivor benefits are payable upon a
members’ death. For retired members, the survivor benefit is determined by the retirement benefit option chosen.
For all other members, the beneficiary is entitled to the member’s account balance that includes the member’s
contributions and employer’s contributions, plus interest earned.
Health insurance premium benefits are available to retired or disabled members with 5 years of credited service.
The benefits are payable only with respect to allowable health insurance premiums for which the member is
responsible. For members with 10 or more years of service, benefits range from $150 per month to $260 per
month depending on the age of the member and dependents. For members with 5 to 9 years of service, the benefits
are the same dollar amounts as above multiplied by a vesting fraction based on completed years of service.
Active members are eligible for a monthly long-term disability benefit equal to two-thirds of monthly earnings.
Members receiving benefits continue to earn service credit up to their normal retirement dates. Members with
long-term disability commencement dates after June 30, 1999, are limited to 30 years of service or the service on
record as of the effective disability date if their service is greater than 30 years.
Contributions. In accordance with state statutes, annual actuarial valuations determine active member and
employer contribution requirements. The combined active member and employer contribution rates are expected
to finance the cost of benefits employees earn during the year, with an additional amount to finance any unfunded
accrued liability. For the current fiscal year, active ASRS members were required by statute to contribute at the
actuarially determined rate of 11.50 percent (11.34 percent for retirement and 0.16 percent for long-term
disability) of the members’ annual covered payroll, and the District was required by statute to contribute at the
actuarially determined rate of 11.50 percent (10.90 percent for retirement, 0.44 percent for health insurance
premium benefit, and 0.16 percent for long-term disability) of the members’ annual covered payroll. In addition,
the District was required by statute to contribute at the actuarially determined rate of 9.49 percent (9.26 percent
for retirement, .10 percent for health insurance premium benefit, and 0.13 percent for long-term disability) of
annual covered payroll of retired members who worked in positions that would typically be filled by an employee
who contributes to ASRS. District contributions to the pension, health insurance premium benefit, and long-term
disability plans for the year ended June 30, 2018, were $225,573, $9,106, and $3,311, respectively.
Liability. At June 30, 2018, the District reported a liability of $3,667,073 for its proportionate share of the net
liability of the ASRS. The net liability was measured as of June 30, 2017. The total liability used to calculate the
net liability was determined using update procedures to roll forward the total liability from an actuarial valuation
as of June 30, 2016, to the measurement date of June 30, 2017. The total pension liability as of June 30, 2017,
reflects a change in actuarial assumption related to changes in loads for future potential permanent benefit
increases.

- 55 -
NORTHWEST FIRE DISTRICT NOTES TO BASIC FINANCIAL STATEMENTS
YEAR ENDED JUNE 30, 2018
PENSIONS AND OTHER POSTEMPLOYMENT BENEFITS (Continued)
The District proportion of the net liability was based on the District’s actual contributions to the plan relative to
the total of all participating employers’ contributions for the year ended June 30, 2017. The District’s proportions
measured as of June 30, 2018, and the change from its proportions measured as of June 30, 2016, were:
ASRS
Pension 10.78% -0.07%
Health insurance premium benefit 0.56% 0.06%
Long-term disability 0.14% 0.02%
Proportion
June 30, 2017
Increase (Decrease) from
June 30, 2016
The net assets and net liabilities measured as of June 30, 2018, will reflect changes of actuarial assumptions based
on the results of an actuarial experience study for the 5-year period ended June 30, 2016. The change in the
District net assets and net liabilities as a result of these changes is not known.
Expense and Deferred Outflows/Inflows of Resources. For the year ended
June 30, 2018, the District recognized expense for ASRS of $94,524, and reported deferred outflows of resources
and deferred inflows of resources related to pensions from the following sources:
Differences between expected and actual experience $ - $ 109,959
Changes in assumptions or other inputs 159,269 109,652
Net difference between projected and actual earnings
on pension plan investments 26,327 -
Changes in proportion and differences between
contributions and proportionate share of contributions - 31,281
Contributions subsequent to the measurement date 225,573 -
Total $ 411,169 $ 250,892
Deferred
Inflows of
Resources
Deferred
Outflows of
Resources
The deferred outflows of resources related to ASRS pensions resulting from contributions subsequent to the
measurement date as reported in the table above will be recognized as a reduction of the net pension liability in
the year ended June 30, 2019. Other amounts reported as deferred outflows of resources and deferred inflows of
resources related to ASRS pensions will be recognized in pension expense as follows:
Year Ending June 30:
2019 $ (163,111)
2020 139,695
2021 42,474
2022 (84,354)
2023 -
Thereafter -

- 56 -
NORTHWEST FIRE DISTRICT NOTES TO BASIC FINANCIAL STATEMENTS
YEAR ENDED JUNE 30, 2018
PENSIONS AND OTHER POSTEMPLOYMENT BENEFITS (Continued)
Actuarial Assumptions. The significant actuarial assumptions used to measure the total ASRS pension
liability are as follows:
Actuarial valuation date June 30, 2016
Actuarial roll forward date June 30, 2017
Actuarial cost method Entry age normal
Investment rate of return 8.0%
Projected salary increases 3.0-6.75%
Inflation 3.0%
Permanent base increases Included
Mortality rates 1994 GAM Scale BB
The actuarial assumptions used in the June 30, 2016 valuation were based on the results of an actuarial
experience study for the five-year period ended June 30, 2012.
The long-term expected rate of return on ASRS plan investments was determined to be 8.70 percent using
a building-block method in which best-estimate ranges of expected future real rates of return (expected
returns, net of plan investment expense and inflation) are developed for each major asset class. These ranges
are combined to produce the long-term expected rate of return by weighting the expected future real rates
of return by the target asset allocation percentage and by adding expected inflation. The target allocation
and best estimates of arithmetic real rates of return for each major asset class of ASRS are summarized in
the following table:
Long-Term
Target Expected Real
Asset Class Allocation Rate of Return
Equity 58% 6.73%
Fixed income 25% 3.70%
Real estate 10% 4.25%
Commodities 2% 3.84%
Multi-asset class 5% 3.41%
Total 100%

- 57 -
NORTHWEST FIRE DISTRICT NOTES TO BASIC FINANCIAL STATEMENTS
YEAR ENDED JUNE 30, 2018
PENSIONS AND OTHER POSTEMPLOYMENT BENEFITS (Continued)
Discount Rate. The discount rate used to measure the ASRS total pension liability was 8.0 percent, which
is less than the long-term expected rate of return of 8.70 percent. The projection of cash flows used to
determine the discount rate assumed that contributions from participating employers will be made based on
the actuarially determined rates based on the ASRS Board’s funding policy, which establishes the
contractually required rate under Arizona statute. Based on those assumptions, the plans’ fiduciary net
position was projected to be available to make all projected future benefit payments of current plan
members. Therefore, the long-term expected rate of return on plan investments was applied to all periods
of projected benefit payments to determine the total liability.
Sensitivity of the Proportionate Share of the Net Liability to Changes in the Discount Rate. The
following presents the District’s proportionate share of the net liability calculated using the discount rate of
8.0 percent, as well as what the proportionate share of the net pension liability would be if it were calculated
using a discount rate that is 1-percentage-point lower or 1-percentage-point higher than the current rate:
District proportionate share of the
net liability $ 4,706,752 $ 3,667,073 $ 2,798,332
1%
Decrease
(7.0%)
Current
Discount Rate
(8.0%)
1%
Increase
(9.0%)
Pension Plan Fiduciary Net Position. Detailed information about the plans’ fiduciary net position is
available in the separately issued ASRS financial report. The report is available on the ASRS website at
www.azasrs.gov.
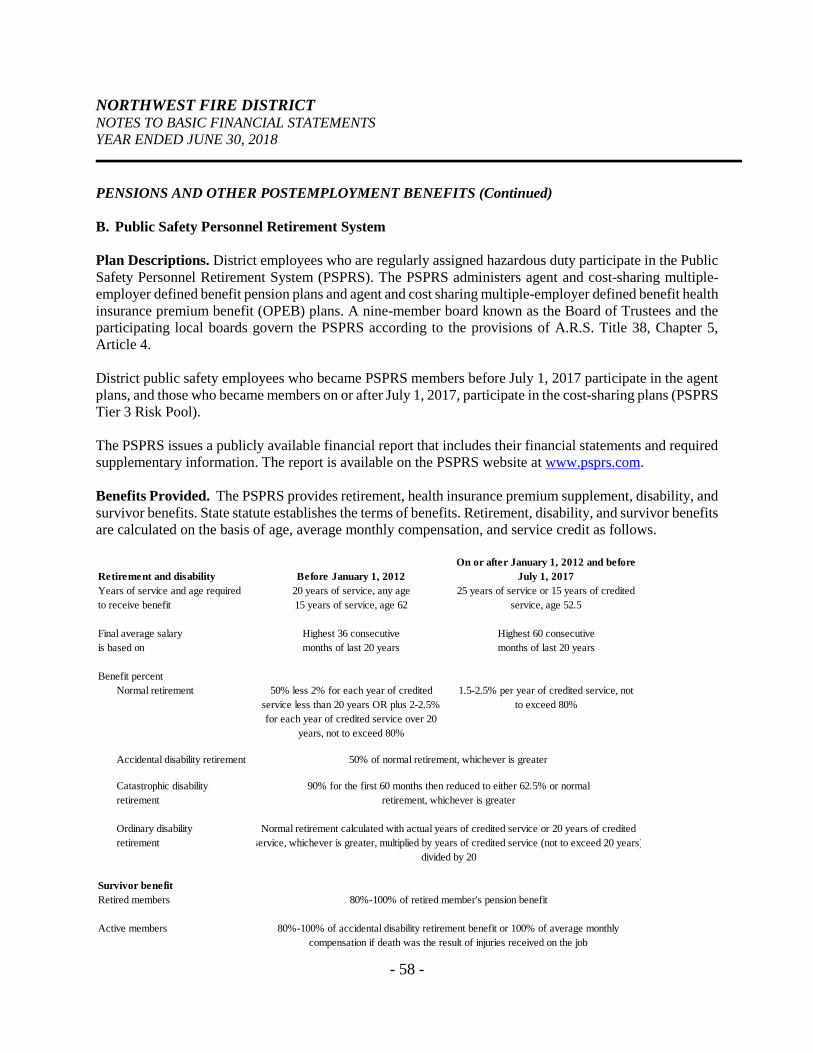
- 58 -
NORTHWEST FIRE DISTRICT NOTES TO BASIC FINANCIAL STATEMENTS
YEAR ENDED JUNE 30, 2018
PENSIONS AND OTHER POSTEMPLOYMENT BENEFITS (Continued)
B. Public Safety Personnel Retirement System
Plan Descriptions. District employees who are regularly assigned hazardous duty participate in the Public
Safety Personnel Retirement System (PSPRS). The PSPRS administers agent and cost-sharing multiple-
employer defined benefit pension plans and agent and cost sharing multiple-employer defined benefit health
insurance premium benefit (OPEB) plans. A nine-member board known as the Board of Trustees and the
participating local boards govern the PSPRS according to the provisions of A.R.S. Title 38, Chapter 5,
Article 4.
District public safety employees who became PSPRS members before July 1, 2017 participate in the agent
plans, and those who became members on or after July 1, 2017, participate in the cost-sharing plans (PSPRS
Tier 3 Risk Pool).
The PSPRS issues a publicly available financial report that includes their financial statements and required
supplementary information. The report is available on the PSPRS website at www.psprs.com.
Benefits Provided. The PSPRS provides retirement, health insurance premium supplement, disability, and
survivor benefits. State statute establishes the terms of benefits. Retirement, disability, and survivor benefits
are calculated on the basis of age, average monthly compensation, and service credit as follows.
On or after January 1, 2012 and before
Retirement and disability Before January 1, 2012 July 1, 2017
Years of service and age required 20 years of service, any age 25 years of service or 15 years of credited
to receive benefit 15 years of service, age 62 service, age 52.5
Final average salary Highest 36 consecutive Highest 60 consecutive
is based on months of last 20 years months of last 20 years
Benefit percent
Normal retirement 50% less 2% for each year of credited 1.5-2.5% per year of credited service, not
service less than 20 years OR plus 2-2.5% to exceed 80%
for each year of credited service over 20
years, not to exceed 80%
Accidental disability retirement
Catastrophic disability
retirement
Ordinary disability
retirement
Survivor benefit
Retired members
Active members
50% of normal retirement, whichever is greater
90% for the first 60 months then reduced to either 62.5% or normal
retirement, whichever is greater
Normal retirement calculated with actual years of credited service or 20 years of credited
service, whichever is greater, multiplied by years of credited service (not to exceed 20 years)
divided by 20
80%-100% of retired member's pension benefit
80%-100% of accidental disability retirement benefit or 100% of average monthly
compensation if death was the result of injuries received on the job

- 59 -
NORTHWEST FIRE DISTRICT NOTES TO BASIC FINANCIAL STATEMENTS
YEAR ENDED JUNE 30, 2018
PENSIONS AND OTHER POSTEMPLOYMENT BENEFITS (Continued)
Retirement and survivor benefits are subject to automatic cost-of-living adjustments based on inflation. In
addition, the Legislature may enact permanent one-time benefit increases after a Joint Legislature Budget
Committee analysis of the increases effects on the plan. PSPRS also provides temporary disability benefits
of 50 percent of the member's compensation for up to 12 months.
Health insurance premium benefits are available to retired or disabled members with 5 years of credited
service. The benefits are payable only with respect to allowable health insurance premiums for which the
member is responsible. Benefits range from $150 per month to $260 per month depending on the age of
the member and dependents.
Employees Covered by Benefit Terms. At June 30, 2018, the following employees were covered by the
agent plans’ benefit terms:
Pension
Inactive employees or beneficiaries
currently receiving benefits 35 35
Inactive employees entitled to but not
yet receiving benefits 24 10
Active employees 183 183
Total 242 228
Health
PSPRS
Contributions and Annual OPEB Cost. State statutes establish the pension contribution requirements for
active PSPRS employees. In accordance with state statutes, annual actuarial valuations determine employer
contribution requirements for PSPRS pension and health insurance premium benefits. The combined active
member and employer contribution rates are expected to finance the costs of benefits employees earn during
the year, with an additional amount to finance any unfunded accrued liability. Contribution rates for the
year ended June 30, 2018, are indicated below. Rates are a percentage of active members’ annual covered
payroll.
District Health insurance
Pension premium benefit
Active members - pension 7.65%
District:
Pension 30.36% 0.39%
Tier 3 Risk Pool 9.94% 9.68% 0.26%
Pension
Active member
Also, statute required the District to contribute at the actuarially determined rate of 9.94 percent (9.68
percent for pension and .26 percent for health insurance premium benefit) of the annual covered payroll of
employees who were PSPRS Tier 3 Risk Pool members, in addition to the required contributions to the
PSPRS Tier 3 Risk Pool.

- 60 -
NORTHWEST FIRE DISTRICT NOTES TO BASIC FINANCIAL STATEMENTS
YEAR ENDED JUNE 30, 2018
PENSIONS AND OTHER POSTEMPLOYMENT BENEFITS (Continued)
In addition, statute required the District to contribute at the actuarially determined rate of 14.77 percent for
the PSPRS of annual covered payroll (14.60% for pension and .17% for health insurance) of retired
members who worked in positions that would typically be filled by an employee who contributes to the
PSPRS.
District contributions to the plans for the year ended June 30, 2018, were:
Pension
PSPRS $ 4,529,092 $ 71,606
Health insurance
premium benefit
Pension Liability. At June 30, 2018, the District reported the following assets and liabilities.
PSPRS $ 35,296,936 $ 310,536
Net pension
(asset) liability
Net OPEB
(asset) liability
The net assets and net liabilities were measured as of June 30, 2017, and the total liability used to calculate
the net asset or liability was determined by an actuarial valuation as of that date. The total liabilities as of
June 30, 2017, reflect changes of actuarial assumptions based on the results of an actuarial experience study
for the 5-year period ended June 30, 2016, including decreasing the investment rate of return from 7.5
percent to 7.4 percent, decreasing the wage inflation from 4 percent to 3.5 percent, and updating mortality,
withdrawal, disability, and retirement assumptions. The total pension liabilities for PSPRS also reflect
changes of benefit terms for legislation that changed benefit eligibility and multipliers for employees who
became members on or after January 1, 2012, and before July 1, 2017, and a court decision that decreased
the contribution rates for the employees who became members before July 20, 2011. The court decision
will also affect the PSPRS net pension liabilities measured as of June 30, 2018, because of refunds of excess
member contributions. The change in the District’s PSPRS net pension liabilities as a result of the refunds
is not known.

- 61 -
NORTHWEST FIRE DISTRICT NOTES TO BASIC FINANCIAL STATEMENTS
YEAR ENDED JUNE 30, 2018
PENSIONS AND OTHER POSTEMPLOYMENT BENEFITS (Continued)
Actuarial Assumptions. The significant actuarial assumptions used to measure the total pension/OPEB
liability are as follows:
Actuarial valuation date
Actuarial cost methodActuarial assumptions:
Investment rate of return Wage inflation 3.5% for pensions/not applicable for OPEB
Price inflation 2.5% for pensions/not applicable for OPEB
Permanent benefit increase Included for pensions/not applicable for OPEB
Mortality rates
Healthcare cost trend rate
RP-2014 tables using MP-2016 improvement
scale with adjustments to match current experience
Not applicable
June 30, 2017
Entry Age Normal
7.40%
Actuarial assumptions used in the June 30, 2017, valuation were based on the results of an actuarial
experience study for the 5-year period ended June 30, 2016.
The long-term expected rate of return on PSPRS plan investments was determined to be 7.40 percent using
a building-block method in which best-estimate ranges of expected future real rates of return (expected
returns, net of plan investment expenses and inflation) are developed for each major asset class. The target
allocation and best estimates of geometric real rates of return for each major asset class are summarized in
the following table:
Long-Term Expected
Target Geometric Real
Asset Class Allocation Rate of Return
Short-term investments 2% 0.25%
Absolute return 2% 3.75%
Risk parity 4% 5.00%
Fixed income 5% 1.25%
Real assets 9% 4.52%
GTAA 10% 3.96%
Private equity 12% 6.75%
Real estate 10% 3.75%
Credit opportunities 16% 5.83%
Non-U.S. equity 14% 8.70%
U.S. equity 16% 7.60%
Total 100%

- 62 -
NORTHWEST FIRE DISTRICT NOTES TO BASIC FINANCIAL STATEMENTS
YEAR ENDED JUNE 30, 2018
PENSIONS AND OTHER POSTEMPLOYMENT BENEFITS (Continued)
Discount Rates. At June 30, 2017, the discount rate of used to measure the PSPRS total pension/OPEB
liabilities was 7.4 percent, which was a decrease of .1 percent from the discount rate used as of June 30,
2016. The projection of cash flows used to determine the PSPRS discount rates assumed that plan member
contributions will be made at the current contribution rate and that employer contributions will be made at
rates equal to the difference between the actuarially determined contribution rates and the member rate.
Based on those assumptions, the plans’ fiduciary net position was projected to be available to make all
projected future benefit payments of current plan members. Therefore, the long-term expected rate of return
on plan investments was applied to all periods of projected benefit payments to determine the total
pension/OPEB liability.
Changes in the net pension/OPEB liability - PSPRS.
Balances at June 30, 2017 $ 86,680,657 $ 52,517,068 $ 34,163,589 $ 2,143,386 $ 1,631,784 $ 511,602
Changes for the year:
Service cost 3,472,275 - 3,472,275 45,981 - 45,981
Interest on the total liability 6,536,478 - 6,536,478 160,815 - 160,815
Changes of benefit terms 636,888 - 636,888 2,012 - 2,012
Differences between expected and actual
experience in the measurement of the
total liability (265,508) - (265,508) (43,536) - (43,536)
Changes of assumptions or other inputs - - - (118,400) - (118,400)
Contributions - employer 1,907,557 3,100,361 (1,192,804) - 57,048 (57,048)
Contributions - employee - 1,789,724 (1,789,724) - - -
Net investment income - 6,285,132 (6,285,132) - 192,595 (192,595)
Benefit payments, including refunds of
employee contributions (2,527,515) (2,527,515) - (44,355) (44,355) -
Administrative expense - (56,013) 56,013 - (1,705) 1,705
Other - 35,139 (35,139) - - -
Net changes 9,760,175 8,626,828 1,133,347 2,517 203,583 (201,066)
Balances at June 30, 2018 $ 96,440,832 $ 61,143,896 $ 35,296,936 $ 2,145,903 $ 1,835,367 $ 310,536
Plan Fiduciary
Net Position
Net Pension
Liability
Health insurance premium benefit
Increase (decrease)
Net OPEB
Liability Net Position Liability
Pension
Total OPEB Plan Fiduciary
Increase/Decrease
Total Pension
Liability

- 63 -
NORTHWEST FIRE DISTRICT NOTES TO BASIC FINANCIAL STATEMENTS
YEAR ENDED JUNE 30, 2018
PENSIONS AND OTHER POSTEMPLOYMENT BENEFITS (Continued)
Sensitivity of the Net Pension Liability to Changes in the Discount Rate. The following presents the
District net pension/OPEB liabilities calculated using the discount rate of 7.4 percent, as well as what the
net pension/OPEB liability would be if calculated using a discount rate that is 1-percentage-point lower or
1-percentage-point higher than the current rate:
Rate 6.40% 7.40% 8.40%
Net pension liability $ 51,270,949 $ 35,296,936 $ 22,516,481
Net OPEB liability 616,892 310,536 58,823
1%
Decrease
Current
Discount
Rate
1%
Increase
Plan Fiduciary Net Position. Detailed information about the plans’ fiduciary net position is available in
the separately issued PSPRS financial report. The report is available on the PSPRS website at
www.psprs.com.
Expense. For the year ended June 30, 2018, the District recognized $5,901,258 as pension expense and
$55,062 as OPEB expense.
Pension Deferred Outflows/Inflows of Resources. At June 30, 2018, the District reported deferred
outflows of resources and deferred inflows of resources related to pensions and OPEB from the following
sources:
Differences between expected and actual experience $ 823,430 $ 1,805,529 $ - $ 38,510
Changes of assumptions or other inputs 6,304,576 - - 104,731
Net difference between projected and actual earnings on
pension plan investments 739,113 - (55,839) -
Contributions subsequent to the measurement date 4,529,092 - 71,606 -
Total $ 12,396,211 $ 1,805,529 $ 15,767 $ 143,241
Deferred
Outflows of
Resources
Deferred
Inflows of
Resources Resources Resources
Health Insurance Premium BenefitPension
Deferred Deferred
Outflows of Inflows of

- 64 -
NORTHWEST FIRE DISTRICT NOTES TO BASIC FINANCIAL STATEMENTS
YEAR ENDED JUNE 30, 2018
PENSIONS AND OTHER POSTEMPLOYMENT BENEFITS (Continued)
The amounts reported as deferred outflows of resources related to pension and OPEB resulting from
contributions subsequent to the measurement date will be recognized as a reduction of the net pension
liability in the year ended June 30, 2019. Other amounts reported as deferred outflows of resources and
deferred inflows of resources related to pensions and OPEB will be recognized as expenses as follows:
Year Ending June 30:
2019 $ 1,051,061 $ (32,655)
2020 1,485,669 (32,655)
2021 1,098,303 (32,655)
2022 363,032 (32,654)
2023 814,738 (18,695)
Thereafter 1,248,787 (49,766)
Total $ 6,061,590 $ (199,080)
Net Deferred
Outflows of
Resources
Pension OPEB
Net Deferred
Inflows of
Resources

- 65 -
REQUIRED SUPPLEMENTARY INFORMATION

- 66 -
This page intentionally left blank

- 67 -
NORTHWEST FIRE DISTRICT SCHEDULE OF CHANGES IN THE NET PENSION/OPEB LIABILITY AND RELATED RATIOS –
AGENT PLANS (PSPRS)
LAST TEN FISCAL YEARS*
PSPRS
Total pension liability
Service cost $ 3,472,275 $ 2,811,831 $ 2,617,288 $ 2,668,263
Interest 6,536,478 5,383,157 4,955,203 4,439,431
Changes of benefit terms 636,888 7,594,973 - 358,350
Differences between expected and actual experience (265,508) 1,076,494 (285,514) (2,412,025)
Changes of assumptions 1,907,557 3,546,513 - 3,348,983
Benefit payments, including refunds of employee contributions (2,527,515) (1,803,276) (2,061,936) (1,552,405)
Net change in total pension liability 9,760,175 18,609,692 5,225,041 6,850,597
Total pension liability - beginning 86,680,657 68,070,965 62,845,924 55,995,327
Total pension liability - ending (a) $ 96,440,832 $ 86,680,657 $ 68,070,965 $ 62,845,924
Plan fiduciary net position
Contributions - employer $ 3,100,361 $ 3,036,705 $ 2,398,854 $ 2,246,073
Contributions - employee 1,789,724 1,741,594 1,637,449 1,429,528
Net investment income 6,285,132 290,856 1,691,663 5,314,867
Benefit payments, including refunds of employee contributions (2,527,515) (1,803,276) (2,061,936) (1,552,405)
Administrative expense (56,013) (42,253) (41,661) (42,804)
Other 35,139 444,170 (63,639) 126,681
Net change in plan fiduciary net position 8,626,828 3,667,796 3,560,730 7,521,940
Plan fiduciary net position - beginning 52,517,068 48,849,272 45,288,542 37,766,602
Plan fiduciary net position - ending (b) $ 61,143,896 $ 52,517,068 $ 48,849,272 $ 45,288,542
District net pension liability - ending (a)-(b) 35,296,936 34,163,589 19,221,693 17,557,382
Plan fiduciary net position as a percentage of the
total pension liability 63.40% 60.59% 71.76% 72.06%
Covered-employee payroll $ 14,832,442 $ 14,382,769 $ 13,502,977 $ 13,421,021
District net pension liability as a percentage of
covered employee payroll 237.97% 237.53% 142.35% 130.82%
2018 20152017 2016
*- Fiscal year 2015 was the 1st year of implementation, therefore only four years are displayed.
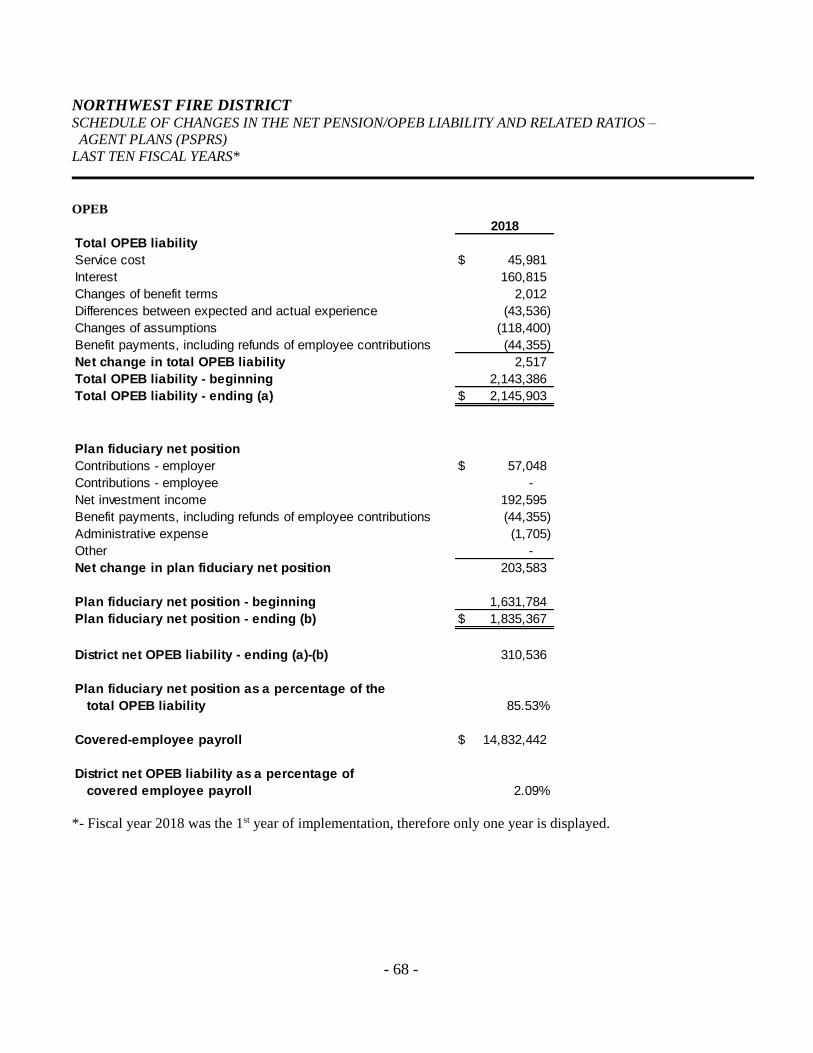
- 68 -
NORTHWEST FIRE DISTRICT SCHEDULE OF CHANGES IN THE NET PENSION/OPEB LIABILITY AND RELATED RATIOS –
AGENT PLANS (PSPRS)
LAST TEN FISCAL YEARS*
OPEB
Total OPEB liability
Service cost $ 45,981
Interest 160,815
Changes of benefit terms 2,012
Differences between expected and actual experience (43,536)
Changes of assumptions (118,400)
Benefit payments, including refunds of employee contributions (44,355)
Net change in total OPEB liability 2,517
Total OPEB liability - beginning 2,143,386
Total OPEB liability - ending (a) $ 2,145,903
Plan fiduciary net position
Contributions - employer $ 57,048
Contributions - employee -
Net investment income 192,595
Benefit payments, including refunds of employee contributions (44,355)
Administrative expense (1,705)
Other -
Net change in plan fiduciary net position 203,583
Plan fiduciary net position - beginning 1,631,784
Plan fiduciary net position - ending (b) $ 1,835,367
District net OPEB liability - ending (a)-(b) 310,536
Plan fiduciary net position as a percentage of the
total OPEB liability 85.53%
Covered-employee payroll $ 14,832,442
District net OPEB liability as a percentage of
covered employee payroll 2.09%
2018
*- Fiscal year 2018 was the 1st year of implementation, therefore only one year is displayed.

- 69 -
NORTHWEST FIRE DISTRICT SCHEDULE OF CONTRIBUTIONS – AGENT RETIREMENT PLAN (PSPRS)
LAST TEN FISCAL YEARS*
Year Contribution
Ended Deficiency
June 30 (Excess)
2014 $ 2,246,073 $ 2,246,073 - $ 13,421,021 16.74%
2015 2,398,854 2,398,854 - 13,502,977 17.77%
2016 3,036,705 3,036,705 - 14,382,769 21.11%
2017 3,100,361 3,100,361 - 14,832,442 20.90%
Actual
Contribution
as a % of
Covered PayrollPayroll
Covered
Actuarially
Determined
Contribution
Actual
Contribution
*- Fiscal year 2015 was the 1st year of implementation, therefore only four years are displayed.
Year Contribution
Ended Deficiency
June 30 (Excess)
2017 $ 57,048 $ 57,048 - $ 14,832,442 0.38%
Actual
Actuarially
Covered
Contribution
Determined Actual as a % of
Contribution Contribution Payroll Covered Payroll
*- Fiscal year 2017 was the 1st year of implementation, therefore only one year is displayed.
Notes to Schedule:
Actuarial determined contribution rates for PSPRS are calculated as of June 30 two years prior to the end of the
fiscal year in which contributions are made. The actuarial methods and assumptions used to establish the
contribution requirements are as follows:
Actuarial cost method: Entry Age Normal
Amortization method: Level percent-of-pay, closed
Remaining amortization period: 20 years; if the actuarial value of assets exceeded the actuarial accrued
liability, the excess was amortized over an open period of 19 years and
applied as a credit to reduce the normal cost which otherwise would be
payable.
Asset valuation method: 7-year smoothed market value; 80%/120% market corridor
Wage growth: In the 2014 actuarial valuation, wage growth was decreased from 4.50% to
4.00%. In the 2013 actuarial valuation, wage growth was decreased from
5.0% to 4.5%.
Projected Salary Increases: In the 2014 actuarial valuation, projected salary increases were decreased
from 4.5% - 8.5% to 4.0% - 8.0%. In the 2013 actuarial valuation, projected
salary increases were decreased from 5.0% - 9.0% to 4.5% - 8.5%.

- 70 -
NORTHWEST FIRE DISTRICT SCHEDULE OF CONTRIBUTIONS – AGENT RETIREMENT PLAN (PSPRS)
LAST TEN FISCAL YEARS*
Notes to Schedule (Continued):
Investment rate of return: PSPRS members with initial membership date before July 1, 2017: In the
2016 actuarial valuation the investment rate of return was decreased from
7.85% to 7.5%. In the 2013 actuarial valuation, the investment rate of return
was decreased from 8.0% to 7.85%.
PSPRS members with initial membership on or after July 1, 2017: 7%.
Retirement age: Experience-based table of rates that is specific to the type of eligibility
condition. Last updated for the 2012 valuation pursuant to an experience
study of the period July 1, 2006 – June 30, 2011.
Mortality: RP-2000 mortality table (adjusted by 105% for both males and females).
Arizona courts have ruled that provisions of a 2011 law changing the mechanism for funding permanent
pension benefit increases and increased employee pension contribution rates were unconstitutional or a
breach of contract because those provisions apply to individuals who were members as of the law’s
effective date. As a result, PSPRS changed benefit terms to reflect the prior mechanism for funding
permanent benefit increases for those members and revised actuarial assumptions to explicitly value
future permanent benefit increases. PSPRS also reduced those members’ employee contribution rates.
These changes are reflected in the plans’ pension liabilities for fiscal year 2015 (measurement date 2014)
for members who were retired as of the law’s effective date and fiscal year 2018 (measurement date
2017) for members who retired or will retire after the law’s effective date. These changes also increased
the PSPRS-required pension contributions beginning in fiscal year 2016 for members who were retired
as of the law’s effective date. These changes will increase the PSPRS-required contributions beginning
in fiscal year 2019 for members who retired or will retire after the law’s effective date. Also, the District
refunded excess employee contributions to PSPRS members. PSPRS allowed the District to reduce its
actual employer contributions for the refund amounts. As a result, the District pension contributions
were less than the actuarially or statutorily determined contributions for 2018.

- 71 -
NORTHWEST FIRE DISTRICT SCHEDULE OF PROPORTIONATE SHARE OF THE NET PENSION LIABILITY (ASRS)
LAST TEN FISCAL YEARS*
District's proportion of the net pension
liability (asset) 0.024% 0.024% 0.024% 0.024%
District's proportionate share of the net
pension liability (asset) $ 4,706,752 $ 3,667,073 $ 3,712,840 $ 3,536,641
District's covered-employee payroll $ 2,317,699 $ 2,233,032 $ 2,202,819 $ 2,068,738
District's proportionate share of the net
pension liability (asset) as a percentage
of its covered-employee payroll 203.08% 164.22% 168.55% 170.96%
Plan fiduciary net position as a
percentage of the total pension liability 69.92% 67.06% 68.35% 69.49%
2018 201520162017
*- Fiscal year 2015 was the 1st year of implementation, therefore only four years are displayed.
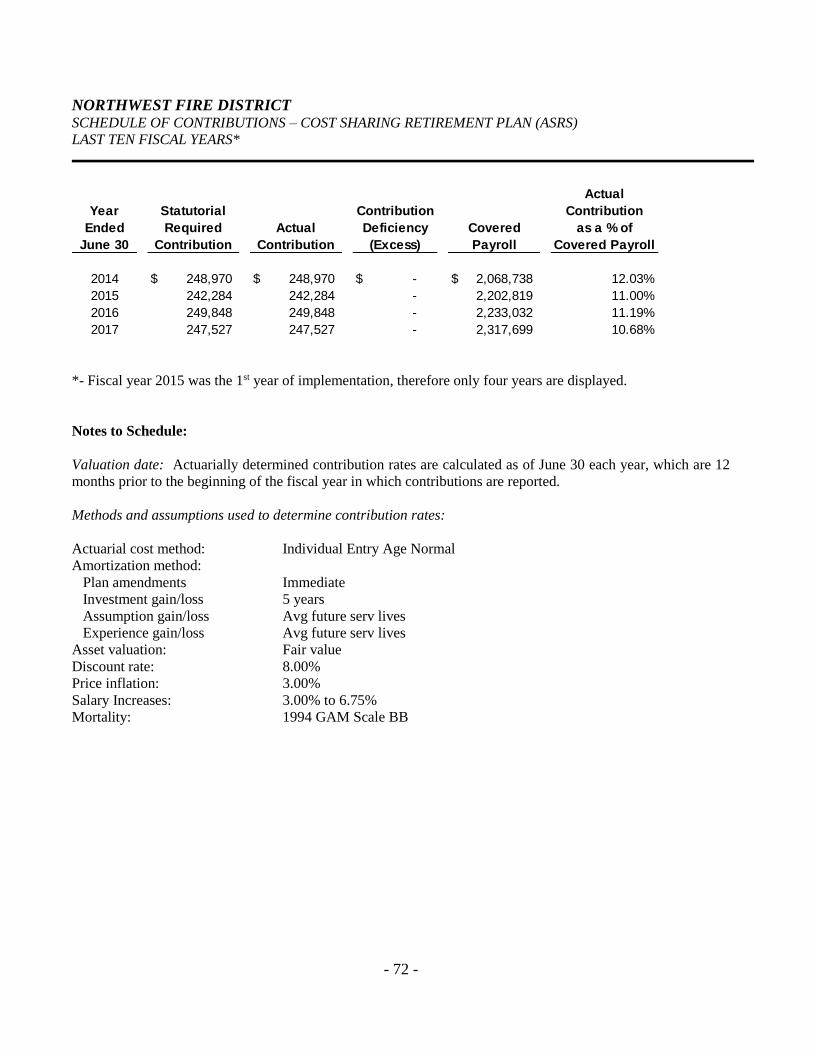
- 72 -
NORTHWEST FIRE DISTRICT SCHEDULE OF CONTRIBUTIONS – COST SHARING RETIREMENT PLAN (ASRS)
LAST TEN FISCAL YEARS*
Year
Ended
June 30
2014 $ 248,970 $ 248,970 $ - $ 2,068,738 12.03%
2015 242,284 242,284 - 2,202,819 11.00%
2016 249,848 249,848 - 2,233,032 11.19%
2017 247,527 247,527 - 2,317,699 10.68%
Actual
Statutorial Contribution
Covered
Contribution
Required Actual Deficiency as a % of
Contribution Contribution (Excess) Payroll Covered Payroll
*- Fiscal year 2015 was the 1st year of implementation, therefore only four years are displayed.
Notes to Schedule:
Valuation date: Actuarially determined contribution rates are calculated as of June 30 each year, which are 12
months prior to the beginning of the fiscal year in which contributions are reported.
Methods and assumptions used to determine contribution rates:
Actuarial cost method: Individual Entry Age Normal
Amortization method:
Plan amendments Immediate
Investment gain/loss 5 years
Assumption gain/loss Avg future serv lives
Experience gain/loss Avg future serv lives
Asset valuation: Fair value
Discount rate: 8.00%
Price inflation: 3.00%
Salary Increases: 3.00% to 6.75%
Mortality: 1994 GAM Scale BB

See Note to Required Supplementary Information
- 73 -
NORTHWEST FIRE DISTRICT SCHEDULE OF REVENUES, EXPENDITURES AND CHANGES IN FUND BALANCE –
BUDGET AND ACTUAL – GENERAL FUND
YEAR ENDED JUNE 30, 2018
Variance
Budgeted Amounts with Final
Original Final Actual Budget
REVENUES
Taxes and assessments $ 29,946,442 $ 29,946,442 $ 29,411,580 $ (534,862)
Charges for services 1,133,500 1,133,500 1,258,948 125,448
Donations - - 1,215 1,215
Interest earned 50,000 50,000 68,541 18,541
Miscellaneous - - 16,379 16,379
Total Revenues 31,129,942 31,129,942 30,756,663 (373,279)
EXPENDITURES
Public safety
Administration 3,273,823 3,273,823 3,347,591 (73,768)
Emergency operations 19,930,708 19,924,708 19,567,594 357,114
Community safety services 1,217,215 1,217,215 1,242,393 (25,178)
Support resources 4,948,908 4,926,908 5,041,038 (114,130)
Capital outlay 13,000 41,000 24,800 16,200
Contingency 7,003,599 7,003,599 - 7,003,599
Total Expenditures 36,387,253 36,387,253 29,223,416 7,163,837
REVENUES OVER (UNDER)
EXPENDITURES (5,257,311) (5,257,311) 1,533,247 6,790,558
OTHER FINANCING SOURCES (USES)
Transfers out (1,742,689) (1,742,689) (1,742,689) -
NET CHANGE IN FUND BALANCE (7,000,000) (7,000,000) (209,442) 6,790,558
FUND BALANCE, Beginning of year 7,000,000 7,000,000 7,539,223 539,223
FUND BALANCE, End of year $ - $ - $ 7,329,781 $ 7,329,781

See Note to Required Supplementary Information
- 74 -
NORTHWEST FIRE DISTRICT SCHEDULE OF REVENUES, EXPENDITURES AND CHANGES IN FUND BALANCE –
BUDGET AND ACTUAL – WILDLAND FUND
YEAR ENDED JUNE 30, 2018
Variance
Budgeted Amounts with Final
Original Final Actual Budget
REVENUES
Intergovernmental $ 473,488 $ 473,488 $ 839,448 $ 365,960
EXPENDITURES
Personal services 356,728 356,728 763,165 (406,437)
Materials and services 116,760 116,760 85,520 31,240
Total Expenditures 473,488 473,488 848,685 (375,197)
NET CHANGE IN FUND BALANCE - - (9,237) (9,237)
FUND BALANCE, Beginning of year - - 349,022 349,022
FUND BALANCE, End of year $ - $ - $ 339,785 $ 339,785

See Note to Required Supplementary Information
- 75 -
NORTHWEST FIRE DISTRICT SCHEDULE OF REVENUES, EXPENDITURES AND CHANGES IN FUND BALANCE –
BUDGET AND ACTUAL – AMBULANCE FUND
YEAR ENDED JUNE 30, 2018
Variance
Budgeted Amounts with Final
Original Final Actual Budget
REVENUES
Charges for services $ 2,300,000 $ 2,300,000 $ 2,156,082 $ (143,918)
EXPENDITURES
Personal services 1,693,661 1,693,661 1,663,672 29,989
Materials and services 602,011 602,011 618,959 (16,948)
Contingency 4,328 4,328 - 4,328
Total Expenditures 2,300,000 2,300,000 2,282,631 17,369
NET CHANGE IN FUND BALANCE - - (126,549) (126,549)
FUND BALANCE, Beginning of year - - 251,958 251,958
FUND BALANCE, End of year $ - $ - $ 125,409 $ 125,409

See Note to Required Supplementary Information
- 76 -
NORTHWEST FIRE DISTRICT SCHEDULE OF REVENUES, EXPENDITURES AND CHANGES IN FUND BALANCE –
BUDGET AND ACTUAL – GRANT PROGRAM FUND
YEAR ENDED JUNE 30, 2018
Variance
Budgeted Amounts with Final
Original Final Actual Budget
REVENUES
Intergovernmental $ 2,500,000 $ 2,500,000 $ 1,562,186 $ (937,814)
EXPENDITURES
Personal services 1,876,213 1,876,213 1,722,435 153,778
Materials and services - - 18,434 (18,434)
Capital outlay - - 26,160 (26,160)
Contingency 1,623,787 1,623,787 - 1,623,787
Total Expenditures 3,500,000 3,500,000 1,767,029 1,732,971
NET CHANGE IN FUND BALANCE (1,000,000) (1,000,000) (204,843) 795,157
FUND BALANCE, Beginning of year 1,000,000 1,000,000 1,220,510 220,510
FUND BALANCE, End of year $ - $ - $ 1,015,667 $ 1,015,667

- 77 -
NORTHWEST FIRE DISTRICT NOTE TO REQUIRED SUPPLEMENTARY INFORMATION
YEAR ENDED JUNE 30, 2018
BUDGETARY BASIS OF ACCOUNTING
The adopted budget of the District is prepared on the modified accrual basis of accounting.

- 78 -
This page intentionally left blank

- 79 -
OTHER SUPPLEMENTARY INFORMATION

- 80 -
This page intentionally left blank

- 81 -
NORTHWEST FIRE DISTRICT SCHEDULE OF REVENUES, EXPENDITURES AND CHANGES IN FUND BALANCE –
BUDGET AND ACTUAL – CAPITAL IMPROVEMENTS FUND
YEAR ENDED JUNE 30, 2018
Variance
Budgeted Amounts with Final
Original Final Actual Budget
REVENUES
Charges for services $ 75,000 $ 75,000 $ 88,781 $ 13,781
Investment income - - 138,031 138,031
Total Revenues 75,000 75,000 226,812 151,812
EXPENDITURES
Materials and services 35,000 35,000 7,146 27,854
Capital outlay 8,178,606 7,328,606 3,057,419 4,271,187
Debt service - - 198,556 (198,556)
Contingency 8,089,083 8,939,083 - 8,939,083
Total Expenditures 16,302,689 16,302,689 3,263,121 13,039,568
REVENUES OVER (UNDER)
EXPENDITURES (16,227,689) (16,227,689) (3,036,309) 13,191,380
OTHER FINANCING SOURCES
Sale of general capital assets - - 316 316
General obligation bonds issued - 12,780,000 12,780,000 -
Premium on bond issuance - 1,530,430 1,530,428 (2)
Transfers in 1,742,689 1,742,689 1,742,689 -
Total Other Financing Sources 1,742,689 16,053,119 16,053,433 314
NET CHANGE IN FUND BALANCE (14,485,000) (174,570) 13,017,124 13,191,694
FUND BALANCE, Beginning of year 14,485,000 174,570 346,438 171,868
FUND BALANCE, End of year $ - $ - $ 13,363,562 $ 13,363,562

- 82 -
NORTHWEST FIRE DISTRICT SCHEDULE OF REVENUES, EXPENDITURES AND CHANGES IN FUND BALANCE –
BUDGET AND ACTUAL – GENERAL OBLIGATION DEBT SERVICE FUND
YEAR ENDED JUNE 30, 2018
Variance
Budgeted Amounts with Final
Original Final Actual Budget
REVENUES
Taxes and assessments $ 4,038,459 $ 4,038,459 $ 4,009,873 $ (28,586)
Intergovernmental 140,000 140,000 145,359 5,359
Interest earned - - - -
Miscellaneous - - 2,957 2,957
Total Revenues 4,178,459 4,178,459 4,158,189 (20,270)
EXPENDITURES
Materials and services 5,000 5,000 1,975 3,025
Debt service:
Principal 1,945,000 1,945,000 2,380,000 (435,000)
Interest 2,078,459 2,078,459 1,398,820 679,639
Contingency 150,000 150,000 - 150,000
Total Expenditures 4,178,459 4,178,459 3,780,795 397,664
NET CHANGE IN FUND BALANCE - - 377,394 377,394
FUND BALANCE, Beginning of year - - 636,896 636,896
FUND BALANCE, End of year $ - $ - $ 1,014,290 $ 1,014,290

- 83 -
NORTHWEST FIRE DISTRICT SCHEDULE OF REVENUES, EXPENDITURES AND CHANGES IN FUND BALANCE –
BUDGET AND ACTUAL – CAPITAL RESERVE FUND
YEAR ENDED JUNE 30, 2018
Variance
Budgeted Amounts with Final
Original Final Actual Budget
REVENUES
Taxes and assessments $ - $ - $ - $ -
EXPENDITURES
Capital outlay - - - -
NET CHANGE IN FUND BALANCE - - - -
FUND BALANCE, Beginning of year 1,207,493 1,207,493 1,207,493 -
FUND BALANCE, End of year $ 1,207,493 $ 1,207,493 $ 1,207,493 $ -

- 84 -
This page intentionally left blank

- 85 -
OTHER FINANCIAL SCHEDULES

- 86 -
This page intentionally left blank

- 87 -
NORTHWEST FIRE DISTRICT SCHEDULE OF PROPERTY TAX TRANSACTIONS
YEAR ENDED JUNE 30, 2018
Taxes Uncollected
Uncollected 2017-18 Discounts & Balances
Tax Year June 30, 2017 Levy Adjustments Turnovers June 30, 2018
2017-2018 $ - $ 33,127,153 $ - $ 32,515,316 $ 611,837
2016-2017 661,236 - - 506,609 154,627
2015-2016 100,615 - - 5,706 94,909
2014-2015 103,463 - - 2,090 101,373
2013-2014 113,152 - - 1,435 111,717
2012-2013 143,271 - - 237 143,034
Prior 458,251 - - 342 457,909
1,579,988 33,127,153 - 33,031,735 1,675,406
Reconciliation to tax revenues on
combined financial statements: General Debt Service
Fund Fund Total
Property tax collections above $ 29,025,457 $ 4,006,278 $ 33,031,735
Other taxes (FDAT) and adjustments 400,571 34 400,605
Property taxes susceptible to accrual
at June 30, 2018 169,617 23,536 193,153
Property taxes susceptible to accrual
at June 30, 2017 (184,065) (19,975) (204,040)
$ 29,411,580 $ 4,009,873 $ 33,421,453

- 88 -
NORTHWEST FIRE DISTRICT SCHEDULE OF LONG-TERM DEBT PRINCIPAL AND INTEREST TRANSACTIONS
YEAR ENDED JUNE 30, 2018
Interest Date of Fiscal Year
Rates Issue of Maturity
PRINCIPAL TRANSACTIONS
General Obligations
2010A GO Bonds 4.00 - 6.12% 2010 2028-29
2014 Refunding Bonds 2.00 - 4.00% 2014 2023-24
2016 Refunding Bonds 2.00 - 4.00% 2016 2026-27
2017A GO Bonds 2.00 - 5.00% 2017 2035-36
Interest Date of Fiscal Year
Rates Issue of Maturity
INTEREST TRANSACTIONS
General Obligations
2010A GO Bonds 4.00 - 6.12% 2010 2028-29
2014 Refunding Bonds 2.00 - 4.00% 2014 2023-24
2016 Refunding Bonds 2.00 - 4.00% 2016 2026-27
2017A GO Bonds 2.00 - 5.00% 2017 2035-36

- 89 -
8,000,000 - 495,000 7,505,000
6,340,000 - 835,000 5,505,000
8,070,000 - 690,000 7,380,000
- 12,780,000 360,000 12,420,000
$ 22,410,000 $ 12,780,000 $ 2,380,000 $ 32,810,000
3,294,708 - 444,659 2,850,049
933,000 - 202,250 730,750
1,586,525 - 251,050 1,335,475
- 7,839,461 500,861 7,338,600
$ 5,814,233 $ 7,839,461 $ 1,398,820 $ 12,254,874
Outstanding
Issued
Interest
Paid2017
July 1,
Outstanding
June 30,
2018
Unmatured
Interest
June 30,
Unmatured
2018
Interest
Issues
Coupons Paid/
Refunded
NewJuly 1,
2017

- 90 -
NORTHWEST FIRE DISTRICT SCHEDULE OF FUTURE BONDED DEBT REQUIREMENTS
JUNE 30, 2018
Fiscal Year
Ending
June 30,
2019 $ 515,000 $ 421,542 $ 936,542 $ 850,000 $ 185,550 $ 1,035,550 $ 705,000 $ 237,250 $ 942,250 $
2020 545,000 396,462 941,462 870,000 168,550 1,038,550 725,000 216,100 941,100
2021 570,000 369,266 939,266 895,000 142,450 1,037,450 745,000 201,600 946,600
2022 600,000 339,798 939,798 925,000 115,600 1,040,600 765,000 179,250 944,250
2023 635,000 307,878 942,878 965,000 78,600 1,043,600 785,000 156,300 941,300
2024 670,000 273,143 943,143 1,000,000 40,000 1,040,000 865,000 132,750 997,750
2025 705,000 235,489 940,489 - - - 895,000 102,475 997,475
2026 745,000 195,163 940,163 - - - 930,000 71,150 1,001,150
2027 790,000 151,804 941,804 - - - 965,000 38,600 1,003,600
2028 840,000 105,036 945,036 - - - - - -
2029 890,000 54,468 944,468 - - - - - -
2030 - - - - - - - - -
2031 - - - - - - - - -
2032 - - - - - - - - -
2033 - - - - - - - - -
2034 - - - - - - - - -
2035 - - - - - - - - -
2036 - - - - - - - - -
$ 7,505,000 $ 2,850,049 $ 10,355,049 $ 5,505,000 $ 730,750 $ 6,235,750 $ 7,380,000 $ 1,335,475 $ 8,715,475 $
2016 Refunding Bonds.
Principal Interest Total
2010A GO Bonds
Principal Interest Total
2014 Refunding Bonds
Principal Interest Total

- 91 -
$ 400,000 $ 542,525 $ 942,525 $ 2,470,000 $ 1,386,867 $ 3,856,867
100,000 534,525 634,525 2,240,000 1,315,637 3,555,637
100,000 532,525 632,525 2,310,000 1,245,841 3,555,841
100,000 529,525 629,525 2,390,000 1,164,173 3,554,173
100,000 526,525 626,525 2,485,000 1,069,303 3,554,303
- 523,525 523,525 2,535,000 969,418 3,504,418
540,000 523,525 1,063,525 2,140,000 861,489 3,001,489
450,000 496,525 946,525 2,125,000 762,838 2,887,838
410,000 474,025 884,025 2,165,000 664,429 2,829,429
455,000 453,525 908,525 1,295,000 558,561 1,853,561
460,000 430,775 890,775 1,350,000 485,243 1,835,243
1,225,000 407,775 1,632,775 1,225,000 407,775 1,632,775
1,255,000 364,900 1,619,900 1,255,000 364,900 1,619,900
1,325,000 314,700 1,639,700 1,325,000 314,700 1,639,700
1,330,000 261,700 1,591,700 1,330,000 261,700 1,591,700
1,325,000 208,500 1,533,500 1,325,000 208,500 1,533,500
1,420,000 142,250 1,562,250 1,420,000 142,250 1,562,250
1,425,000 71,250 1,496,250 1,425,000 71,250 1,496,250
$ 12,420,000 $ 7,338,600 $ 19,758,600 $ 32,810,000 $ 12,254,874 $ 45,064,874
Totals
Principal Interest TotalPrincipal Interest Total
201 7 GO Bonds.

- 92 -
This page intentionally left blank

- 93 -
STATISTICAL SECTION
This part of the comprehensive annual financial report of the District presents detailed information as
a context for understanding what the information in the financial statements, note disclosures, and
required supplementary information says about the overall financial health of the District.
This section contains the following tables and information:
• Financial Trends – These schedules contain trend information to help the reader understand
how the financial performance and well-being of the District have changed over time.
• Revenue Capacity – These schedules contain information to help the reader assess the most
significant local revenue source of the District – the property tax.
• Debt Capacity – These schedules present information to help the reader assess the
affordability of the current levels of outstanding debt of the District and its ability to issue
additional debt in the future.
• Demographic and Economic Information – These schedules offer demographic and
economic indicators to help the reader understand the environment within which the financial
activities of the District take place.
• Operating Information – These schedules contain service and infrastructure data to help the
reader understand how the information in the financial report of the District relates to the
services the District provides and the activities it performs.
Sources: Unless otherwise noted, the information in these schedules is derived from the annual
financial reports for the relevant year.

- 94 -
NORTHWEST FIRE DISTRICT NET POSITION BY COMPONENT
LAST TEN FISCAL YEARS (accrual basis of accounting)
2018 2017 2016 2015
Governmental Activities:
Net investment in capital assets $ 7,126,330 $ 19,286,564 $ 17,218,346 $ 16,176,516
Restricted 2,188,440 1,995,585 2,351,605 2,300,240
Unrestricted (8,261,452) (20,350,803) (8,869,151) (8,795,879)
Total primary government net position $ 1,053,318 $ 931,346 $ 10,700,800 $ 9,680,877

- 95 -
2014 2013 2012 2011 2010 2009
$ 14,956,884 $ 15,549,975 $ 15,286,788 $ 17,213,277 $ 15,451,950 $ 12,941,435
2,989,141 2,983,301 2,882,157 2,473,572 681,132 -
12,481,770 11,318,560 11,640,020 9,725,396 9,498,230 9,127,548
$ 30,427,795 $ 29,851,836 $ 29,808,965 $ 29,412,245 $ 25,631,312 $ 22,068,983

- 96 -
NORTHWEST FIRE DISTRICT CHANGES IN NET POSITION
LAST TEN FISCAL YEARS (accrual basis of accounting)
2018 2017 2016 2015
Expenses
Governmental activities:
Public safety $ 37,067,135 $ 45,119,860 $ 33,014,022 $ 32,104,719
Interest on long-term debt 1,186,250 808,138 1,487,972 1,396,551
Total primary government expenses 38,253,385 45,927,998 34,501,994 33,501,270
Program Revenues
Governmental activities:
Charges for services 2,477,942 2,915,582 4,851,624 1,702,701
Operating grants and contributions 2,595,746 1,859,470 1,317,763 2,128,289
Capital grants and contributions - - - -
Total primary government
program revenues 5,073,688 4,775,052 6,169,387 3,830,990
Net (expense)/revenue:
Total primary government net expense $ (33,179,697) $ (41,152,946) $ (28,332,607) $ (29,670,280)
General Revenues and Other Changes in Net Position
Governmental activities:
Property taxes $ 33,127,433 $ 30,905,973 $ 28,884,757 $ 28,298,804
Intergovernmental 402,130 398,246 394,641 398,891
Investment earnings 206,572 71,261 72,176 66,526
Miscellaneous 19,336 8,012 956 4,228
Total primary government 33,755,471 31,383,492 29,352,530 28,768,449
Change in Net Position
Total primary government $ 575,774 $ (9,769,454) $ 1,019,923 $ (901,831)

- 97 -
2014 2013 2012 2011 2010 2009
$ 30,445,273 $ 30,801,909 $ 30,493,803 $ 27,994,855 $ 26,202,413 $ 28,252,918
1,426,530 1,578,447 1,648,780 1,786,477 1,207,853 1,271,752
31,871,803 32,380,356 32,142,583 29,781,332 27,410,266 29,524,670
1,304,169 904,883 978,950 1,083,979 1,205,438 1,253,721
2,249,185 2,536,916 2,762,769 2,968,198 1,663,139 2,261,248
- - 421,498 37,489 417,005 781,645
3,553,354 3,441,799 4,163,217 4,089,666 3,285,582 4,296,614
$ (28,318,449) $ (28,938,557) $ (27,979,366) $ (25,691,666) $ (24,124,684) $ (25,228,056)
$ 28,414,889 $ 28,381,375 $ 28,181,528 $ 28,752,945 $ 26,832,368 $ 27,111,182
394,560 397,605 516,341 516,341 520,875 522,836
67,999 157,240 73,829 159,360 266,746 321,273
16,960 45,208 48,849 43,953 67,024 209,195
28,894,408 28,981,428 28,820,547 29,472,599 27,687,013 28,164,486
$ 575,959 $ 42,871 $ 841,181 $ 3,780,933 $ 3,562,329 $ 2,936,430

- 98 -
NORTHWEST FIRE DISTRICT FUND BALANCES OF GOVERNMENTAL FUNDS
LAST TEN FISCAL YEARS (modified accrual basis of accounting)
2018 2017 2016 2015
General fund
Reserved $ - $ - $ - $ -
Unreserved - - - -
Nonspendable 76,899 121,124 88,352 41,851
Assigned 2,088,182 2,088,255 2,057,411 1,904,439
Unassigned 5,164,700 5,329,844 5,750,826 6,354,350
Total general fund $ 7,329,781 $ 7,539,223 $ 7,896,589 $ 8,300,640
All other governmental funds
Reserved $ - $ - $ - $ -
Unreserved, reported in:
Special revenue funds - - - -
Capital project funds - - - -
Restricted 2,029,957 1,857,406 2,227,260 2,181,549
Assigned 15,036,249 2,154,911 2,496,384 4,180,238
Unassigned - - - 394,014
Total all other governmental funds $ 17,066,206 $ 4,012,317 $ 4,723,644 $ 6,755,801
For fiscal year 2010, the District implemented GASB Statement No. 54, “Fund Balance Reporting and
Governmental Fund Type Definitions”, resulting in the above presentation changes on fund balance reporting
from 2009.

- 99 -
2014 2013 2012 2011 2010 2009
$ - $ - $ - $ - $ - $ 33,992
- - - - - 5,623,159
41,618 32,558 60,536 46,313 38,996 -
1,284,406 271,292 543,807 635,817 19,803 -
7,784,984 8,865,044 8,638,855 6,789,421 6,323,963 -
$ 9,111,008 $ 9,168,894 $ 9,243,198 $ 7,471,551 $ 6,382,762 $ 5,657,151
$ - $ - $ - $ - $ - $ 1,635,046
- - - - - 140,978
- - - - - 11,293,752
3,091,615 3,461,598 3,707,599 10,504,078 18,311,186 -
4,448,158 3,386,617 3,449,582 2,182,187 2,560,962 -
126,524 (315,838) (722,909) (991,857) (315,373) -
$ 7,666,297 $ 6,532,377 $ 6,434,272 $ 11,694,408 $ 20,556,775 $ 13,069,776
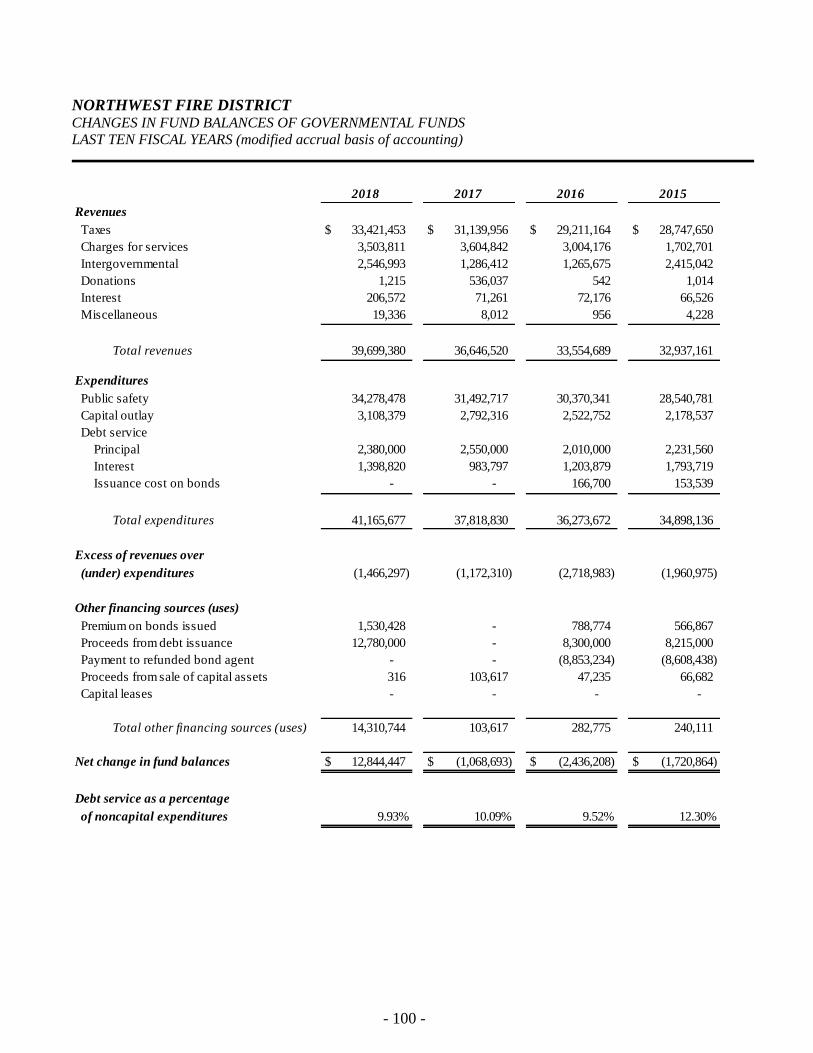
- 100 -
NORTHWEST FIRE DISTRICT CHANGES IN FUND BALANCES OF GOVERNMENTAL FUNDS
LAST TEN FISCAL YEARS (modified accrual basis of accounting)
2018 2017 2016 2015
Revenues
Taxes $ 33,421,453 $ 31,139,956 $ 29,211,164 $ 28,747,650
Charges for services 3,503,811 3,604,842 3,004,176 1,702,701
Intergovernmental 2,546,993 1,286,412 1,265,675 2,415,042
Donations 1,215 536,037 542 1,014
Interest 206,572 71,261 72,176 66,526
Miscellaneous 19,336 8,012 956 4,228
Total revenues 39,699,380 36,646,520 33,554,689 32,937,161
Expenditures
Public safety 34,278,478 31,492,717 30,370,341 28,540,781
Capital outlay 3,108,379 2,792,316 2,522,752 2,178,537
Debt service
Principal 2,380,000 2,550,000 2,010,000 2,231,560
Interest 1,398,820 983,797 1,203,879 1,793,719
Issuance cost on bonds - - 166,700 153,539
Total expenditures 41,165,677 37,818,830 36,273,672 34,898,136
Excess of revenues over
(under) expenditures (1,466,297) (1,172,310) (2,718,983) (1,960,975)
Other financing sources (uses)
Premium on bonds issued 1,530,428 - 788,774 566,867
Proceeds from debt issuance 12,780,000 - 8,300,000 8,215,000
Payment to refunded bond agent - - (8,853,234) (8,608,438)
Proceeds from sale of capital assets 316 103,617 47,235 66,682
Capital leases - - - -
Total other financing sources (uses) 14,310,744 103,617 282,775 240,111
Net change in fund balances $ 12,844,447 $ (1,068,693) $ (2,436,208) $ (1,720,864)
Debt service as a percentage
of noncapital expenditures 9.93% 10.09% 9.52% 12.30%

- 101 -
2014 2013 2012 2011 2010 2009
$ 28,565,186 $ 28,847,572 $ 29,281,639 $ 29,201,070 $ 27,200,848 $ 26,861,605
1,304,169 904,883 978,950 1,083,979 1,205,438 1,253,721
2,669,485 2,980,824 3,410,753 2,083,552 1,940,613 3,530,322
886 440 890 1,015 1,454 3,516
67,999 157,240 73,829 159,360 266,746 321,273
16,960 45,208 48,849 43,953 67,024 209,195
32,624,685 32,936,167 33,794,910 32,572,929 30,682,123 32,179,632
27,281,172 28,545,390 27,122,488 25,895,667 25,094,335 25,119,033
1,319,617 1,178,971 6,891,859 11,115,191 5,418,600 5,582,800
1,590,000 1,604,222 1,614,273 1,543,873 1,697,872 2,049,660
1,513,509 1,583,783 1,654,779 1,791,775 1,207,853 1,286,714
- - - - 163,982 -
31,704,298 32,912,366 37,283,399 40,346,506 33,582,642 34,038,207
920,387 23,801 (3,488,489) (7,773,577) (2,900,519) (1,858,575)
- - - - 163,129 -
- - - - 10,950,000 -
- - - - - -
155,647 - - - - -
- - - - - -
155,647 - - - 11,113,129 -
$ 1,076,034 $ 23,801 $ (3,488,489) $ (7,773,577) $ 8,212,610 $ (1,858,575)
10.21% 10.05% 10.76% 11.41% 10.90% 11.72%

- 102 -
NORTHWEST FIRE DISTRICT ASSESSED AND ESTIMATED ACTUAL VALUE OF TAXABLE PROPERTY
LAST TEN FISCAL YEARS
Real Property Personal Property Public Utility Property Total
Fiscal Year Residential Less: Taxable
Ended & Commercial Assessed Assessed Tax Exempt Assessed
June 30, Property Value Value Real Property Value
2009 1,150,248,914 37,845,835 17,512,580 unavailable
2010 1,159,273,225 41,280,540 18,422,482 unavailable
2011 1,109,980,353 37,055,165 21,315,691 unavailable
2012 992,017,039 33,878,245 21,606,049 unavailable
2013 952,695,576 32,078,598 20,997,630 91,415,487
2014 893,583,142 28,834,682 20,892,491 103,131,023
2015 917,578,208 31,001,733 25,223,947 105,895,750
2016 942,856,062 26,531,232 24,419,181 103,849,456
2017 981,852,135 25,992,960 27,806,371 98,411,038
2018 1,024,216,523 25,783,691 30,073,053 99,596,680
Source: Pima County

- 103 -
Total Assessed
Taxable Direct Estimated Value as a
Assessed Tax Net Full Cash % of Full
Value Rate Value Cash Value
1,205,607,329 2.2601 10,055,311,825 11.99%
1,218,976,247 2.2077 10,476,984,132 11.63%
1,168,351,209 2.4646 9,666,454,596 12.09%
1,047,501,333 2.7109 8,693,706,845 12.05%
1,005,771,804 2.8383 8,262,755,426 12.17%
943,310,315 3.0213 7,757,731,353 12.16%
973,803,888 2.9272 8,060,872,757 12.08%
993,806,475 2.9138 9,563,358,048 10.39%
1,035,651,466 2.9920 10,304,662,155 10.05%
1,080,073,267 3.0734 10,746,182,316 10.05%

- 104 -
NORTHWEST FIRE DISTRICT PROPERTY TAX RATES – ALL DIRECT AND OVERLAPPING GOVERNMENTS
LAST TEN FISCAL YEARS
Overlapping Rates
Fiscal Year Northwest Fire District Pima County Marana Unified School District
Ended Total Total
June 30, General Debt Service District General Debt Service County General
2009 2.1088 0.1513 2.2601 3.3913 0.6050 3.9963
2010 2.0857 0.1220 2.2077 3.3133 0.7100 4.0233
2011 2.1761 0.2885 2.4646 3.4178 0.7800 4.1978
2012 2.4103 0.3006 2.7109 3.4178 0.7800 4.1978
2013 2.5253 0.3130 2.8383 3.4178 0.7800 4.1978
2014 2.6926 0.3287 3.0213 3.6665 0.7800 4.4465
2015 2.6083 0.3189 2.9272 4.2779 0.7000 4.9779
2016 2.6086 0.3052 2.9138 4.3877 0.7000 5.0877
2017 2.6995 0.2925 2.9920 4.2896 0.7000 4.9896
2018 2.6995 0.3739 3.0734 4.4596 0.7000 5.1596
Source: Pima County

- 105 -
Overlapping Rates
Marana Unified School District Total Direct
Total Special & Overlapping
General Debt Service School District Districts Rates
3.7725 1.7090 5.4815 3.0199 14.7578
3.2634 1.6652 4.9286 2.5377 13.6973
3.5510 1.6537 5.2047 1.4185 13.2856
3.9419 1.6444 5.5863 1.9550 14.4500
3.9419 1.6444 5.5863 2.4456 15.0680
4.1868 1.8217 6.0085 2.6800 16.1563
4.3493 1.8795 6.2288 2.8193 16.9532
4.4563 1.8807 6.3370 2.9398 17.2783
4.5020 1.8851 6.3871 2.9599 17.3286
4.3830 1.8504 6.2334 2.9312 17.3976

- 106 -
This page intentionally left blank

- 107 -
NORTHWEST FIRE DISTRICT PRINCIPAL PROPERTY TAXPAYERS
CURRENT AND NINE YEARS AGO
% of Total
Assessed Assessed
Taxpayer Type of Business Value Value
Northwest Hospital LLC Healthcare $ 20,344,256 1.88%
Unisource Energy Corporation Utility 16,943,555 1.57%
FHM Partners LLC Developer 7,090,384 0.66%
HSL Cottonwood RC Hotel LLC Resort 6,368,189 0.59%
Wal-Mart Stores Inc Retail 6,104,439 0.57%
Tucson Premium Outlets LLC Shopping center 6,081,200 0.56%
Southwest Gas Corp Grocer 4,186,527 0.39%
Verizon Wireless Wireless 3,198,101 0.30%
Westward Look Resort LLC Resort 3,030,035 0.28%
Qwest Corporation Utility 2,981,898 0.28%
$ 76,328,584 7.07%
Total Assessed Value $ 1,080,073,267
% of Total
Assessed Assessed
Taxpayer Type of Business Value Value
Northwest Hospital LLC Healthcare $ 16,497,256 1.37%
Unisource Energy Corp Utility 10,119,595 0.84%
FMP Kimpco Foothills LLC Shopping center 9,337,798 0.77%
Wal-Mart Stores, Inc. Retail 6,380,925 0.53%
APHM Westward Look LLC Resort 4,364,558 0.36%
Smith's Food & Drug Centers Inc Retail 4,108,441 0.34%
Kimco Barclay Marana LP Shopping center 2,985,739 0.25%
LaCholla & River Road Assoc., LLC Developer 2,900,550 0.24%
Dove Mountain Retail II LLC Retail 2,518,542 0.21%
Qwest Communications Corp Telecommunications 2,351,848 0.20%
$ 61,565,252 5.11%
Total Assessed Value $ 1,205,607,329
June 30, 2018
June 30, 2009
Source: Pima County Assessor

- 108 -
NORTHWEST FIRE DISTRICT PROPERTY TAX LEVIES AND COLLECTIONS
LAST TEN FISCAL YEARS
Collected within the
Fiscal Year Original Tax Property Fiscal Year of the Levy
Ended Property Roll Tax Levy Collections in
June 30, Tax Levy Corrections (Adjusted) Amount % of Levy Subsequent Years
2009 27,232,008 - 27,232,008 25,723,703 94.46%
2010 26,898,582 - 26,898,582 25,362,292 94.29%
2011 28,747,801 - 28,747,801 27,608,735 96.04%
2012 28,400,387 - 28,400,387 27,378,367 96.40%
2013 28,792,811 - 28,792,811 27,960,421 97.11%
2014 28,428,353 - 28,428,353 27,659,209 97.29%
2015 28,298,575 - 28,298,575 27,488,510 97.14%
2016 28,884,757 - 28,884,757 28,099,632 97.28%
2017 30,905,972 - 30,905,972 30,244,736 97.86%
2018 33,127,153 - 33,127,153 32,515,316 98.15%
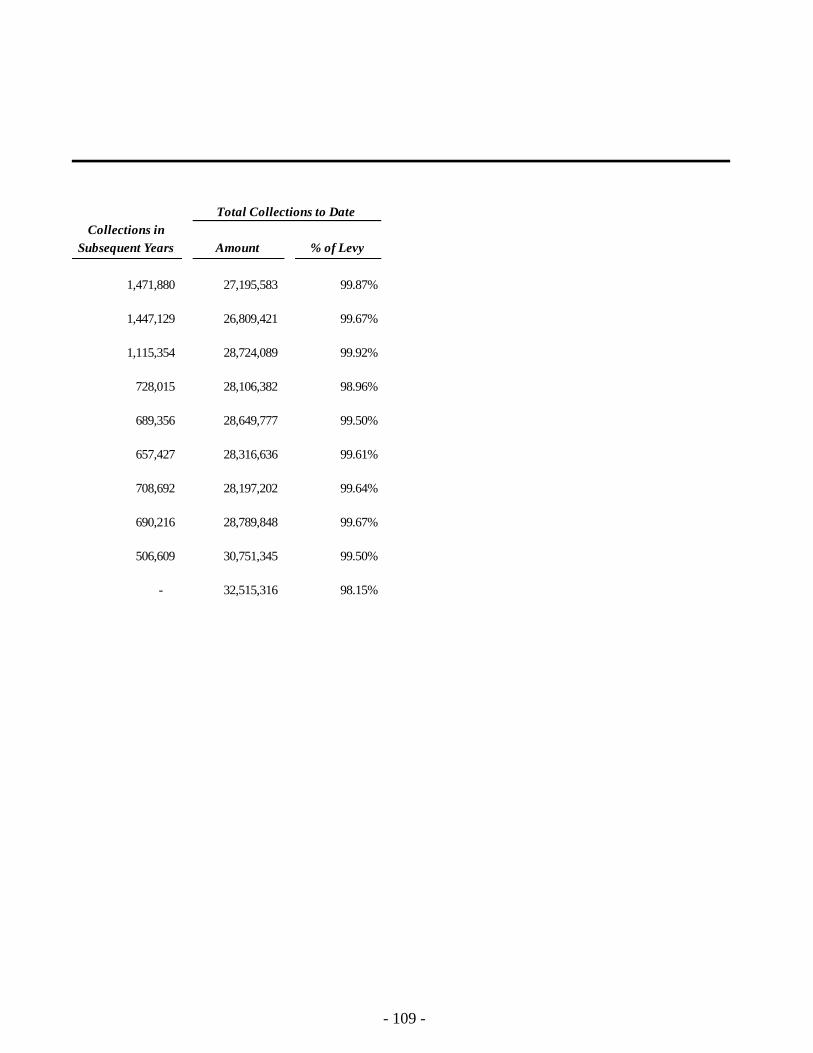
- 109 -
Total Collections to Date
Collections in
Subsequent Years Amount % of Levy
1,471,880 27,195,583 99.87%
1,447,129 26,809,421 99.67%
1,115,354 28,724,089 99.92%
728,015 28,106,382 98.96%
689,356 28,649,777 99.50%
657,427 28,316,636 99.61%
708,692 28,197,202 99.64%
690,216 28,789,848 99.67%
506,609 30,751,345 99.50%
- 32,515,316 98.15%

- 110 -
NORTHWEST FIRE DISTRICT RATIOS OF OUTSTANDING DEBT BY TYPE
LAST TEN FISCAL YEARS
Governmental Activities
Fiscal Year General Total Percentage
Ended Obligation Capital Primary of Personal Per
June 30, Bonds Leases Government Income Capita
25,610,000 1,085,240 26,695,240 0.08% 200.88
35,565,000 382,368 35,947,368 0.11% 270.50
34,170,000 233,495 34,403,495 0.10% 311.72
32,710,000 79,222 32,789,222 0.09% 297.09
31,185,000 - 31,185,000 0.09% 282.55
30,554,014 - 30,554,014 0.08% 276.84
27,984,314 - 27,984,314 0.07% 253.55
26,329,301 - 26,329,301 0.07% 225.45
23,640,893 - 23,640,893 0.06% 202.43
35,358,751 - 35,358,751 0.09% 302.76
2010
2009
2018
2017
2016
2012
2011
2015
2014
2013

- 111 -
NORTHWEST FIRE DISTRICT RATIOS OF GENERAL BONDED DEBT OUTSTANDING
LAST TEN FISCAL YEARS
Less Debt Percentage of
Fiscal Year General Service Net Estimated Actual
Ended Assessed Obligation Monies Bonded Taxable Value
June 30, Value Bonds Available Debt of Property
2009 1,205,607,329 25,610,000 11,110,812 14,499,188 1.20% 109.11
2010 1,218,976,247 35,565,000 18,049,064 17,515,936 1.44% 131.81
2011 1,168,351,209 34,170,000 9,498,342 24,671,658 2.11% 223.54
2012 1,047,501,333 32,710,000 2,484,404 30,225,596 2.89% 273.86
2013 1,005,771,804 31,185,000 2,252,063 28,932,937 2.88% 262.15
2014 943,310,315 30,554,014 1,875,951 28,678,063 3.04% 259.84
2015 973,803,888 27,984,314 982,237 27,002,077 2.77% 244.65
2016 993,806,475 26,329,301 969,024 25,360,277 2.55% 217.15
2017 1,035,651,466 23,640,893 616,921 23,023,972 2.22% 197.14
2018 1,080,073,267 35,358,751 990,754 34,367,997 3.18% 294.28
Net Bonded
Debt per
Capita

- 112 -
NORTHWEST FIRE DISTRICT DIRECT AND OVERLAPPING GENERAL OBLIGATION DEBT RATIOS
LAST EIGHT FISCAL YEARS
Fiscal Year As % of
Ended Per Capita District Net
June 30, Bonded Debt Assessed Valuation
2011 Direct GO Bonded Debt $ 313.91 2.92% 0.35%
2011 Direct & Overlapping GO Bonded Debt 1,412.86 13.30% 1.61%
2012 Direct GO Bonded Debt $ 299.93 3.12% 0.38%
2012 Direct & Overlapping GO Bonded Debt 1,521.30 15.93% 1.93%
2013 Direct GO Bonded Debt $ 286.25 3.10% 0.38%
2013 Direct & Overlapping GO Bonded Debt 1,476.30 16.20% 1.97%
2014 Direct GO Bonded Debt $ 272.02 3.24% 0.39%
2014 Direct & Overlapping GO Bonded Debt 1,502.53 17.58% 2.14%
2015 Direct GO Bonded Debt $ 246.70 2.87% 0.35%
2015 Direct & Overlapping GO Bonded Debt 1,320.21 15.59% 1.88%
2016 Direct GO Bonded Debt $ 225.45 2.65% 0.28%
2016 Direct & Overlapping GO Bonded Debt 1,327.39 15.60% 1.62%
2017 Direct GO Bonded Debt $ 202.43 2.28% 0.23%
2017 Direct & Overlapping GO Bonded Debt 1,294.07 14.59% 1.47%
2018 Direct GO Bonded Debt $ 302.76 3.27% 0.33%
2018 Direct & Overlapping GO Bonded Debt 1,491.40 16.13% 1.62%
As % of
District Estimated
Full Cash Value

- 113 -
NORTHWEST FIRE DISTRICT DIRECT AND OVERLAPPING GOVERNMENTAL ACTIVITIES DEBT
AS OF JUNE 30, 2018
Estimated Estimated Share
Debt Percentage of Overlapping
Governmental Unit Outstanding Applicable Debt
Debt repaid with property taxes:
Pima County $ 288,182,000 13.25% $ 38,184,115
Gladden Farms Community Facilities Dist 7,745,000 100.00% 7,745,000
Marana Unified School District 134,064,000 69.29% 92,889,656
Subtotal, overlapping debt 138,818,771
Northwest Fire District direct debt 35,358,751
Total estimated direct and overlapping debt $ 174,177,522
Note: Overlapping governments are those that coincide, at least in part, with the geographic
boundaries of the District. This schedule estimates the portion of the outstanding debt of those
overlapping governments that is borne by the residents and businesses of Northwest Fire District.
This process recognizes that, when considering the District’s ability to issue and repay long-term debt,
the entire debt burden borne by the residents and businesses should be taken into account. However,
this does not imply that every taxpayer is a resident, and therefore responsible for repaying the debt,
of each overlapping government.

- 114 -
NORTHWEST FIRE DISTRICT LEGAL DEBT MARGIN INFORMATION
LAST TEN FISCAL YEARS
2018 2017 2016 2015
Assessed Value $ 1,080,073,267 $ 1,035,651,466 $ 993,806,475 $ 973,803,888
Debt limit rate x 6% x 6% x 6% x 6%
Debt limit 64,804,396 62,139,088 59,628,389 58,428,233
Less bonded debt at June 30 (35,358,751) (23,640,893) (26,329,301) (27,984,314)
Legal debt margin $ 29,445,645 $ 38,498,195 $ 33,299,088 $ 30,443,919
Total net debt applicable to the limit
as a percentage of debt limit 54.56% 38.05% 44.16% 47.90%

- 115 -
2014 2013 2012 2011 2010 2009
$ 943,310,315 $ 1,005,771,804 $ 1,047,501,333 $ 1,168,351,209 $ 1,218,976,247 $ 1,205,607,329
x 6% x 6% x 6% x 6% x 6% x 6%
56,598,619 60,346,308 62,850,080 70,101,073 73,138,575 72,336,440
(30,554,014) (28,932,937) (30,225,596) (24,671,658) (17,515,936) (14,499,188)
$ 26,044,605 $ 31,413,371 $ 32,624,484 $ 45,429,415 $ 55,622,639 $ 57,837,252
53.98% 47.94% 48.09% 35.19% 23.95% 20.04%

- 116 -
NORTHWEST FIRE DISTRICT DEMOGRAPHIC AND ECONOMIC STATISTICS
LAST TEN FISCAL YEARS
(1) (2) (1)
Fiscal Year (1) Per Capita School Unemployment
Ended Population Personal Income Enrollment Rate
June 30, (Pima County) Income (Pima County) (Pima County) (Pima County)
2009 984,274 32,955,000 33,482 148,686 7.9%
2010 980,263 33,361,839 34,034 153,505 9.0%
2011 986,081 34,737,686 35,228 152,234 9.1%
2012 990,380 35,985,709 36,335 151,172 7.6%
2013 992,394 36,453,218 36,733 151,854 7.6%
2014 996,046 37,893,093 38,044 152,088 6.9%
2015 1,007,200 38,922,402 38,644 151,731 5.9%
2016 1,009,371 39,963,300 39,592 151,364 5.3%
2017 1,026,099 40,182,115 39,160 150,316 4.9%
2018 1,029,400 41,349,600 40,169 150,215 4.4%

- 117 -
NORTHWEST FIRE DISTRICT PRINCIPAL EMPLOYERS
CURRENT AND NINE YEARS AGO
Employer Employees Rank
Marana Unified School District 1,400 1
Northwest Medical Center 1,325 2
Wal-Mart 1,029 3
Frys Food and Drug 450 5
Marana Health Center 356 5
Town of Marana 347 6
Ritz Carlton Dove Mountain 320 7
Sargent Aerospace & Defense 313 8
Tucson Hauling & Transfer 300 9
Northwest Fire District 250 10
Total 6,090
Employer Employees Rank
Marana Unified School District 1,836 1
Northwest Medical Center 1,671 2
Wal-Mart 450 3
Lowes 387 4
Home Depot 383 5
Town of Marana 324 6
Costco 305 7
Sargent Controls 257 8
Kohls Department Store 223 9
Marana Health Center 223 10
Total 6,059
June 30, 2018
June 30, 2009
Source: Pima Association of Governments
Note: Percentage of employees employed by principal employers to the total employed District-wide
is not available.

- 118 -
NORTHWEST FIRE DISTRICT OPERATING INDICATORS BY FUNCTION
LAST TEN FISCAL YEARS
Function 2018 2017 2016 2015
Public safety
Fire prevention inspections 2,298 3,495 4,991 6,113
Emergency medical service calls 12,078 11,913 11,824 10,725
Fire responses 240 289 512 1,032
Other Responses - including hazardous
materials, mutual aid, public service 3,103 2,633 2,449 1,064
Miscellaneous - including false alarms,
good intent - - - 2
Sources: Various District Departments

- 119 -
2014 2013 2012 2011 2010 2009
3,982 3,003 3,007 3,097 2,790 3,708
10,417 11,413 10,538 10,301 9,385 9,259
1,258 1,526 350 230 206 365
1,292 1,316 1,127 1,889 1,669 2,375
2 36 999 1,537 1,396 1,434

- 120 -
NORTHWEST FIRE DISTRICT FULL-TIME EQUIVALENT EMPLOYEES BY FUNCTION
LAST TEN FISCAL YEARS
Function 2018 2017 2016 2015
Public safety
Fire and rescue service 203 198 182 177
Fire prevention 11 11 11 12
Administrative and support 36 36 40 40
Total 250 245 233 229
Source: District HR Department

- 121 -
2014 2013 2012 2011 2010 2009
208 204 206 202 207 209
9 8 9 9 9 9
40 37 37 37 36 36
257 249 252 248 252 254

- 122 -
NORTHWEST FIRE DISTRICT CAPITAL ASSET STATISTICS BY FUNCTION
LAST TEN FISCAL YEARS
Function 2018 2017 2016 2015
Public safety
Stations 10 10 10 10
Equipment:
Engines 16 16 15 16
Ladder trucks 2 2 2 2
Brush rigs 3 3 3 4
Rescue/Ambulance units 11 10 10 8
Tenders 3 3 3 3
Hazmat squad 1 1 1 2
Squad/support units 2 2 2 2
Technical rescue 1 1 1 2
Heavy squad 1 1 1 1
Source: District Fleet Department

- 123 -
2014 2013 2012 2011 2010 2009
10 10 10 10 10 9
16 16 16 16 15 15
3 3 3 3 3 2
6 6 6 6 6 4
6 6 6 6 6 4
3 3 3 3 3 3
2 2 2 2 2 2
2 2 2 2 2 2
2 2 2 2 2 2
1 1 1 1 1 1

- 124 -
This page intentionally left blank

- 125 -
SINGLE AUDIT SECTION

- 126 -
This page intentionally left blank

- 127 -

- 128 -

- 129 -

- 130 -

- 131 -
NORTHWEST FIRE DISTRICT SCHEDULE OF EXPENDITURES OF FEDERAL AWARDS
YEAR ENDED JUNE 30, 2018
CFDA
Federal Grantor/Pass-through Grantor/Program Title Number
U.S. Department of Transportation
Passed through State of Arizona -
State & Community Highway Safety 20.600 2017-OP-021 179
State & Community Highway Safety 20.600 2018-EM-001 26,160
Interagency Hazardous Materials Public Sector Training & Planning Grants 20.703 2,250
U.S. Department of Homeland Security
Direct Grant -
Staffing for Adequate Fire and Emergency Response 97.083 1,516,559 *
Passed through State of Arizona -
Homeland Security Grant Program - CBRNE 97.067 10,285
Total Expenditures of Federal Awards $ 1,555,433
Totals by CFDA Number:
State & Community Highway Safety 20.600 26,339
Interagency Hazardous Materials Public Sector Training & Planning Grants 20.703 2,250
Staffing for Adequate Fire and Emergency Response 97.083 1,516,559
Homeland Security Cluster 97.067 10,285
Total Expenditures of Federal Awards $ 1,555,433
* - Denotes major program
150433-02
Grantor's
Number Expenditures
EMW-2015-FH-00602
HM-HMP-0583-16-01-00

- 132 -
NORTHWEST FIRE DISTRICT NOTES TO SCHEDULE OF EXPENDITURES OF FEDERAL AWARDS
YEAR ENDED JUNE 30, 2018
PURPOSE OF THE SCHEDULE
The accompanying schedule of expenditures of federal awards is a supplementary schedule to the financial
statements of the District and is presented for purposes of additional analysis.
SIGNIFICANT ACCOUNTING POLICIES
Basis of Presentation
The information in the Schedule is presented in accordance with Uniform Guidance, Audits of States, Local
Governments, and Non-Profit Organizations.
Federal Financial Assistance
Pursuant to the Single Audit Act and Uniform Guidance, federal financial assistance is defined as assistance
provided by a federal agency, either directly or indirectly, in the form of grants, contracts, cooperative
agreements, loans, loan guarantees, property interest subsidies, insurance or direct appropriations.
Major Programs
The Single Audit Act and Uniform Guidance establish criteria to be used in defining major federal financial
assistance programs. Major programs for the District are those programs selected for testing by the auditor
using a risk-assessment model, as well as certain minimum expenditure requirements, as outlined in Uniform
Guidance. Programs with similar requirements may be grouped into a cluster for testing purposes.
Reporting Entity
The reporting entity is fully described in the notes to the financial statements. Additionally, the Schedule
includes all federal programs administered by the District for the year ended June 30, 2018.
Revenue and Expenditure Recognition
The receipt and expenditure of federal awards are accounted for under the modified accrual basis of accounting.
Revenues are recorded as received in cash or on the accrual basis where measurable and available. Expenditures
are recorded when the liability is incurred.
Indirect Cost Rate
The District has not elected to use the 10% de minimus cost rate as covered in §200.414 Indirect (F&A) costs.
CATALOG OF FEDERAL DOMESTIC ASSISTANCE (CFDA) NUMBERS
The program titles and CFDA numbers were obtained from the federal or pass-through grantor or the 2018
Catalog of Federal Domestic Assistance.

- 133 -
NORTHWEST FIRE DISTRICT SCHEDULE OF FINDINGS AND QUESTIONED COSTS
YEAR ENDED JUNE 30, 2018
SECTION I - SUMMARY OF AUDITORS’ RESULTS
Financial Statements
Type of auditors’ report issued: Unmodified
Internal control over financial reporting:
• Material weakness(es) identified? _____ yes X no
• Significant deficiency(ies) identified that are
not considered to be a material weakness(es)? _____ yes X none reported
Noncompliance material to financial statements noted? _____ yes X no
Federal Awards
Internal control over major programs:
• Material weakness(es) identified? _____ yes X no
• Significant deficiency(ies) identified that are
not considered to be a material weakness(es)? _____ yes X none reported
Type of auditors’ report issued on compliance for major
programs: Unmodified
Any audit findings disclosed that are required to be reported in
accordance with §200.516 of Uniform Guidance: _____ yes X no
Identification of major programs:
CFDA Numbers Name of Federal Program or Cluster
97.083 Staffing for Adequate Fire and Emergency Response
Dollar threshold used to distinguish between Type A and Type
B programs: $750,000
Auditee qualified as low-risk auditee? _____ yes X no

- 134 -
NORTHWEST FIRE DISTRICT SCHEDULE OF FINDINGS AND QUESTIONED COSTS
YEAR ENDED JUNE 30, 2018
SECTION II – FINDINGS RELATED TO FINANCIAL STATEMENTS REPORTED IN
ACCORDANCE WITH GOVERNMENT AUDITING STANDARDS
None reported.
SECTION III – FINDINGS AND QUESTIONED COSTS RELATED TO FEDERAL AWARDS
None reported.

- 135 -
NORTHWEST FIRE DISTRICT SUMMARY SCHEDULE OF PRIOR AUDIT FINDINGS
YEAR ENDED JUNE 30, 2018
Status of Federal Award Findings and Questioned Costs
The District had no findings or questioned costs related to federal awards noted in prior audits that require
a status.

- 136 -
This page intentionally left blank