Embed Size (px)
Citation preview
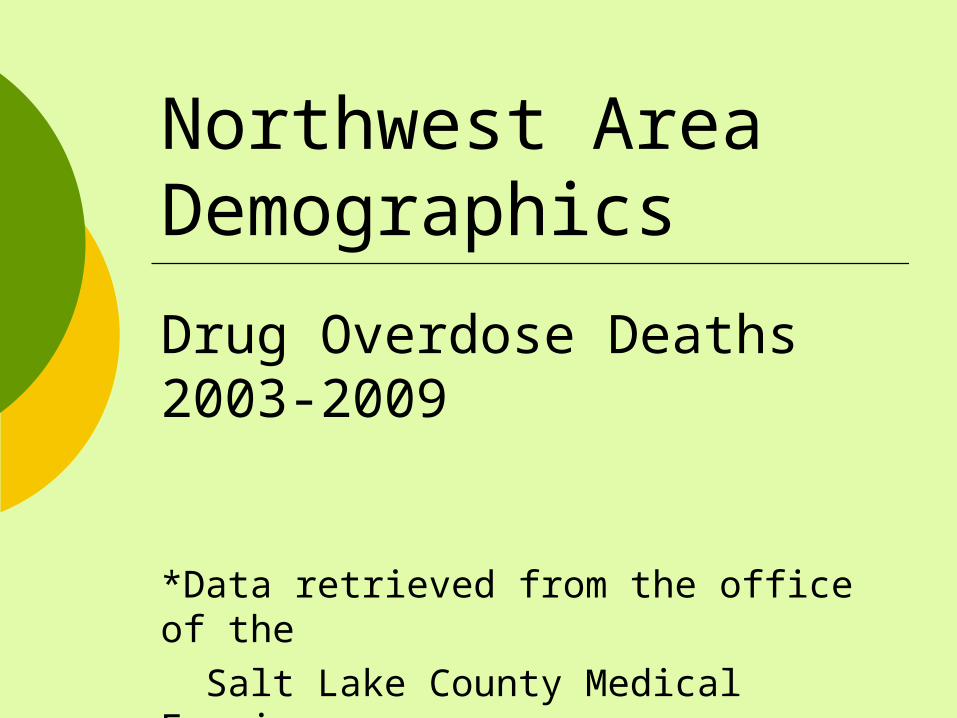
Northwest Area Demographics
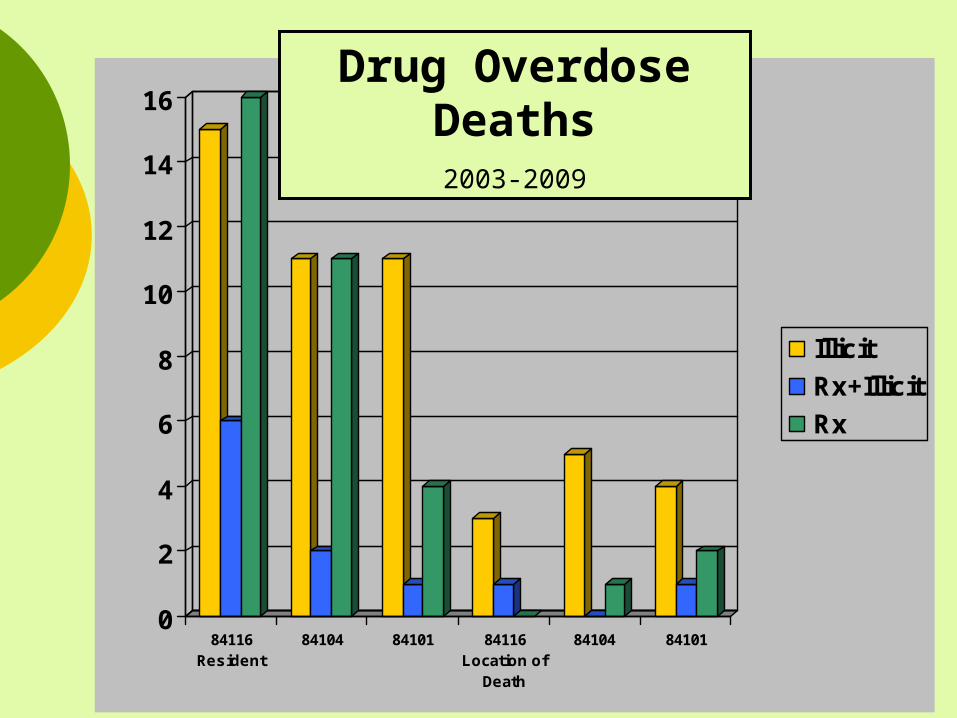
Drug Overdose Deaths 2003-2009
*Data retrieved from the office of the Salt Lake County Medical Examiner
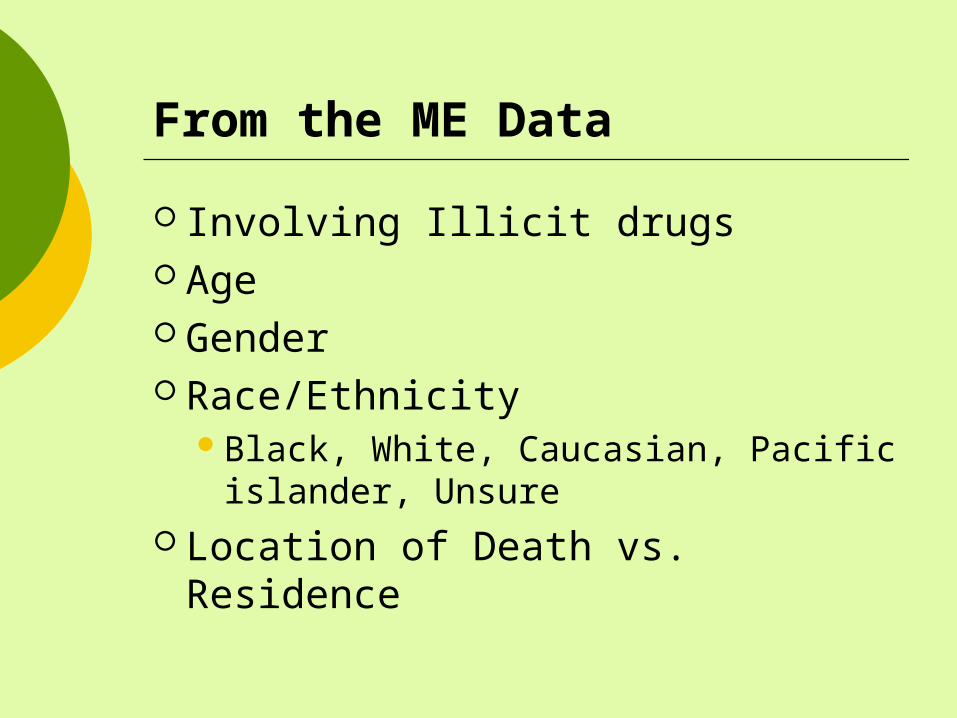
From the ME Data
Involving Illicit drugs Age Gender Race/Ethnicity
Black, White, Caucasian, Pacific islander, Unsure
Location of Death vs. Residence
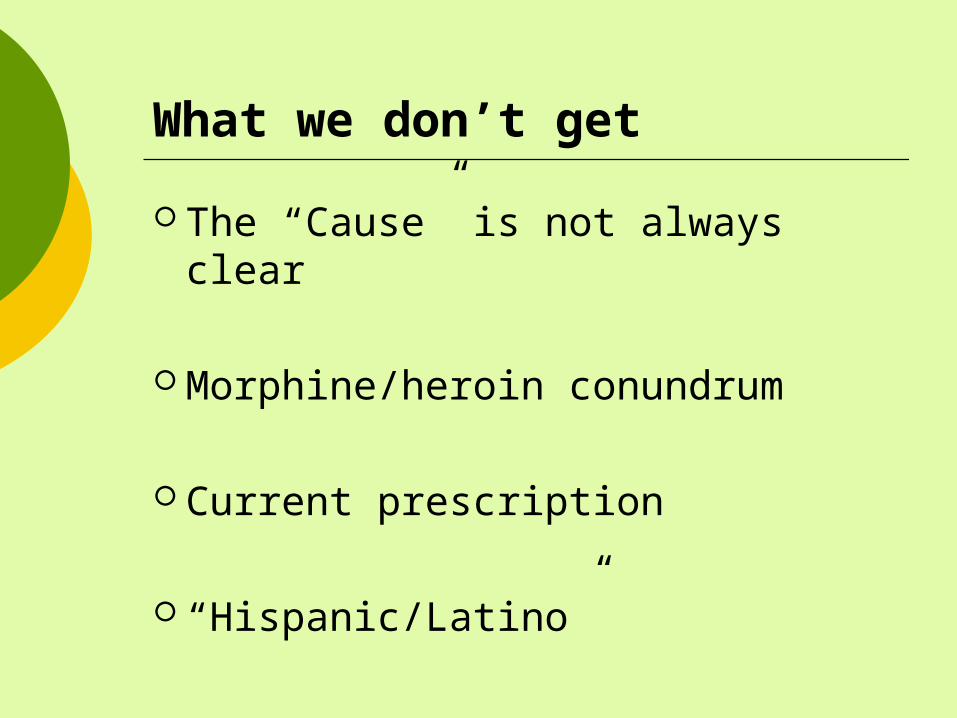
What we don’t get
The “Cause” is not always clear
Morphine/heroin conundrum
Current prescription
“Hispanic/Latino”
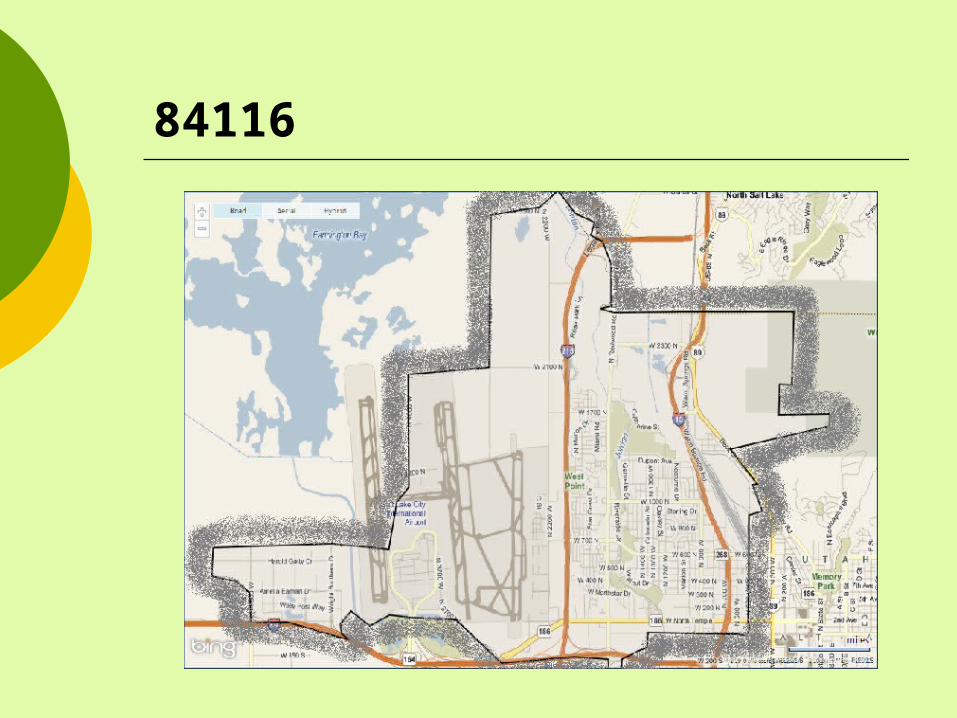
84116
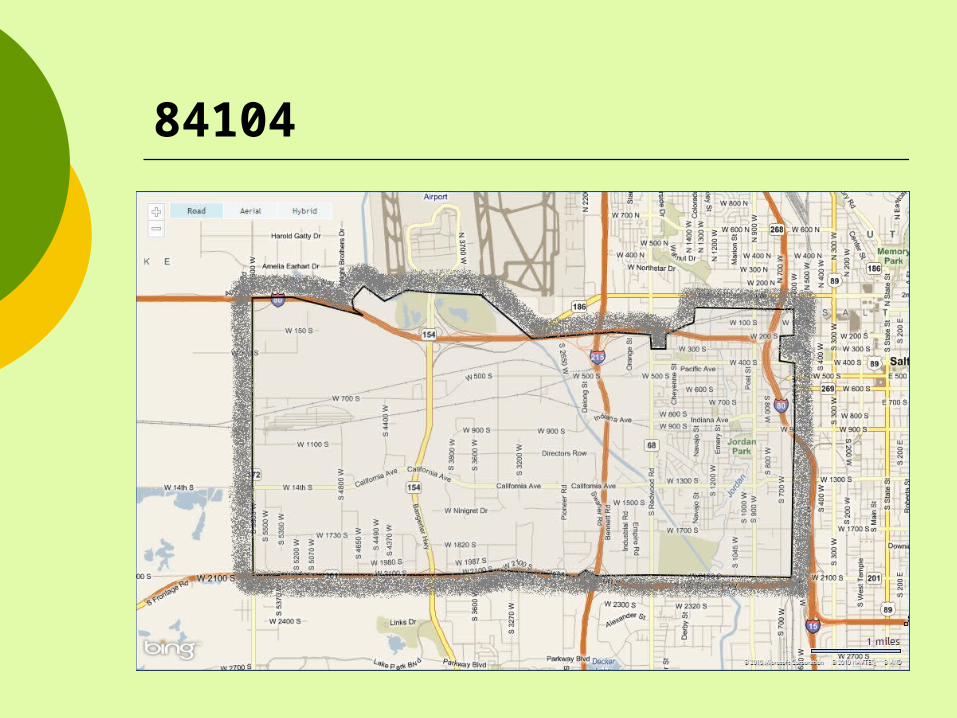
84104
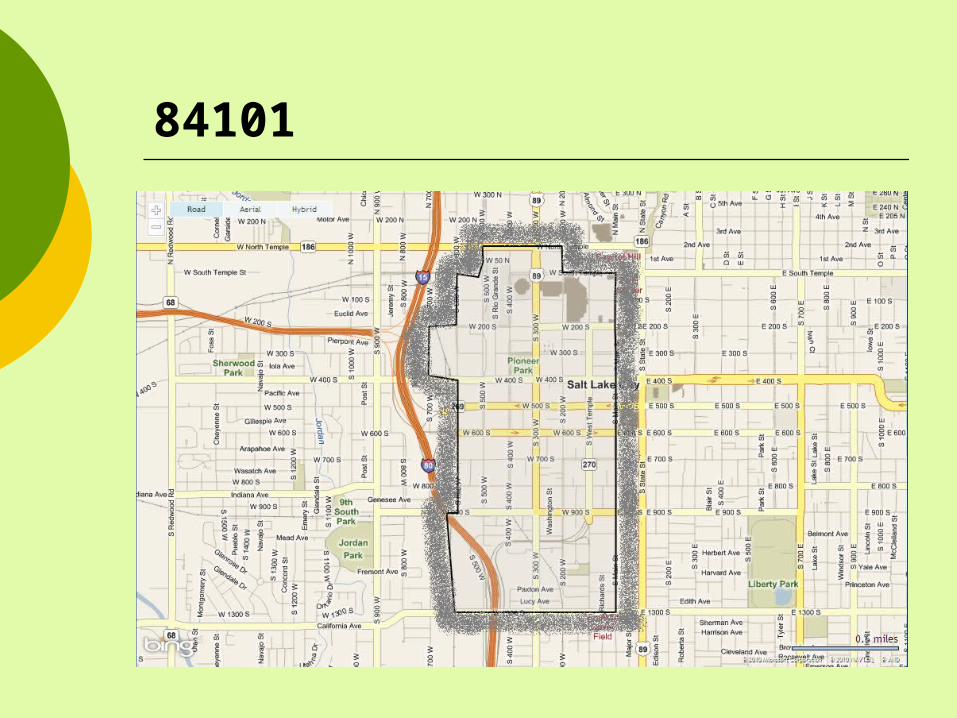
84101
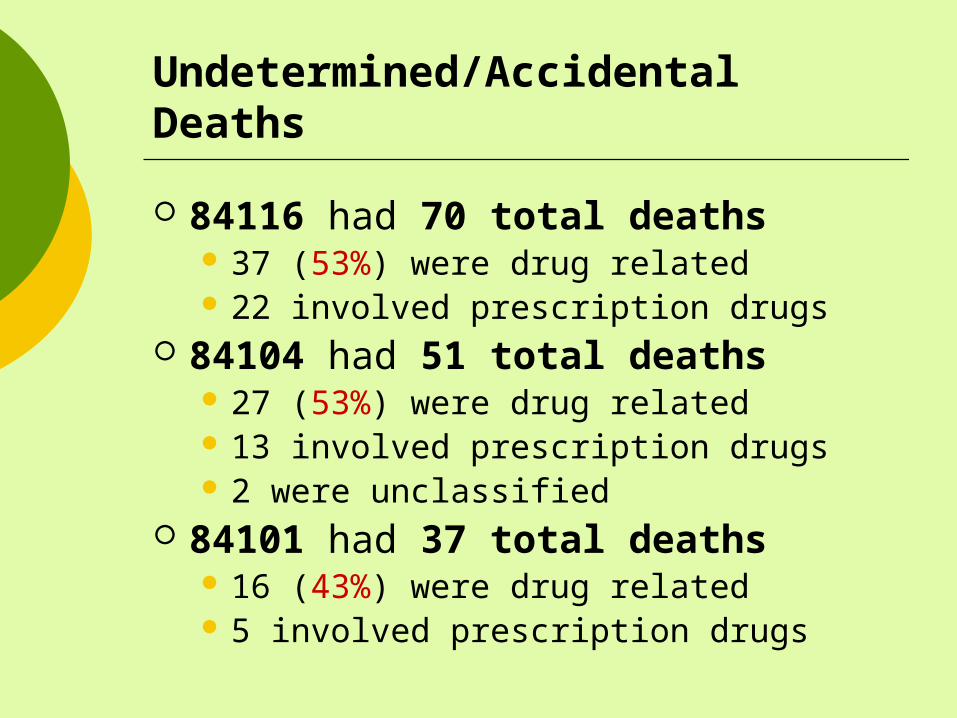
Undetermined/Accidental Deaths
84116 had 70 total deaths 37 (53%) were drug related 22 involved prescription drugs
84104 had 51 total deaths 27 (53%) were drug related 13 involved prescription drugs 2 were unclassified
84101 had 37 total deaths 16 (43%) were drug related 5 involved prescription drugs
0
2
4
6
8
10
12
14
16
84116Resident
84104 84101 84116Location of
Death
84104 84101
Illicit
Rx+Illicit
Rx
Drug Overdose Deaths
2003-2009
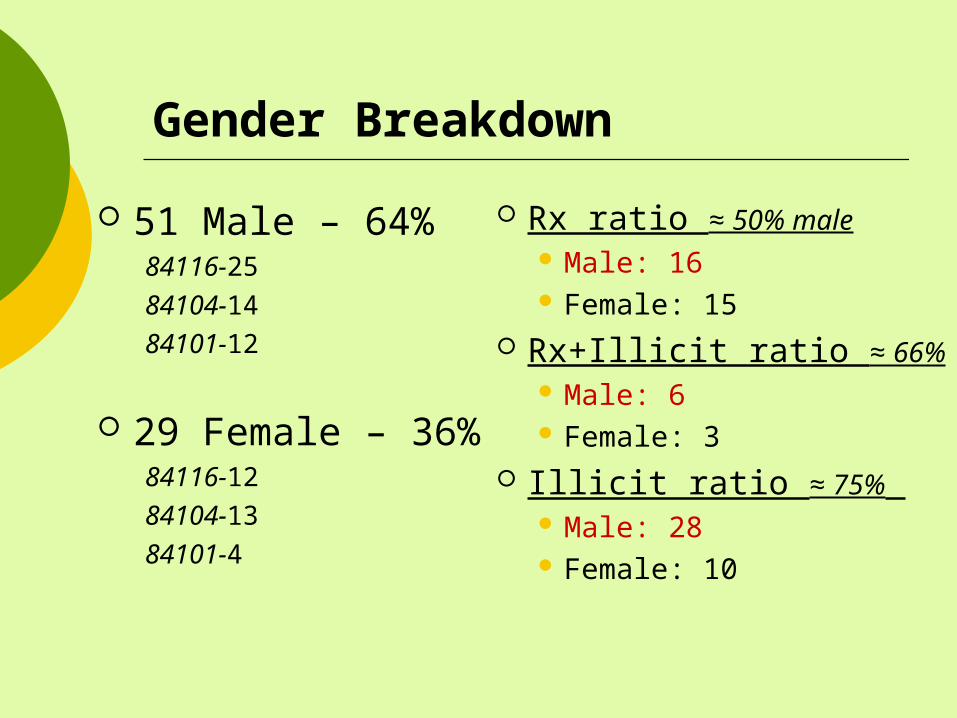
Gender Breakdown
51 Male – 64%84116-2584104-1484101-12
29 Female – 36%84116-1284104-1384101-4
Rx ratio ≈ 50% male Male: 16 Female: 15
Rx+Illicit ratio ≈ 66% Male: 6 Female: 3
Illicit ratio ≈ 75% Male: 28 Female: 10
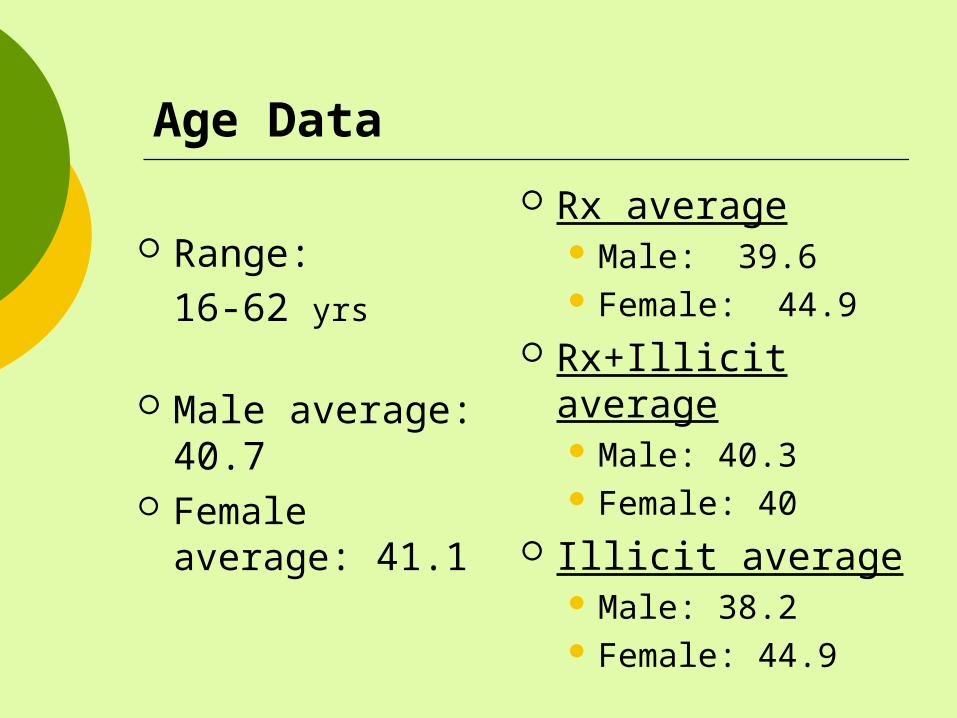
Age Data
Range: 16-62 yrs
Male average: 40.7
Female average: 41.1
Rx average Male: 39.6 Female: 44.9
Rx+Illicit average Male: 40.3 Female: 40
Illicit average Male: 38.2 Female: 44.9
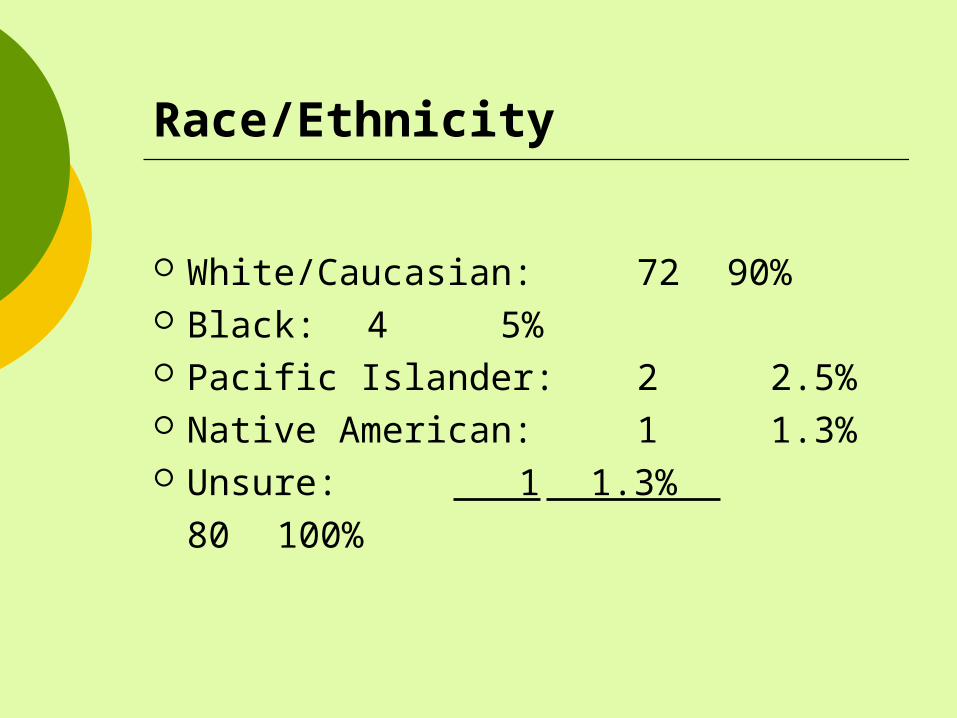
Race/Ethnicity
White/Caucasian: 72 90% Black: 4 5% Pacific Islander: 2 2.5% Native American: 1 1.3% Unsure: 1 1.3%
80 100%
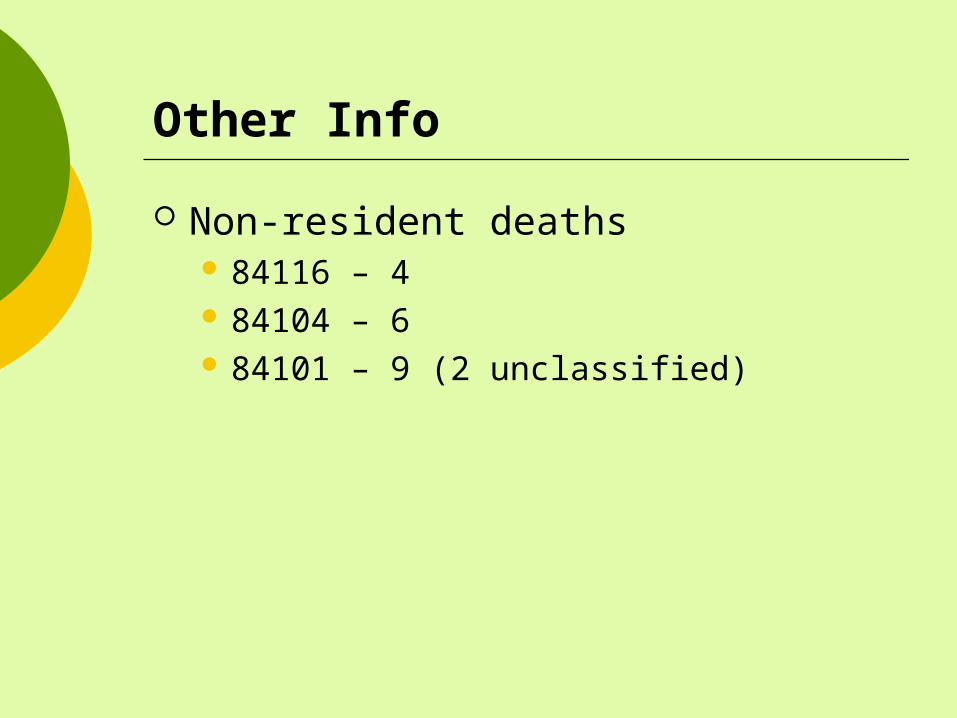
Other Info
Non-resident deaths 84116 – 4 84104 – 6 84101 – 9 (2 unclassified)