Embed Size (px)
Citation preview
Northumberland, Tyne and Wear NHS Foundation Trust
Board of Directors
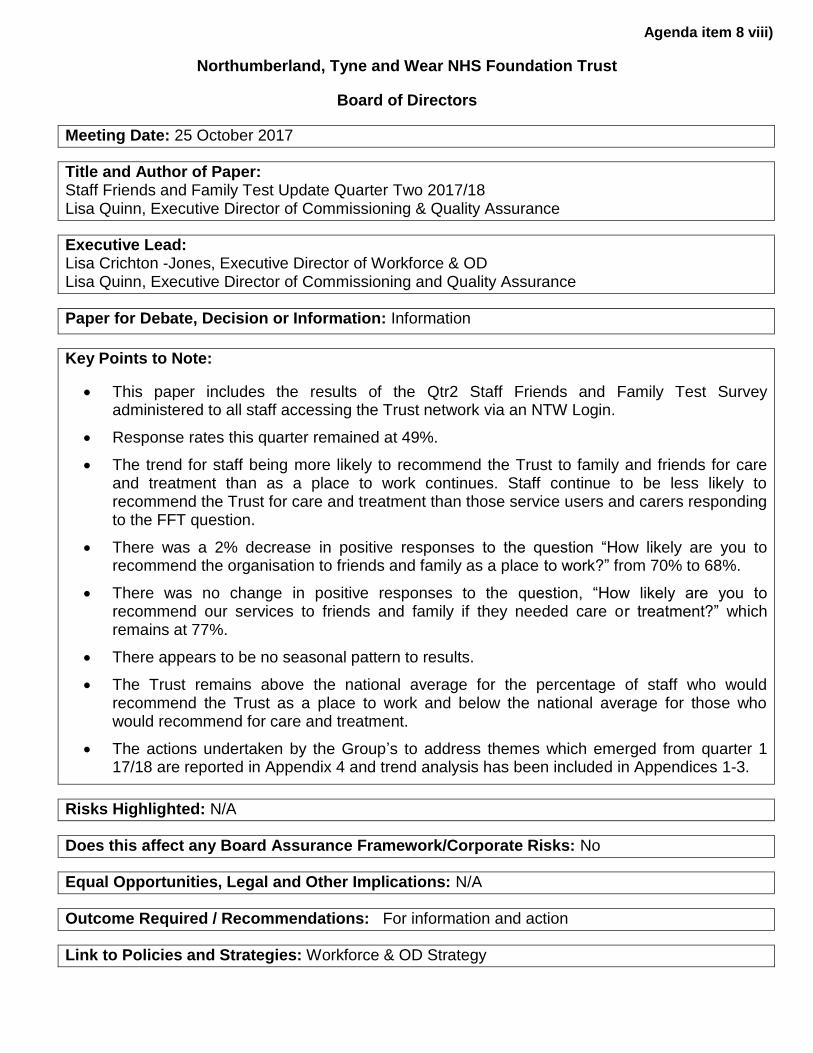
Meeting Date: 25 October 2017
Title and Author of Paper: Staff Friends and Family Test Update Quarter Two 2017/18 Lisa Quinn, Executive Director of Commissioning & Quality Assurance
Executive Lead: Lisa Crichton -Jones, Executive Director of Workforce & OD Lisa Quinn, Executive Director of Commissioning and Quality Assurance
Paper for Debate, Decision or Information: Information
Key Points to Note:
This paper includes the results of the Qtr2 Staff Friends and Family Test Survey administered to all staff accessing the Trust network via an NTW Login.
Response rates this quarter remained at 49%.
The trend for staff being more likely to recommend the Trust to family and friends for care and treatment than as a place to work continues. Staff continue to be less likely to recommend the Trust for care and treatment than those service users and carers responding to the FFT question.
There was a 2% decrease in positive responses to the question “How likely are you to recommend the organisation to friends and family as a place to work?” from 70% to 68%.
There was no change in positive responses to the question, “How likely are you to recommend our services to friends and family if they needed care or treatment?” which remains at 77%.
There appears to be no seasonal pattern to results.
The Trust remains above the national average for the percentage of staff who would recommend the Trust as a place to work and below the national average for those who would recommend for care and treatment.
The actions undertaken by the Group’s to address themes which emerged from quarter 1 17/18 are reported in Appendix 4 and trend analysis has been included in Appendices 1-3.
Risks Highlighted: N/A
Does this affect any Board Assurance Framework/Corporate Risks: No
Equal Opportunities, Legal and Other Implications: N/A
Outcome Required / Recommendations: For information and action
Link to Policies and Strategies: Workforce & OD Strategy
Agenda item 8 viii)
1
Staff Friends and Family Test (FFT) Update Quarter Two 2017/18
1. Executive Summary
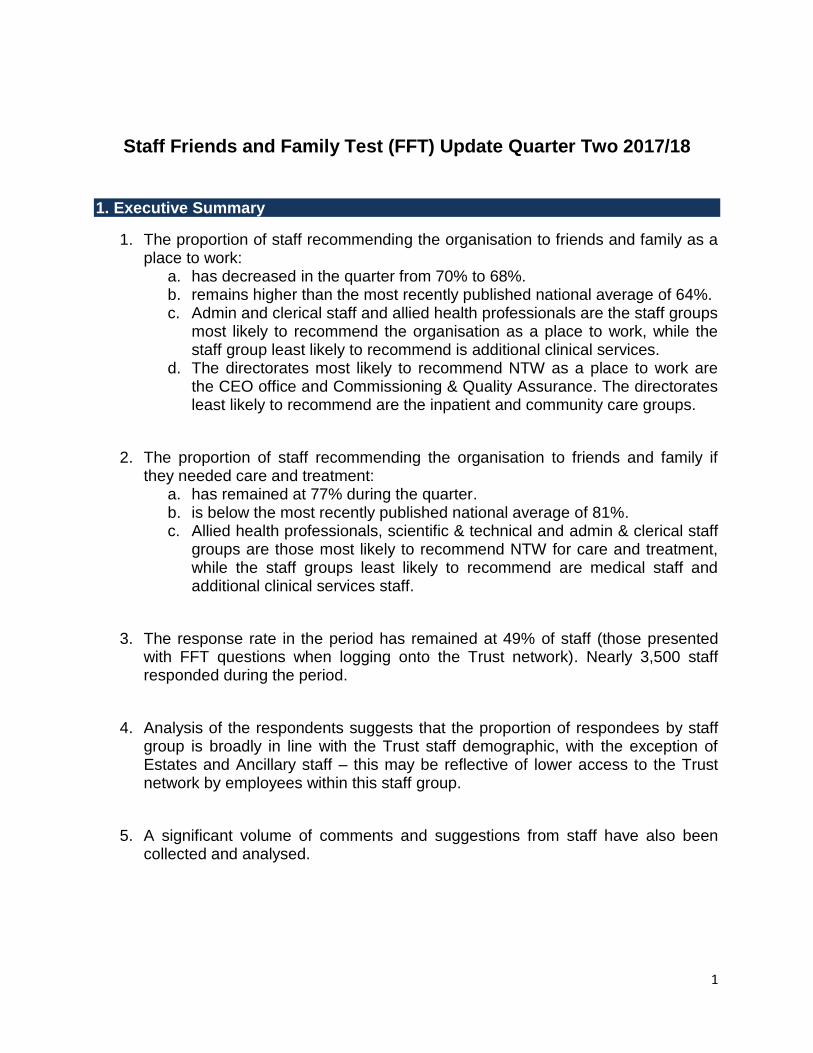
1. The proportion of staff recommending the organisation to friends and family as a place to work:
a. has decreased in the quarter from 70% to 68%. b. remains higher than the most recently published national average of 64%. c. Admin and clerical staff and allied health professionals are the staff groups
most likely to recommend the organisation as a place to work, while the staff group least likely to recommend is additional clinical services.
d. The directorates most likely to recommend NTW as a place to work are the CEO office and Commissioning & Quality Assurance. The directorates least likely to recommend are the inpatient and community care groups.
2. The proportion of staff recommending the organisation to friends and family if they needed care and treatment:
a. has remained at 77% during the quarter. b. is below the most recently published national average of 81%. c. Allied health professionals, scientific & technical and admin & clerical staff
groups are those most likely to recommend NTW for care and treatment, while the staff groups least likely to recommend are medical staff and additional clinical services staff.
3. The response rate in the period has remained at 49% of staff (those presented with FFT questions when logging onto the Trust network). Nearly 3,500 staff responded during the period.
4. Analysis of the respondents suggests that the proportion of respondees by staff group is broadly in line with the Trust staff demographic, with the exception of Estates and Ancillary staff – this may be reflective of lower access to the Trust network by employees within this staff group.
5. A significant volume of comments and suggestions from staff have also been collected and analysed.
2
2. Introduction
All NHS Trusts are required to ask staff their responses to the two Staff Friends and Family Test (FFT) questions, which are also included with the national staff survey conducted in Qtr3 of each year. The two Staff FFT questions are as below, with answer options ranging from ‘extremely likely’ to ‘extremely unlikely’ (6-point Likert scale, including ‘don’t know’ option):
1. How likely are you to recommend the organisation to friends and family as a place to work? (‘work’ question)
2. How likely are you to recommend our services to friends and family if they needed care and treatment? (‘care’ question)
NTW provides staff with the opportunity to feedback their views on the organisation throughout the year via a range of mechanisms, such as the annual staff survey, the Staff FFT (which is administered quarterly except Qtr3), speakeasy events and the chatterbox facility. Since 16/17, all staff have been asked their views in every quarter, therefore significantly increasing the volume of staff FFT responses in the year.
The Staff FFT responses are published nationally, allowing for national benchmarking to take place. Internally, anonymised responses to the staff FFT are made available to managers via the Trust dashboard.
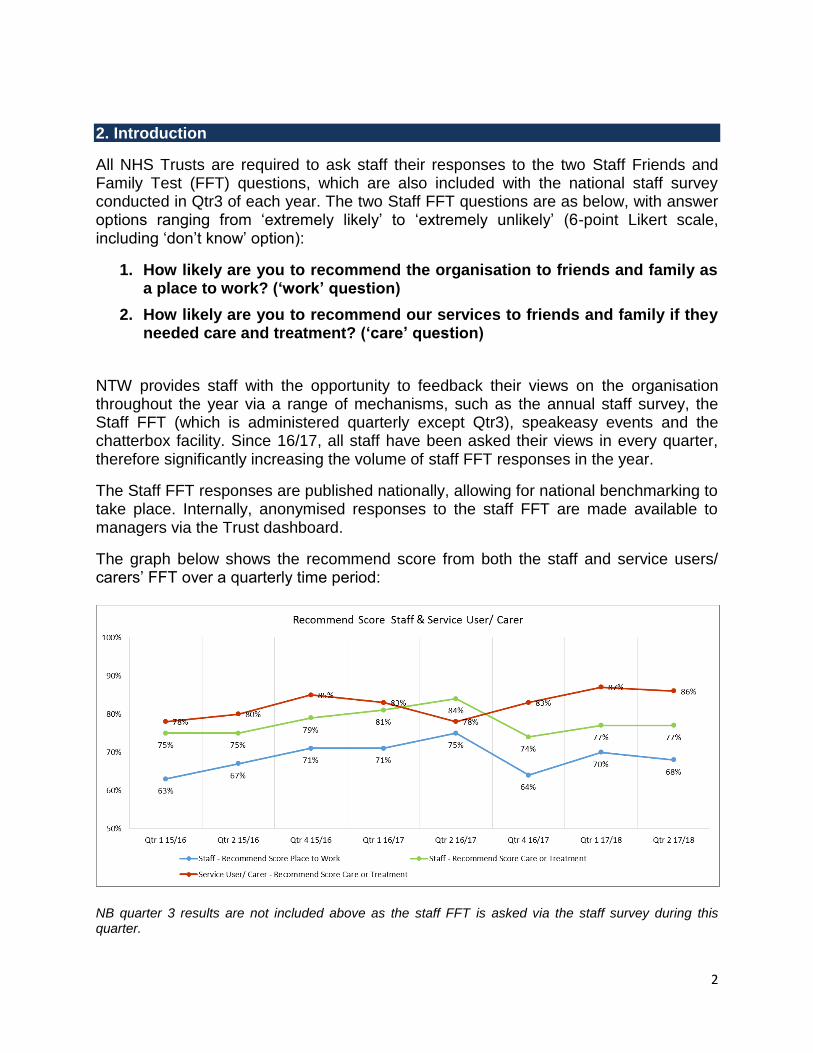
The graph below shows the recommend score from both the staff and service users/ carers’ FFT over a quarterly time period:
NB quarter 3 results are not included above as the staff FFT is asked via the staff survey during this quarter.
3
3. Results for Quarter 2 - 2017/18
3.1 Response rates
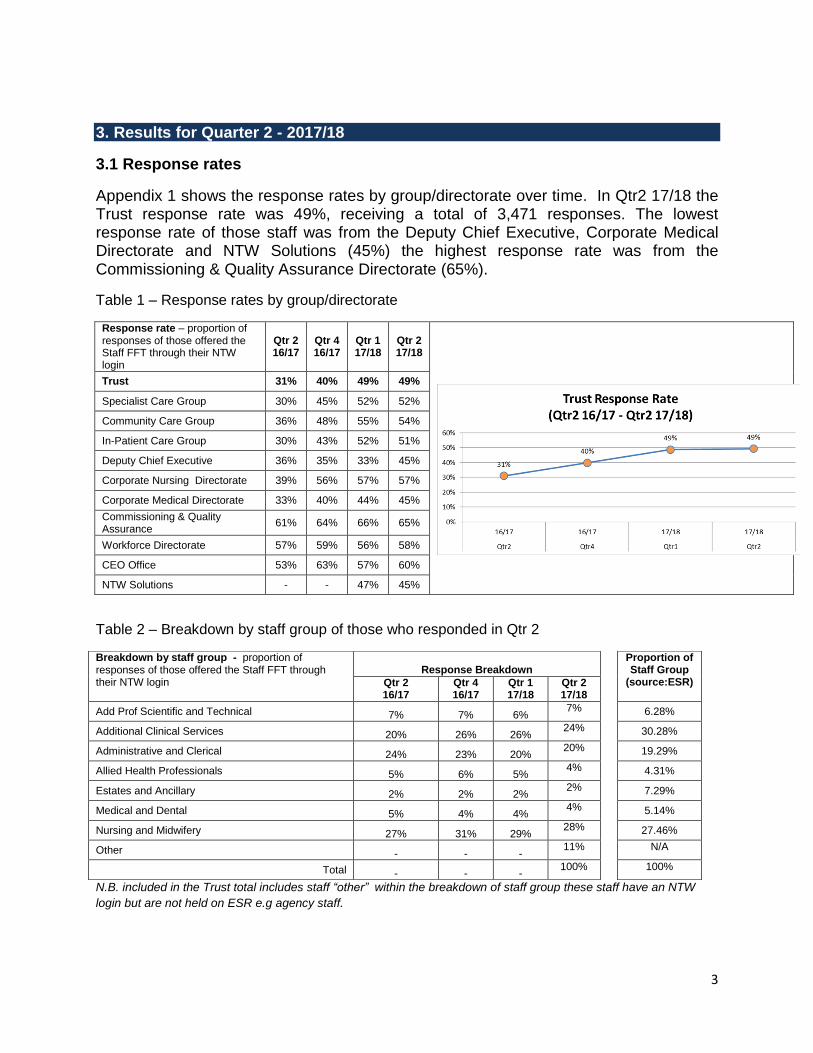
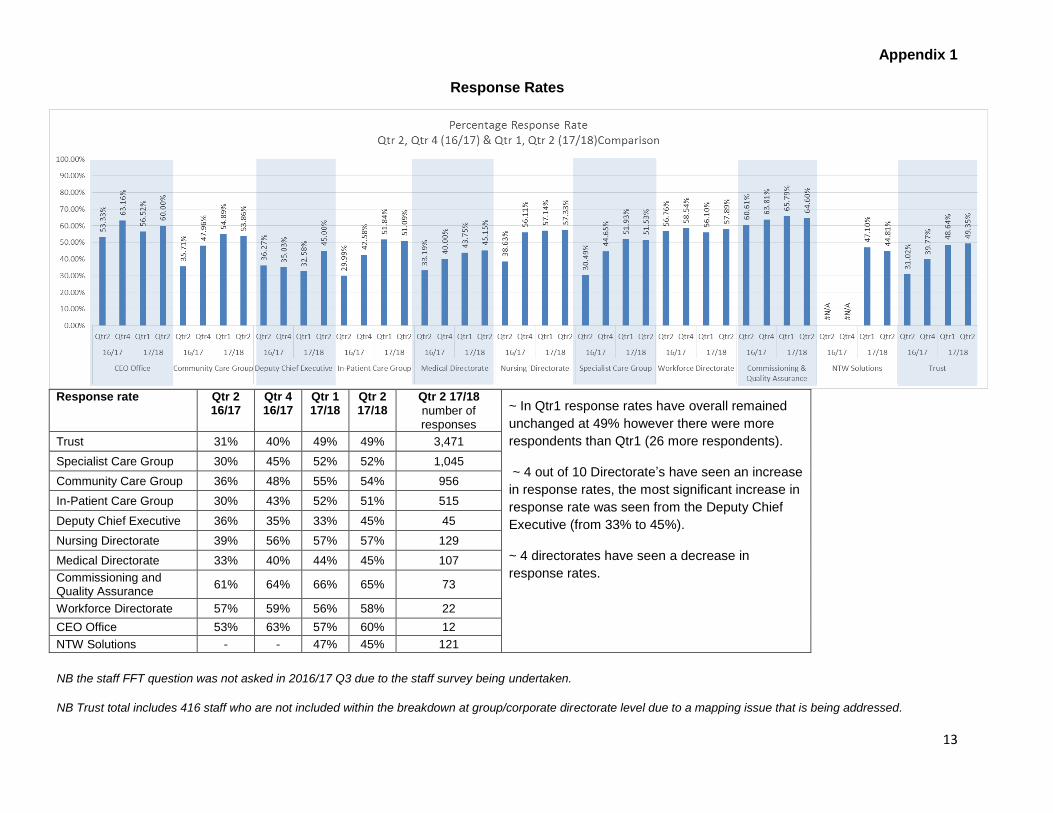
Appendix 1 shows the response rates by group/directorate over time. In Qtr2 17/18 the Trust response rate was 49%, receiving a total of 3,471 responses. The lowest response rate of those staff was from the Deputy Chief Executive, Corporate Medical Directorate and NTW Solutions (45%) the highest response rate was from the Commissioning & Quality Assurance Directorate (65%).
Table 1 – Response rates by group/directorate
Response rate – proportion of responses of those offered the Staff FFT through their NTW login
Qtr 2 16/17
Qtr 4 16/17
Qtr 1 17/18
Qtr 2 17/18
Trust 31% 40% 49% 49%
Specialist Care Group 30% 45% 52% 52%
Community Care Group 36% 48% 55% 54%
In-Patient Care Group 30% 43% 52% 51%
Deputy Chief Executive 36% 35% 33% 45%
Corporate Nursing Directorate 39% 56% 57% 57%
Corporate Medical Directorate 33% 40% 44% 45%
Commissioning & Quality Assurance
61% 64% 66% 65%
Workforce Directorate 57% 59% 56% 58%
CEO Office 53% 63% 57% 60%
NTW Solutions - - 47% 45%
Table 2 – Breakdown by staff group of those who responded in Qtr 2
N.B. included in the Trust total includes staff “other” within the breakdown of staff group these staff have an NTW
login but are not held on ESR e.g agency staff.
Breakdown by staff group - proportion of responses of those offered the Staff FFT through their NTW login
Response Breakdown
Proportion of Staff Group
(source:ESR) Qtr 2 16/17
Qtr 4 16/17
Qtr 1 17/18
Qtr 2 17/18
Add Prof Scientific and Technical 7% 7% 6% 7% 6.28%
Additional Clinical Services 20% 26% 26% 24% 30.28%
Administrative and Clerical 24% 23% 20% 20% 19.29%
Allied Health Professionals 5% 6% 5% 4% 4.31%
Estates and Ancillary 2% 2% 2% 2% 7.29%
Medical and Dental 5% 4% 4% 4% 5.14%
Nursing and Midwifery 27% 31% 29% 28% 27.46%
Other - - - 11% N/A
Total - - - 100% 100%
4
3.2 Responses by answer options and recommend score
Question 1:- How likely are you to recommend the organisation to
friends and family as a place to work? (Work Question)
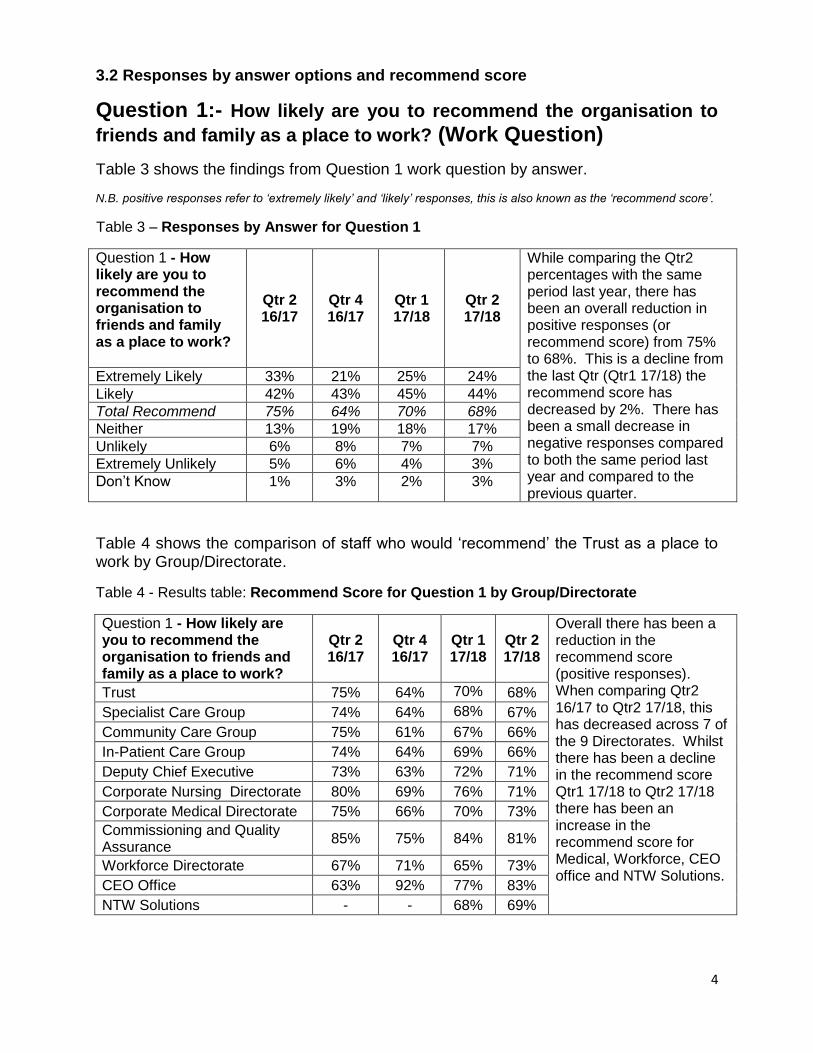
Table 3 shows the findings from Question 1 work question by answer.
N.B. positive responses refer to ‘extremely likely’ and ‘likely’ responses, this is also known as the ‘recommend score’.
Table 3 – Responses by Answer for Question 1
Question 1 - How likely are you to recommend the organisation to friends and family as a place to work?
Qtr 2 16/17
Qtr 4 16/17
Qtr 1 17/18
Qtr 2 17/18
While comparing the Qtr2 percentages with the same period last year, there has been an overall reduction in positive responses (or recommend score) from 75% to 68%. This is a decline from the last Qtr (Qtr1 17/18) the recommend score has decreased by 2%. There has been a small decrease in negative responses compared to both the same period last year and compared to the previous quarter.
Extremely Likely 33% 21% 25% 24%
Likely 42% 43% 45% 44%
Total Recommend 75% 64% 70% 68%
Neither 13% 19% 18% 17%
Unlikely 6% 8% 7% 7%
Extremely Unlikely 5% 6% 4% 3%
Don’t Know 1% 3% 2% 3%
Table 4 shows the comparison of staff who would ‘recommend’ the Trust as a place to work by Group/Directorate.
Table 4 - Results table: Recommend Score for Question 1 by Group/Directorate
Question 1 - How likely are you to recommend the organisation to friends and family as a place to work?
Qtr 2 16/17
Qtr 4 16/17
Qtr 1 17/18
Qtr 2 17/18
Overall there has been a reduction in the recommend score (positive responses). When comparing Qtr2 16/17 to Qtr2 17/18, this has decreased across 7 of the 9 Directorates. Whilst there has been a decline in the recommend score Qtr1 17/18 to Qtr2 17/18 there has been an increase in the recommend score for Medical, Workforce, CEO office and NTW Solutions.
Trust 75% 64% 70% 68%
Specialist Care Group 74% 64% 68% 67%
Community Care Group 75% 61% 67% 66%
In-Patient Care Group 74% 64% 69% 66%
Deputy Chief Executive 73% 63% 72% 71%
Corporate Nursing Directorate 80% 69% 76% 71%
Corporate Medical Directorate 75% 66% 70% 73%
Commissioning and Quality Assurance
85% 75% 84% 81%
Workforce Directorate 67% 71% 65% 73%
CEO Office 63% 92% 77% 83%
NTW Solutions - - 68% 69%
5
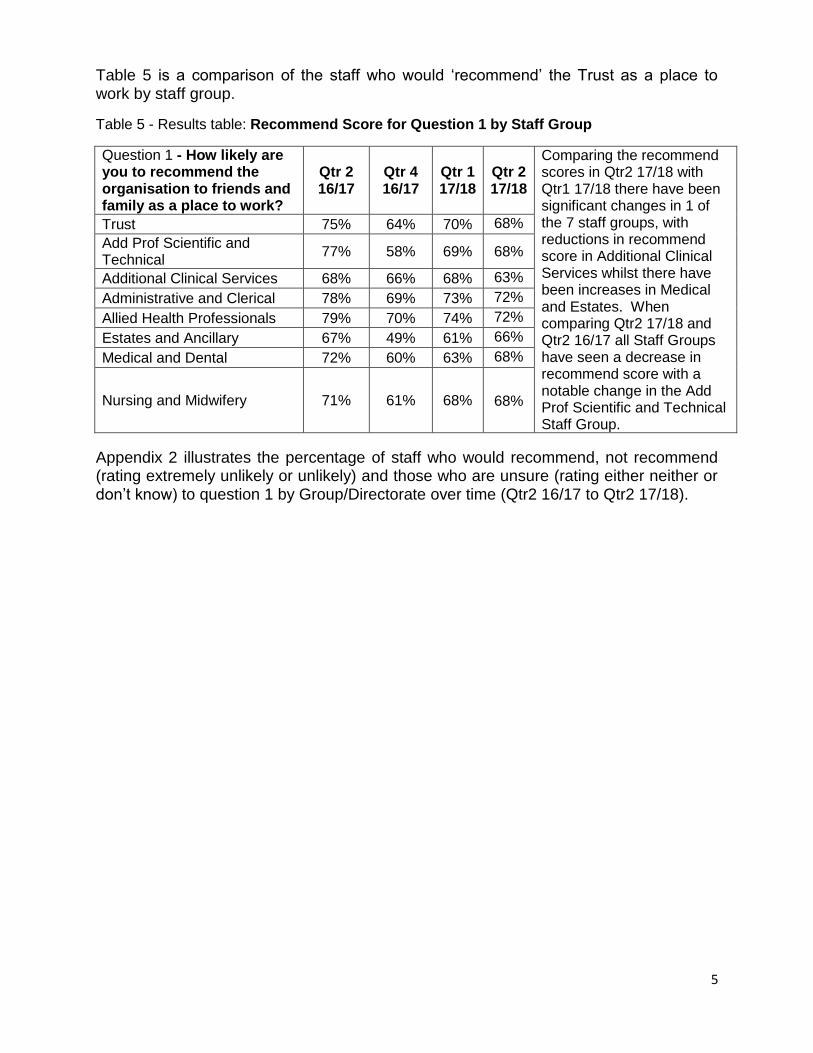
Table 5 is a comparison of the staff who would ‘recommend’ the Trust as a place to work by staff group.
Table 5 - Results table: Recommend Score for Question 1 by Staff Group
Question 1 - How likely are you to recommend the organisation to friends and family as a place to work?
Qtr 2 16/17
Qtr 4 16/17
Qtr 1 17/18
Qtr 2 17/18
Comparing the recommend scores in Qtr2 17/18 with Qtr1 17/18 there have been significant changes in 1 of the 7 staff groups, with reductions in recommend score in Additional Clinical Services whilst there have been increases in Medical and Estates. When comparing Qtr2 17/18 and Qtr2 16/17 all Staff Groups have seen a decrease in recommend score with a notable change in the Add Prof Scientific and Technical Staff Group.
Trust 75% 64% 70% 68%
Add Prof Scientific and Technical
77% 58% 69% 68%
Additional Clinical Services 68% 66% 68% 63%
Administrative and Clerical 78% 69% 73% 72%
Allied Health Professionals 79% 70% 74% 72%
Estates and Ancillary 67% 49% 61% 66%
Medical and Dental 72% 60% 63% 68%
Nursing and Midwifery 71% 61% 68%
68%
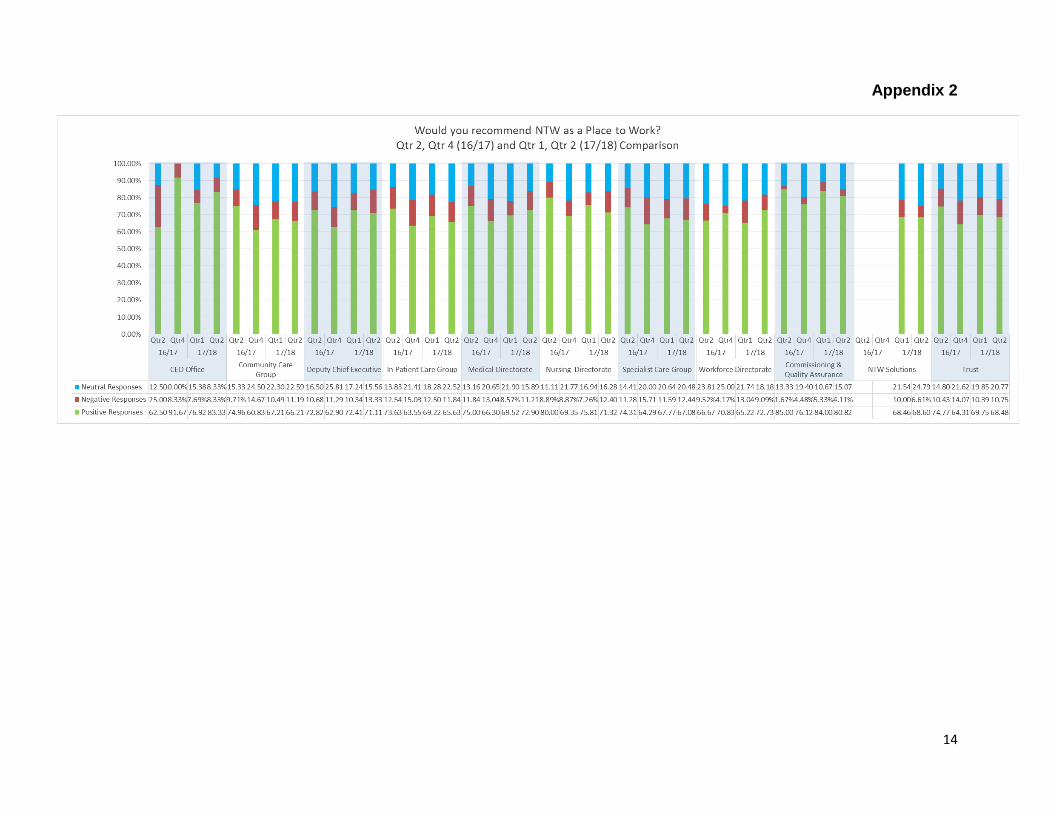
Appendix 2 illustrates the percentage of staff who would recommend, not recommend (rating extremely unlikely or unlikely) and those who are unsure (rating either neither or don’t know) to question 1 by Group/Directorate over time (Qtr2 16/17 to Qtr2 17/18).
6
Question 2:- How likely are you to recommend our services to
friends and family if they needed care or treatment? (Care Question)
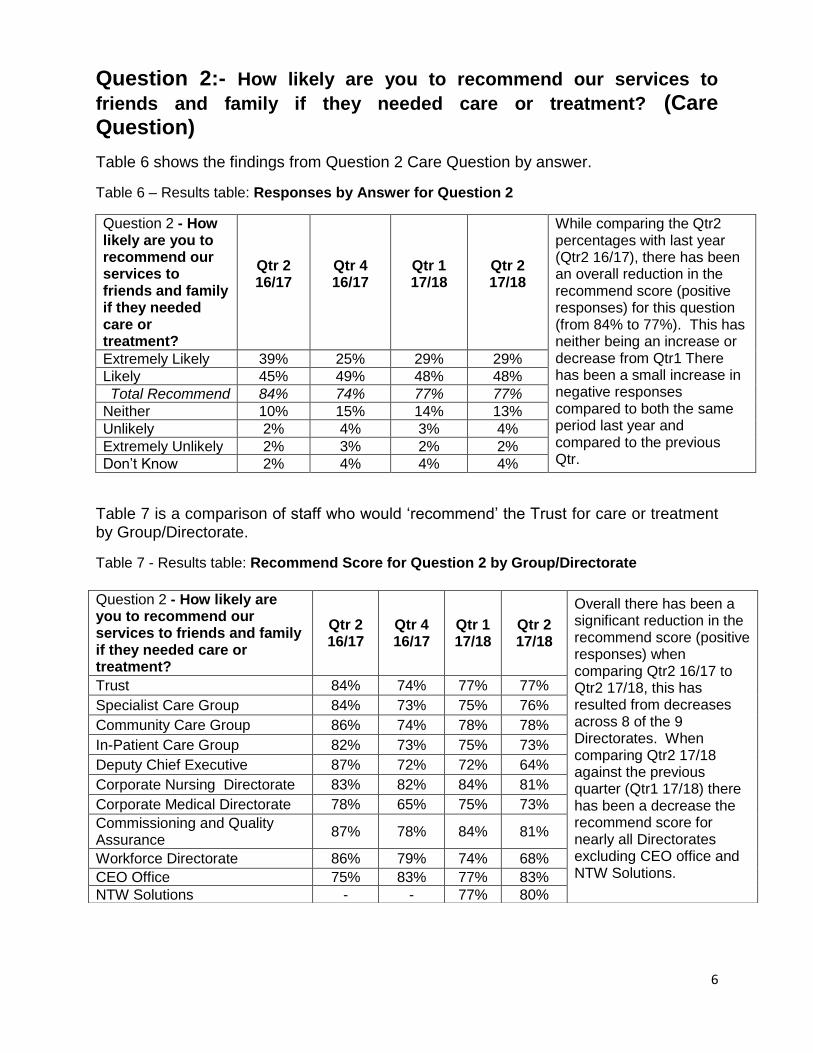
Table 6 shows the findings from Question 2 Care Question by answer.
Table 6 – Results table: Responses by Answer for Question 2
Question 2 - How likely are you to recommend our services to friends and family if they needed care or treatment?
Qtr 2 16/17
Qtr 4 16/17
Qtr 1 17/18
Qtr 2 17/18
While comparing the Qtr2 percentages with last year (Qtr2 16/17), there has been an overall reduction in the recommend score (positive responses) for this question (from 84% to 77%). This has neither being an increase or decrease from Qtr1 There has been a small increase in negative responses compared to both the same period last year and compared to the previous Qtr.
Extremely Likely 39% 25% 29% 29%
Likely 45% 49% 48% 48%
Total Recommend 84% 74% 77% 77%
Neither 10% 15% 14% 13%
Unlikely 2% 4% 3% 4%
Extremely Unlikely 2% 3% 2% 2%
Don’t Know 2% 4% 4% 4%
Table 7 is a comparison of staff who would ‘recommend’ the Trust for care or treatment by Group/Directorate.
Table 7 - Results table: Recommend Score for Question 2 by Group/Directorate
Question 2 - How likely are you to recommend our services to friends and family if they needed care or treatment?
Qtr 2 16/17
Qtr 4 16/17
Qtr 1 17/18
Qtr 2 17/18
Overall there has been a significant reduction in the recommend score (positive responses) when comparing Qtr2 16/17 to Qtr2 17/18, this has resulted from decreases across 8 of the 9 Directorates. When comparing Qtr2 17/18 against the previous quarter (Qtr1 17/18) there has been a decrease the recommend score for nearly all Directorates excluding CEO office and NTW Solutions.
Trust 84% 74% 77% 77%
Specialist Care Group 84% 73% 75% 76%
Community Care Group 86% 74% 78% 78%
In-Patient Care Group 82% 73% 75% 73%
Deputy Chief Executive 87% 72% 72% 64%
Corporate Nursing Directorate 83% 82% 84% 81%
Corporate Medical Directorate 78% 65% 75% 73%
Commissioning and Quality Assurance
87% 78% 84% 81%
Workforce Directorate 86% 79% 74% 68%
CEO Office 75% 83% 77% 83%
NTW Solutions - - 77% 80%
7
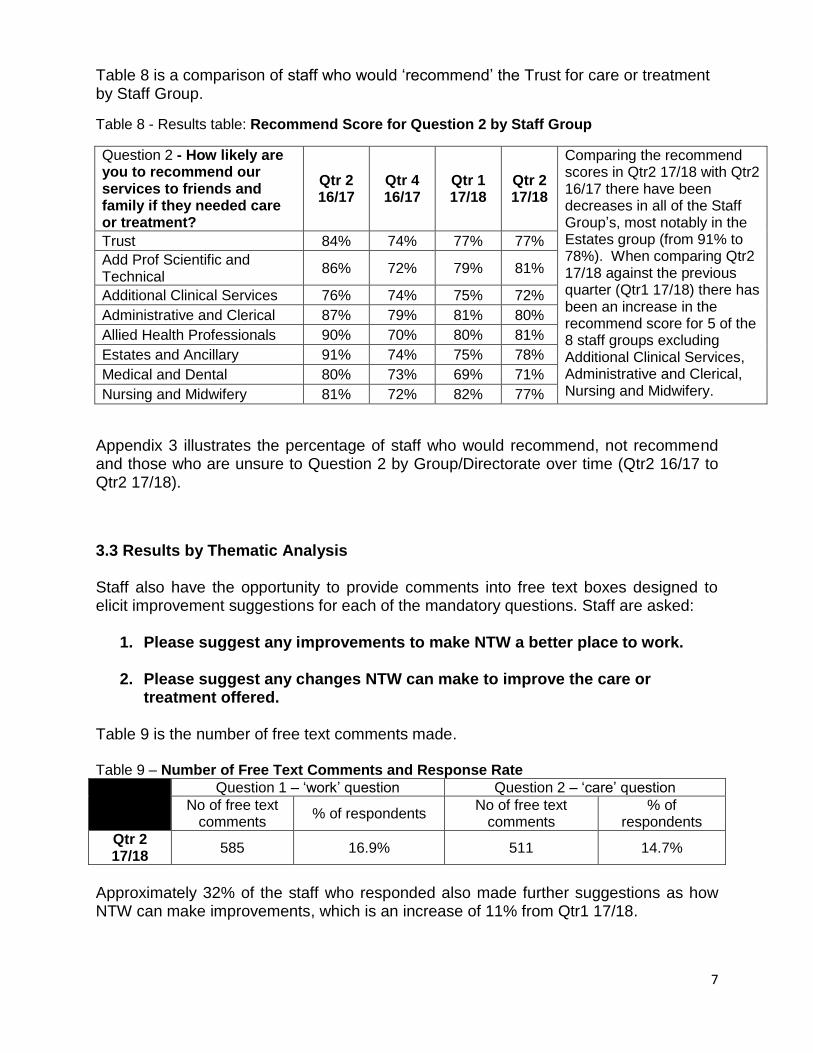
Table 8 is a comparison of staff who would ‘recommend’ the Trust for care or treatment by Staff Group.
Table 8 - Results table: Recommend Score for Question 2 by Staff Group
Question 2 - How likely are you to recommend our services to friends and family if they needed care or treatment?
Qtr 2 16/17
Qtr 4 16/17
Qtr 1 17/18
Qtr 2 17/18
Comparing the recommend scores in Qtr2 17/18 with Qtr2 16/17 there have been decreases in all of the Staff Group’s, most notably in the Estates group (from 91% to 78%). When comparing Qtr2 17/18 against the previous quarter (Qtr1 17/18) there has been an increase in the recommend score for 5 of the 8 staff groups excluding Additional Clinical Services, Administrative and Clerical, Nursing and Midwifery.
Trust 84% 74% 77% 77%
Add Prof Scientific and Technical
86% 72% 79% 81%
Additional Clinical Services 76% 74% 75% 72%
Administrative and Clerical 87% 79% 81% 80%
Allied Health Professionals 90% 70% 80% 81%
Estates and Ancillary 91% 74% 75% 78%
Medical and Dental 80% 73% 69% 71%
Nursing and Midwifery 81% 72% 82% 77%
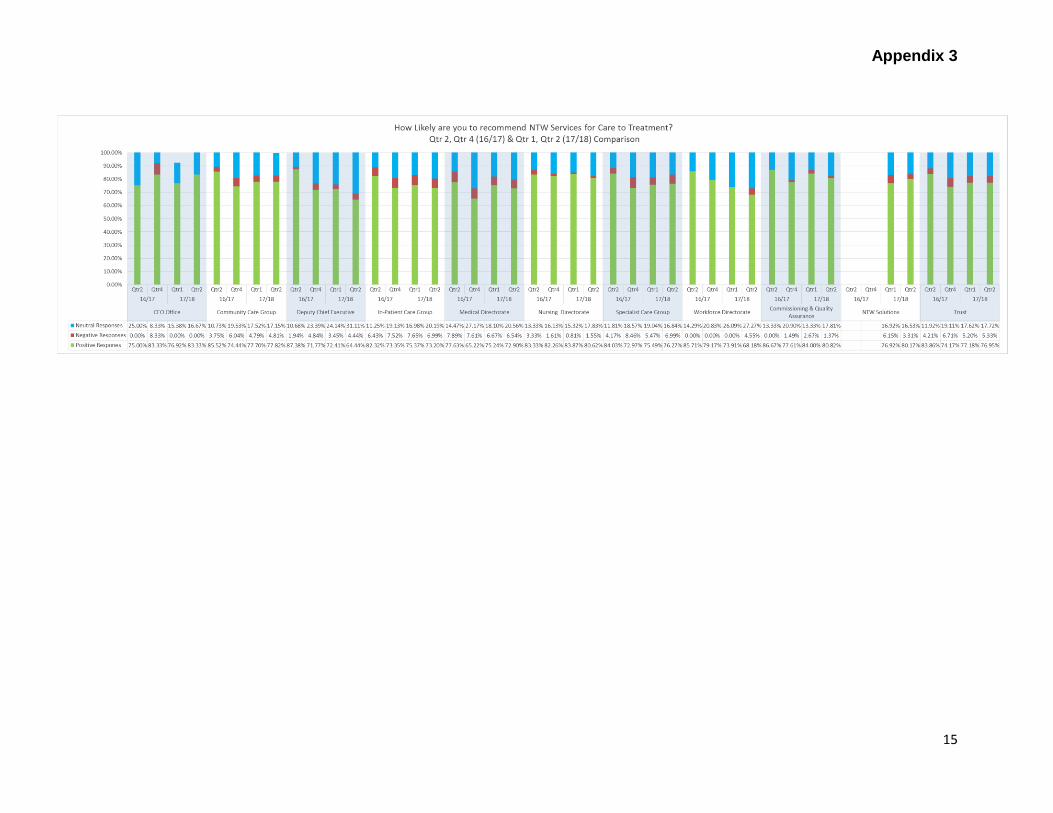
Appendix 3 illustrates the percentage of staff who would recommend, not recommend and those who are unsure to Question 2 by Group/Directorate over time (Qtr2 16/17 to Qtr2 17/18).
3.3 Results by Thematic Analysis Staff also have the opportunity to provide comments into free text boxes designed to elicit improvement suggestions for each of the mandatory questions. Staff are asked:
1. Please suggest any improvements to make NTW a better place to work.
2. Please suggest any changes NTW can make to improve the care or treatment offered.
Table 9 is the number of free text comments made. Table 9 – Number of Free Text Comments and Response Rate Question 1 – ‘work’ question Question 2 – ‘care’ question
No of free text comments
% of respondents No of free text
comments % of
respondents
Qtr 2 17/18
585 16.9% 511 14.7%
Approximately 32% of the staff who responded also made further suggestions as how NTW can make improvements, which is an increase of 11% from Qtr1 17/18.
8
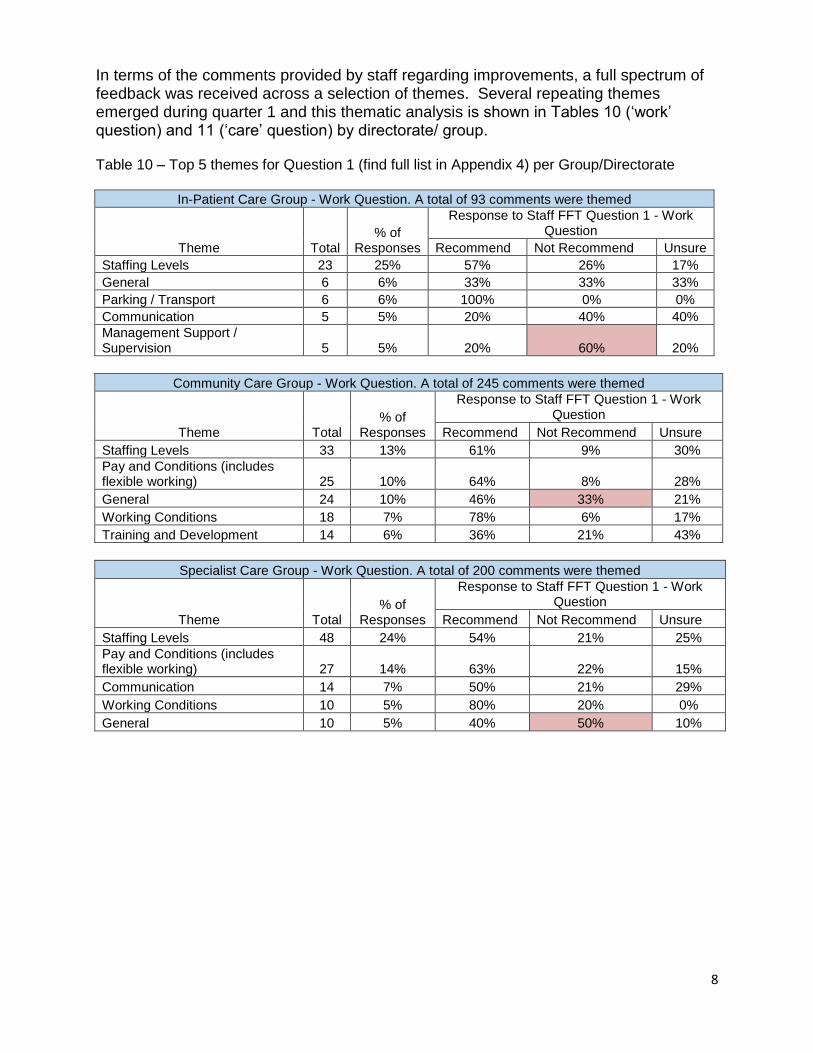
In terms of the comments provided by staff regarding improvements, a full spectrum of feedback was received across a selection of themes. Several repeating themes emerged during quarter 1 and this thematic analysis is shown in Tables 10 (‘work’ question) and 11 (‘care’ question) by directorate/ group. Table 10 – Top 5 themes for Question 1 (find full list in Appendix 4) per Group/Directorate
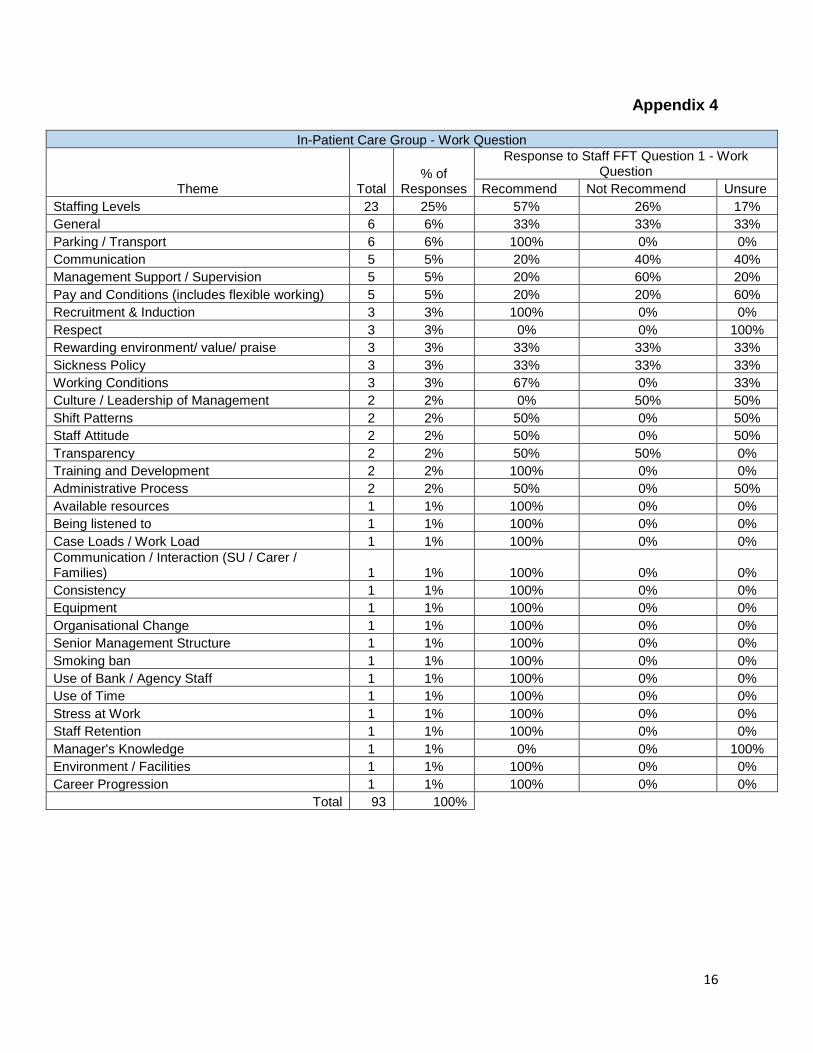
In-Patient Care Group - Work Question. A total of 93 comments were themed
Theme Total % of
Responses
Response to Staff FFT Question 1 - Work Question
Recommend Not Recommend Unsure
Staffing Levels 23 25% 57% 26% 17%
General 6 6% 33% 33% 33%
Parking / Transport 6 6% 100% 0% 0%
Communication 5 5% 20% 40% 40%
Management Support / Supervision 5 5% 20% 60% 20%
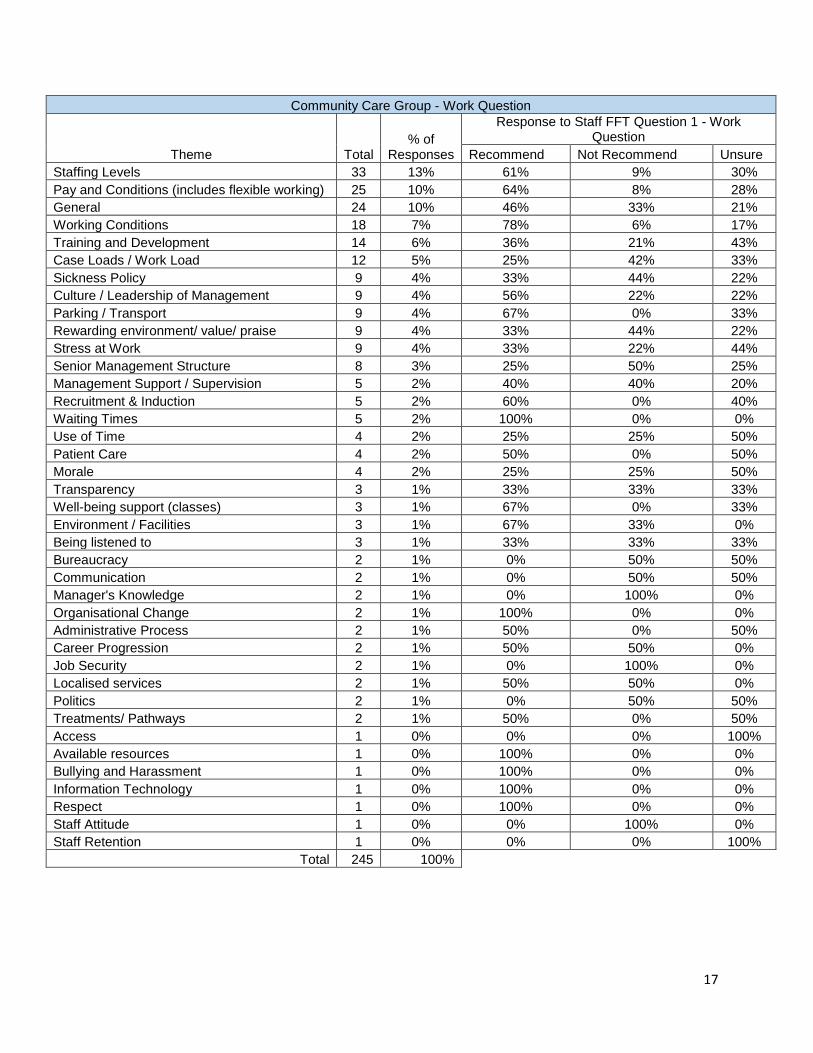
Community Care Group - Work Question. A total of 245 comments were themed
Theme Total % of
Responses
Response to Staff FFT Question 1 - Work Question
Recommend Not Recommend Unsure
Staffing Levels 33 13% 61% 9% 30%
Pay and Conditions (includes flexible working) 25 10% 64% 8% 28%
General 24 10% 46% 33% 21%
Working Conditions 18 7% 78% 6% 17%
Training and Development 14 6% 36% 21% 43%
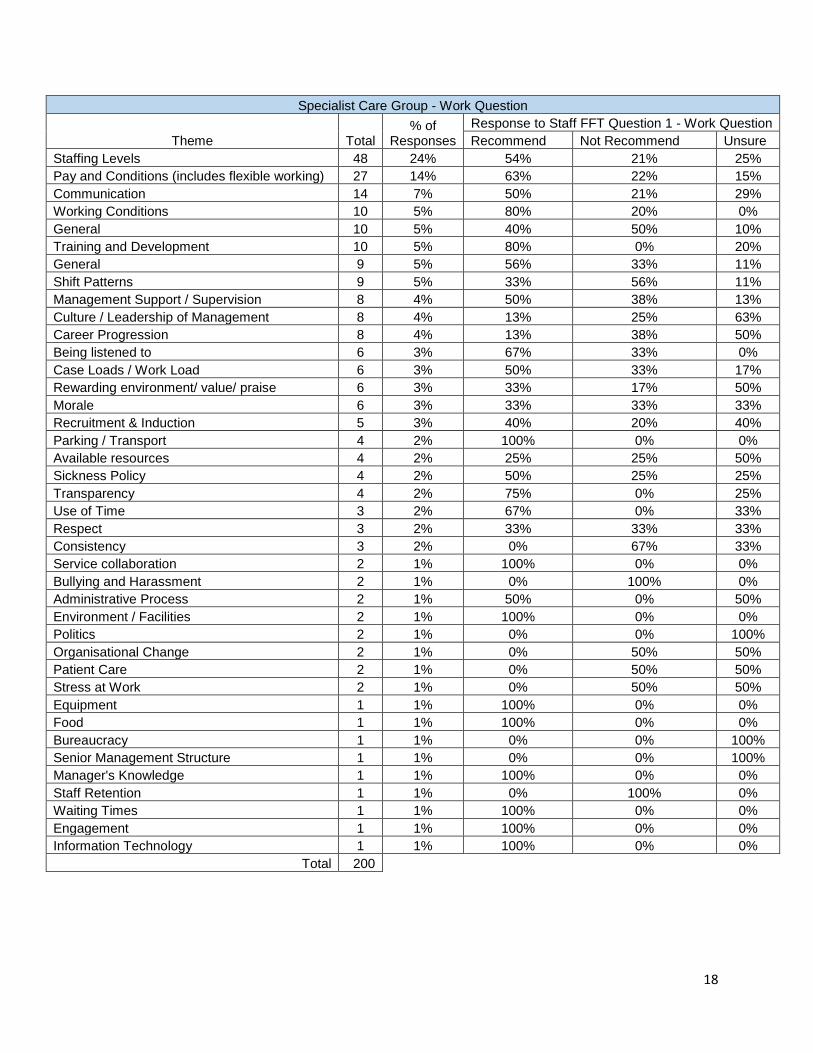
Specialist Care Group - Work Question. A total of 200 comments were themed
Theme Total % of
Responses
Response to Staff FFT Question 1 - Work Question
Recommend Not Recommend Unsure
Staffing Levels 48 24% 54% 21% 25%
Pay and Conditions (includes flexible working) 27 14% 63% 22% 15%
Communication 14 7% 50% 21% 29%
Working Conditions 10 5% 80% 20% 0%
General 10 5% 40% 50% 10%
9
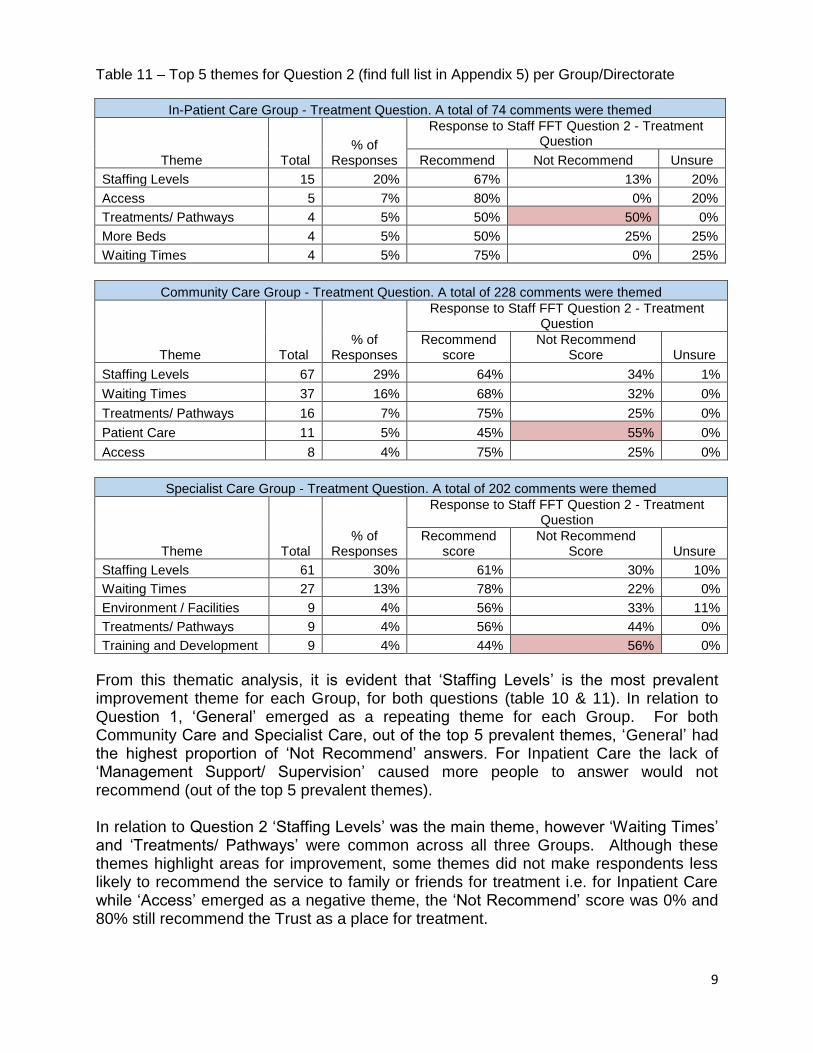
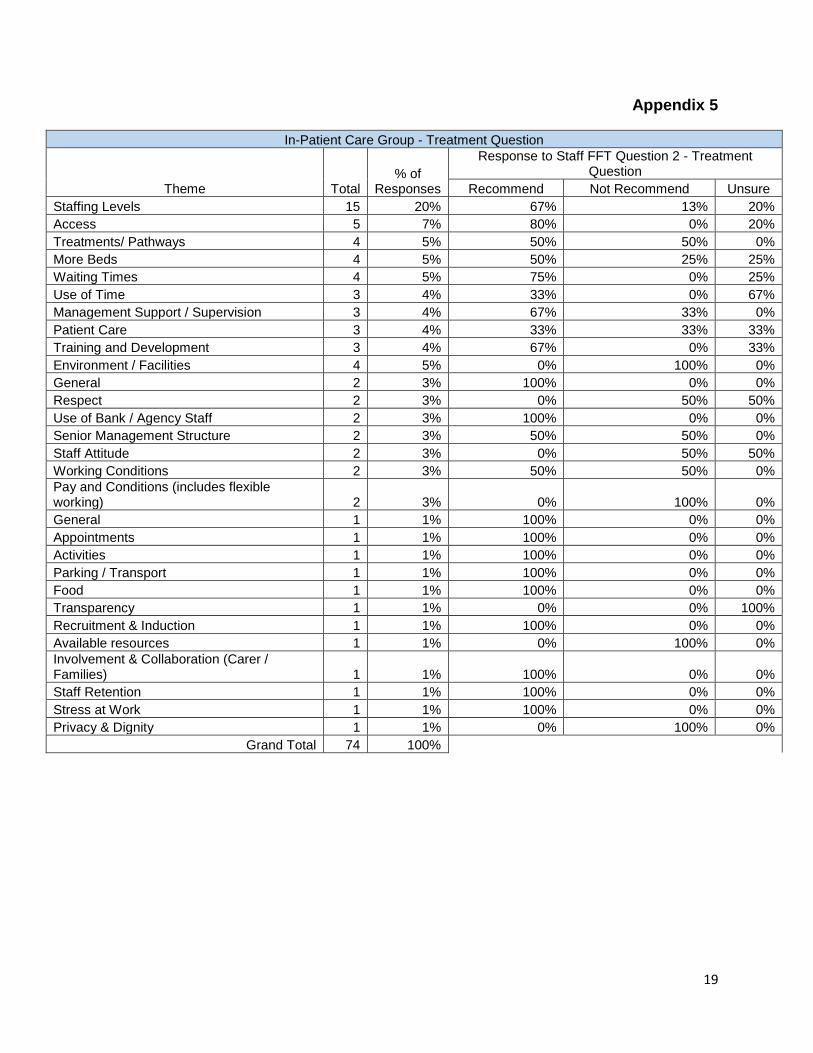
Table 11 – Top 5 themes for Question 2 (find full list in Appendix 5) per Group/Directorate
In-Patient Care Group - Treatment Question. A total of 74 comments were themed
Theme Total % of
Responses
Response to Staff FFT Question 2 - Treatment Question
Recommend Not Recommend Unsure
Staffing Levels 15 20% 67% 13% 20%
Access 5 7% 80% 0% 20%
Treatments/ Pathways 4 5% 50% 50% 0%
More Beds 4 5% 50% 25% 25%
Waiting Times 4 5% 75% 0% 25%
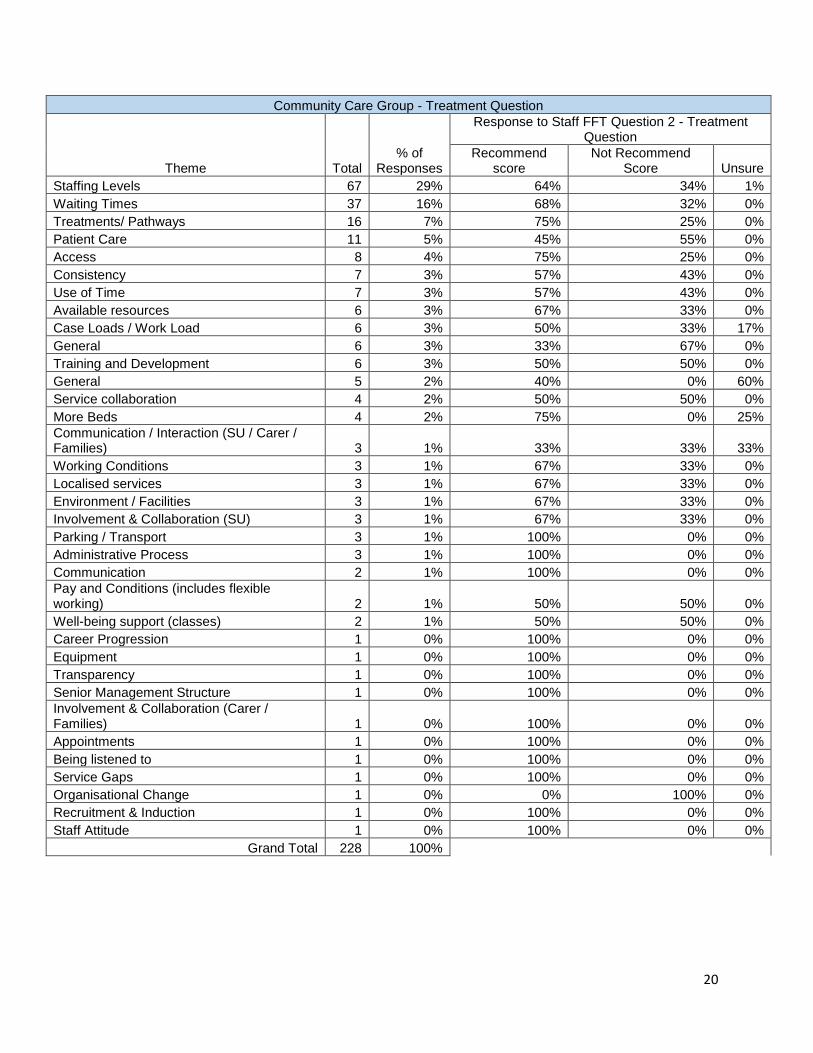
Community Care Group - Treatment Question. A total of 228 comments were themed
Theme Total % of
Responses
Response to Staff FFT Question 2 - Treatment Question
Recommend score
Not Recommend Score Unsure
Staffing Levels 67 29% 64% 34% 1%
Waiting Times 37 16% 68% 32% 0%
Treatments/ Pathways 16 7% 75% 25% 0%
Patient Care 11 5% 45% 55% 0%
Access 8 4% 75% 25% 0%
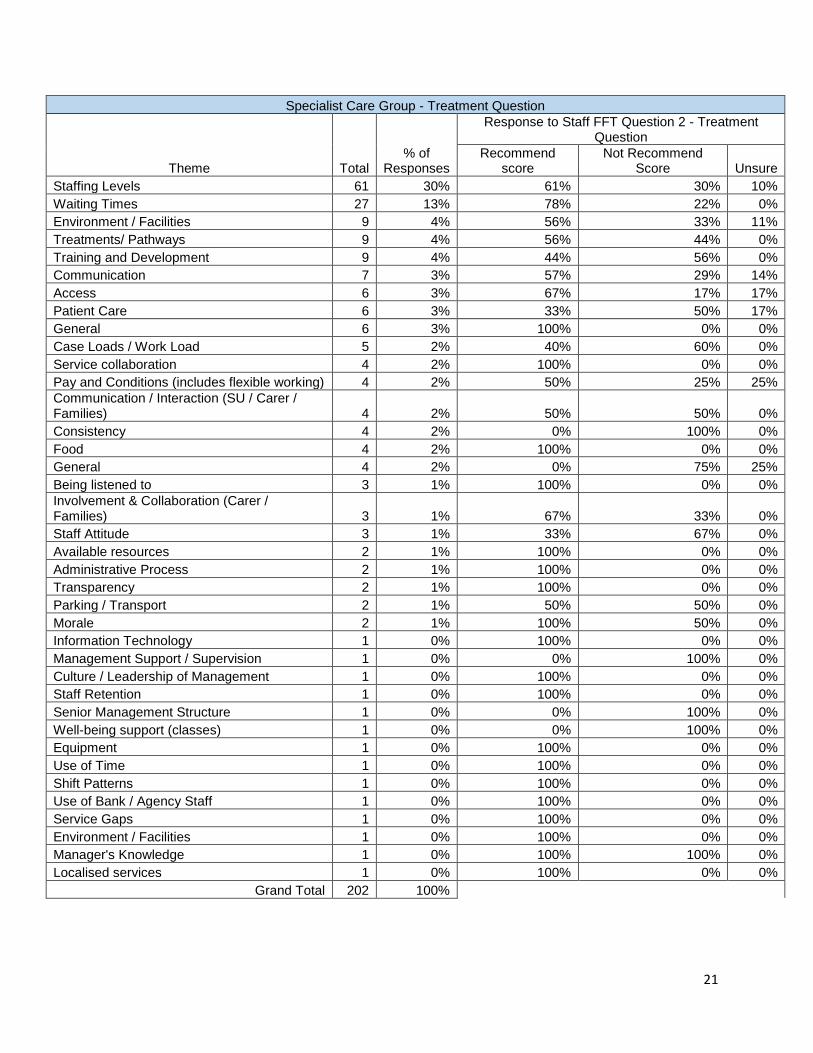
Specialist Care Group - Treatment Question. A total of 202 comments were themed
Theme Total % of
Responses
Response to Staff FFT Question 2 - Treatment Question
Recommend score
Not Recommend Score Unsure
Staffing Levels 61 30% 61% 30% 10%
Waiting Times 27 13% 78% 22% 0%
Environment / Facilities 9 4% 56% 33% 11%
Treatments/ Pathways 9 4% 56% 44% 0%
Training and Development 9 4% 44% 56% 0%
From this thematic analysis, it is evident that ‘Staffing Levels’ is the most prevalent improvement theme for each Group, for both questions (table 10 & 11). In relation to Question 1, ‘General’ emerged as a repeating theme for each Group. For both Community Care and Specialist Care, out of the top 5 prevalent themes, ‘General’ had the highest proportion of ‘Not Recommend’ answers. For Inpatient Care the lack of ‘Management Support/ Supervision’ caused more people to answer would not recommend (out of the top 5 prevalent themes). In relation to Question 2 ‘Staffing Levels’ was the main theme, however ‘Waiting Times’ and ‘Treatments/ Pathways’ were common across all three Groups. Although these themes highlight areas for improvement, some themes did not make respondents less likely to recommend the service to family or friends for treatment i.e. for Inpatient Care while ‘Access’ emerged as a negative theme, the ‘Not Recommend’ score was 0% and 80% still recommend the Trust as a place for treatment.
10
The FFT results are available anonymously via the dashboards. Clinical Groups and Operational Departments are again asked to consider their results, not only for the quarter but over the time the FFT has been running to determine themes and local issues and consider actions to address these. The Groups have considered the results which emerged from Qtr1 17/18 and are undertaking actions to ensure improvement. Some of the key actions taken to address the themes by Groups/Directorates are listed at Appendix 6. Included below are examples of improvements comments received by staff in Qtr2 (who identified they were happy for their comments to be published): Improvements to make NTW a better place to work: “Improve staffing levels and communication from higher management to front line staff.” “Listen to staff at ground level (collective leadership); Not to be hierarchical in staffing levels; Increase staffing.” “Pay scales are ridiculous and there is very little scope to move up the banding. No motivation or incentives.” Changes NTW can make to improve the care or treatment offered: "Front line resources are significantly squeezed and as a consequence waiting times for community treatments are growing more difficult to access. There needs to be a better provision of community services to account for the reduction in the bed based models” “Focus on evidence based treatment” “Listen to family and carers about our loved ones before making decisions based on a short consultation, this will save lots of agony and heartache in the future.”
11
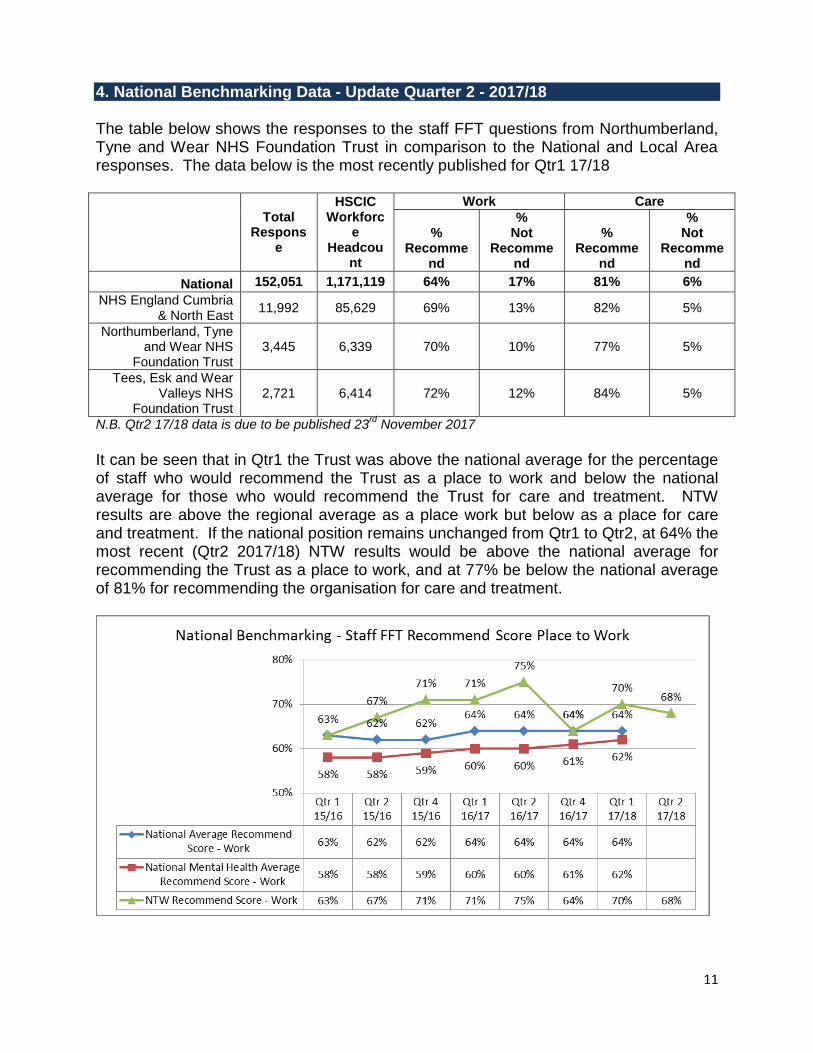
4. National Benchmarking Data - Update Quarter 2 - 2017/18 The table below shows the responses to the staff FFT questions from Northumberland, Tyne and Wear NHS Foundation Trust in comparison to the National and Local Area responses. The data below is the most recently published for Qtr1 17/18
Total Respons
e
HSCIC Workforc
e Headcou
nt
Work Care
% Recomme
nd
% Not
Recommend
% Recomme
nd
% Not
Recommend
National 152,051 1,171,119 64% 17% 81% 6%
NHS England Cumbria & North East
11,992 85,629 69% 13% 82% 5%
Northumberland, Tyne and Wear NHS
Foundation Trust 3,445 6,339 70% 10% 77% 5%
Tees, Esk and Wear Valleys NHS
Foundation Trust 2,721 6,414 72% 12% 84% 5%
N.B. Qtr2 17/18 data is due to be published 23rd
November 2017
It can be seen that in Qtr1 the Trust was above the national average for the percentage of staff who would recommend the Trust as a place to work and below the national average for those who would recommend the Trust for care and treatment. NTW results are above the regional average as a place work but below as a place for care and treatment. If the national position remains unchanged from Qtr1 to Qtr2, at 64% the most recent (Qtr2 2017/18) NTW results would be above the national average for recommending the Trust as a place to work, and at 77% be below the national average of 81% for recommending the organisation for care and treatment.
12
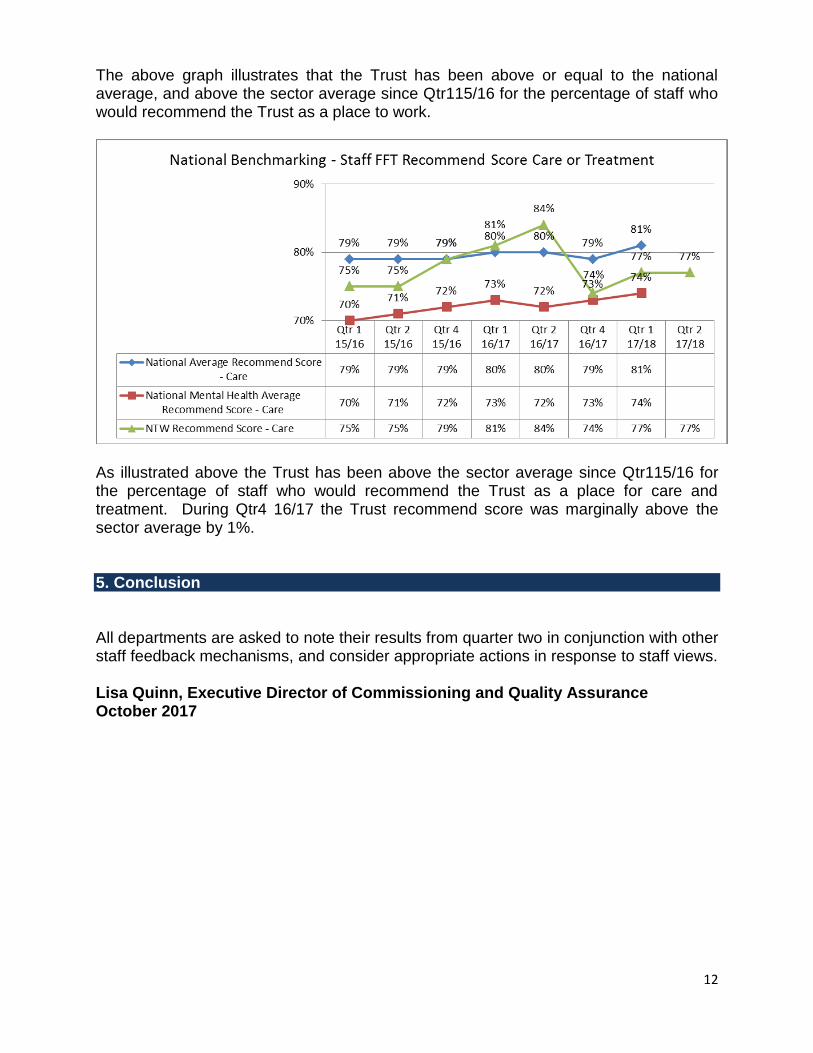
The above graph illustrates that the Trust has been above or equal to the national average, and above the sector average since Qtr115/16 for the percentage of staff who would recommend the Trust as a place to work.
As illustrated above the Trust has been above the sector average since Qtr115/16 for the percentage of staff who would recommend the Trust as a place for care and treatment. During Qtr4 16/17 the Trust recommend score was marginally above the sector average by 1%. 5. Conclusion All departments are asked to note their results from quarter two in conjunction with other staff feedback mechanisms, and consider appropriate actions in response to staff views. Lisa Quinn, Executive Director of Commissioning and Quality Assurance October 2017
13
Appendix 1
Response Rates
Response rate Qtr 2 16/17
Qtr 4 16/17
Qtr 1 17/18
Qtr 2 17/18
Qtr 2 17/18
number of responses
~ In Qtr1 response rates have overall remained
unchanged at 49% however there were more
respondents than Qtr1 (26 more respondents).
~ 4 out of 10 Directorate’s have seen an increase
in response rates, the most significant increase in
response rate was seen from the Deputy Chief
Executive (from 33% to 45%).
~ 4 directorates have seen a decrease in
response rates.
Trust 31% 40% 49% 49% 3,471
Specialist Care Group 30% 45% 52% 52% 1,045
Community Care Group 36% 48% 55% 54% 956
In-Patient Care Group 30% 43% 52% 51% 515
Deputy Chief Executive 36% 35% 33% 45% 45
Nursing Directorate 39% 56% 57% 57% 129
Medical Directorate 33% 40% 44% 45% 107
Commissioning and Quality Assurance
61% 64% 66% 65% 73
Workforce Directorate 57% 59% 56% 58% 22
CEO Office 53% 63% 57% 60% 12
NTW Solutions - - 47% 45% 121
NB the staff FFT question was not asked in 2016/17 Q3 due to the staff survey being undertaken.
NB Trust total includes 416 staff who are not included within the breakdown at group/corporate directorate level due to a mapping issue that is being addressed.
14
Appendix 2
15
Appendix 3
16
Appendix 4
In-Patient Care Group - Work Question
Theme Total % of
Responses
Response to Staff FFT Question 1 - Work Question
Recommend Not Recommend Unsure
Staffing Levels 23 25% 57% 26% 17%
General 6 6% 33% 33% 33%
Parking / Transport 6 6% 100% 0% 0%
Communication 5 5% 20% 40% 40%
Management Support / Supervision 5 5% 20% 60% 20%
Pay and Conditions (includes flexible working) 5 5% 20% 20% 60%
Recruitment & Induction 3 3% 100% 0% 0%
Respect 3 3% 0% 0% 100%
Rewarding environment/ value/ praise 3 3% 33% 33% 33%
Sickness Policy 3 3% 33% 33% 33%
Working Conditions 3 3% 67% 0% 33%
Culture / Leadership of Management 2 2% 0% 50% 50%
Shift Patterns 2 2% 50% 0% 50%
Staff Attitude 2 2% 50% 0% 50%
Transparency 2 2% 50% 50% 0%
Training and Development 2 2% 100% 0% 0%
Administrative Process 2 2% 50% 0% 50%
Available resources 1 1% 100% 0% 0%
Being listened to 1 1% 100% 0% 0%
Case Loads / Work Load 1 1% 100% 0% 0%
Communication / Interaction (SU / Carer / Families) 1 1% 100% 0% 0%
Consistency 1 1% 100% 0% 0%
Equipment 1 1% 100% 0% 0%
Organisational Change 1 1% 100% 0% 0%
Senior Management Structure 1 1% 100% 0% 0%
Smoking ban 1 1% 100% 0% 0%
Use of Bank / Agency Staff 1 1% 100% 0% 0%
Use of Time 1 1% 100% 0% 0%
Stress at Work 1 1% 100% 0% 0%
Staff Retention 1 1% 100% 0% 0%
Manager's Knowledge 1 1% 0% 0% 100%
Environment / Facilities 1 1% 100% 0% 0%
Career Progression 1 1% 100% 0% 0%
Total 93 100%
17
Community Care Group - Work Question
Theme Total % of
Responses
Response to Staff FFT Question 1 - Work Question
Recommend Not Recommend Unsure
Staffing Levels 33 13% 61% 9% 30%
Pay and Conditions (includes flexible working) 25 10% 64% 8% 28%
General 24 10% 46% 33% 21%
Working Conditions 18 7% 78% 6% 17%
Training and Development 14 6% 36% 21% 43%
Case Loads / Work Load 12 5% 25% 42% 33%
Sickness Policy 9 4% 33% 44% 22%
Culture / Leadership of Management 9 4% 56% 22% 22%
Parking / Transport 9 4% 67% 0% 33%
Rewarding environment/ value/ praise 9 4% 33% 44% 22%
Stress at Work 9 4% 33% 22% 44%
Senior Management Structure 8 3% 25% 50% 25%
Management Support / Supervision 5 2% 40% 40% 20%
Recruitment & Induction 5 2% 60% 0% 40%
Waiting Times 5 2% 100% 0% 0%
Use of Time 4 2% 25% 25% 50%
Patient Care 4 2% 50% 0% 50%
Morale 4 2% 25% 25% 50%
Transparency 3 1% 33% 33% 33%
Well-being support (classes) 3 1% 67% 0% 33%
Environment / Facilities 3 1% 67% 33% 0%
Being listened to 3 1% 33% 33% 33%
Bureaucracy 2 1% 0% 50% 50%
Communication 2 1% 0% 50% 50%
Manager's Knowledge 2 1% 0% 100% 0%
Organisational Change 2 1% 100% 0% 0%
Administrative Process 2 1% 50% 0% 50%
Career Progression 2 1% 50% 50% 0%
Job Security 2 1% 0% 100% 0%
Localised services 2 1% 50% 50% 0%
Politics 2 1% 0% 50% 50%
Treatments/ Pathways 2 1% 50% 0% 50%
Access 1 0% 0% 0% 100%
Available resources 1 0% 100% 0% 0%
Bullying and Harassment 1 0% 100% 0% 0%
Information Technology 1 0% 100% 0% 0%
Respect 1 0% 100% 0% 0%
Staff Attitude 1 0% 0% 100% 0%
Staff Retention 1 0% 0% 0% 100%
Total 245 100%
18
Specialist Care Group - Work Question
Theme Total % of
Responses
Response to Staff FFT Question 1 - Work Question
Recommend Not Recommend Unsure
Staffing Levels 48 24% 54% 21% 25%
Pay and Conditions (includes flexible working) 27 14% 63% 22% 15%
Communication 14 7% 50% 21% 29%
Working Conditions 10 5% 80% 20% 0%
General 10 5% 40% 50% 10%
Training and Development 10 5% 80% 0% 20%
General 9 5% 56% 33% 11%
Shift Patterns 9 5% 33% 56% 11%
Management Support / Supervision 8 4% 50% 38% 13%
Culture / Leadership of Management 8 4% 13% 25% 63%
Career Progression 8 4% 13% 38% 50%
Being listened to 6 3% 67% 33% 0%
Case Loads / Work Load 6 3% 50% 33% 17%
Rewarding environment/ value/ praise 6 3% 33% 17% 50%
Morale 6 3% 33% 33% 33%
Recruitment & Induction 5 3% 40% 20% 40%
Parking / Transport 4 2% 100% 0% 0%
Available resources 4 2% 25% 25% 50%
Sickness Policy 4 2% 50% 25% 25%
Transparency 4 2% 75% 0% 25%
Use of Time 3 2% 67% 0% 33%
Respect 3 2% 33% 33% 33%
Consistency 3 2% 0% 67% 33%
Service collaboration 2 1% 100% 0% 0%
Bullying and Harassment 2 1% 0% 100% 0%
Administrative Process 2 1% 50% 0% 50%
Environment / Facilities 2 1% 100% 0% 0%
Politics 2 1% 0% 0% 100%
Organisational Change 2 1% 0% 50% 50%
Patient Care 2 1% 0% 50% 50%
Stress at Work 2 1% 0% 50% 50%
Equipment 1 1% 100% 0% 0%
Food 1 1% 100% 0% 0%
Bureaucracy 1 1% 0% 0% 100%
Senior Management Structure 1 1% 0% 0% 100%
Manager's Knowledge 1 1% 100% 0% 0%
Staff Retention 1 1% 0% 100% 0%
Waiting Times 1 1% 100% 0% 0%
Engagement 1 1% 100% 0% 0%
Information Technology 1 1% 100% 0% 0%
Total 200
19
Appendix 5
In-Patient Care Group - Treatment Question
Theme Total % of
Responses
Response to Staff FFT Question 2 - Treatment Question
Recommend Not Recommend Unsure
Staffing Levels 15 20% 67% 13% 20%
Access 5 7% 80% 0% 20%
Treatments/ Pathways 4 5% 50% 50% 0%
More Beds 4 5% 50% 25% 25%
Waiting Times 4 5% 75% 0% 25%
Use of Time 3 4% 33% 0% 67%
Management Support / Supervision 3 4% 67% 33% 0%
Patient Care 3 4% 33% 33% 33%
Training and Development 3 4% 67% 0% 33%
Environment / Facilities 4 5% 0% 100% 0%
General 2 3% 100% 0% 0%
Respect 2 3% 0% 50% 50%
Use of Bank / Agency Staff 2 3% 100% 0% 0%
Senior Management Structure 2 3% 50% 50% 0%
Staff Attitude 2 3% 0% 50% 50%
Working Conditions 2 3% 50% 50% 0%
Pay and Conditions (includes flexible working) 2 3% 0% 100% 0%
General 1 1% 100% 0% 0%
Appointments 1 1% 100% 0% 0%
Activities 1 1% 100% 0% 0%
Parking / Transport 1 1% 100% 0% 0%
Food 1 1% 100% 0% 0%
Transparency 1 1% 0% 0% 100%
Recruitment & Induction 1 1% 100% 0% 0%
Available resources 1 1% 0% 100% 0%
Involvement & Collaboration (Carer / Families) 1 1% 100% 0% 0%
Staff Retention 1 1% 100% 0% 0%
Stress at Work 1 1% 100% 0% 0%
Privacy & Dignity 1 1% 0% 100% 0%
Grand Total 74 100%
20
Community Care Group - Treatment Question
Theme Total % of
Responses
Response to Staff FFT Question 2 - Treatment Question
Recommend score
Not Recommend Score Unsure
Staffing Levels 67 29% 64% 34% 1%
Waiting Times 37 16% 68% 32% 0%
Treatments/ Pathways 16 7% 75% 25% 0%
Patient Care 11 5% 45% 55% 0%
Access 8 4% 75% 25% 0%
Consistency 7 3% 57% 43% 0%
Use of Time 7 3% 57% 43% 0%
Available resources 6 3% 67% 33% 0%
Case Loads / Work Load 6 3% 50% 33% 17%
General 6 3% 33% 67% 0%
Training and Development 6 3% 50% 50% 0%
General 5 2% 40% 0% 60%
Service collaboration 4 2% 50% 50% 0%
More Beds 4 2% 75% 0% 25%
Communication / Interaction (SU / Carer / Families) 3 1% 33% 33% 33%
Working Conditions 3 1% 67% 33% 0%
Localised services 3 1% 67% 33% 0%
Environment / Facilities 3 1% 67% 33% 0%
Involvement & Collaboration (SU) 3 1% 67% 33% 0%
Parking / Transport 3 1% 100% 0% 0%
Administrative Process 3 1% 100% 0% 0%
Communication 2 1% 100% 0% 0%
Pay and Conditions (includes flexible working) 2 1% 50% 50% 0%
Well-being support (classes) 2 1% 50% 50% 0%
Career Progression 1 0% 100% 0% 0%
Equipment 1 0% 100% 0% 0%
Transparency 1 0% 100% 0% 0%
Senior Management Structure 1 0% 100% 0% 0%
Involvement & Collaboration (Carer / Families) 1 0% 100% 0% 0%
Appointments 1 0% 100% 0% 0%
Being listened to 1 0% 100% 0% 0%
Service Gaps 1 0% 100% 0% 0%
Organisational Change 1 0% 0% 100% 0%
Recruitment & Induction 1 0% 100% 0% 0%
Staff Attitude 1 0% 100% 0% 0%
Grand Total 228 100%
21
Specialist Care Group - Treatment Question
Theme Total % of
Responses
Response to Staff FFT Question 2 - Treatment Question
Recommend score
Not Recommend Score Unsure
Staffing Levels 61 30% 61% 30% 10%
Waiting Times 27 13% 78% 22% 0%
Environment / Facilities 9 4% 56% 33% 11%
Treatments/ Pathways 9 4% 56% 44% 0%
Training and Development 9 4% 44% 56% 0%
Communication 7 3% 57% 29% 14%
Access 6 3% 67% 17% 17%
Patient Care 6 3% 33% 50% 17%
General 6 3% 100% 0% 0%
Case Loads / Work Load 5 2% 40% 60% 0%
Service collaboration 4 2% 100% 0% 0%
Pay and Conditions (includes flexible working) 4 2% 50% 25% 25%
Communication / Interaction (SU / Carer / Families) 4 2% 50% 50% 0%
Consistency 4 2% 0% 100% 0%
Food 4 2% 100% 0% 0%
General 4 2% 0% 75% 25%
Being listened to 3 1% 100% 0% 0%
Involvement & Collaboration (Carer / Families) 3 1% 67% 33% 0%
Staff Attitude 3 1% 33% 67% 0%
Available resources 2 1% 100% 0% 0%
Administrative Process 2 1% 100% 0% 0%
Transparency 2 1% 100% 0% 0%
Parking / Transport 2 1% 50% 50% 0%
Morale 2 1% 100% 50% 0%
Information Technology 1 0% 100% 0% 0%
Management Support / Supervision 1 0% 0% 100% 0%
Culture / Leadership of Management 1 0% 100% 0% 0%
Staff Retention 1 0% 100% 0% 0%
Senior Management Structure 1 0% 0% 100% 0%
Well-being support (classes) 1 0% 0% 100% 0%
Equipment 1 0% 100% 0% 0%
Use of Time 1 0% 100% 0% 0%
Shift Patterns 1 0% 100% 0% 0%
Use of Bank / Agency Staff 1 0% 100% 0% 0%
Service Gaps 1 0% 100% 0% 0%
Environment / Facilities 1 0% 100% 0% 0%
Manager's Knowledge 1 0% 100% 100% 0%
Localised services 1 0% 100% 0% 0%
Grand Total 202 100%
22
Appendix 6
Actions being taken by Group/Directorate in response to improvement
suggestions raised in Qtr1 17/18
Specialist Care: Staffing levels -
There have been a number of bespoke recruitment campaigns to address staffing levels in particular for Neuro, Autism and CYPS. The Group has had significant organisational change which has resulted in the redeployment of staff into these areas and additional recruitment campaigns have also been required. In addition to this we have also recruited nurses through the international recruitment process but these are yet to commence with the organisation. Sickness Absence - Work has continued to address sickness absence at all levels across the Group, despite this work sickness has increased slightly over the past quarter. The Triumvirate has written to all staff regarding sickness promoting the Wellbeing and Health Initiatives that are on offer. The letter also advised staff of the current sickness levels within group and the cost to the organisation. Management Restructure - During the past year a total of 12 staff consultations have been undertaken. These have ranged from closure of wards/units e.g. Hepple House, TUPE, service redesign and shift changes. In all instances a full consultation exercise has been undertaken and in some instances pre-engagement exercises were undertaken. During the last quarter a large consultation was undertaken in Alnwood where beds were reduced and a significant number of staff were redeployed into other services. In all situations the unions are fully involved and we ensure staff are jointly supported. In addition to the above a number of engagement events were also carried out with staff in preparation for the new locality structure.
23
Inpatient Care:
Staffing Levels -
The Group continue to monitor Safer Staffing levels and work with the resources
available. More efficient shift patterns have been developed for Older Peoples’ and Acute
Wards. Sickness absence is managed robustly to ensure appropriate returns to
work. Reductions in agency usage mean more consistent levels of care.
Pay and Conditions -
Pay and conditions were discussed with staff at three locality staff survey events. Staff
reported that the public sector pay freeze was bad enough, especially for those at the top of
their increment, but there was a feeling that over the last 6 – 9 months there was a bit of a
backlash in the press about the public sector pay freeze. Whereas previously staff felt broadly
supported in the media in the past, it was felt that there had been a change in this over the last
6 – 9 months.
Some nurses reflected that they would recommend their place of work (i.e. the ward) but would
not recommend getting into the nursing profession.
Shift Patterns -
Staff across three localities were engaged with to develop shift patterns which help us to
deliver the best care for our patients whilst also working for staff and being financially
viable. Staff affected were consulted with along with staff side and the changes are in place
now.
24
Community Care:
Increase staff levels -
The Group continue to monitor staffing levels across the services, and use short term agency
to support areas where there is difficulty to recruit, whilst looking at longer term solutions to
address workforce gaps in line with developing workforce plans. The group have also
developed bespoke recruitment campaigns to address vacancy issues specifically in
Northumberland, and have developed a nurse consultant post as part of looking at
opportunities to support the medical workforce shortages.
We continue to encourage agency staff to apply for substantive posts in the group to help
stability within services. However, there remains concern around recruitment shortages into
medical posts where agency locums are still being utilised, and where we have advertised
posts without successfully recruiting to them. We are also looking where possible across the
group to recruit to innovative medical posts as through feedback from the medical workforce
we understand this makes a post more attractive to potential candidates.
Reduce waiting times -
Various initiatives are ongoing within the Group to help reduce the waiting times for service
users including the use of agency staff where required, but also addressing the long term
enablers and reviewing pathways. We continue to review skill mix and vacancies on a regular
basis in all of the teams. We are currently scoping the use of caseload weighting tools to
support the delivery of some services. This work also helps in terms of reviewing our
workforce shortages.
More Management Support / Supervision -
The group support the trust supervision policy of monthly clinical supervision and this is
monitored quarterly through the CQC compliance group. Managers encourage staff to be
open and transparent and identify though discussions in supervision any further support
required, and more specialist clinical supervision if needed.
Improvements to Environment / Facilities -
The Group continually reviews its accommodation across its various community bases and
work continues to be carried out where it has been prioritised on a needs basis. The Group is
aware that there are pockets where accommodation is small for some of the community teams
and is always looking at innovative ways of working to reduce accommodation problems. Any
issues are highlighted and are led by managers at a local level to address, raising as required
any issues that need to be logged on risk registers.
25
More Training and Development -
Across the Community Services group teams have implemented the training star which
highlights the key priorities for staff within their roles. This is in addition to staff appraisal,
where personal development plans are produced. In addition to this the group has had a
training strategy group, where issues in relation to training and development have been fed
through all levels of staff, and reviewed in the meeting. This information will be shared into
new care groups.