Embed Size (px)
Citation preview

2016-17
NORTHERN TERRITORY

Front cover images by Ross Stanes


LETTER OF TRANSMITTAL
Chairman Mr Paul Zlotkowski Ph: (08) 8999 4667
Executive Officer Tammy Smart
Ph: (08) 8999 4667
PO Box 496 PALMERSTON NT 0831
Fax: (08) 8999 4403
Email: [email protected] Web: www.denr.nt.gov.au
Hon Lauren Moss MLA Minister for Environment and Natural Resources Parliament House GPO Box 3146 DARWIN NT 0801
Dear Minister,
In accordance with section 29(a) of the Pastoral Land Act, I hereby submit for your information and presentation to Parliament, the Annual Report of the Pastoral Land Board for the reporting period ended 30 September 2017.
Yours sincerely
Paul Zlotkowski Chairman
PASTORAL LAND BOARD | ANNUAL REPORT 2016-17
ii

EXECUTIVE SUMMARY
Good land condition is not only essential for a profitable and sustainable pastoral industry but is also essential to underpin future growth and development of agribusiness.
The Pastoral Land Board is chartered with monitoring the condition and use of pastoral land to facilitate its sustainable use and economic viability. The Board is committed to the maintenance, and where possible, the improvement of the condition of the Northern Territory’s pastoral land.
The Board is a statutory authority made up of five members, including a Chairman, appointed by the Minister for Environment and Natural Resources and is tasked with reporting to the Minister on the general condition of pastoral land under the Pastoral Land Act. This report provides the Minister with a comprehensive analysis of current land condition across the NT Pastoral Estate. Encompassing an area of approximately 596 542 km2, the NT Pastoral Estate comprises 45% of the Northern Territory’s land mass held under 224 pastoral leases.
The Board’s annual reporting period spans from 1 October to 30 September to align with the growing season. Using a comprehensive integrated monitoring system, Rangeland Monitoring Officers from the Department of Environment and Natural Resources (DENR) combine measured field data collected on-ground with remote sensing satellite monitoring products and the knowledge and experience of the land managers to enable reporting of land condition at property, landscape and regional scales.
The report includes specific land condition issues faced by pastoralists including erosion, feral animals, weeds and bushfires and the impact of seasonal conditions. Supplementary information includes the operations of the Board and the state of the NT cattle industry as supplied by the Department of Primary Industry and Resources.
During this 2016-17 reporting season, monitoring was undertaken at 302 sites on 57 properties across 10 of the 11 pastoral districts. Of the 302 sites assessed, 137 were assessed in ‘Good’ condition, 125 were assessed in ‘Fair’ condition and 40 were assessed in ‘Poor’ condition. Seasonal quality varied across the Territory. The Sturt Plateau, Roper and Katherine Pastoral Districts experienced substantially above average rainfall. In contrast the Southern Alice Springs Pastoral District had areas with very much below average rainfall for the season. The remaining Pastoral Districts received mostly average to above average rainfall.
The Board held five meetings during this reporting period, including one in Darwin and two in Katherine. The Board visited Namul Namul and Flying Fox Stations in the Roper Pastoral District, Mathison, Scott Creek and Katherine Downs Stations in the Katherine Pastoral District and Banjo, Gilnockie and Maryfield Stations in the Sturt Plateau Pastoral District. The Board assessed and approved four new land clearing permits for improved pasture, and three non-pastoral use permits for purposes such as horticulture and tourism.
“It’s our vision to support a viable pastoral industry in the NT”
iii
PASTORAL LAND BOARD | ANNUAL REPORT 2016-17

CONTENTS
Chairman’s Foreword 3
Membership of the Board 4
Functions of the Board 5
Land Condition 6
Implementation of Management Plans to address Land Condition Issues 6
Erosion on Roads, Fences and other Infrastructure 6
Pastoral Land Monitoring Program 7
Integrated Monitoring Program 7
Remote sensing of the dynamics of vegetation cover 7
Fractional cover 8
Rainfall 9
Fire 9
Woody cover 9
Criteria Used to Assess Pasture Condition 10
Highlights from the 2016-17 Monitoring Season 11
2016-17 Monitoring Season and Pastoral Districts 13
Seasonal Conditions 13
Assessing Land Condition 15
Understanding seasonal effects on land condition 17
Regional interpretation of change in bare soil: 2016 to 2017 18
Other indicators of land condition 21
Pastoral District Reports 2016-17 26
Darwin Pastoral District 27
Katherine Pastoral District 35
VRD Pastoral District 42
Sturt Plateau Pastoral District 51
Roper Pastoral District 58
Gulf Pastoral District 66
Barkly Pastoral District 73
Tennant Creek Pastoral District 83
Plenty Pastoral District 88
Northern Alice Springs Pastoral District 96
Southern Alice Springs Pastoral District 102
1
PASTORAL LAND BOARD | ANNUAL REPORT 2016-17

Bushfire Activity 108
Vernon Arafura Region (Top End) 110
Savannah Region 110
Barkly Region 111
Alice Springs Region 112
Weed Activity 113
NT Wide 113
Darwin Region 114
Katherine Region 118
Tennant Creek Region 119
Alice Springs Region 121
Feral Animals 122
Meetings of the Board 125
Applications Considered by the Board 126
Appendices 128
Appendix 1: NT Cattle Industry 129
Appendix 2: Pastoral production research and advisory services 131
Appendix 3: Plant species list (common and scientific names) 134
2
PASTORAL LAND BOARD | ANNUAL REPORT 2016-17

As Chairman of the NT Pastoral Land Board, I have the pleasure in presenting the Annual Report of the Board for 2016-17.
The Pastoral Land Board has had another busy and successful year with three face to face meetings and two teleconference meetings and attended the 33rd Northern Territory Cattlemen’s Association conference in late March 2017 in Darwin.
The Board was pleased to visit eight pastoral properties in the Roper, Katherine and Sturt Plateau Pastoral Districts and appreciated the time taken by
those pastoralists to show us around their properties and discuss with Members the operations of each pastoral enterprise.
During this reporting period from 1 October 2016 through to 30 September 2017 the Department of Environment and Natural Resources’ Rangelands Monitoring team visited a record 57 properties for monitoring and infrastructure mapping updates.
The Board issued three new non-pastoral use permits and four new land clearing permits. Additionally a further four land clearing and three non-pastoral permits were reissued due to subdivision resulting in a change in boundary alignment. It is rewarding to see pastoralists benefiting from the diversification provisions in the Pastoral Land Act, with a Central Australian pastoral family winning awards for Tourist Attraction, Hosted Accommodation and the Chairman’s Choice for Tourism Excellence.
The Board assessed and made recommendations to the Minister for Environment and Natural Resources regarding an application to convert a term pastoral lease to perpetuity, reviewed the NT Pastoral Land Clearing Guidelines and referred one land clearing application to the Northern Territory Environment Protection Authority for assessment.
The cattle market remains strong and for the first time the NT cattle industry is able to afford broad acre property development and productivity improvement and I feel the Board will have another busy year ahead. There is so much yet to be done to increase the NT carrying capacity and our ultimate productivity potential without threatening our valuable native pastures.
I would like to thank my fellow Board Members for all the time and effort they put into board matters. I would also like to thank the staff from the Department of Environment and Natural Resources for the efficient and effective, professional manner in which they carry out their duties, because without these dedicated officers the Board would not be able to carry out its core functions.
CHAIRMAN’S FOREWORD
Paul Zlotkowski
3
PASTORAL LAND BOARD | ANNUAL REPORT 2016-17

MEMBERSHIP OF THE BOARD
Mr Paul Zlotkowski - Chairman
Commenced with the Board on 25 June 2016 for a 3 year term.
Mr Steven Craig - Member
Commenced with the Board in 2002 and was most recently reappointed on 1 May 2016 for a 3 year term.
Mr David James - Member
Commenced with the Board on 28 September 2015 for a 3 year term.
Dr Leigh Hunt - Member
Commenced with the Board on 28 September 2015 for a 3 year term.
Mrs Anne Kilgariff Stanes - Member
Commenced with the Board on 20 June 2016 for a 3 year term.
Executive OfficersMs Cassandra Arnott and Mrs Tammy Smart
4
PASTORAL LAND BOARD | ANNUAL REPORT 2016-17

Section 29 of the Pastoral Land Act outlines the function of the Board:a. to report regularly to, and as directed by, the Minister, but in any case not less than once
a year, on the general condition of pastoral land and the operations of the Board;
b. to consider applications for the subdivision or consolidation of pastoral land and make recommendations to the Minister in relation to them;
c. to plan, establish, operate and maintain systems for monitoring the condition and use of pastoral land on a district or other basis;
d. to assess the suitability of proposed new pastoral leases over vacant Crown land;
e. to direct the preparation, and monitor the implementation of, remedial plans;
f. to monitor, supervise or cause to be carried out work in relation to the rectification of degradation or other damage to pastoral land;
g. to monitor the numbers and effect of stock and feral and other animals on pastoral land;
h. to monitor and administer the conditions to which pastoral leases are subject;
ha. to consider and determine applications for permission to use pastoral land for a non-pastoral purpose in accordance with Part 7;
j. to make recommendations to the Minister on any matter relating to the administration of the Act;
k. to hear and determine all questions, and consider and make recommendations on all matters, referred to it by the Minister; and
m. such other functions as are imposed on it by or under the Pastoral Land Act or any other Act or as directed by the Minister.
Other functions outlined in the Act include:1. to determine applications for clearing pastoral land [section 38(1)(h)]
2. to consider breaches of conditions referred by the Minister [section 41]
3. to consider and make recommendations to the Minister on application for conversion of term pastoral leases to perpetual tenure [section 62]
4. to administer the access provision of the Act, including nomination of access routes under Part 6
5. to determine applications for non-pastoral use of pastoral land under Part 7.
6. to consider and make recommendations to the Minister on application for subdivision [section 61]; and
7. to consider and make recommendations to the Minister on application for consent to transfer a pastoral lease or sub-lease should the advice of the Board be sought [section 68(2)].
FUNCTIONS OF THE BOARD
5
PASTORAL LAND BOARD | ANNUAL REPORT 2016-17

LAND CONDITION
Land condition should be an assessment of vegetation and soil health as indicated by ground cover species composition, tree and shrub density, abundance of invading plants (native and exotic), soil surface condition and soil erosion. These attributes are assessed relative to land in near-pristine condition.
The main influences on land condition are grazing by domestic, native and feral grazers, fire and combinations of the two. Grazing is managed by manipulating stocking rate, stock water distribution, feral grazing control and fire. Fire on its own can change land condition by being too frequent or too infrequent over a long period of time, but its main effect on land condition is through changing the distribution of grazing as grazers prefer younger grass.
Implementation of Management Plans to address Land Condition Issues
In cases where land condition issues are identified on a pastoral property, the Board may request the lessee to prepare a management plan detailing the action to be taken to address the land management issues which have been identified. It is a basic tenet of the Pastoral Land Act that pastoral lessees acknowledge their duty to adopt sound management practices and their responsibility to address any land condition issues that may arise. In line with this philosophy, the Board seeks voluntary collaboration with pastoral lessees to address land condition issues and implementation of rehabilitation programs.
While voluntary management plans are preferred in the first instance, if the Board is of the opinion that where pastoral land has been degraded or otherwise damaged it may require a remedial management plan detailing the proposed management of the pastoral land over a specified period of time. Remedial plans need to be endorsed by the Board and are registered on the title.
The Board has voluntary management plans in place on pastoral leases addressing land degradation caused by heavy grazing, erosion and weed infestations. There are currently no remedial plans in place.
Erosion on Roads, Fences and other Infrastructure
Erosion on roads, tracks and fence lines continues to be a significant soil management issue on pastoral leases throughout the NT. DENR adopts a co-operative approach to assist station managers with appropriate soil conservation earthwork design and construction. Voluntary management plans have been prepared by pastoral lessees and successfully implemented to address issues arising from the poor siting of infrastructure, and/or inappropriate maintenance techniques including overgrazing.
6
PASTORAL LAND BOARD | ANNUAL REPORT 2016-17

PASTORAL LAND MONITORING PROGRAM
The Northern Territory Government’s Department of Environment and Natural Resources (DENR) is chartered with the assessment, monitoring and reporting of land condition on behalf of the Pastoral Land Board.
Integrated Monitoring Program
The integrated monitoring program was introduced in 2013 to provide objective whole of landscape reporting of changes in land cover across the pastoral estate. It comprises a network of ground based sites, incorporating the existing Tier 1 sites where suitable, with newly established ground sites appropriate to validate and inform satellite data and products.
New sites are established at or near existing Tier 1 sites to maintain consistency in the photographic and data records. In some cases, it is not appropriate to locate a site nearby due to factors such as proximity to infrastructure, land system boundaries and changes in vegetation structure and type. Where Tier 1 sites are not appropriate for inclusion in the integrated monitoring program, sites continue to be photographed to expand the Tier 1 photo archive.
The integrated monitoring program, like the previous Tier 1 system, is heavily reliant upon the knowledge and experience of land managers and lessees. Both the ground data collected and information products produced from satellite data require on-ground local knowledge and understanding to explain changes and gain a further understanding of landscape dynamics. Measured field data are used to better calibrate Landsat-derived products to Northern Territory conditions and then validate their accuracy for specific locations. The two sources of information (ground based and remote sensing) are then interpreted with regard to the knowledge and experience of practical land managers to enable reporting of land condition at property, landscape and regional scales.
As the number of revisits increase at a site, the expanding monitoring record will allow changes in the vegetation and soils, and their probable causes, to be documented – in a similar way to that which is now possible for vegetation cover using remote sensing.
Remote sensing of the dynamics of vegetation cover
The remote sensing or satellite based data component of the integrated monitoring program has been developed through a collaborative research program between DENR and the Queensland Department of Science, Information Technology and Innovation (DSITI). Through this collaboration, DENR officers are contributing to an internationally recognised method for systematically monitoring change in vegetation cover and its converse, bare soil, at a range of spatial and temporal scales. The 30m pixel size of Landsat imagery allows change in vegetation cover to be analysed at site level (1 ha) through to pastoral districts (~10 000 km2 to >130 000 km2) and the entire Northern Territory (~1 346 500 km2). Reporting intervals can be as short as three months over a 29 year period (1988 to current).
7
PASTORAL LAND BOARD | ANNUAL REPORT 2016-17

Fractional cover
Analysis of the dynamics of vegetation cover (conversely, bare soil) within this report is based on fractional cover. This is an estimate of the components of land cover that can be discriminated from the spectral data collected by the Thematic Mapper instrument carried on the Landsat satellite (i.e. Landsat TM). The three components are bare ground (comprising soil, rocks and gravels), actively growing (photosynthetic) vegetation and senescent (non-photosynthetic) vegetation (including litter). This can be represented using the diagram below.
Figure 1. The three components of fractional cover and the various combinations illustrated in the associated ground cover photos.
The level of vegetation cover or bare ground present and its change over time is reported in three ways:
1. As the actual amount present during a specified period of time. For this report, this is September to November 2017, termed ‘spring composite’, – the latter part of the dry season for central and northern pastoral districts and the time when early summer storms may promote pasture growth in the southern NT. It is important to maintain adequate ground cover in the latter months of each year to minimise soil loss from wind erosion and intense, early wet-season storms. It is also important to carry dry feed, and associated ground cover, into the latter months of each calendar year in case there is a late start to the usual wet season and/or monsoonal rains fail more generally.
2. As a decile rank of vegetation cover present in late 2017 (spring composite) compared with that present at similar times back to 1988, a 29 year period.
3. The percentage area of each pastoral district having various categories of bare soil between September and November 2017 (spring composite). Categories of bare soil are:
- minor, ≤20% of Landsat pixel is bare soil;
- moderate, 21% - 40% bare soil in pixel;
- high, 41% - 60% bare soil in pixel; and
- very high, >60% of pixel is bare soil
PHOTOSYNTHETIC VEGETATION (PV)
NON-PHOTOSYNTHETIC VEGETATION (NPV)
BARE MIX
PV MIX
NPVMIX
NPV& BARE
NPV& PV
NPV
BARE & PVBARE PV
NPV & BARE
BARE MIX
BARE BARE & PV
NPV & PV
NPV
PV
BARE GROUND
8
PASTORAL LAND BOARD | ANNUAL REPORT 2016-17

The number of pixels in each category are counted, multiplied by pixel area (900 m2 or 0.09 ha) and converted to the percentage of pastoral district area.
The bare soil threshold for each district is based on the frequency distribution of all 30m Landsat bare soil fractional ground cover pixels at the end of 2017 (spring composite). A threshold was determined which represents 75% of a district’s bare soil. The remaining 25% is considered to have above-threshold bare soil.
A 75% threshold bare soil value of 48% equates to 48% actual bare soil of a Landsat fractional ground cover pixel.
Rainfall
The amount, timing and effectiveness of rainfall is a major driver of the quantity, composition and quality of pastures across the NT pastoral estate. Monitoring data collected using ground and remote sensing-based methods must account for the effects of variable rainfall (seasonal quality) in understanding the impacts of stocking rates and grazing management on the vegetation resource.
Due to the large variation in annual rainfall across the Northern Territory, a comparison of location-specific rainfall against its longer term history is a useful way of illustrating recent seasonal conditions. A Northern Territory map of decile-ranked rainfall for the current reporting cycle (October 2016 to September 2017) is shown on 14. Rainfall is ranked on a baseline of approximately 100 years.
Fire
Fire and its effect on vegetation cover across the NT cannot be understated. This can be seasonal in the savannah landscapes of the central and northern parts of the NT or relatively infrequent and episodic in the southern arid region. Mapped fire scars and associated statistics accessible from the North Australian Fire Information website (www.firenorth.org.au/nafi3) are used to report spatial and temporal information on burnt area.
Woody cover
The density of trees and shrubs changes over time in many rangeland environments, but generally at a slower rate than changes in the pasture layer. A particular issue facing long term sustainability of the pastoral industry in some landscapes is woody thickening which can suppress pasture growth and reduce opportunities to use fire for broadscale control of problem tree or shrub species. Two remote sensing products are being adapted to NT conditions to improve monitoring of vegetation cover dynamics. The first is a foliage projective cover product that discriminates woody cover from ground cover. The second is a probability based model that allows ground cover under trees to be estimated. Both will allow improved monitoring of cover dynamics in woodland / savannah environments when suitably refined and validated.
9
PASTORAL LAND BOARD | ANNUAL REPORT 2016-17

CRITERIA USED TO ASSESS PASTURE CONDITION
These classes are based on indicators of pasture condition such as the abundance of perennial plants known to increase or decrease following grazing, and ground surface indicators such as the exposure of bare soil to wind and water and its subsequent erosion. These indicators of pasture condition and associated assessment criteria have largely been determined from historical information, local knowledge, cross fence comparisons and stock grazing gradients out from water. The further from water the less intense the stock grazing pressure and the higher the condition class rating tends to be. The condition classes can be described as follows:
Good (B)
There is close to maximum diversity and cover of annual and perennial plant species possible for that pasture type with perennial species of various ages also present. There is no active erosion other than natural features and processes. Plant and litter cover protects the soil from wind and water in all seasons except following fire. Pastures in good condition are stable and are at, or close to, their productive potential. Pastoral managers should be aiming for good pasture condition, which necessitates careful management practices that maintain or improve pasture condition.
Fair (C)
There is reduced cover and regeneration of palatable perennial species and there has been some establishment of less preferred or unpalatable plants. Productivity remains high in good seasons but is markedly reduced in dry seasons. Lower plant cover increases the susceptibility of soil to erosion in most seasons and there may be evidence of moderate erosion on susceptible land types. Pastures in fair condition are productive, but below their productive potential. They are sometimes actively eroding and can rapidly deteriorate to poor condition. Maintaining pastures in fair condition is not a satisfactory status quo, as long term damage to their productive capacity will result. They should be managed with the aim of improving condition and ultimately achieving good condition status.
Poor (D)
The palatable component of the pasture is depleted and the pasture is dominated by annual, ephemeral and unpalatable perennial species. There is no, or markedly reduced, regeneration of desirable perennial plants, productivity is impaired and the seasonal response is poor. Soils are unstable and susceptible to erosion in all seasons and past erosion leaves the site susceptible to further soil movement if grazed. Pastures in poor condition have severely reduced productivity, which is most noticeable during dry periods. They require a very long period of spelling to improve condition or mechanical intervention such as erosion control earthworks or reseeding. In woodlands and shrublands, native woody species may have thickened over time to further restrict pasture growth.
10
PASTORAL LAND BOARD | ANNUAL REPORT 2016-17

HIGHLIGHTS FROM THE 2016-17 MONITORING SEASON
This section summarises highlights and areas for improvement, relating to land condition, identified during property visits.
Good News
There are several examples of properties on the Sturt Plateau that have maintained or improved their land condition over time. Management of burning practices, stocking rates and paddock rotation has contributed to a ‘good news story’ across many leases within the district.
The use of remotely sensed imagery products aid in assessing ground cover changes over time. The Landsat Fractional Ground Cover (LFGC) images and monitoring site photos are shown in Figure 2 and Figure 3 respectively for 2010 and 2017 on a property in the Sturt Plateau. There is the obvious seasonal difference between mid-dry season (blue colour indicating dried-off vegetation) and the end-wet season (green colour indicating active photosynthetic vegetation), which includes tree and grass cover. However, the two images show minimal evidence of areas of bare soil (red colour) and good vegetative cover consistently between the 2010 and the 2017 images.
The on-ground monitoring indicated that ground cover and species composition remained similar between the 2010 and 2017 visits with a trend for increasing cover of the desirable perennial grass silky browntop and a corresponding decrease in the undesirable wiregrasses.
Not So Good News
There are a number of properties in the southern region where monitoring sites have been assessed in poor condition for an extended period of time, generally attributed to near-continuous heavy grazing pressure on the more productive land systems.
The Landsat Fractional Ground Cover (LFGC) images and monitoring site photos are shown in Figure 4 and Figure 5 respectively for a monitoring site (yellow dot) in 2013 and 2017 on a property in the Southern Alice Springs Pastoral District. There are extensive areas of bare soil (indicated by the red colour) in the area surrounding the monitoring site, with some patches of dried-off vegetation (blue colour) and a mix of both (pinkish colour). These areas are generally consistent between the 2013 and the 2017 images with little indication of vegetation recovery. It is acknowledged that the sporadic rainfall in the southern NT can contribute to extended periods of low levels of vegetation, and that a rain event can lead to marked changes in vegetation cover and species composition.
The site is situated on what appears to be a naturally treeless plain formerly supporting a Mitchell grass / neverfail pasture of moderate to high productivity. Mitchell grass now persists in very low densities in the area, having been almost entirely replaced by less productive pasture species including unpalatable annual copperburrs and annual grasses such as oat grass and bunched kerosene grass. The persistent high levels of remotely sensed bare soil, even following good seasonal conditions, in conjunction with species composition change, are indicative of poor land condition.
11
PASTORAL LAND BOARD | ANNUAL REPORT 2016-17

Figure 2. Remotely sensed changes in vegetation dynamics using Landsat Fractional Ground Cover (LFGC) imagery from 2010 (left) of June-August (Winter) composite following a below-median rainfall wet season, and; 2017 (right) of March-May (Autumn) composite following an above-median rainfall wet season to integrate with on-ground observations from the September 2010 and the June 2017 monitoring visits respectively. The red dot indicates the location of a monitoring site on a property in the Sturt Plateau Pastoral District.
Figure 3. On-ground site assessment and photographs at the time of the monitoring inspection in September 2010 (left) and; July 2017 (right) for the monitoring site, corresponding to the location of the red dot in the LFGC image above for the Sturt Plateau property. Observations on-ground were consistent with the LFGC imagery over time presented in Figure 2 which indicated persistent vegetation cover, a significant component of good land condition.
Figure 4. Remotely sensed changes in vegetation dynamics using LFGC imagery from 2013 (left) of March-May (Autumn) composite following below-median rainfall, and; 2017 (right) of March-May (Autumn) composite following above-median rainfall. Rainfall is for the 12 months preceding the monitoring visit. The yellow dot indicates the location of the monitoring site on a property in the Southern Alice Springs Pastoral District
Figure 5. On-ground site assessment and photographs at the time of the monitoring inspection from June 2013 (left), and; July 2017 (right) for the monitoring site, corresponding to the location of the yellow dot in the Figure 4. Observations on-ground were consistent with the LFGC imagery in Figure 4 which indicated persistent high bare soil over time, a significant component of poor land condition.
12
PASTORAL LAND BOARD | ANNUAL REPORT 2016-17

The Rangeland Monitoring Branch within the Department of Environment and Natural Resources visited 57 pastoral leases in ten Pastoral Districts during the 2016-17 reporting cycle, from 1 October 2016 to 30 September 2017.
The primary purpose of visits was to monitor and report on land condition. Officers also mapped new or replaced infrastructure (water points, fences and tracks) and updated the monitoring folder (‘blue book’) for each lease.
Assessed land condition for each district is summarised in this section. This overview is drawn from the analysis of vegetation-cover dynamics based on Landsat imagery, data collected at 302 monitoring sites and more general assessment of land condition between monitoring sites during lease visits.
The criteria and methods used to monitor land condition are explained on pages 7 to 10.
Seasonal Conditions
Seasonal conditions for 2016-17, based on rainfall amount compared with the long-term record (Figure 6), were:
• Above average to very much above-average for the majority of the Northern Territory; the Sturt Plateau, Roper, and Katherine Pastoral Districts predominantly, and the Darwin, VRD, Gulf, Tennant Creek and Northern Alice Springs Pastoral Districts having only minor proportions of average rainfall.
• Average in the south-eastern part of the NT, encompassing areas within the southern Barkly, the eastern Plenty, and Southern Alice Springs Pastoral Districts.
• Below average to very much below average pocket bordering the Simpson Desert in the Southern Alice Springs Pastoral District.
2016-17 MONITORING SEASON AND PASTORAL DISTRICTS
13
PASTORAL LAND BOARD | ANNUAL REPORT 2016-17

Figure 6. Decile-ranked rainfall for the October 2016 to September 2017 period. Pastoral Districts as gazetted under the Pastoral Land Act are also shown. Map obtained from the Bureau of Meteorology web site (http://www.bom.gov.au/jsp/awap/rain/archive.jsp?colour=colour&map=decile&year=2017&month=9&period=12month&area=nt
14
PASTORAL LAND BOARD | ANNUAL REPORT 2016-17

Assessing Land Condition
Land condition was assessed using a combination of remotely sensed (satellite) and field (site) data, and lease inspection. Landsat data are processed to indicate the proportions of vegetation cover (photosynthetic and non-photosynthetic) and bare soil in each pixel, an area of 0.09 ha. Change in each component can be examined since 1988 providing important information on cover dynamics over the last 29 years.
It is important that pastoral land managers maintain adequate ground cover in the latter months of each year to minimise soil loss from wind erosion and intense summer storms. It is also important to carry dry feed, and associated ground cover, into this period in case there is a late start to the wet season and/or monsoonal rains fail more generally. Figure 7 shows the spring composite (September - November) image to illustrate relative change in remotely-sensed vegetation cover between the latter part of 2016 and 2017. The pair of images together indicates:
• Increased amounts of bare soil (less vegetation cover) in the southern NT compared with savannah landscapes in the north. This pattern is shown by the predominantly red and brown colouring in both images.
• Higher vegetation cover (less bare soil) in the woodland-dominant savannah landscapes of the central and northern NT. Most of this area also has a substantial component of perennial grasses in the pasture meaning that there is considerable vegetation cover in the late dry season (illustrated by the brown colouring in Figure 7), where not recently burnt.
Fires remove most of the pasture layer and may cause leaf fall from trees where scorching occurs. Areas burnt in 2016 and 2017 show as brighter shades of green in Figure 7, because they had less vegetation cover compared to most previous years since 1988. Areas recovering from earlier fires (i.e. prior to 2016, left-hand image and less apparent in 2017, right-hand image) show as shades of orange through to yellow.
Comparing the images shows a general increase in vegetation cover (i.e. less bare soil) from late 2016 to the same period in 2017 across most of the pastoral estate. In particular:
• The darker green and brown colouring across the Northern Alice Springs and Tennant Creek Pastoral Districts in 2017 indicates less bare soil than 12 months previously and a higher (decile) rank of vegetation cover relative to that present since 1988.
• There was a slight decrease in vegetation cover in the central parts of the Southern Alice Springs Pastoral District and eastern parts of the Plenty Pastoral District.
The amount of bare soil decreased in much of the western and northern parts of the Barkly Pastoral District between 2016 and 2017. The corresponding rank of vegetation cover improved from ‘average’ to ‘above -average’.
The degree of change in northern pastoral districts was less marked, mainly because of generally higher cover of perennial grasses that persist from year to year in the landscape and higher woody cover which partly conceals (from the satellite sensor) bare ground that may be present.
15
PASTORAL LAND BOARD | ANNUAL REPORT 2016-17

Figu
re 7
. C
hang
e in
the
am
ount
of
bare
soi
l and
ran
k of
veg
etat
ion
cove
r be
twee
n la
te 2
016
(left
) and
201
7 (r
ight
). In
divi
dual
ly, t
he m
aps
show
the
per
cent
age
of b
are
soil
pres
ent
in 0
.09-
ha L
ands
at p
ixel
s in
the
latt
er p
art
of 2
016
(or
2017
) com
pare
d w
ith t
he p
ixel
-leve
l ran
k of
veg
etat
ion
cove
r ov
er t
ime.
The
latt
er c
ompa
res
vege
tatio
n co
ver
in la
te 2
016
(or
2017
) aga
inst
tha
t pr
esen
t at
the
sam
e tim
e ea
ch y
ear
sinc
e 19
88. T
he a
mou
nt o
f ba
re s
oil i
s sh
own
in s
hade
s of
red
(see
lege
nd;
high
bar
e so
il =
brig
ht r
ed, l
ittle
bar
e so
il =
dar
k re
d).
The
rank
of
vege
tatio
n co
ver
is d
epic
ted
in g
reen
; rel
ativ
ely
less
cov
er in
late
201
6 (o
r 20
17) =
brig
ht g
reen
, re
lativ
ely
mor
e co
ver
= d
ark
gree
n. M
ixin
g of
gre
en a
nd r
ed in
dica
tes
othe
r po
ssib
le r
espo
nses
(see
lege
nd):
dark
bro
wn
repr
esen
ts le
ss b
are
soil
in t
he L
ands
at p
ixel
an
d m
ore
vege
tatio
n co
ver
in 2
016
(or
2017
) com
pare
d w
ith t
he r
ecen
t pa
st; y
ello
w m
eans
hig
h le
vels
of
bare
soi
l and
less
veg
etat
ion
cove
r re
lativ
e to
the
rec
ent
hist
ory
(sin
ce 1
988)
. W
hite
pol
ygon
s sh
ow p
asto
ral d
istr
icts
(see
Fig
ure
6 fo
r th
eir
nam
es).
16
PASTORAL LAND BOARD | ANNUAL REPORT 2016-17

Notwithstanding more subtle change in central and northern regions, the amount of vegetation cover and its associated rank since 1988 appears to have increased from late 2016 to 2017 in all of the northern and central districts with the exception of large areas that appear to have been burnt, particularly evident across the southern portion of the Sturt Plateau.
In summary, Figure 7 shows the contrast and relative change in levels of vegetation cover (conversely, bare soil) across the NT over one year, the extent and significance of fire on the dynamics of vegetation cover and, within individual pastoral districts, the influence of rainfall on the amount of cover present. Grazing effects, where present, are more subtly embedded within these gross changes.
Understanding seasonal effects on land condition
The amount of forage available for grazing or level of ground cover present to protect the soil surface against erosion is influenced by the quantity and effectiveness of rainfall throughout the year (or wet season in the north), and subsequent grazing and fire. The effects of rainfall variability and fire, whether episodic or recurrent, must be accounted for when assessing grazing impacts in the rangelands.
A simple framework for better understanding seasonal (mainly rainfall) effects on vegetation change is the ‘seasonal quality’ matrix (Figure 8). Here, some measure of recent seasonal quality is intersected with the direction of change for those attributes of the vegetation being monitored. In the case of remotely sensed bare soil, we would expect bare soil to decrease following more rainfall (better seasons) and increase in droughts (i.e. poorer seasonal quality). Seasonally expected change is shown with the ‘~’ symbol in Figure 8. When it is known what is expected, it is then possible for monitoring and management to focus on unexpected change (the and XX cells in Figure 8).
For example, at landscape and regional scales, the amount of bare soil will increase after extensive wildfire that can follow improved seasonal conditions. This is one obvious plausible explanation for unexpected change. At more local scales (water points and paddocks), an unexpected increase in bare soil may be associated with heavy stocking. A decrease in the amount of bare soil following poorer seasonal quality probably requires further investigation. It could be that areas are being temporarily spelled (protected from grazing) or the composition and/or structure of the vegetation are changing. These changes could mean recruitment of perennial species, a desirable change for the pastoral industry where such species are palatable, or longer-term thickening of woody vegetation – less desirable for grazing where competition results in reduced pasture availability.
Figure 8. Seasonal quality matrix used to interpret change in bare soil with respect to preceding seasonal conditions. ‘Seasonal quality’ describes the relative value of recent rainfall in producing forage for livestock. The white cells with the ~ symbol represent expected change and coloured cells show unexpected change, akin to traffic lights; that is, less desirable change in the case of orange and red cells and more desirable for green cells.
17
PASTORAL LAND BOARD | ANNUAL REPORT 2016-17

Regional interpretation of change in bare soil: 2016 to 2017
Change in vegetation cover (conversely, bare soil) in the NT between late 2016 and 2017 is illustrated in Figure 7 and broadly described on pages 15 and 17. This change, for bare soil, is further summarised for the extent of pastoral leases in pastoral districts in Table 1. In producing this statistical summary:
• Seasonal quality is described in terms of expected pasture growth based on rainfall received, simulated using AussieGRASS (www.longpaddock.qld.gov.au). Modelled growth between October 2016 and September 2017 was ranked as a percentile of the growth for all previous 12 month periods (back to 1957).
Areas (5 km by 5 km grid cells) having less than 30% of their long-term modelled pasture growth were assigned ‘below-average’ seasonal quality. Growth percentiles above 70 were allocated to ‘above-average’ seasonal quality. Remaining grid cells were considered to have experienced average seasonal quality.
• Change in bare soil was arbitrarily split between ‘increase’, ‘no change’ and ‘decline’ according to pastoral district.
In the southern NT (Southern and Northern Alice Springs, Plenty, Tennant Creek and Barkly Pastoral Districts), ‘no change’ was interpreted as bare soil (for each Landsat pixel) in 2017 being within ±15 percentage points of that present in 2016. An increase in bare soil of >15 percentage points was considered an ‘increase’ and a decrease of more than 15 points a ‘decline’.
For remaining (central and northern) pastoral districts, change in bare soil of more than ±5 percentage points was considered an ‘increase’ or ‘decline’ (depending on its direction).
• The percentage area of the pastoral estate in each of the nine cells (Figure 8) was then calculated for each pastoral district. The percentage areas showing unexpected change (decline in bare soil with below-average seasonal quality or increase in bare soil with above-average seasonal quality) is summarised in Table 1. Larger percentage values in the first column (e.g. >10%) serve as a possible warning of future concern. Higher values (e.g. >5%) in the second column are of greater concern; effects of fire, bare soil should not increase following above-average seasonal quality. The third (final) column is a more favourable outcome and it is useful to try and understand where and why the amount of bare soil has decreased following unfavourable seasonal conditions. Percentage areas for increased bare soil following average seasonal quality are also included. This could serve as a possible warning to where areas of future concern may lie.
A reasonable upper limit for unexpected change is less than 5% of the pastoral area within the pastoral district. The magnitude and direction of change in bare soil from 2016 to 2017 accorded with seasonal expectations in most pastoral districts (Table 1). The Roper Pastoral District however illustrated (Figure 9) a 9% bare soil increase with above average seasonal quality. Areas of vegetation unburnt in the late dry season of 2016 but burnt in the late dry season of 2017 are further illustrated and explain the majority of this increase of bare soil under favourable conditions, the central and south western portions of the district however illustrated an increase in bare soil with no detected fires in either 2016 or 2017. In contrast bare soil decreased with below average seasonal quality across nine percent of the Katherine Pastoral District. This is explained and illustrated in Figure 9 by the majority of this portion of the district being burnt in 2016 but remaining unburnt up until the end of the dry season in 2017. Fire dynamics play an important role in vegetation dynamics in these environments.
18
PASTORAL LAND BOARD | ANNUAL REPORT 2016-17

Table 1. The percentage area of pastoral leases within pastoral districts showing unexpected change in bare soil with respect to seasonal quality between the latter parts of 2016 and 2017. Values in the second column greater than a threshold for unexpected change of 5% of the pastoral area in a pastoral district may indicate a concerning trend in bare soil.
Pastoral District
Percentage area showing unexpected change
Increase in bare soil following average seasonal quality
Increase in bare soil following above average
seasonal quality
Decline in bare soil following below average
seasonal quality
Darwin 12 4.5 3
Katherine 9 2 9
VRD 7 6 1
Sturt Plateau 12 3 1
Roper 3 9 4
Gulf 7 4 3
Barkly 1 2 0
Tennant Creek 0 1
No pastoral lease country within the district
experienced below average seasonal
quality
Plenty 2.5 3
Northern Alice Springs 0.5 1
Southern Alice Springs 1 0
The threshold used for assigning ‘no change’ in bare soil obviously influences the percentage area calculated as exhibiting unexpected change. For example, adjusting the ‘no change’ threshold for the Barkly Pastoral District to ±5 percentage points (of bare soil) increased the “increase in bare soil following above-average seasonal quality” category to 10.4% of the grazed area. Areas mapped into this category were clearly associated with water points and paddocks on some pastoral leases and could reasonably be assumed to be related to grazing. This demonstrates that regional stakeholder engagement, including best-management grazing practice, may be required to gain consensus as to acceptable levels of change (in bare soil) for seasonal conditions experienced.
19
PASTORAL LAND BOARD | ANNUAL REPORT 2016-17

Figu
re 9
. Le
ft, S
patia
l rel
atio
nshi
p be
twee
n un
expe
cted
incr
ease
in b
are
soil
and
area
s of
the
Rop
er P
asto
ral D
istr
ict
that
wer
e un
burn
t up
unt
il th
e sp
ring
of 2
016
but
burn
t du
ring
2017
. Are
as n
ot d
etec
ted
as b
eing
bur
nt d
urin
g bo
th y
ears
and
tha
t sh
ow a
n in
crea
se in
bar
e so
il un
der
favo
urab
le s
easo
nal c
ondi
tions
can
be
seen
thr
ough
the
ce
ntra
l and
sou
th w
est
part
s of
the
dis
tric
t. R
ight
, Rel
atio
nshi
p be
twee
n un
expe
cted
dec
reas
e in
bar
e so
il an
d ar
eas
of t
he K
athe
rine
Past
oral
Dis
tric
t th
at w
ere
burn
t in
20
16 b
ut r
emai
ned
unbu
rnt
up u
ntil
the
sprin
g of
201
7.
20
PASTORAL LAND BOARD | ANNUAL REPORT 2016-17

Oth
er in
dica
tors
of l
and
cond
ition
The
follo
win
g se
ctio
ns p
rovi
de a
det
aile
d ac
coun
t of
oth
er c
ompo
nent
s of
land
con
ditio
n fo
r ea
ch p
asto
ral d
istr
ict.
Info
rmat
ion
is c
ompi
led
on:
• Se
ason
al q
ualit
y –
the
spat
ially
ave
rage
d gr
owth
per
cent
ile (f
rom
Aus
sieG
RASS
) for
eac
h di
stric
t as
a s
umm
aris
ing
stat
istic
of
the
amou
nt a
nd
effe
ctiv
enes
s of
rai
nfal
l in
grow
ing
fora
ge f
or li
vest
ock,
• Ex
tent
and
tim
ing
of w
ildfir
e,
• Fu
rthe
r in
form
atio
n on
bar
e-so
il dy
nam
ics
incl
udin
g m
appe
d ar
eas
exce
edin
g sp
ecifi
ed t
hres
hold
s of
bar
e so
il, a
nd
• D
ata
colle
cted
at
mon
itorin
g si
tes
and
obse
rvat
ions
mad
e du
ring
leas
e in
spec
tions
rel
evan
t to
pas
ture
con
ditio
n, p
rese
nce
of w
eed
spec
ies,
tr
ee-g
rass
bal
ance
(e.g
. woo
dy t
hick
enin
g) a
nd s
oil e
rosi
on.
Info
rmat
ion
from
the
pas
tora
l dis
tric
t re
port
s is
sum
mar
ised
in T
able
2. T
his
tabl
e ef
fect
ivel
y pr
ovid
es a
brie
f sn
apsh
ot o
f ea
ch p
asto
ral d
istr
ict.
Pas
tora
l D
istr
ict
AG1 G
row
th
Per
cent
ile
% P
D2
Bur
nt
% P
D w
ith c
ateg
ory
of B
are
Soil3
Site
Dat
a
min
orm
oder
ate
high
very
hig
h#
4
stat
ions
cond
ition
cl
ass
#5
site
s Su
mm
ary
of
Pas
tora
l Dis
tric
t
Dar
win
4743
7721
20
7
Goo
d7
Spat
ially
var
iabl
e se
ason
al q
ualit
y. F
ire s
imila
r in
ext
ent
to p
rece
ding
12
mon
ths.
Veg
etat
ion
cove
r su
ppre
ssed
by
rec
ent
fire.
Min
or a
mou
nts
of b
are
soil.
Maj
ority
of
gro
und
site
s in
goo
d co
nditi
on. B
ased
on
visu
al
insp
ectio
n, m
ajor
ity o
f ar
ea o
n m
ost
stat
ions
in g
ood
or f
air
cond
ition
. Wee
ds, w
here
pre
sent
, inc
lude
hyp
tis,
sida
, par
kins
onia
and
mim
osa.
Fair
2
Poor
0
Tabl
e 2.
Sum
mar
y of
land
con
ditio
n by
Pas
tora
l Dis
tric
t.
21
PASTORAL LAND BOARD | ANNUAL REPORT 2016-17
Pas
tora
l D
istr
ict
AG1 G
row
th
Per
cent
ile
% P
D2
Bur
nt
% P
D w
ith c
ateg
ory
of B
are
Soil3
Site
Dat
a
min
orm
oder
ate
high
very
hig
h#
4
stat
ions
cond
ition
cl
ass
#5
site
s Su
mm
ary
of
Pas
tora
l Dis
tric
t
Kat
herin
e44
3581
181
01
Goo
d
Fair
Poor
1 1 1
Base
d on
mod
elle
d pa
stur
e gr
owth
, sea
sona
l qua
lity
impr
oved
fro
m m
uch
belo
w-a
vera
ge in
the
nor
th
east
to
muc
h ab
ove-
aver
age
in t
he s
outh
wes
t.
App
roxi
mat
ely
one-
third
of
the
dist
rict
was
bur
nt.
Min
or o
ccur
renc
e of
bar
e so
il in
the
latt
er p
art
of t
he
2016
dry
sea
son.
Isol
ated
occ
urre
nce
of n
on-a
ctiv
ely
man
aged
gra
der
gras
s an
d ga
mba
gra
ss.
VRD
7120
3648
142
5
Goo
d11
Varia
ble
seas
onal
qua
lity
base
d on
exp
ecte
d pa
stur
e gr
owth
thr
ough
the
wet
sea
son:
abo
ve a
vera
ge in
th
e fa
r so
uth
and
nort
h ea
st, a
nd v
ery
muc
h be
low
av
erag
e in
the
cen
tral
nor
ther
n ar
ea. V
eget
atio
n co
ver
rank
was
gen
eral
ly a
bove
ave
rage
acr
oss
the
dist
rict,
al
thou
gh t
here
wer
e ar
eas
of m
oder
ate-
high
bar
e so
il, m
ainl
y in
the
sou
th a
nd s
outh
eas
t, g
ener
ally
as
soci
ated
with
fire
. Tw
enty
per
cen
t of
the
dis
tric
t w
as b
urnt
, mos
tly b
etw
een
May
and
Sep
tem
ber.
Site
s m
ostly
in ‘G
ood’
(B) t
o ‘F
air’
(C) c
ondi
tion,
and
ove
rall
the
leas
es m
onito
red
wer
e co
nsid
ered
in F
air
cond
ition
. Pa
rkin
soni
a, g
rade
r gr
ass
and
rubb
er b
ush
wer
e re
cord
ed a
nd t
here
wer
e so
me
area
s of
ero
sion
aro
und
drai
nage
line
s.
Fair
10
Poor
0
Stur
t Pl
atea
u58
2082
125
07
Goo
d16
Mos
tly a
vera
ge t
o ab
ove
aver
age
seas
onal
qua
lity
acro
ss t
he d
istr
ict,
con
sist
ent
with
the
spa
tially
av
erag
ed r
ainf
all w
hich
was
gre
ater
tha
n th
e lo
ng-
term
med
ian.
Tw
enty
per
cent
of
the
dist
rict
was
bu
rnt,
sim
ilar
to t
he p
rece
ding
yea
r. D
istin
ct a
reas
of
high
er b
are
soil
asso
ciat
ed w
ith t
enur
e bo
unda
ries
and
inci
denc
e of
fire
. Mon
itorin
g si
tes
and
maj
ority
of
area
on
six
sta
tions
in m
ostly
Goo
d co
nditi
on; o
ne s
tatio
n as
sess
ed a
s ov
eral
l Fai
r co
nditi
on.
Fair
7
Poor
0
22
PASTORAL LAND BOARD | ANNUAL REPORT 2016-17

Pas
tora
l D
istr
ict
AG1 G
row
th
Per
cent
ile
% P
D2
Bur
nt
% P
D w
ith c
ateg
ory
of B
are
Soil3
Site
Dat
a
min
orm
oder
ate
high
very
hig
h#
4
stat
ions
cond
ition
cl
ass
#5
site
s Su
mm
ary
of
Pas
tora
l Dis
tric
t
Rope
r62
2773
243
09
Goo
d
Fair
6 3
The
dist
rict
rece
ived
wel
l abo
ve lo
ng-t
erm
med
ian
rain
fall,
alth
ough
thi
s w
as n
ot n
eces
saril
y re
flect
ed in
th
e se
ason
al q
ualit
y w
hich
was
spa
tially
var
iabl
e. T
here
w
as g
ener
ally
ave
rage
to
abov
e-av
erag
e ve
geta
tion
cove
r at
the
end
of
the
2017
dry
sea
son,
exc
ept
area
s ob
viou
sly
burn
t, c
oinc
idin
g to
abo
ut o
ne-q
uart
er o
f th
e di
stric
t. T
here
wer
e si
gnifi
cant
infe
stat
ions
of
grad
er
gras
s on
som
e pr
oper
ties.
Gul
f64
1970
264
02
Goo
d2
The
Gul
f co
ast
rece
ived
muc
h ab
ove-
aver
age
rain
fall,
bu
t th
is w
as n
ot r
eflec
ted
in t
he m
uch
belo
w-a
vera
ge
mod
elle
d pa
stur
e gr
owth
. The
re w
as a
vera
ge t
o ab
ove-
aver
age
past
ure
grow
th a
cros
s th
e re
mai
nder
of
the
dist
rict,
with
are
as in
the
sou
th, b
orde
ring
onto
the
Ba
rkly
Pas
tora
l dis
tric
t ha
ving
the
hig
hest
per
cent
ile
grow
th. T
here
was
gen
eral
ly a
vera
ge t
o ab
ove-
aver
age
vege
tatio
n co
ver
at t
he e
nd o
f th
e 20
17 d
ry s
easo
n,
exce
pt a
reas
obv
ious
ly a
ffec
ted
by fi
re
Fair
2
Bark
ly84
445
3618
113
Goo
d
Fair
53 58
Ther
e w
as a
dis
tinct
rel
atio
nshi
p be
twee
n ra
infa
ll,
seas
onal
qua
lity
and
vege
tatio
n co
ver.
Spat
ially
av
erag
ed r
ainf
all w
as c
onsi
dera
bly
abov
e th
e lo
ng-
term
med
ian,
exc
ept
low
er f
or t
he s
outh
-eas
t re
gion
. Si
mul
ated
pas
ture
gro
wth
, as
an in
dica
tor
of s
easo
nal
qual
ity, w
as s
igni
fican
tly a
bove
-ave
rage
acr
oss
mos
t of
th
e di
stric
t. T
his
was
gen
eral
ly c
onsi
sten
t w
ith a
naly
sis
of L
ands
at im
ager
y w
hich
indi
cate
d pa
rts
of t
he d
istr
ict
had
the
high
est
leve
ls o
f ve
geta
tion
reco
rded
sin
ce
1988
. The
maj
ority
of
mos
t le
ases
in g
ood
or f
air
cond
ition
. Pric
kly
acac
ia, p
arki
nson
ia a
nd r
ubbe
r bu
sh
pres
ent
in a
reas
, mos
tly a
roun
d w
ater
poin
ts a
nd y
ards
.
Poor
11
23
PASTORAL LAND BOARD | ANNUAL REPORT 2016-17

Pas
tora
l D
istr
ict
AG1 G
row
th
Per
cent
ile
% P
D2
Bur
nt
% P
D w
ith c
ateg
ory
of B
are
Soil3
Site
Dat
a
min
orm
oder
ate
high
very
hig
h#
4
stat
ions
cond
ition
cl
ass
#5
site
s Su
mm
ary
of
Pas
tora
l Dis
tric
t
Tenn
ant
Cre
ek89
164
5041
60
On
grou
nd
mon
itorin
g no
t co
nduc
ted
in
2016
-17
repo
rtin
g pe
riod
Seas
onal
qua
lity
was
sig
nific
antly
abo
ve-a
vera
ge a
cros
s th
e di
stric
t ba
sed
on r
ainf
all a
nd m
odel
led
past
ure
grow
th. T
his
was
gen
eral
ly c
onsi
sten
t w
ith a
naly
sis
of
Land
sat
imag
ery
whi
ch in
dica
ted
part
s of
the
dis
tric
t ha
d ab
ove-
aver
age
to h
ighe
st le
vels
of
vege
tatio
n co
ver
reco
rded
sin
ce 1
988
(bas
ed o
n La
ndsa
t im
ager
y).
One
qua
rter
of
the
regi
on h
ad a
rel
ativ
ely
high
leve
l of
bar
e so
il (>
46%
of
Land
sat
pixe
l), m
ost
of t
his
obvi
ousl
y at
trib
uted
to
fire,
prim
arily
in t
he n
orth
-eas
t on
non
-pas
tora
l ten
ure.
Plen
ty80
<1
136
585
9
Goo
d24
Mai
nly
abov
e-av
erag
e se
ason
al q
ualit
y ba
sed
on r
ainf
all
and
mod
elle
d pa
stur
e gr
owth
. Hig
her
leve
ls o
f ba
re s
oil
com
pare
d w
ith t
he p
revi
ous
year
, inc
ludi
ng la
rge
area
s in
the
eas
tern
hal
f of
the
dis
tric
t. C
urre
nt b
are
soil
may
st
ill b
e re
late
d to
ext
ensi
ve w
ildfir
e in
201
1 an
d 20
12
and
follo
win
g dr
y ye
ars
(to
2016
). Pr
oduc
tive
graz
ing
coun
try
in g
ood
to f
air
cond
ition
with
som
e ex
tens
ive
area
s in
poo
r co
nditi
on. N
early
hal
f th
e m
onito
ring
site
s sh
owed
evi
denc
e of
win
d er
osio
n an
d th
ree
leas
es
had
serio
us g
ully
ero
sion
of
trac
ks o
r ol
d ro
ads.
Fair
35
Poor
19
Nor
ther
n
Alic
e Sp
rings
815
255
422
2
Goo
d1
Mai
nly
abov
e-av
erag
e se
ason
al q
ualit
y ba
sed
on
rain
fall
and
mod
elle
d pa
stur
e gr
owth
acr
oss
mos
t of
th
e di
stric
t fo
r bo
th t
he 2
015-
16 a
nd 2
016-
17 s
easo
ns.
This
was
gen
eral
ly r
eflec
ted
in t
he a
bove
-ave
rage
ra
nk o
f ve
geta
tion
cove
r ex
cept
in s
mal
l are
as w
hich
co
rres
pond
ed t
o fir
e in
201
7. A
reas
of
high
bar
e so
il (>
45%
) in
2016
-17
wer
e co
nsis
tent
with
are
as f
rom
th
e pr
evio
us s
easo
n.
Fair
11
Poor
1
24
PASTORAL LAND BOARD | ANNUAL REPORT 2016-17

Pas
tora
l D
istr
ict
AG1 G
row
th
Per
cent
ile
% P
D2
Bur
nt
% P
D w
ith c
ateg
ory
of B
are
Soil3
Site
Dat
a
min
orm
oder
ate
high
very
hig
h#
4
stat
ions
cond
ition
cl
ass
#5
site
s Su
mm
ary
of
Pas
tora
l Dis
tric
t
Sout
hern
A
lice
Sprin
gs89
00
1666
182
Goo
d3
Ther
e w
as c
onsi
dera
ble
spat
ial v
aria
tion
in r
ainf
all
acro
ss t
he d
istr
ict,
and
thi
s w
as g
ener
ally
refl
ecte
d in
th
e m
odel
led
past
ure
grow
th w
hich
was
abo
ve a
vera
ge
in t
he w
est
of t
he r
egio
n an
d pa
tche
s of
sig
nific
antly
be
low
ave
rage
in t
he e
ast.
The
re w
ere
exte
nsiv
e ar
eas
of h
igh
bare
soi
l; on
e qu
arte
r of
the
dis
tric
t ha
d >
58%
ba
re s
oil p
er p
ixel
, mos
t of
whi
ch t
hrou
gh t
he c
entr
al
regi
on a
ppea
red
to b
e a
cont
inui
ng le
gacy
of
exte
nsiv
e 20
11 w
ildfir
es.
Pas
t w
ind
shee
ting
was
rec
orde
d at
th
ree-
quar
ters
of
the
mon
itorin
g si
tes
with
sca
ldin
g an
d/or
wat
er s
heet
ing
also
evi
dent
at
mos
t si
tes.
Fair
8
Poor
9
1.
Aus
sieG
RASS
mod
elle
d pa
stur
e gr
owth
for
the
per
iod
Nov
embe
r 20
16 t
o A
pril
2017
or
Oct
ober
201
6 to
Sep
tem
ber
2017
as
a pe
rcen
tile
of t
he m
odel
led
grow
th f
or a
ll pr
evio
us
sim
ilar
perio
ds. T
he 1
2 m
onth
gro
wth
per
cent
ile u
sed
for
the
Nor
ther
n an
d So
uthe
rn A
lice
Sprin
gs a
nd t
he P
lent
y Pa
stor
al D
istr
icts
. The
sum
mer
gro
wth
per
cent
ile r
epor
ted
else
whe
re. P
erce
ntile
val
ues
are
avai
labl
e fo
r A
ustr
alia
on
a 5
km s
quar
e gr
id. R
epor
ted
valu
e is
the
spa
tial a
vera
ge o
f al
l grid
-cel
l val
ues
in t
he p
asto
ral d
istr
ict.
2.
Perc
enta
ge a
rea
of p
asto
ral d
istr
ict
burn
t be
twee
n O
ctob
er 2
016
and
Sept
embe
r 20
17. F
ire s
cars
sou
rced
fro
m t
he N
orth
Aus
tral
ian
Fire
Info
rmat
ion
web
site
(w
ww
.fire
nort
h.or
g.au
/nafi
3). R
epea
t fir
es in
the
Dar
win
Pas
tora
l Dis
tric
t m
eans
tha
t cu
mul
ativ
e bu
rnt
area
is g
reat
er t
han
the
area
of
the
past
oral
dis
tric
t.
3.
The
area
of
bare
soi
l pre
sent
bet
wee
n Se
ptem
ber
and
Nov
embe
r 20
17 (s
prin
g co
mpo
site
), as
a p
erce
ntag
e of
the
are
a of
the
pas
tora
l dis
tric
t. B
are
soil
is d
eriv
ed f
rom
Lan
dsat
sa
telli
te im
ager
y w
here
the
fra
ctio
ns o
f ph
otos
ynth
etic
(gre
en) v
eget
atio
n, n
on-p
hoto
synt
hetic
veg
etat
ion
(dry
veg
etat
ion
and
litte
r) a
nd b
are
soil
are
estim
ated
in e
ach
30m
squ
are
pixe
l (90
0 m
2 or
0.0
9 ha
). C
ateg
orie
s of
bar
e so
il ar
e: m
inor
, ≤20
% o
f pi
xel i
s ba
re s
oil;
mod
erat
e, 2
1% -
40%
bar
e so
il in
pix
el; h
igh,
41%
- 6
0% b
are
soil
in p
ixel
; and
ver
y hi
gh,
>60
% o
f pi
xel i
s ba
re s
oil.
The
num
ber
of p
ixel
s in
eac
h ca
tego
ry a
re c
ount
ed, m
ultip
lied
by p
ixel
are
a (0
.09
ha) a
nd c
onve
rted
to
the
perc
enta
ge o
f pa
stor
al d
istr
ict
area
.
4.
Num
ber
of s
tatio
ns v
isite
d in
the
pas
tora
l dis
tric
t.
5.
Num
ber
of in
tegr
ated
mon
itorin
g si
tes
in e
ach
cond
ition
cla
ss m
easu
red
in t
he p
asto
ral d
istr
ict.
25
PASTORAL LAND BOARD | ANNUAL REPORT 2016-17

PASTORAL DISTRICT REPORTS 2016-17
26
PASTORAL LAND BOARD | ANNUAL REPORT 2016-17
DARWIN PASTORAL DISTRICT
The Darwin Pastoral District encompasses 36 894 km2 and 22 pastoral leases.
Seasonal quality across the district, based on AussieGRASS-modelled pasture growth, varied from much below to much above average.
The district experiences extensive and frequent fire. The total area burnt between October 2016 and September 2017 was similar to the preceding reporting period (2015-16, 17 533 km2; 2016-17, 15 808 km2). Based on the Landsat record for the last 29 years, most areas of reduced vegetation cover were related to recent fire. Minor amounts of bare soil were present in the late dry season of 2017. Perennial grasses dominated at the majority of nine integrated sites
measured on four pastoral leases with bare soil, on average, comprising approximately 6% of total ground cover. Seven sites were rated in good condition and two in fair condition. An additional three properties were also visited, but measured data was not recorded; rangeland assessment sites (RAS) were conducted for qualitative data. Based on visual inspection, the majority of country on most stations was judged to be in good or fair condition. Weeds, where present, included hyptis, sida, mimosa and gamba grass, although this was generally grazed.
Seasonal quality
“Seasonal quality” describes the relative value of recent rainfall in producing forage for livestock. It is judged with reference to the historical record. Two indicators are used: rainfall amount compared with the long-term median and expected pasture growth based on rainfall received, simulated using AussieGRASS (www.longpaddock.qld.gov.au).
Descriptors of seasonal quality provide useful context for interpreting various measures of land condition. However, to the extent possible, land condition is assessed independently of seasonal conditions.
Rainfall statistics (Table 3) are based on gridded rainfall produced by the Bureau of Meteorology (www.bom.gov.au/jsp/awap/rain/index.jsp). Pixel (grid cell) values are calculated from rainfall amounts at recognised recording stations. Rainfall is from October of one year to September the following year thus incorporating an entire growing season. Modelled pasture growth is for the period November 2016 to April 2017. This growth is ranked as a percentile of the growth for all previous summers.
Map 1: Location of Darwin Pastoral District
Table 3. Indicators of seasonal quality. Data spatially averaged for the Darwin Pastoral District.
Rainfall (mm) AussieGRASS
2016 – 2017 1625 Growth (kg/ha) 1929
Long-term median 1270 Percentile 47
27
PASTORAL LAND BOARD | ANNUAL REPORT 2016-17

DARWIN PASTORAL DISTRICT
Spatially averaged rainfall for the Darwin Pastoral District was greater than the long-term median (Table 3) but displayed considerable spatial variation (Figure 10, left-hand panel). Rainfall decreased from west to east (coastal to inland) across the region with areas around Labelle Downs having more than 2600 mm, significantly greater than the long-term median district rainfall.
Modelled pasture growth over the last summer was slightly below the long-term average based on the spatial mean (Table 3).
0 50 100 km
Rain
Low: 1075mm
Mid: 1500mm
High: 1950mm
0 50 100 km
Spatially interpolated rainfall, October 2016 to September 2017
Simulated summer pasture growth as a percentage of the long-term record
Figure 10. Maps of seasonal quality. Left, gridded rainfall, October 2016 to September 2017; Right, AussieGRASS-modelled pasture growth for the 2016-17 summer period as a percentage of previous summers.
28
PASTORAL LAND BOARD | ANNUAL REPORT 2016-17

Fire
The North Australian Fire Information website (www.firenorth.org.au/nafi3) reports that 15 808 km2 burnt (43% of Darwin Pastoral District) between October 2016 and September 2017. This was similar to the 17 533 km2 burnt in the 2015-16 reporting period and considerably less than the 45 187 km2 burnt in the 2014-15 reporting period. Reduced fire occurrence in the late dry season of 2016 was the main contributor to the smaller total area burnt.
Figure 11. Monthly area burnt (km2) in the Darwin Pastoral District between October 2016 and September 2017.
Bare soil dynamics
It is important to maintain adequate ground cover in the latter months of each year to minimise soil loss from wind erosion and intense summer storms. It is also important to carry dry feed, and associated ground cover, into the latter months of each calendar year in case there is a late start to the usual wet season and/or monsoonal rains fail more generally.
The amount of bare soil present at any location changes from year to year depending on rainfall and its effectiveness, fire history and amount of grazing. The percentage of bare soil in each 30m square Landsat pixel (900 m2 or 0.09 ha) was used to report the amount of bare soil across all pixels in the Darwin Pastoral District for the end of dry season (September to November spring composite).
Most areas of reduced vegetation cover, compared with the last 29 years, across much of the Darwin Pastoral District were associated with recent fire (Figure 12, burnt areas shown with diagonal hatching). However, recent fire did not always suppress vegetation cover, relative to past levels, probably because fire is a recurrent (almost annual) event in the Darwin region.
DARWIN PASTORAL DISTRICT
29
PASTORAL LAND BOARD | ANNUAL REPORT 2016-17

Figure 12. Rank of the amount of remotely-sensed vegetation cover present from September to November 2017 against that for previous years back to 1988. Diagonal lines show those areas burnt between January and November 2017.
Ignoring fire effects on the dynamics of vegetation cover, parts of the northern section of the pastoral district had relatively less cover in late 2017 compared with the same period back to 1988. Contrasting with this suppressed cover, much of the southern area had above-average vegetation cover with reasonably extensive areas having their highest late dry-season cover since 1988.
DARWIN PASTORAL DISTRICT
30
PASTORAL LAND BOARD | ANNUAL REPORT 2016-17

Figure 13. Percentage cumulative frequency of varying levels of bare soil in 30m square Landsat pixels in the Darwin Pastoral District between September and November 2017 (spring composite). Areas with greater than 19% bare soil are mapped in Figure 14.
The bare soil threshold for each pastoral district was based on the frequency distribution of all 30m Landsat bare soil fractional ground cover pixels at the end of 2017 (spring composite). A threshold was determined which represents 75% of a district’s overall bare soil. The remaining 25% is considered to have above-threshold bare soil.
For the Darwin Pastoral District, this was calculated as 19% bare soil in each Landsat pixel with this latter area mapped in Figure 14. It includes areas burnt earlier in 2017. Approximately 52% of the district had minor amounts of bare soil (< 10% of the 30m Landsat pixel) towards the end of 2017 (Figure 13).
DARWIN PASTORAL DISTRICT
31
PASTORAL LAND BOARD | ANNUAL REPORT 2016-17

Figure 14. Parts of the Darwin Pastoral District having more than 19% bare soil per Landsat pixel in late 2017. Areas burnt between January and November 2017 shown with diagonal lines. Note that the threshold level of bare soil used for mapping purposes varies between pastoral districts. It is selected to show at what level approximately 25% of the district is affected.
Site based monitoring
Land condition assessment was conducted on seven pastoral leases in the Darwin Pastoral District during the 2016-17 reporting period, comprising 36% of the pastoral lease area.
Vegetation cover of the ground layer was measured using the point intercept method at nine sites across four of the seven leases. Perennial grasses were the dominant component, by cover, at most sites (Figure 15). Annual grasses and forbs (both perennial and annual) were a minor component. Moderate amounts of litter were generally present, consistent with the more timbered land systems, and bare soil, on average, comprised ~5% of total ground cover.
Land condition was also qualitatively measured using Rangeland Assessment Sites (RAS) across three additional pastoral leases. One of these leases could not be adequately assessed due to the extent of burnt area at the time of the inspection.
DARWIN PASTORAL DISTRICT
32
PASTORAL LAND BOARD | ANNUAL REPORT 2016-17

Pasture Utilisation
Rank % of sites
No grazing 0
Minimal 89
Moderate 11
Moderate to heavy 0
Heavy 0
Table 4. Levels of pasture utilisation recorded at nine sites on seven pastoral leases in the Darwin Pastoral District.
Figure 15. Mean percentage and standard error of measured components of vegetation cover in the ground layer from nine sites on seven pastoral leases in the Darwin Pastoral District.
The majority of sites (89%) had minimal grazing (Table 4), which was unexpected as all visits were later in the dry season when increased pasture utilisation is expected, but this may be attributed to an above-average 2016-17 wet season.
There was no evidence of erosion recorded at any of the monitoring sites, consistent with the high cover provided by perennial grasses and litter.
Land condition ratings assigned at monitoring sites and the more generalised assessment of land condition across those parts of pastoral leases traversed are summarised in Table 5. To the extent possible, these assessments are independent of the variable seasonal quality across the Darwin Pastoral District during 2016-17 (described above).
DARWIN PASTORAL DISTRICT
Perennial grasses are important because they protect the soil surface against wind and water erosion and, where palatable, provide persistent forage to carry livestock through dry times. Litter cover also protects the soil surface, assists infiltration of rain water and helps retain plant seeds in situ.
Mean % ± SE
6 ± 3.6
19 ± 4.7
0
3 ± 2.7
72 ± 7.7
33
PASTORAL LAND BOARD | ANNUAL REPORT 2016-17

Station Condition Rating
Comments with regard to pastoral lease
1Good: 1 siteFair: 1 site
This property was generally considered in ‘Fair’ (C) condition, which appears to have degraded since the last monitoring conducted in 2008. There was very much above average rainfall for the wet season preceding the visit, but the lessee stated that there had been some poor seasons previously. There was a fair diversity of palatable desirable perennial grass species, and also gamba grass, and few signs of erosion. There were some areas of Mimosa, which were being actively controlled.
2 Good: 3 sites
Most of this lease was assessed in ‘Good’ (B) condition, which has been maintained since the last monitoring assessment conducted in 2008, with reasonable vegetation and litter cover retained during the expected fluctuations between the wet and dry season. This is supported by satellite imagery products. Very much above-average rainfall in the 2016-17 wet season prior to the visit and absence of significant fire since 2015 contributed to good ground cover across the three new Integrated Monitoring sites and the four existing Tier 1 sites.
3 Good: 2 sites
The areas inspected were generally considered to be in ‘Good’ (B) condition, which appears to have been maintained since the last monitoring conducted in 2008. Despite incidence of fires the seasonal response of vegetation to average rainfall produced good ground cover across all assessed sites and general observations. There was a good diversity of palatable desirable perennial grass species, and few signs of erosion.
4Good: 1 siteFair: 1 site
The property was considered in ‘Good to Fair’ condition, which has been maintained since the last monitoring conducted in 2010. Very much above-average rainfall in the 2016-17 wet season, contributed to good ground cover even during the expected fluctuations between the wet and dry season. This was supported by the satellite imagery products. On-ground assessment showed a good diversity of palatable desirable perennial grass species, such as kangaroo grass and golden beard grass in wooded areas and para grass and sedges on the black soil flood plains across the property.
5 Overall Fair
The majority of this station was generally considered in ‘Fair’ (C) condition, with some remote areas in very good condition. This appears to have been maintained since the last monitoring conducted in 2008. The condition is consistent with above average seasonal conditions and lower than average fire activity contributing to good ground cover across sites. There was a good diversity of palatable and productive perennial grass species, and few signs of erosion. There were no areas of concern for weeds, erosion or woody thickening. Parkinsonia was being actively controlled.
6Overall unable
to assess
This lease was unable to be accurately assessed for land condition at the time of the visit as much of it had been burnt, cleared or was not pastorally significant country. In general, much of the property showed the burnt remains of desirable golden beard grass but other species could not be identified. It is likely that the above average wet season could have promoted a diversity of palatable desirable perennial grass species. There were few signs of erosion or weeds.
7 Overall Fair
This property was generally considered in ‘Fair’ (C) condition, which appears to have been maintained since the last monitoring conducted in 2008. This is consistent with average seasonal conditions and high fire activity contributing to low ground cover across the property. There were no areas of concern for erosion, weeds or woody thickening.
Table 5. Assessed land condition at monitoring sites and traversed parts of seven pastoral leases in the Darwin Pastoral District.
DARWIN PASTORAL DISTRICT
34
PASTORAL LAND BOARD | ANNUAL REPORT 2016-17

KATHERINE PASTORAL DISTRICT
The Katherine Pastoral District encompasses 19 643 km2 and nine pastoral leases.
Seasonal quality, as indicated by AussieGRASS-modelled pasture growth, improved from much below average in the north east of the district to much above-average in the south west.
Approximately 35% of the district was affected by fire between October 2016 and September 2017, with the most extensive areas being in October - November 2016 and May – June 2017. Most of the region (~80%) had minor occurrence (< 20%) of bare ground
late in the 2017 dry season. On-ground monitoring was conducted at three sites on one pastoral lease. Sites, on average, had a moderate cover of perennial grasses, low bare soil, and moderate amounts of litter, as would be expected from more timbered country in the north. Forbs and annual grasses were minor components of total ground cover. Isolated infestations of grass weeds, namely gamba grass and grader grass were recorded. Minor gullying erosion was observed at sections of some tracks and drainage lines.
Seasonal quality
“Seasonal quality” describes the relative value of recent rainfall in producing forage for livestock. It is judged with reference to the historical record. Two indicators are used: rainfall amount compared with the long-term median and expected pasture growth based on rainfall received, simulated using AussieGRASS (www.longpaddock.qld.gov.au).
Descriptors of seasonal quality provide useful context for interpreting various measures of land condition at particular times. However, to the extent possible, land condition is assessed independently of seasonal conditions.
Rainfall statistics (Table 6) are based on gridded rainfall produced by the Bureau of Meteorology (www.bom.gov.au/jsp/awap/rain/index.jsp). Pixel (grid cell) values are calculated from rainfall amounts at recognised recording stations. Rainfall is from October of one year to September the following year thereby incorporating an entire growing season. Modelled pasture growth is for the period November 2016 to April 2017. This growth is ranked as a percentile of the growth for all previous summers.
Table 6. Indicators of seasonal quality. Data spatially averaged for the Katherine Pastoral District.
Rainfall (mm) AussieGRASS
2016 - 2017 1190 Growth (kg/ha) 2074
Long term median 906 Percentile 44
Map 2: Location of Katherine Pastoral District
35
PASTORAL LAND BOARD | ANNUAL REPORT 2016-17

KATHERINE PASTORAL DISTRICT
Spatially averaged rainfall for the Katherine Pastoral District was above the long-term median (Table 6) with most of the region receiving more than 1200 mm between October 2016 and September 2017. The far south west received slight less, however it was still above 1000 mm.
Modelled pasture growth over the last summer was slightly below average based on the spatial mean (Table 6), however there was considerable variation across the region. Seasonal quality improved from much below average in the north east of the district to much above-average in the south west (Figure 16, right-hand panel).
0 50 100 km
Rain
Low: 1000mm
Mid: 1200mm
High: 1350mm
0 50 100 km
Figure 16. Maps of seasonal quality. Left, gridded rainfall, October 2016 to September 2017; Right, AussieGRASS-modelled pasture growth for the 2016-17 summer period as a percentage of previous summers.
Fire
The North Australian Fire Information website (www.firenorth.org.au/nafi3) reports that 6962 km2 (35.4% of the district) burnt between October 2016 and September 2017. Fire was extensive in October and November 2016 (Figure 17) suggesting wildfire was the main reason (as this is typically when wildfires started by lightning occur). The next peak in fire activity was in May and June 2017 probably due to managed, early dry-season burning.
Spatially interpolated rainfall, October 2016 to September 2017
Simulated summer pasture growth as a percentage of the long-term record
36
PASTORAL LAND BOARD | ANNUAL REPORT 2016-17

Figure 17. Monthly area burnt (km2) in the Katherine Pastoral District between October 2016 and September 2017.
Bare soil dynamics
It is important to maintain adequate ground cover in the latter months of each year to minimise soil loss from wind erosion and intense wet-season storms. It is also important to carry dry feed, and associated ground cover, into the latter months of each calendar year in case there is a late start to the usual wet season and/or monsoonal rains fail more generally.
The amount of bare soil present at any location changes from year to year depending on rainfall and its effectiveness, fire history and amount of grazing. The percentage of bare soil in each 30m square Landsat pixel (900 m2 or 0.09 ha) was used to report the amount of bare soil across all pixels in the Katherine Pastoral District.
Recent fire contributed to reduce vegetation cover, compared with the last 29 years, across much of the Katherine Pastoral District (Figure 18, burnt areas shown with diagonal hatching). Nearby areas in the north and further south had some of their highest levels of vegetation cover (for the late dry season) since 1988.
KATHERINE PASTORAL DISTRICT
37
PASTORAL LAND BOARD | ANNUAL REPORT 2016-17

The bare soil threshold for each pastoral district was based on the frequency distribution of all 30m Landsat bare soil fractional ground cover pixels at the end of 2017 (spring composite). A threshold was determined which represents 75% of a district’s overall bare soil. The remaining 25% is considered to have above-threshold bare soil. Forty seven percent of the pastoral district had minor amounts of bare soil (< 10% of the 30m Landsat pixel) towards the end of 2017 (Figure 19). For the Katherine Pastoral District, this was calculated as 17% bare soil in each Landsat pixel mapped in Figure 20 and includes areas burnt earlier in 2017.
Figure 18. Rank of the amount of remotely-sensed vegetation cover present in late 2017 (spring composite September - November) against that for previous years back to 1988. Diagonal lines show those areas burnt between January and November 2017.
Figure 19. Percentage cumulative frequency of varying levels of bare soil in 30m square Landsat pixels in the Katherine Pastoral District between September and November 2017 (spring composite). Areas with greater than 17% bare soil are mapped in Figure 20.
38
PASTORAL LAND BOARD | ANNUAL REPORT 2016-17

Figure 20. Parts of the Katherine Pastoral District having more than 17% bare soil per Landsat pixel in late 2017. Areas burnt between January and November 2017 shown with diagonal lines. Note that the threshold level of bare soil used for mapping purposes varies between pastoral districts. It is selected to show at what level approximately 25% of the district is affected.
KATHERINE PASTORAL DISTRICT
39
PASTORAL LAND BOARD | ANNUAL REPORT 2016-17

Site based monitoring
One pastoral lease from the nine leases within the Katherine Pastoral District, comprising 38% of the pastoral lease area, was visited during 2017.
Vegetation cover of the ground layer was measured using the point intercept method at three sites across the one lease. Perennial grasses were the dominant component, by cover, at most sites (Figure 21). Annual grasses and forbs (both perennial and annual) were a minor component. Moderate amounts of litter were generally present and bare soil, on average, comprised ~5% of total ground cover.
Perennial grasses are important because they protect the soil surface against wind and water erosion and, where palatable, provide persistent forage to carry livestock through dry times. Litter cover also protects the soil surface, assists infiltration of rain water and helps retain plant seeds in situ.
KATHERINE PASTORAL DISTRICT
Figure 21. Mean percentage and standard error of measured components of vegetation cover in the ground layer from three sites on one pastoral lease in the Katherine Pastoral District.
All integrated monitoring sites had minimal or no grazing (Table 7); this low utilisation was generally observed across the lease, consistent with the visit occurring early in the dry season, but is not necessarily representative of the rest of the Katherine Pastoral District.
There was no evidence of erosion recorded at any of the integrated monitoring sites, although isolated gullying was observed on tracks and natural drainage lines.
40
PASTORAL LAND BOARD | ANNUAL REPORT 2016-17

KATHERINE PASTORAL DISTRICT
Pasture Utilisation
Rank % of sites
No grazing 33
Minimal 67
Moderate 0
Moderate to heavy 0
Heavy 0
Land condition ratings assigned at monitoring sites and the more generalised assessment of land condition across those parts of the pastoral lease traversed are summarised in Table 8. To the extent possible, these assessments are independent of the variable seasonal quality across the Katherine Pastoral District during 2016-17 (described above).
Table 8. Assessed land condition at monitoring sites and traversed parts of one pastoral lease in the Katherine Pastoral District.
Station Condition Rating
Comments with regard to pastoral lease
1Good: 2 sites
Fair 1 site
The property was generally considered in ‘Good’ (B) condition, which appears to have been maintained since the last monitoring conducted in 2008. Recent good wet seasons were reflected in the pasture recovery. There was a good diversity of palatable desirable perennial grass species, and few signs of erosion. There were areas of weed infestations which were not actively managed including gamba grass and grader grass.
Table 7. Levels of pasture utilisation recorded at three sites on one pastoral lease in the Katherine Pastoral District.
41
PASTORAL LAND BOARD | ANNUAL REPORT 2016-17

VRD PASTORAL DISTRICT
The VRD Pastoral District is the second largest of the eleven districts, encompassing 133 056 km2 and 25 pastoral leases.
The district experienced mostly above-average seasonal quality in the far south and north east, based on expected pasture growth through the 2016-17 wet season. There were much poorer seasonal conditions in the central northern area. Elsewhere, seasonal quality was mostly average, although still spatially variable. Twenty percent of the region burnt between October 2016 and September 2017. Sixty-four percent of the district had >20% bare soil per Landsat pixel (spring composite), mainly in the south east and south. This area includes ‘desert-like’ country of low pastoral value that is periodically burnt. On-ground monitoring was conducted at 21 sites on five pastoral leases. Sites, on average, had a moderate cover of perennial grasses and lesser amounts of bare soil and litter. Forbs and annual grasses were minor components of total ground cover. Eleven sites were in good condition and ten sites in fair condition. Parkinsonia, grader grass and rubber bush were recorded around some yards and waterpoints with sections of some tracks eroded through gullying.
Seasonal quality
“Seasonal quality” describes the relative value of recent rainfall in producing forage for livestock. It is judged with reference to the historical record. Two indicators are used: rainfall amount compared with the long-term median and expected pasture growth based on the rainfall received, simulated using AussieGRASS (www.longpaddock.qld.gov.au).
Descriptors of seasonal quality provide useful context for interpreting various measures of land condition at particular times. However, to the extent possible, land condition is assessed independently of seasonal conditions.
Rainfall statistics (Table 9) are based on gridded rainfall data produced by the Bureau of Meteorology (www.bom.gov.au/jsp/awap/rain/index.jsp). Pixel (grid cell) values are calculated from rainfall amounts at recognised recording stations. Rainfall is from October of one year to September the following year thus incorporating one entire growing season. Due to the considerable north-south transition in long-term median rainfall for this large pastoral district, rainfall statistics are reported based on an arbitrary split of the region into two sub-districts (Figure 22).
Table 9. Recent seasonal quality for the VRD Pastoral District as indicated by spatially averaged rainfall relative to the long-term median.
Rainfall (mm) VRD North VRD South
2016 – 2017 1186 758
Long-term median 759 465
Map 3: Location of VRD Pastoral District
42
PASTORAL LAND BOARD | ANNUAL REPORT 2016-17

VRD PASTORAL DISTRICT
Spatially averaged rainfall for the northern and southern sections of the VRD Pastoral District was well above the long-term median (Table 9). In the northern part of the region, there was a considerable north-to-south decrease in the spatial distribution of rainfall (Figure 22). Rainfall in the southern part of the pastoral district was more uniformly distributed, as indicated by the colour shading in Figure 22. Pastoral leases and Aboriginal land fringing the Tanami Desert in the south east of the region had lower rainfall (<650 mm) for the 12 months, October 2016 to September 2017.
Rain
Low: 600mm
Mid: 1000mm
High: 1500mm
VRD North
0 50 100 150 km
VRD South
Figure 22. Spatially interpolated, gridded rainfall for the VRD Pastoral District. Reporting period is October 2016 to September 2017.
AussieGRASS-modelled pasture growth, as a second indicator of seasonal quality for the entire VRD Pastoral District, is for the period November 2016 to April 2017. This growth is ranked as a percentile of the growth for all previous summers back to 1957. In this case, spatially-averaged growth through the 2016-17 wet season was ~2140 kg/ha which was above the long-term median (Table 10).
Table 10. Recent seasonal quality averaged across the entire VRD Pastoral District, as indicated by modelled pasture growth.
Index of seasonal quality VRD Pastoral District
Growth (kg/ha) 2141
Percentile 71
43
PASTORAL LAND BOARD | ANNUAL REPORT 2016-17

VRD PASTORAL DISTRICT
0 50 100 150 km
Figure 23. Simulated pasture growth for the 2016-17 wet season as a percentage of the long-term record.
Modelled pasture growth over the last summer, as a percentage of the long-term record, was mostly above-average in the far south and north-eastern parts of the pastoral district (Figure 23). Central northern parts were very much below average.
Percen�le Growth
very much below average
much below average
below average
average
above average
much above average
very much above average
44
PASTORAL LAND BOARD | ANNUAL REPORT 2016-17

Bare soil dynamics
It is important to maintain adequate ground cover in the latter months of each year to minimise soil loss from wind erosion and intense summer storms. It is also important to carry dry feed, and associated ground cover, into the latter months of each calendar year in case there is a late start to the usual wet season and/or monsoonal rains fail more generally.
The amount of bare soil present at any location changes from year to year depending on rainfall and its effectiveness, fire history and amount of grazing. Remote sensing was used to assess the amount of bare soil. The percentage of bare soil in each 30m square Landsat pixel (900 m2 or 0.09 ha) was used to report the amount of bare soil across all pixels in the VRD Pastoral District.
Recent fire contributed to reduced vegetation cover, compared with the last 29 years, across parts of the northern and southern sections of the pastoral district (Figure 25), including areas within the Central Desert Aboriginal Land Trust and around Timber Creek. The majority of the VRD pastoral leases not affected by fire showed above to well above average vegetation cover, consistent with above-median rainfall and modelled pasture growth.
VRD PASTORAL DISTRICT
Fire
The North Australian Fire Information website (www.firenorth.org.au/nafi3) reports that 26 871 km2 (20.2% of the VRD Pastoral District was burnt between October 2016 and September 2017. This was a similar area to that burnt in the previous (2015-16) reporting period. Fire was most extensive between March and September 2017, which may have been due to controlled burning.
Figure 24. Monthly area burnt (km2) in the VRD Pastoral District between October 2016 and September 2017.
45
PASTORAL LAND BOARD | ANNUAL REPORT 2016-17

Figure 25. Rank of the amount of remotely-sensed vegetation cover present from September to November 2017 (spring composite) against that for previous years back to 1988. Diagonal lines show those areas burnt between January and November 2017.
VRD PASTORAL DISTRICT
46
PASTORAL LAND BOARD | ANNUAL REPORT 2016-17

Figure 26. Percentage cumulative frequency of varying levels of bare soil in 30m square Landsat pixels in the VRD Pastoral District between September and November 2017 (spring composite). Areas with greater than 35% bare soil are mapped in Figure 27
Threshold bare soil for the district was calculated based on the cumulative frequency distribution to show the bare soil value which represents 75% of that district at the end of 2017 (spring composite). For the VRD Pastoral District, this was calculated as 35% bare soil in each Landsat pixel (Figure 26), with this latter area mapped in Figure 27, and includes some of the country burnt in this period.
VRD PASTORAL DISTRICT
47
PASTORAL LAND BOARD | ANNUAL REPORT 2016-17

Concentrated areas exceeding the 35% bare-soil threshold in the far south and south-east include desert country of low pastoral value. Extensive wildfire is a regular feature here and probably contributed to elevated levels of bare soil.
Site based monitoring
Five pastoral leases in the VRD Pastoral District, comprising 14% of the pastoral lease area, were visited by monitoring officers in late 2016 and during 2017.
Figure 27. Parts of the VRD Pastoral District having more than 35% bare soil per Landsat pixel in late 2017. Country burnt between January and November 2017 is shown with diagonal lines. Note that the threshold level of bare soil used for mapping purposes varies between pastoral districts. It is selected to show at what level approximately 25% of the district is affected.
VRD PASTORAL DISTRICT
48
PASTORAL LAND BOARD | ANNUAL REPORT 2016-17

Pasture Utilisation
Rank % of sites
No grazing 0
Minimal 62
Moderate 24
Moderate to heavy 14
Table 11. Levels of pasture utilisation and evidence of erosion assessed at 21 sites on five pastoral leases in the VRD Pastoral District.
Figure 28. Mean percentage and standard error of measured components of vegetation cover in the ground layer from 21 sites on five pastoral leases in the VRD Pastoral District.
Most sites were minimally grazed at the time of assessment (Table 11). Leases assessed later in the dry season were likely to have had a higher level of pasture utilisation due to the time elapsed since the end of the previous wet-season growth event.
There was no evidence of erosion at any of the integrated monitoring sites.
VRD PASTORAL DISTRICT
Vegetation cover of the ground layer was measured using the point intercept method at 21 sites of 1 ha area across the five leases. Sites, on average, had a fair cover of perennial grasses for the region and lesser amounts of bare soil and litter (Figure 28). Annual grasses and forbs (both perennial and annual) were minor components of total ground cover.
As indicated by the standard errors for bare soil and perennial grass (Figure 28), there was considerable variation in measured cover components amongst sites. Four sites had 40% or more bare soil and perennial grasses comprised less than 20% (of total ground cover) at four sites. Two of the sites with minor perennial grasses also had large amounts of bare soil.
Perennial grasses are important because they protect the soil surface against wind and water erosion and, where palatable, provide persistent forage to carry livestock through dry times. Litter cover also protects the soil surface, assists infiltration of rain water and helps retain plant seeds in situ.
49
PASTORAL LAND BOARD | ANNUAL REPORT 2016-17

Station Condition Rating
Comments with regard to pastoral lease
1Good: 3 sitesFair: 2 sites
The property experienced below average rainfall in the preceding wet season. The property, in general, was assessed to be in ‘Fair’ (C) condition. Vegetation and litter were providing moderate ground cover at integrated monitoring sites and Tier 1 photo points. While much of the property had a similar level of ground cover, there were slight differences in pasture composition between the northern and southern parts of the property. There were only a few signs of active erosion mainly along creek edges and drainage lines.
2Good: 4 sites
Fair: 1 site
Overall, this lease was considered in ‘Fair’ (C) condition, which appears to have been maintained since the last monitoring conducted in 2008. A good wet season was reflected in the pasture recovery. There was a fair diversity of palatable desirable perennial grass species, and minimal signs of erosion.
3Good: 2 sites
Fair: 1 site
The property was generally considered in ‘Fair’ (C) condition, which appears to have been maintained since the last monitoring conducted in 2008. The recent good wet season was reflected in the pasture recovery. There was a fair diversity of palatable desirable perennial grass species and isolated areas of erosion. There were areas of weed infestations observed of the declared parkinsonia and lions tail. Some paddocks show historic degradation but the managers have reduced current herd numbers and spelled certain paddocks in an effort to ameliorate legacy issues.
4Good: 1 siteFair: 2 sites
Consistent with other properties inspected in the district, this lease was generally considered in ‘Fair’ (C) condition, which appears to have been maintained since the last monitoring conducted in 2008. The recent good wet season was reflected in the pasture recovery in the remote bush paddocks but this was not reflected along the river flats. There was a fair diversity of palatable desirable perennial grass species, and some significant evidence of erosion. There were no significant areas of weed infestations. There is some cause for concern on the ongoing condition of this lease at this stage, especially regarding the ongoing health of the river flats.
5Good: 1 siteFair: 4 sites
This station was generally considered in ‘Fair’ (C) condition, which appears to have been maintained since the last monitoring conducted in 2008. Recent average wet seasons were reflected in expected pasture recovery. There was a fair diversity of palatable desirable perennial grass species, and minimal signs of erosion. There were areas of weed infestations that had been controlled including parkinsonia, grader grass and rubber bush. There is minimal cause for concern on the ongoing condition of this lease at this stage.
VRD PASTORAL DISTRICT
Table 12. Assessed land condition at 21 monitoring sites and traversed parts of five pastoral leases in the VRD Pastoral District.
Land condition ratings assigned at monitoring sites and the more generalised assessment of land condition across those parts of pastoral leases traversed are summarised in Table 12. To the extent possible, these assessments are independent of the variable seasonal quality experienced across the region in the current reporting cycle (described above).
50
PASTORAL LAND BOARD | ANNUAL REPORT 2016-17

STURT PLATEAU PASTORAL DISTRICT
This Pastoral District encompasses just over 43 138 km2 and includes 31 pastoral leases.
Modelled pasture growth reflected the above-median long term rainfall distribution across the Sturt Plateau. Approximately a fifth of the region burnt between October 2016 and September 2017, similar to the area burnt in the previous 12 months. Twenty-five percent of the pastoral district had some bare ground exposed (> 16% bare soil in each Landsat pixel). Monitoring was conducted at 23 sites on seven leases. Sites, on average, had a good cover of perennial grasses, a moderate amount of litter as would be expected with the more timbered land systems in this district, and a small amount of bare soil (5%). Sixteen sites were rated in good condition and the remainder in fair condition.
Seasonal quality
“Seasonal quality” describes the relative value of recent rainfall in producing forage for livestock. It is judged with reference to the historical record. Two indicators are used: rainfall amount compared with the long-term median and expected pasture growth based on the rainfall received, simulated using AussieGRASS (www.longpaddock.qld.gov.au).
Descriptors of seasonal quality provide useful context for interpreting various measures of land condition at particular times. However, to the extent possible, land condition is assessed independently of seasonal conditions.
Rainfall statistics (Table 13) are based on gridded rainfall produced by the Bureau of Meteorology (www.bom.gov.au/jsp/awap/rain/index.jsp). Pixel (grid cell) values are calculated from rainfall amounts at recognised recording stations. Rainfall is from October of one year to September the following year thus incorporating one entire growing season. Modelled pasture growth is for the period November 2016 to April 2017. This growth is ranked as a percentile of the growth for all previous wet seasons back to 1957.
Table 13. Indicators of seasonal quality. Data spatially averaged for the Sturt Plateau Pastoral District.
Rainfall (mm) AussieGRASS
2016 - 2017 971 Growth (kg/ha) 2032
Long term median 639 Percentile 58
Map 4: Location of Sturt Plateau Pastoral District
51
PASTORAL LAND BOARD | ANNUAL REPORT 2016-17

STURT PLATEAU PASTORAL DISTRICT
Spatially averaged rainfall for the Sturt Plateau Pastoral District was greater than the long-term median (Table 13). Rainfall was highest in the south-east corner, including parts of Kalala and Hidden Valley (Figure 29, left-hand panel).
Modelled pasture growth over the last summer was generally average based on the spatial mean (Table 13). Growth reflected rainfall distribution (Figure 29, right hand panel).
0 50 100 km Rain
Low: 970mm
Mid: 1000
High: 1100mm
0 50 100 km
Figure 29. Maps of seasonal quality. Left, gridded rainfall, October 2016 to September 2017; Right, AussieGRASS-modelled pasture growth for the 2016-17 summer as a percentage of previous summers.
Spatially interpolated rainfall, October 2016 to September 2017
Simulated summer pasture growth as a percentage of the
long-term record
Percen�le Growth
very much below average
much below average
below average
average
above average
much above average
very much above average
52
PASTORAL LAND BOARD | ANNUAL REPORT 2016-17

Figure 30. Monthly area burnt between October 2016 and September 2017 in the Sturt Plateau Pastoral District.
Bare soil dynamics
It is important to maintain adequate ground cover in the latter months of each year to minimise soil loss from wind erosion and intense wet-season storms. It is also important to carry dry feed, and associated ground cover, into the latter months of each calendar year in case there is a late start to the usual wet season and/or monsoonal rains fail more generally.
The amount of bare soil present at any location changes from year to year depending on rainfall and its effectiveness, fire history and amount of grazing. The percentage of bare soil in each 30m square Landsat pixel (900 m2 or 0.09 ha) was used to report the amount of bare soil across all pixels in the Sturt Plateau Pastoral District.
There were quite distinct boundaries between different categories of decile-ranked vegetation cover (Figure 31); a similar feature to that reported in the previous Annual Reports.
STURT PLATEAU PASTORAL DISTRICT
Fire
The North Australian Fire Information website (www.firenorth.org.au/nafi3) reports that 8537 km2 (19.8%) of the Sturt Plateau Pastoral District was burnt over the reporting period, with a significant area burnt in September 2017 (Figure 30). This was similar to the area burnt in the 2015-16 reporting period (9394 km2) and twice the area burnt in the 2014-15 reporting period (4326 km2).
53
PASTORAL LAND BOARD | ANNUAL REPORT 2016-17

This image depicts the amount of vegetation present in the late 2017 dry season relative to that present at the same time each year since 1988. Some areas of recent relatively lower vegetation cover, correspond with fire (i.e. areas shown with diagonal lines) and align with pastoral tenure. This suggests an interaction between management influence on fires and grazing management as they affect vegetation cover. Excluding the fire affected areas, the district as a whole had higher amounts of above average to very much above average vegetation cover in the 2017 dry season, compared with 2016 and the last 29 years. This trend broadly corresponds with the higher rainfall and modelled wet-season pasture growth shown in Figure 29.
The bare soil threshold for each pastoral district was based on the frequency distribution of all 30m Landsat bare soil fractional ground cover pixels at the end of 2017 (spring composite). A threshold was determined which represents 75% of a district’s overall bare soil. The remaining 25% is considered to have above-threshold bare soil. For the Sturt Plateau Pastoral District the bare soil was calculated as 16%. This area is mapped in Figure 33 and includes areas burnt earlier in 2017. Approximately one half of the pastoral district had negligible amounts of bare soil (< 10% of the 30m Landsat pixel) towards the end of 2017 (Figure 32)
Figure 31. Rank of the amount of remotely-sensed vegetation cover present from September to November 2017 (spring composite) against that for previous years back to 1988. Diagonal lines show those areas burnt between January and November 2017.
STURT PLATEAU PASTORAL DISTRICT
54
PASTORAL LAND BOARD | ANNUAL REPORT 2016-17

Figure 33. Parts of the Sturt Plateau Pastoral District having more than 16% bare soil per Landsat pixel in late 2017. Diagonal lines show areas burnt between January and November 2017. Note that the threshold level of bare soil used for mapping purposes varies between pastoral districts. It is selected to show at what level approximately 25% of the district is affected.
Figure 32. Percentage cumulative frequency of varying levels of bare soil in 30m square Landsat pixels in the Sturt Plateau Pastoral District between September and November 2017 (spring composite). Areas with greater than 16% bare soil (threshold %) are mapped in Figure 33
55
PASTORAL LAND BOARD | ANNUAL REPORT 2016-17

The majority of sites were minimally or not grazed at their time of assessment (Table 14). This may be due to all visits occurring prior to the end of September 2017, after which pasture utilisation would be expected to be higher.
There was no evidence of erosion at any site.
Pasture Utilisation
Rank % of sites
No grazing 18
Minimal 65
Moderate 17
Table 14. Levels of pasture utilisation assessed at 23 sites on seven pastoral leases in the Sturt Plateau Pastoral District.
Figure 34. Mean percentage and standard error of measured components of vegetation cover in the ground layer from 23 sites on seven pastoral leases in the Sturt Plateau Pastoral District.
STURT PLATEAU PASTORAL DISTRICT
Site based monitoring
Seven pastoral leases in the Sturt Plateau Pastoral District, comprising 18% of the pastoral lease area, were visited 2017.
Vegetation cover of the ground layer was measured using the point intercept method at 23 sites across the seven leases. Sites, on average, had a good cover of perennial grasses, a moderate amount of litter as would be expected given the predominance of wooded land systems, and a small amount of bare soil (Figure 34). Annual grasses and forbs (both annual and perennial) were minor components of the total ground cover. Perennial grasses are important because they protect the soil surface against wind and water erosion and, where palatable, provide persistent forage to carry livestock through dry times. Litter cover also protects the soil surface, assists infiltration of rain water and helps retain plant seeds in situ.
Land condition ratings assigned at monitoring sites and the more generalised assessment of land condition across those parts of pastoral leases traversed are summarised in Table 15. To the extent possible, these assessments are independent of the average to below-average seasonal quality applying to the general area of each station.
56
PASTORAL LAND BOARD | ANNUAL REPORT 2016-17

Station Condition Rating
Comments about pastoral lease
1 Good: 3 sites
Property generally in ‘Good’ (B) condition with a good cover of palatable perennials and no areas of weeds or significant erosion. The property appears to have been maintained in good condition since the previous monitoring assessment in 2010.
2Good: 2 sites
Fair:1 site
Overall, the lease was generally considered in ‘Good’ (B) condition, which appears to have been maintained since the last monitoring conducted in 2010. Above average rainfall in the 2016-17 wet season prior to the visit, and absence of fire since 2015 contributed to good ground cover across the sites. There was a good diversity and cover of palatable desirable perennial grass species, and few signs of erosion. Vegetation cover across years has generally been maintained >75% across the property, even during the expected fluctuations between the wet and dry season. This is supported by the bare soil time-series and the fractional cover products from satellite imagery. There were small areas of weeds, namely hyptis.
3 Fair: 3 sites
This station was generally considered in ‘Fair’ (C) condition, which appears a slight decrease since the last monitoring conducted in 2010. Anecdotal historical overstocking accompanied with average preceding wet seasons was reflected in the poor pasture recovery this year and a lower than expected proportion of desirable perennial grass species. Current owners have decreased stocking numbers.
4 Good: 2 sitesFair: 1 site
The property was considered generally in ‘Good’ (B) condition, which appears to have been maintained since the last monitoring conducted in 2010. This is consistent with above average rainfall and no fire contributing to high ground cover across all of the sites, and was supported by satellite imagery products. There was a good diversity of palatable desirable perennial grass species, few signs of erosion and there were no significant areas of weeds.
5 Good: 2 sitesFair: 1 site
The property was assessed to be in generally ‘Good’ (B) condition. The north eastern section of the property is still underdeveloped with plans to open the country up to grazing through additional paddocks and water points. Major problem of fires from the property may have been ameliorated this year by the installation of large firebreaks on the adjoining tenure. There was a good diversity of palatable desirable perennial grass species, and no significant signs of erosion.
6 Good: 3 sites
Consistent with most other stations assessed in this district, this property was generally considered in ‘Good’ (B) condition, which appears to have been maintained since the last monitoring conducted in 2011. The recent good wet season was reflected in the pasture recovery. There was a fair diversity of palatable desirable perennial grass species, and no evidence of erosion. There were minimal areas of weed infestations including sida.
7 Good: 4Fair: 1
Overall considered in ‘Good’ (B) condition, which appears to have been maintained since the last monitoring conducted in 2011. The preceding excellent wet season was reflected in the pasture recovery. There was a good diversity of palatable desirable perennial grass species, and minimal signs of significant erosion or weeds.
Table 15. Assessed land condition at integrated monitoring sites and traversed parts of seven pastoral leases in the Sturt Plateau Pastoral District.
STURT PLATEAU PASTORAL DISTRICT
57
PASTORAL LAND BOARD | ANNUAL REPORT 2016-17
ROPER PASTORAL DISTRICT
This Pastoral District encompasses just over 41 820 km2 and includes eleven pastoral leases. The majority of the district experienced well above long term median rainfall, but this was not necessarily reflected in seasonal quality (from AussieGRASS simulation) which was spatially variable across the district.
Most of the district had average to above-average vegetation cover at the end of 2016 dry season, except areas obviously attributed to fire. In total, 27% of the region burnt between October 2016 and September 2017, which was slightly above the 17% of the preceding 12 months. Six integrated monitoring sites were measured as good, three as fair, across six pastoral leases. Another three leases were qualitatively assessed and generally considered as in good land condition for two properties and fair on one other.
Seasonal quality
“Seasonal quality” describes the relative value of recent rainfall in producing forage for livestock. It is judged with reference to the historical record. Two indicators are used: rainfall amount compared with the long-term median and expected pasture growth based on rainfall received, simulated using AussieGRASS (www.longpaddock.qld.gov.au).
Descriptors of seasonal quality provide useful context for interpreting various measures of land condition at particular times. However, to the extent possible, land condition is assessed independently of seasonal conditions.
Rainfall statistics (Table 16) are based on gridded rainfall produced by the Bureau of Meteorology (www.bom.gov.au/jsp/awap/rain/index.jsp). Pixel (grid cell) values are calculated from rainfall amounts at recognised recording stations. Rainfall is from October of one year to September the following year. Modelled pasture growth is for the period November 2016 to April 2017. This growth is ranked as a percentile of the growth for all previous summers.
Table 16. Indicators of seasonal quality. Data spatially averaged for the Roper Pastoral District.
Rainfall (mm) AussieGRASS
2016 - 2017 1078 Growth (kg/ha) 2279
Long term median 796 Percentile 62
Map 5: Location of Roper Pastoral District
58
PASTORAL LAND BOARD | ANNUAL REPORT 2016-17

0 50 100 150 km
Rain
Low: 900mm
Mid: 1200mm
High: 1500mm
ROPER PASTORAL DISTRICT
Spatially averaged 12-month rainfall (October 2016 to September 2017) for the Roper Pastoral District was well above the long-term median (Table 16) with northern areas including Mainoru and Mountain Valley receiving more than 1200 mm (Figure 35, top image).
Despite above-median rainfall (October 2016 to September 2017) across most of the Roper Pastoral District, modelled pasture growth over the last wet season was much below average (Table 16 and Figure 35, bottom image) in the north western parts of the district. The eastern part of the district also had below-average modelled pasture growth.
0 50 100 150 km
Figure 35. Maps of seasonal quality. Top, gridded rainfall, October 2016 to September 2017; Bottom, AussieGRASS-modelled pasture growth for the 2016-17 summer period as a percentage of previous summers.
Spatially interpolated rainfall, October 2016 to September 2017
Simulated summer pasture growth as a percentage of the long-term record
Percen�le Growth
very much below average
much below average
below average
average
above average
much above average
very much above average
59
PASTORAL LAND BOARD | ANNUAL REPORT 2016-17

Figure 36. Monthly area burnt (km2) in the Roper Pastoral District between October 2016 and September 2017
Bare soil dynamics
It is important to maintain adequate ground cover in the latter months of each year to minimise soil loss from wind erosion and intense wet-season storms. It is also important to carry dry feed, and associated ground cover, into the latter months of each calendar year in case there is a late start to the usual wet season and/or monsoonal rains fail more generally.
The amount of bare soil present at any location changes from year to year depending on rainfall and its effectiveness, fire history and amount of grazing. The percentage of bare soil in each 30m square Landsat pixel (900 m2 or 0.09 ha) was used to report the amount of bare soil across all pixels in the Roper Pastoral District.
Much of the western half of the pastoral district had above average vegetation cover in late 2017 (spring composite), and considerable parts of the eastern half had average cover (Figure 37) which may be due to confounding interactions with timing and incidence of fire over time.
The bare soil threshold for each pastoral district was based on the frequency distribution of all 30m Landsat bare soil fractional ground cover pixels at the end of 2017 (spring composite). A threshold was determined which represents 75% of a district’s overall bare soil. The remaining 25% is considered to have above-threshold bare soil.
ROPER PASTORAL DISTRICT
Fire
The North Australian Fire Information website (www.firenorth.org.au/nafi3) reports that 11 218 km2 (26.8% of the district) burnt between October 2016 and September 2017. This was similar to the 17% of the pastoral district burnt during the 2015-16 reporting period and considerably less than the 74% of the pastoral district burnt between October 2014 and September 2015. Peak fire activity was in May 2017, which may have been due to controlled burning for wildfire mitigation.
60
PASTORAL LAND BOARD | ANNUAL REPORT 2016-17

Figure 37. Rank of the amount of remotely-sensed vegetation cover present from September to November 2017 (spring composite) against the average cover since 1988. Diagonal lines show those areas burnt between January and November 2017.
ROPER PASTORAL DISTRICT
The 75% threshold bare soil value for the Roper Pastoral District equates to 21% actual bare soil of a Landsat Fractional Ground Cover pixel (Figure 38). Bare soil pixel values above 21% are considered to be above the 75% cumulative frequency threshold and are shown in Figure 39. In this example they include some areas burnt earlier in 2017, however significant areas with elevated bare soil were not burnt in 2017, particularly in the south-eastern part of the pastoral district. Just over one third of the Roper Pastoral District had minor amounts of bare soil (< 10% of the 30m Landsat pixel) towards the end of 2017 (Figure 38).
Figure 38. Percentage cumulative frequency of varying levels of bare soil in 30m square Landsat pixels in the Roper Pastoral District between September and November 2017 (spring composite). Areas with greater than 21% bare soil are mapped in Figure 39.
61
PASTORAL LAND BOARD | ANNUAL REPORT 2016-17

Figure 39. Parts of the Roper Pastoral District having more than 21% bare soil per Landsat pixel in late 2017. Areas burnt between January and November 2017 shown with diagonal lines. Note that the threshold level of bare soil used for mapping purposes varies between pastoral districts. It is selected to show at what level approximately 25% of the district is affected.
ROPER PASTORAL DISTRICT
Site based monitoring
Nine pastoral leases in the Roper Pastoral District, comprising 72% of the pastoral lease area, were visited in the latter part of 2016 and during 2017.
Vegetation cover of the ground layer was measured using the point intercept method at nine sites across six of the leases visited; the averaged components of cover are shown in Figure 40. One site corresponding to one property had considerably higher bare soil (32%) compared to the average across sites.
Land condition was also qualitatively assessed across the other three pastoral leases.
Perennial grasses are important in the Roper region because they protect the soil surface against wind and water erosion and, where palatable, provide persistent forage to carry livestock through dry times. Litter cover also protects the soil surface, assists infiltration of rain water and helps retain plant seeds in situ.
62
PASTORAL LAND BOARD | ANNUAL REPORT 2016-17

ROPER PASTORAL DISTRICT
Two-thirds of sites were minimally grazed with the other third moderate to heavy utilisation. There was no evidence of erosion at any integrated monitoring site.
Table 17. Levels of pasture utilisation recorded at nine sites on six pastoral leases in the Roper Pastoral District.
Figure 40. Mean percentage and standard error of measured components of vegetation cover in the ground layer from the Roper Pastoral District.
Pasture Utilisation
Rank % of sites
No grazing 0
Minimal 67
Moderate 22
Moderate to heavy 11
Heavy 0
Land condition ratings assigned at monitoring sites and the more generalised assessment of land condition across those parts of pastoral leases traversed are summarised in Table 17. To the extent possible, these assessments are independent of the variable seasonal quality across the Roper Pastoral District during 2016-17 (described above).
63
PASTORAL LAND BOARD | ANNUAL REPORT 2016-17

Station Condition Rating
Comments with regard to pastoral lease
1 Fair: 1 site
Areas east and north east of the homestead that could be reached were dominated by black spear grass and grader grass with hyptis infilling. Pastorally productive areas were limited to riparian buffers and undulating braided channels that are grazed by buffalo all year long. Areas to the north-west received greater rainfall, have less grazing pressure but were subject to more fires. Parkinsonia occurred on some alluvial flats with noogoora burr. Approximately 25% of the property is fenced and utilised. When monitoring started in 1998, grader grass was already present in large areas.
2 General fair
This property was generally considered in ‘Fair’ (C) condition, which appears to have been maintained since the last monitoring conducted in 2011. This is not consistent with above average seasonal conditions and low fire activity which are conducive to increased pasture establishment and growth. There was a fair diversity of palatable desirable perennial grass species, and some signs of erosion. There were large areas of weeds, which were not actively being controlled. Overall, much of the property showed lowered production potential due to the reduced proportion of dense, healthy, desirable perennial pasture species, reduced overall vegetation ground cover and the dominance of low productivity grasses in many areas.
3 Good: 1 site
This property has maintained its ‘Good’ (B) rating since the last monitoring visit conducted in 2011, and generally retained vegetation cover, even during the expected fluctuations between the wet and dry season. There was a reasonable cover of palatable perennials and annuals, although non palatable perennial and annual grasses dominated in some areas, suggesting a history of high grazing pressure and/or other disturbance.
4 General Good
This property was considered to be in ‘Good’ (B) condition, which has been maintained since the last monitoring conducted in 2011. There was a good diversity of palatable desirable perennial grass species, and few signs of erosion. There were no observed areas of weeds.
5 Good: 2 sites
This station was assessed to be in ‘Good’ (B) condition, it has maintained this condition since the last monitoring conducted in 2011. This is consistent with good seasonal conditions and minimal fire contributing to good ground cover and desirable species mix including golden beard grass and silky browntop. The property has maintained 65% vegetation cover, even during the expected fluctuations between the wet and dry season, supported by the bare soil time-series and the fractional cover products from satellite imagery.
6 General Good
The property, in general, was assessed to be in ‘Good’ (B) condition with vegetation and litter providing good ground cover. There was a diversity of palatable perennial and annual grass species present across the property, although some areas were dominated by less desirable ‘increaser’ species. There were only a few signs of active erosion and no significant areas of weeds.
Table 18. Assessed land condition at integrated monitoring sites and traversed parts of nine pastoral leases in the Roper Pastoral District.
ROPER PASTORAL DISTRICT
64
PASTORAL LAND BOARD | ANNUAL REPORT 2016-17

Station Condition Rating
Comments with regard to pastoral lease
7 Good: 1 site
This property was generally considered to be in ‘Good’ (B) condition, which appears to be maintained since the last monitoring conducted in 2011. There was a good diversity of palatable desirable perennial grass species, and few signs of erosion. There were small areas of weeds, including grader grass, which were not being actively controlled but are intended for future control.
8 Fair: 2 sites
This property experienced average to below-average levels of rainfall in the previous wet season, and was assessed to be in overall ‘Fair’ (C) condition. Perennial grasses and litter were generally providing reasonable ground cover. Weeds and erosion, although present, did not dominate in any area of the property. Some parts of the station showed evidence of sustained heavy grazing, such as dominance by the increaser species black spear grass and reduced ground cover. There were also a few areas that had apparently received lower grazing pressure, with good cover of perennial grasses and infill of annuals and less bare ground. These areas were considered to be in ‘Good’ (B) condition.
9 Good: 2 sites
Large parts of the station appear to have received minimal recent utilisation and had high cover of perennial grasses, good infill of annuals, and low levels of bare ground. However, other parts showed evidence of sustained heavy grazing, such as dominance by the increaser species black spear grass and reduced ground cover. Weeds and erosion, although present, did not dominate in any area of the property.
ROPER PASTORAL DISTRICT
65
PASTORAL LAND BOARD | ANNUAL REPORT 2016-17

GULF PASTORAL DISTRICT
The Gulf Pastoral District encompasses more than 92 546 km2 and includes 16 pastoral leases.
The Gulf coastal area experienced poor seasonal quality based on AussieGRASS-modelled pasture growth. Seasonal conditions were closer to, or above, the long-term average through the rest of the pastoral district and significantly above-average bordering the Barkly Pastoral District to the south. Fire is a feature of this savannah region with nearly 20% of the district burnt between October 2016 and September 2017. Areas of much reduced vegetation cover, as monitored with remote sensing, were scattered throughout the district – and were not always associated with recent fire. One quarter of the region had more than 22% bare soil per Landsat pixel later in the 2017 dry season, mostly in the central and south-eastern parts of the district. Two of four sites across two leases were rated in good condition with the other two sites in fair condition.
Seasonal quality
“Seasonal quality” describes the relative value of recent rainfall in producing forage for livestock. It is judged with reference to the historical record. Two indicators are used: rainfall amount compared with the long-term median and expected pasture growth based on rainfall received, simulated using AussieGRASS (www.longpaddock.qld.gov.au).
Descriptors of seasonal quality provide useful context for interpreting various measures of land condition at particular times. However, to the extent possible, land condition is assessed independently of seasonal conditions.
Rainfall statistics (Table 19) are based on gridded rainfall produced by the Bureau of Meteorology (www.bom.gov.au/jsp/awap/rain/index.jsp). Pixel (grid cell) values are calculated from rainfall amounts at recognised recording stations. Rainfall is from October of one year to September the following year. Modelled pasture growth is for the period November 2016 to April 2017. This growth is ranked as a percentile of the growth for all previous summers.
Table 19. Indicators of seasonal quality. Data spatially averaged for the Gulf Pastoral District.
Rainfall (mm) AussieGRASS
2016 - 2017 991 Growth (kg/ha) 2269
Long term median 664 Percentile 65
Spatially averaged rainfall for the Gulf Pastoral District was above the long-term median (Table 19) with most pastoral leases receiving at least average annual rainfall. Rainfall increased from south to north, with areas including Manangoora and McArthur River receiving more than 1200 mm.
Map 6: Location of Gulf Pastoral District
66
PASTORAL LAND BOARD | ANNUAL REPORT 2016-17

0 50 100 150 200 km
0 50 100 150 200 km
Rain
Low: 800mm
Mid: 1000mm
High: 1300mm
GULF PASTORAL DISTRICT
Modelled pasture growth over the last wet season, as a percentage of the long-term record, was much below the long-term average adjacent to the Gulf coast even though the area received above-average rainfall (Figure 41, top image). Further inland, wet-season growth ranked as mainly average to above-average, except adjacent to the Barkly Pastoral District in the south where modelled growth was very much above average despite only receiving average rainfall.
Figure 41. Maps of seasonal quality. Top, rainfall, October 2016 to September 2017; Bottom, AussieGRASS-modelled pasture growth for the 2016-17 summer period as a percentage of previous summers.
Spatially interpolated rainfall October 2016 to September 2017
Simulated summer pasture growth as a percentage of the long term
record
Percen�le Growth
very much below average
much below average
below average
average
above average
much above average
very much above average
67
PASTORAL LAND BOARD | ANNUAL REPORT 2016-17
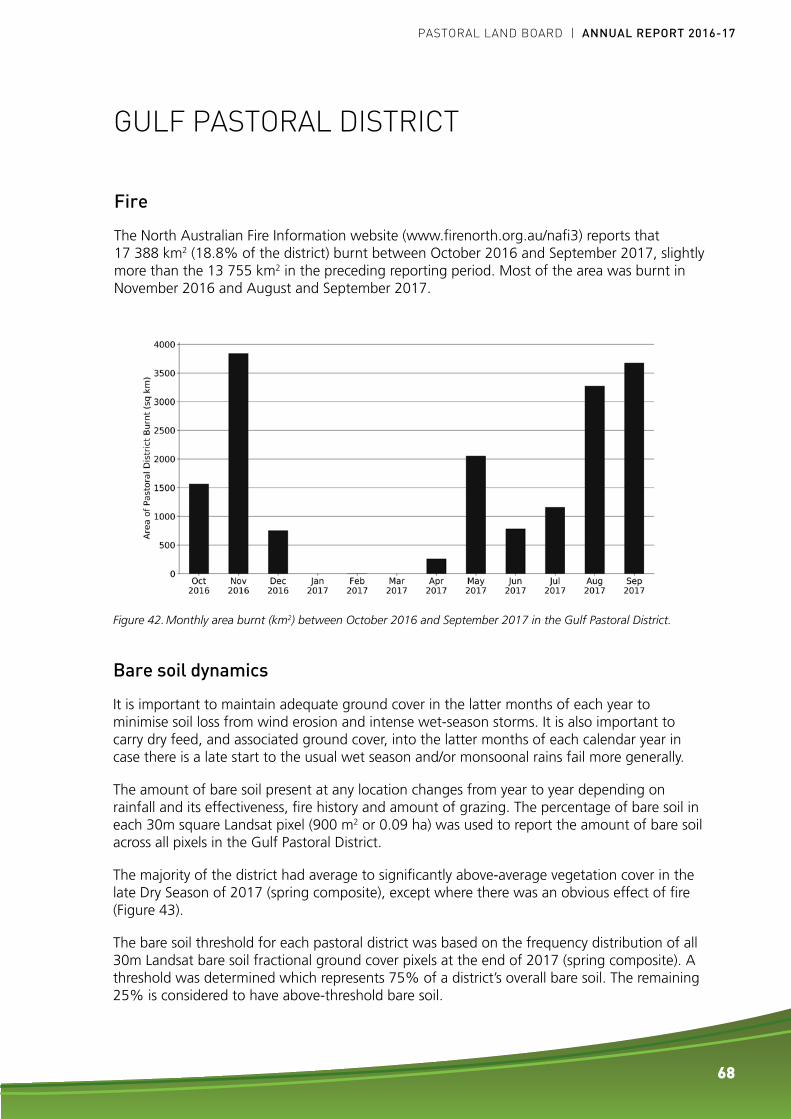
Figure 42. Monthly area burnt (km2) between October 2016 and September 2017 in the Gulf Pastoral District.
Bare soil dynamics
It is important to maintain adequate ground cover in the latter months of each year to minimise soil loss from wind erosion and intense wet-season storms. It is also important to carry dry feed, and associated ground cover, into the latter months of each calendar year in case there is a late start to the usual wet season and/or monsoonal rains fail more generally.
The amount of bare soil present at any location changes from year to year depending on rainfall and its effectiveness, fire history and amount of grazing. The percentage of bare soil in each 30m square Landsat pixel (900 m2 or 0.09 ha) was used to report the amount of bare soil across all pixels in the Gulf Pastoral District.
The majority of the district had average to significantly above-average vegetation cover in the late Dry Season of 2017 (spring composite), except where there was an obvious effect of fire (Figure 43).
The bare soil threshold for each pastoral district was based on the frequency distribution of all 30m Landsat bare soil fractional ground cover pixels at the end of 2017 (spring composite). A threshold was determined which represents 75% of a district’s overall bare soil. The remaining 25% is considered to have above-threshold bare soil.
GULF PASTORAL DISTRICT
Fire
The North Australian Fire Information website (www.firenorth.org.au/nafi3) reports that 17 388 km2 (18.8% of the district) burnt between October 2016 and September 2017, slightly more than the 13 755 km2 in the preceding reporting period. Most of the area was burnt in November 2016 and August and September 2017.
68
PASTORAL LAND BOARD | ANNUAL REPORT 2016-17

Approximately 32% of the pastoral district had minor amounts of bare soil (< 10% of the 30m Landsat pixel) towards the end of 2017 (Figure 44). Almost one quarter of the region had > 22% bare soil (area mapped in Figure 45). This includes some areas burnt earlier in 2017. However, there were some areas in the south-west with elevated areas of bare soil which were not affected by fire in 2017.
Figure 43. Rank of the amount of remotely-sensed vegetation cover present from September to November 2017 (spring composite) against that for previous years back to 1988. Hatched lines indicate fire.
Figure 44. Percentage cumulative frequency of varying levels of bare soil in 30m square Landsat pixels in the Gulf Pastoral District between September and November 2017 (spring composite). Areas with greater than 22% bare soil are mapped in Figure 45.
GULF PASTORAL DISTRICT
69
PASTORAL LAND BOARD | ANNUAL REPORT 2016-17

Figure 45. Parts of the Gulf Pastoral District having more than 22% bare soil per Landsat pixel in late 2017. Areas burnt between January and November 2017 shown with diagonal lines. Note that the threshold level of bare soil used for mapping purposes varies between pastoral districts. It is selected to show at what level approximately 25% of the district is affected.
Site based monitoring
Two pastoral leases in the Gulf Pastoral District, comprising 12% of the pastoral lease area, were visited during late 2016 and 2017.
Vegetation cover of the ground layer was measured using the point intercept method at four sites across the two leases. Sites, on average, had a small amount of bare soil, good litter cover as may be expected with more timbered land systems in the north, and moderate cover of perennial grasses (Figure 46). However there was variation between the two leases with one lease with a single site having no perennial grasses and 58% annual grass. Perennial grasses are important in the Gulf country because they protect the soil surface against wind and water erosion and, where palatable, provide persistent forage to carry livestock through dry times. Litter cover also protects the soil surface, assists infiltration of rain water and helps retain plant seeds in situ.
GULF PASTORAL DISTRICT
70
PASTORAL LAND BOARD | ANNUAL REPORT 2016-17

Each of the four measured sites had a different rank of pasture utilisation (Table 20). This is unlikely to be representative of the distribution of pasture utilisation across the district.
There was no evidence of erosion recorded at any of the sites in the region.
Pasture Utilisation
Rank % of sites
No grazing 25
Minimal 25
Moderate 25
Moderate to heavy 25
Heavy 0
Table 20. Levels of pasture utilisation recorded at four sites on two pastoral leases in the Gulf Pastoral District.
Figure 46. Mean percentage and standard error of measured components of vegetation cover in the ground layer from four sites on two pastoral leases in the Gulf Pastoral District.
Land condition ratings assigned at monitoring sites and the more generalised assessment of land condition across those parts of pastoral leases traversed are summarised in Table 21.
GULF PASTORAL DISTRICT
71
PASTORAL LAND BOARD | ANNUAL REPORT 2016-17

Station Condition Rating
Comments with regard to pastoral lease
1 Fair: 1 site
Approximately 50% of the property could not be accessed due to area not developed, or tracks not maintained. General condition of assessed areas was ‘Fair’ (C) condition with the more productive country associated with alluvial areas between channels. It is likely that historically high grazing pressure has degraded areas of the property whilst other rested areas show increasing condition.
2Good: 2 sites
Fair: 1 site
The property, in general, was assessed to be in Good condition with some paddocks rated in ‘Fair’ (C) condition. Vegetation and litter were providing good ground cover and there was a diversity of palatable perennial and annual grass species present across the property. Rubber bush is present in some areas of the southern part of the property and appears to be effectively controlled. Management have in place plans for intensive cell grazing combined with wet season spelling and have implemented an extensive infrastructure plan.
Table 21. Assessed land condition at monitoring sites and traversed parts of two pastoral leases in the Gulf Pastoral District.
GULF PASTORAL DISTRICT
72
PASTORAL LAND BOARD | ANNUAL REPORT 2016-17

BARKLY PASTORAL DISTRICT
The Barkly Pastoral District encompasses 133 494 km2 and includes 32 pastoral leases making this the largest of the eleven pastoral districts.
Seasonal quality, based on expected pasture growth, was significantly above average to average across much of the pastoral district especially throughout the central Barkly. This was generally consistent with analysis of Landsat imagery for the late dry-season of 2017 which showed that parts of the region had above-average to highest levels of vegetation cover recorded since 1988 (the start of the Landsat record used for monitoring land condition). One quarter of the district had > 36% bare soil (per Landsat pixel) in the late dry season, mainly in the south-east. Less than 5% of the district burnt over the reporting period, with the majority of this
occurring in August and September 2017. Thirteen pastoral leases were visited where 53 of 122 sites were rated in Good condition, 58 in Fair condition and the remaining 11 in Poor condition.
Seasonal quality
“Seasonal quality” describes the relative value of recent rainfall in producing forage for livestock. It is judged with reference to the historical record. Two indicators are used: rainfall amount compared with the long-term median and expected pasture growth based on the rainfall received, simulated using AussieGRASS (www.longpaddock.qld.gov.au).
Descriptors of seasonal quality provide useful context for interpreting various measures of land condition at particular times. However, to the extent possible, land condition is assessed independently of seasonal conditions.
Rainfall statistics (Table 22) are based on gridded rainfall produced by the Bureau of Meteorology (www.bom.gov.au/jsp/awap/rain/index.jsp). Pixel (grid cell) values are calculated from rainfall amounts at recognised recording stations. Rainfall is from October of one year to September the following year. Due to the considerable north-south transition in long-term median rainfall for this large pastoral district, rainfall statistics are reported based on an arbitrary split of the region into two sub-districts (Figure 47).
Table 22. Recent seasonal quality for the Barkly Pastoral District as indicated by spatially averaged rainfall relative to the long-term median.
Rainfall (mm) Barkly North Barkly South
2016 - 2017 701 477
Long term median 429 305
Map 7: Location of Barkly Pastoral District
73
PASTORAL LAND BOARD | ANNUAL REPORT 2016-17

BARKLY PASTORAL DISTRICT
0 50 100 150 200 km
Barkly North
Barkly South
Rain
Low: 250mm
Mid: 500mm
High: 770mm
Figure 47. Spatially interpolated, gridded rainfall for the Barkly Pastoral District for October 2016 to September 2017.
AussieGRASS-modelled pasture growth, as a second indicator of seasonal quality for the entire Barkly region, is for the period November 2016 to April 2017. This growth is ranked as a percentile of the growth for all previous summers. In this case, spatially-averaged growth through the 2016-17 wet season was ~1580 kg/ha which was considerably above the long-term median (Table 23).
Spatially averaged rainfall for the northern and southern sections of the Barkly Pastoral District was considerably above the long-term median (Table 18). Twelve-month rainfall was lower in the far south east (Lake Nash, Burramurra, Austral Downs and Georgina Downs), in line with the increasing aridity of this part of the Barkly region.
74
PASTORAL LAND BOARD | ANNUAL REPORT 2016-17

Table 23. Recent seasonal quality averaged across the entire Barkly Pastoral District, as indicated by modelled pasture growth.
Index of seasonal quality Barkly Pastoral District
Growth (kg/ha) 1578
Percentile 85
Modelled pasture growth over the 2016-17 wet season, as a percentage of the long-term record, was above average to very much above average across much of the pastoral district (Figure 48).
BARKLY PASTORAL DISTRICT
0 50 100 150 200 km
Figure 48. Simulated pasture growth for the 2016-17 wet season as a percentage of the long-term record.
Percen�le Growth
very much below average
much below average
below average
average
above average
much above average
very much above average
75
PASTORAL LAND BOARD | ANNUAL REPORT 2016-17

Bare Soil Dynamics
It is important to maintain adequate ground cover in the latter months of each year to minimise soil loss from wind erosion and intense summer storms. It is also important to carry dry feed, and associated ground cover, into the latter months of each calendar year in case there is a late start to the usual wet season and/or monsoonal rains fail more generally.
The amount of bare soil present at any location changes from year to year depending on rainfall and its effectiveness, fire history and amount of grazing. The percentage of bare soil in each 30m square Landsat pixel (900 m2 or 0.09 ha) was used to report the amount of bare soil across all pixels in the Barkly Pastoral District.
Corresponding with indicators of seasonal quality mapped in Figure 47 and Figure 48, parts of the north-western and central Barkly Pastoral District had above-average to highest levels of vegetation cover recorded since 1988 (Figure 50). However, relatively small and scattered areas of reduced vegetation cover (increased bare soil) occurred throughout the south-east of the district, consistent with the lower rainfall.
BARKLY PASTORAL DISTRICT
Figure 49. Monthly area burnt (km2) in the Barkly Pastoral District between October 2016 and September 2017.
Fire
The North Australian Fire Information website (www.firenorth.org.au/nafi3) reports that 5 448 km2 (4.1% of the Barkly Pastoral District) burnt between October 2016 and September 2017 mostly in late 2017. Wildfire was much more extensive in the Barkly Pastoral District in 2011 and 2012 with 17% and 20% of the region burning in each year, respectively.
76
PASTORAL LAND BOARD | ANNUAL REPORT 2016-17
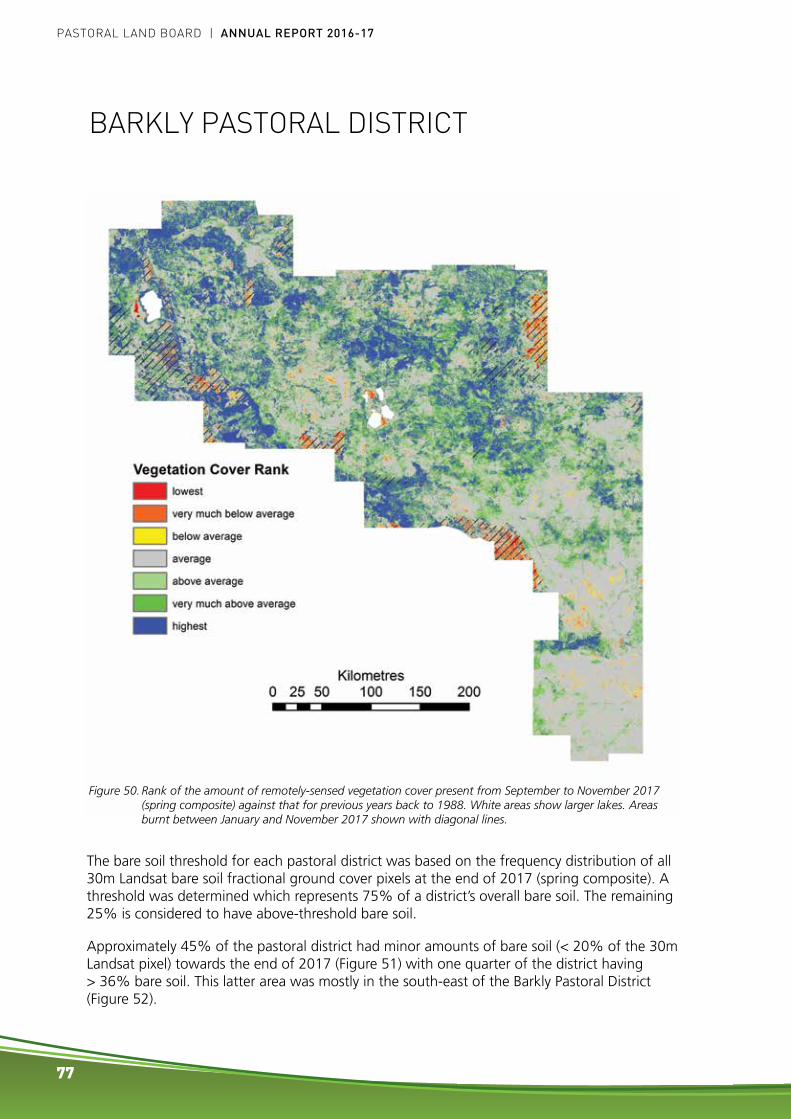
Figure 50. Rank of the amount of remotely-sensed vegetation cover present from September to November 2017 (spring composite) against that for previous years back to 1988. White areas show larger lakes. Areas burnt between January and November 2017 shown with diagonal lines.
BARKLY PASTORAL DISTRICT
The bare soil threshold for each pastoral district was based on the frequency distribution of all 30m Landsat bare soil fractional ground cover pixels at the end of 2017 (spring composite). A threshold was determined which represents 75% of a district’s overall bare soil. The remaining 25% is considered to have above-threshold bare soil.
Approximately 45% of the pastoral district had minor amounts of bare soil (< 20% of the 30m Landsat pixel) towards the end of 2017 (Figure 51) with one quarter of the district having > 36% bare soil. This latter area was mostly in the south-east of the Barkly Pastoral District (Figure 52).
77
PASTORAL LAND BOARD | ANNUAL REPORT 2016-17
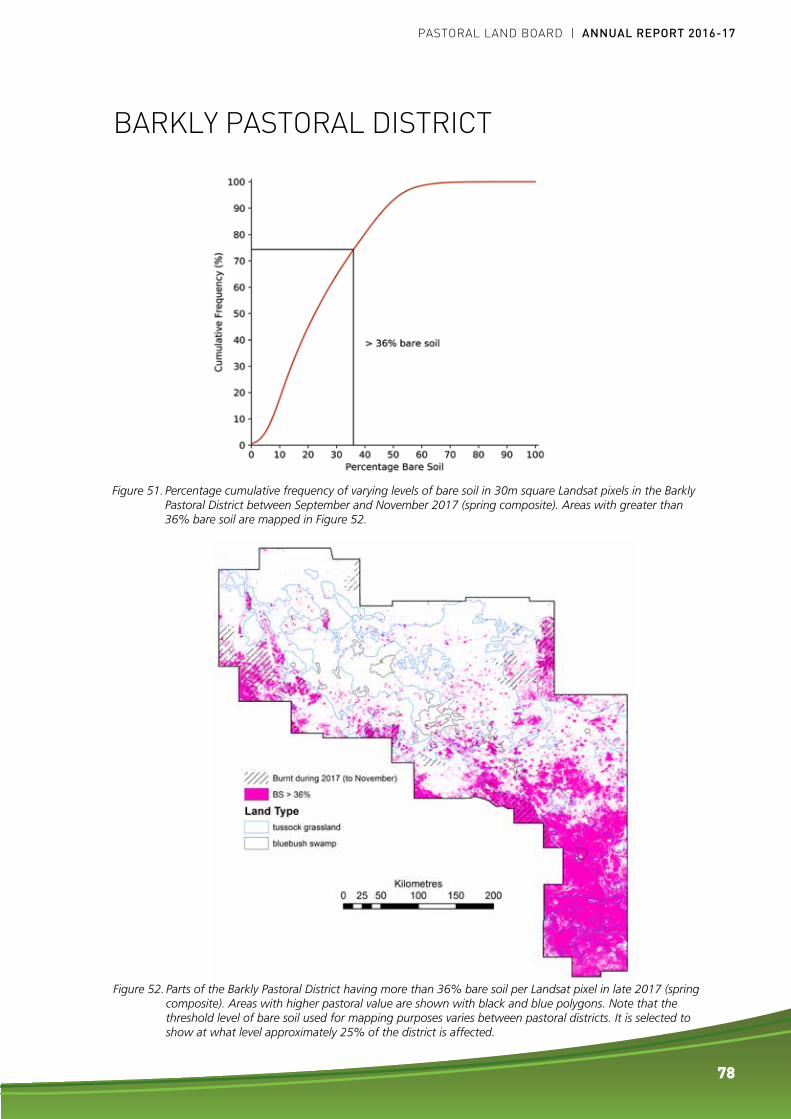
Figure 51. Percentage cumulative frequency of varying levels of bare soil in 30m square Landsat pixels in the Barkly Pastoral District between September and November 2017 (spring composite). Areas with greater than 36% bare soil are mapped in Figure 52.
Figure 52. Parts of the Barkly Pastoral District having more than 36% bare soil per Landsat pixel in late 2017 (spring composite). Areas with higher pastoral value are shown with black and blue polygons. Note that the threshold level of bare soil used for mapping purposes varies between pastoral districts. It is selected to show at what level approximately 25% of the district is affected.
BARKLY PASTORAL DISTRICT
78
PASTORAL LAND BOARD | ANNUAL REPORT 2016-17

Pasture Utilisation
Rank % of sites
No grazing 11
Minimal 74
Moderate 8
Moderate to heavy 5
Heavy 2
Table 24. Levels of pasture utilisation recorded at 122 sites on 13 pastoral leases in the Barkly Pastoral District.
Figure 53. Mean percentage and standard error of measured components of vegetation cover in the ground layer from 122 sites on 13 pastoral leases in the Barkly Pastoral District.
Most sites were minimally grazed (Table 24), although this assessment is partly dependent on the time at which a lease is visited relative to the end of the growing season; later assessments may mean increased levels of pasture utilisation.
There was slight or moderate erosion recorded at only three of the 122 sites.
Site based monitoring
Thirteen pastoral leases, comprising 37% of the pastoral lease area for the Barkly Pastoral District, were visited during 2017.
Vegetation cover of the ground layer was measured using the point intercept method at 122 sites across the 13 leases. Sites, on average, only had a moderate cover of perennial grasses, largely due to the predominance of Mitchell grasses in this district, with distinct between-tussock spaces as the dry season progressed, a lesser contribution of annual grasses, minor forbs and reasonable litter cover (Figure 53). Bare soil comprised about one-quarter of the 1ha site area, on average. Perennial grasses are particularly important on the Mitchell grass downs as the mainstay of the grazing industry. They also protect the soil surface against wind and water erosion and, where sufficiently dense, provide competition against invasive woody species such as parkinsonia and rubber bush. Litter cover also protects the soil surface, assists infiltration of rain water and helps retain plant seeds in situ.
BARKLY PASTORAL DISTRICT
79
PASTORAL LAND BOARD | ANNUAL REPORT 2016-17

Land condition ratings assigned at monitoring sites and the more generalised assessment of land condition across those parts of pastoral leases traversed are summarised in Table 4. The 13 stations experienced above-average to significantly above-average seasonal quality, based on 12-month rainfall (to September 2017) and modelled wet-season pasture growth.
BARKLY PASTORAL DISTRICT
Station Condition Rating
Comments with regard to pastoral lease
1Good: 6 sitesFair: 8 sites
The station was assessed as being variable in land condition (both within and between paddocks). Tussock density of palatable perennial grasses was not high enough to support an overall land condition assessment of ‘Good’ (B) condition. The majority (59%) of land condition assessments were rated in ‘Fair’ (C) condition. More sites were in ‘Good’ (B) condition in the 2017 Inspection. Whilst rainfall was average to above average, the timing influenced the less than normal pasture growth.
2Good: 1 siteFair: 4 sites
The northern portion of the station was easily accessed and was found to be generally in ‘Fair’ (C) condition with an average response of palatable perennial grasses. There was evidence of weed species found on the property and no areas of major erosion. The southern desert portion was not assessed and no comment is made on its’ condition.
3Good: 2 sitesFair: 3 sites
The station was generally considered in ‘Fair’ (C) condition, which appears to have been maintained since the last monitoring conducted in 2009. Recent poor wet seasons were reflected in the pasture recovery. There was a fair diversity of palatable desirable perennial grass species, and minimal signs of erosion. There were areas of weed infestation that had been controlled including prickly acacia and parkinsonia.
4Good: 2 sitesFair: 3 sites
Monitoring sites and other observations indicated that the lease was in ‘Good’ (B) to ‘Fair’ (C) condition. All monitoring sites were located within open Mitchell grassland (Barkly land systems) in which tussock density is an important indicator of land condition. Areas in ‘Good’ (B) condition had an even and continuous distribution of perennial Mitchell grass tussocks. Areas rated in ‘Fair’ (C) condition had an uneven distribution of Mitchell grass tussocks and, in places, higher than expected densities of low-value increaser pasture species. Despite above average rainfall in the summer period preceding this visit, palatable annual Flinders grass provided only sparse infill of inter-tussock spaces at most monitoring sites.
5Good: 9 sitesFair: 8 sitesPoor: 1 site
Mitchell grass plains in the western and south-central parts of the station were generally in ‘Fair’ (C) to ‘Good’ (B) condition, with a reasonable cover of robust Mitchell grass but often large spaces between tussocks. Mitchell grass plains and Mitchell grass / silky browntop grassland in the north-central part of the station were generally in ‘Good’ (B) condition, with good cover and distribution of palatable perennial grasses. The central/eastern paddocks were generally in ‘Fair’ (C) condition, with a reasonable cover of robust Mitchell grass but often large spaces between tussocks.
6Good: 1 siteFair: 1 sitesPoor: 2 sites
Large parts of the Mitchell grass plains in the north east of the lease were in ‘Poor’ (D) condition, with a sparse distribution of Mitchell grass and often a large amount of bare ground. However, there were also some areas in ‘Fair’ (C) condition, with a better, if still somewhat sparse, distribution of Mitchell grass (south and west of the lease).
Table 25. Assessed land condition at monitoring sites and traversed parts of 13 pastoral leases in the Barkly Pastoral District.
80
PASTORAL LAND BOARD | ANNUAL REPORT 2016-17
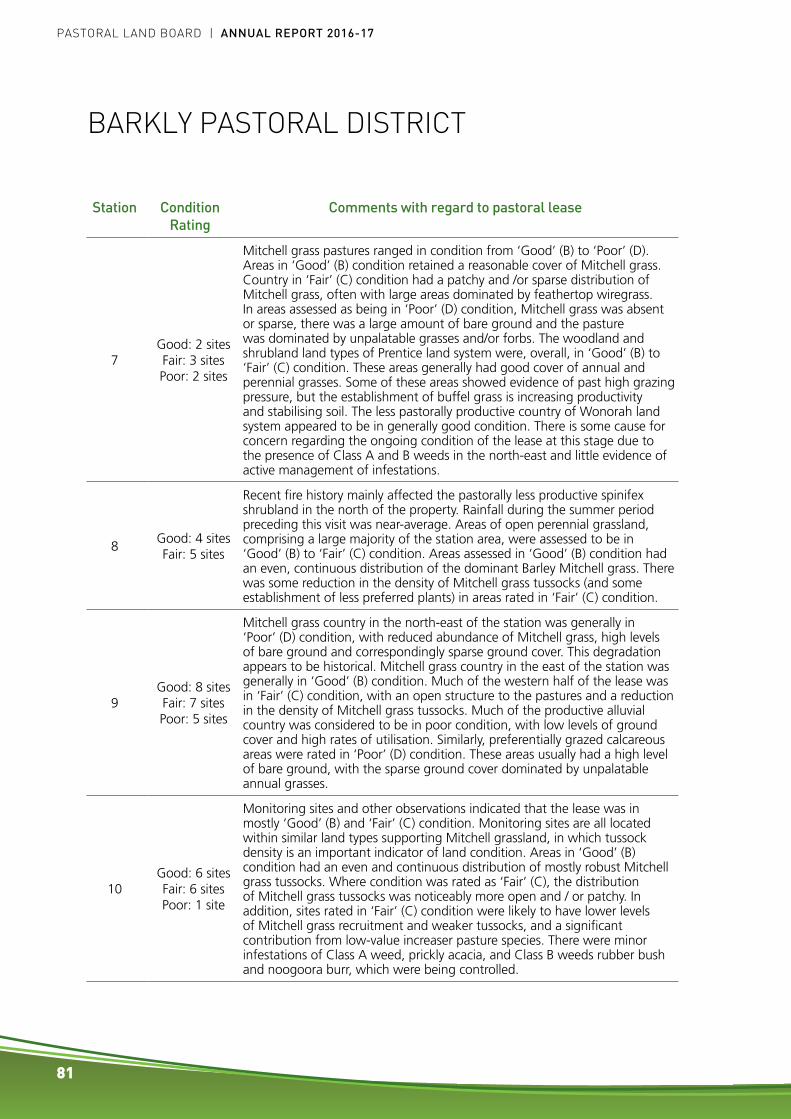
Station Condition Rating
Comments with regard to pastoral lease
7Good: 2 sites Fair: 3 sitesPoor: 2 sites
Mitchell grass pastures ranged in condition from ‘Good’ (B) to ‘Poor’ (D). Areas in ‘Good’ (B) condition retained a reasonable cover of Mitchell grass. Country in ‘Fair’ (C) condition had a patchy and /or sparse distribution of Mitchell grass, often with large areas dominated by feathertop wiregrass. In areas assessed as being in ‘Poor’ (D) condition, Mitchell grass was absent or sparse, there was a large amount of bare ground and the pasture was dominated by unpalatable grasses and/or forbs. The woodland and shrubland land types of Prentice land system were, overall, in ‘Good’ (B) to ‘Fair’ (C) condition. These areas generally had good cover of annual and perennial grasses. Some of these areas showed evidence of past high grazing pressure, but the establishment of buffel grass is increasing productivity and stabilising soil. The less pastorally productive country of Wonorah land system appeared to be in generally good condition. There is some cause for concern regarding the ongoing condition of the lease at this stage due to the presence of Class A and B weeds in the north-east and little evidence of active management of infestations.
8Good: 4 sitesFair: 5 sites
Recent fire history mainly affected the pastorally less productive spinifex shrubland in the north of the property. Rainfall during the summer period preceding this visit was near-average. Areas of open perennial grassland, comprising a large majority of the station area, were assessed to be in ‘Good’ (B) to ‘Fair’ (C) condition. Areas assessed in ‘Good’ (B) condition had an even, continuous distribution of the dominant Barley Mitchell grass. There was some reduction in the density of Mitchell grass tussocks (and some establishment of less preferred plants) in areas rated in ‘Fair’ (C) condition.
9Good: 8 sitesFair: 7 sitesPoor: 5 sites
Mitchell grass country in the north-east of the station was generally in ‘Poor’ (D) condition, with reduced abundance of Mitchell grass, high levels of bare ground and correspondingly sparse ground cover. This degradation appears to be historical. Mitchell grass country in the east of the station was generally in ‘Good’ (B) condition. Much of the western half of the lease was in ‘Fair’ (C) condition, with an open structure to the pastures and a reduction in the density of Mitchell grass tussocks. Much of the productive alluvial country was considered to be in poor condition, with low levels of ground cover and high rates of utilisation. Similarly, preferentially grazed calcareous areas were rated in ‘Poor’ (D) condition. These areas usually had a high level of bare ground, with the sparse ground cover dominated by unpalatable annual grasses.
10Good: 6 sitesFair: 6 sitesPoor: 1 site
Monitoring sites and other observations indicated that the lease was in mostly ‘Good’ (B) and ‘Fair’ (C) condition. Monitoring sites are all located within similar land types supporting Mitchell grassland, in which tussock density is an important indicator of land condition. Areas in ‘Good’ (B) condition had an even and continuous distribution of mostly robust Mitchell grass tussocks. Where condition was rated as ‘Fair’ (C), the distribution of Mitchell grass tussocks was noticeably more open and / or patchy. In addition, sites rated in ‘Fair’ (C) condition were likely to have lower levels of Mitchell grass recruitment and weaker tussocks, and a significant contribution from low-value increaser pasture species. There were minor infestations of Class A weed, prickly acacia, and Class B weeds rubber bush and noogoora burr, which were being controlled.
BARKLY PASTORAL DISTRICT
81
PASTORAL LAND BOARD | ANNUAL REPORT 2016-17
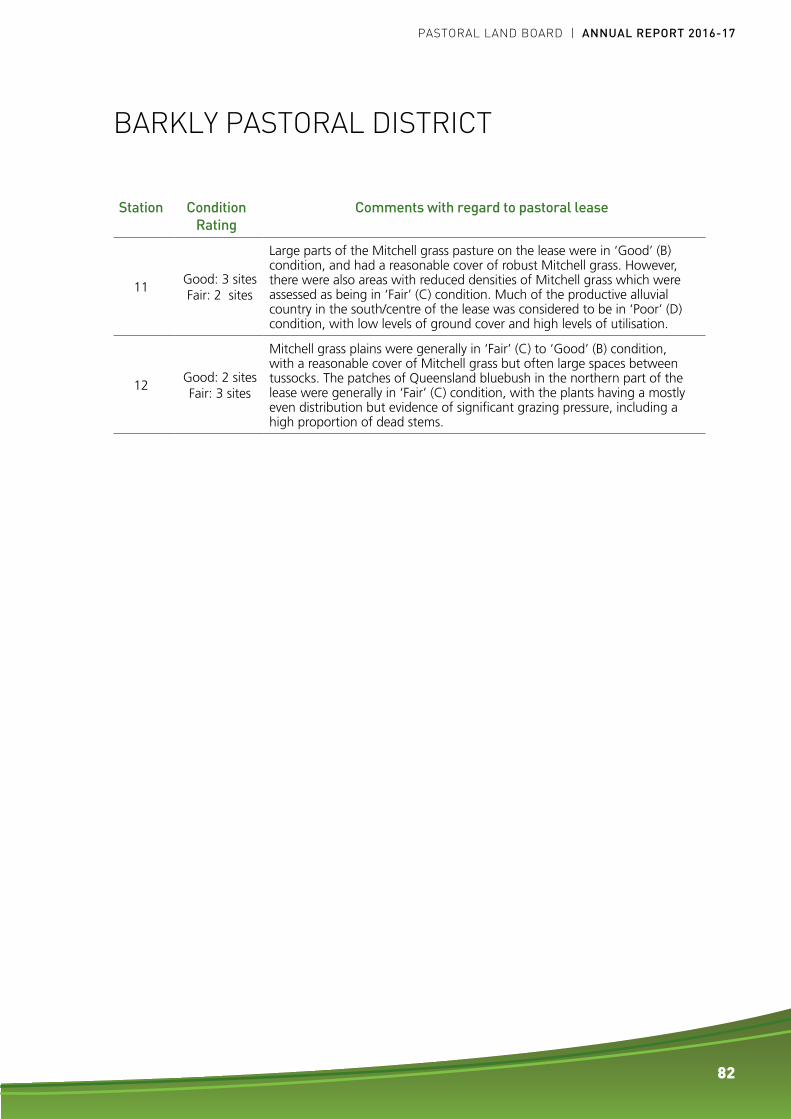
BARKLY PASTORAL DISTRICT
Station Condition Rating
Comments with regard to pastoral lease
11Good: 3 sites Fair: 2 sites
Large parts of the Mitchell grass pasture on the lease were in ‘Good’ (B) condition, and had a reasonable cover of robust Mitchell grass. However, there were also areas with reduced densities of Mitchell grass which were assessed as being in ‘Fair’ (C) condition. Much of the productive alluvial country in the south/centre of the lease was considered to be in ‘Poor’ (D) condition, with low levels of ground cover and high levels of utilisation.
12Good: 2 sitesFair: 3 sites
Mitchell grass plains were generally in ‘Fair’ (C) to ‘Good’ (B) condition, with a reasonable cover of Mitchell grass but often large spaces between tussocks. The patches of Queensland bluebush in the northern part of the lease were generally in ‘Fair’ (C) condition, with the plants having a mostly even distribution but evidence of significant grazing pressure, including a high proportion of dead stems.
82
PASTORAL LAND BOARD | ANNUAL REPORT 2016-17

TENNANT CREEK PASTORAL DISTRICT
The Tennant Creek Pastoral District encompasses 69 231 km2 and includes eight pastoral leases.
Seasonal quality was significantly above-average across most of the district based on rainfall and modelled pasture growth. Sixteen percent of the region burnt between October 2016 and September 2017 with fire most active in August and September 2017. Based on Landsat imagery, most of the district had above-average to highest levels of vegetation cover recorded since 1988, consistent with well-above long term median rainfall. One quarter of the district had > 46% bare soil per Landsat pixel, mainly in the east (Aboriginal Land Trust). No pastoral leases were visited for site-based monitoring over this reporting period.
Seasonal quality
“Seasonal quality” describes the relative value of recent rainfall in producing forage for livestock. It is judged with reference to the historical record. Two indicators are used: rainfall amount compared with the long-term median and expected pasture growth based on rainfall received, simulated using AussieGRASS (www.longpaddock.qld.gov.au).
Descriptors of seasonal quality provide useful context for interpreting various measures of land condition at particular times. However, to the extent possible, land condition is assessed independently of seasonal conditions.
Rainfall statistics (Table 26) are based on gridded rainfall produced by the Bureau of Meteorology (www.bom.gov.au/jsp/awap/rain/index.jsp). Pixel (grid cell) values are calculated from rainfall amounts at recognised recording stations. Rainfall is from October of one year to September the following year. Modelled pasture growth is for the period November 2016 to April 2017. This growth is ranked as a percentile of the growth for all previous summers.
Table 26. Indicators of seasonal quality. Data spatially averaged for the Tennant Creek Pastoral District.
Rainfall (mm) AussieGRASS
2016 - 2017 526 Growth (kg/ha) 1885
Long term median 286 Percentile 89
Spatially averaged rainfall for the Tennant Creek Pastoral District was much above the long-term median (Table 26), due to consistent above-average rainfall across the entire district. There was a general increasing trend from the south-east to the north-west (Figure 54, top image).
Modelled pasture growth over the last summer, as a percentage of the long-term record, was substantially above average across most of the pastoral district (Figure 54, bottom image)
Map 8: Location of Tennant Creek Pastoral District
83
PASTORAL LAND BOARD | ANNUAL REPORT 2016-17

0 50 100 150 km
Percen�le Growth
very much below average
much below average
below average
average
above average
much above average
very much above average
TENNANT CREEK PASTORAL DISTRICT
0 50 100 150 km
Rain
Low: 400mm
Mid: 500mm
High: 700mm
Figure 54. Maps of seasonal quality. Top, gridded rainfall, October 2016 to September 2017; Bottom, AussieGRASS-modelled pasture growth for the 2016-17 summer period as a percentage of previous summers.
Spatially interpolated rainfall October 2016 to
September 2017
Simulated summer pasture growth as a percentage of the long term record
84
PASTORAL LAND BOARD | ANNUAL REPORT 2016-17

TENNANT CREEK PASTORAL DISTRICT
Figure 55. Monthly area burnt (km2) in the Tennant Creek Pastoral District between October 2016 and September 2017.
Fire
The North Australian Fire Information website (www.firenorth.org.au/nafi3) reports that 11 034 km2 (15.9%) of the Tennant Creek Pastoral District burnt between October 2016 and September 2017. This was approximately twice the area burnt during the 2015-16 reporting period (5646 km2). Most of the area was burnt in August 2017 (7224 km2).
Bare Soil Dynamics
It is important to maintain adequate ground cover in the latter months of each year to minimise soil loss from wind erosion and intense summer storms. It is also important to carry dry feed, and associated ground cover, into the latter months of each calendar year in case there is a late start to the usual wet season and/or monsoonal rains fail more generally.
The amount of bare soil present at any location changes from year to year depending on rainfall and its effectiveness, fire history and amount of grazing. The percentage of bare soil in each 30m square Landsat pixel (900 m2 or 0.09 ha) was used to report the amount of bare soil across all pixels in the Tennant Creek Pastoral District.
Most of the pastoral district had above-average to highest levels of vegetation cover recorded since 1988 (Figure 56). This pattern broadly corresponded with the above-average modelled pasture growth and gridded rainfall shown in Figure 54. Almost all areas in the north-east of the Tennant Creek Pastoral District, with much below-average vegetation cover in late 2017, were burnt at some stage in the preceding 12 months (fire scars shown in Figure 56).
85
PASTORAL LAND BOARD | ANNUAL REPORT 2016-17
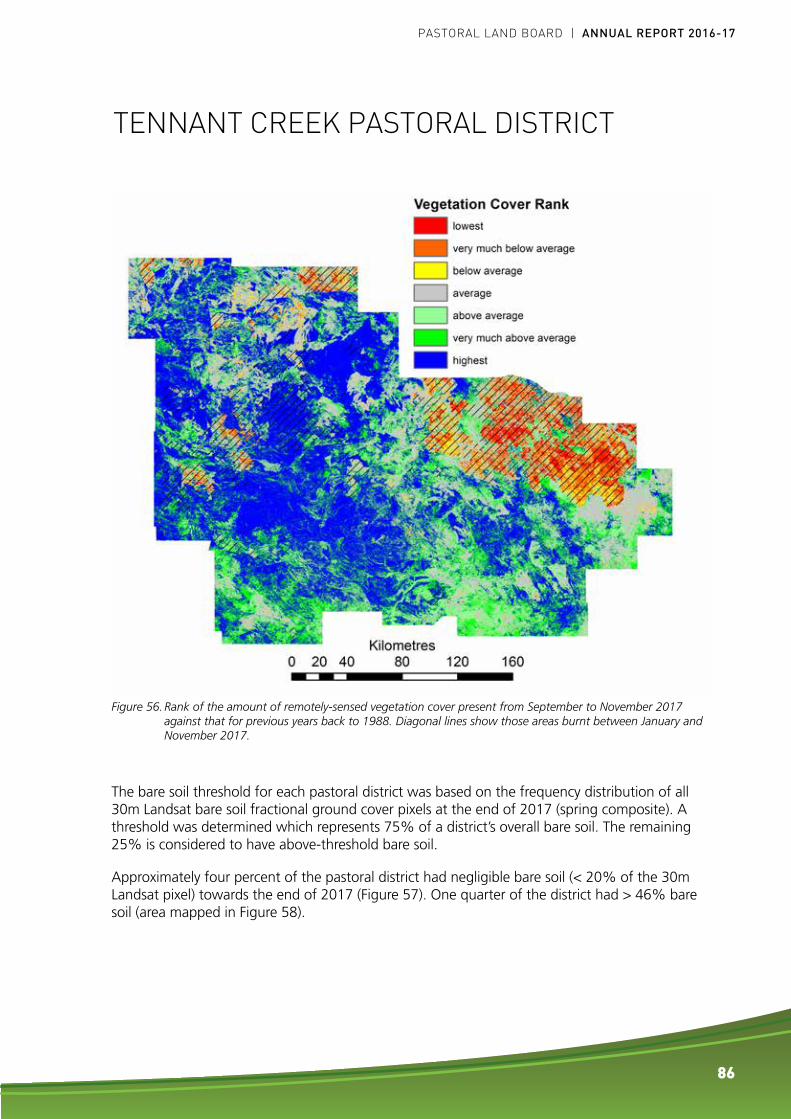
TENNANT CREEK PASTORAL DISTRICT
The bare soil threshold for each pastoral district was based on the frequency distribution of all 30m Landsat bare soil fractional ground cover pixels at the end of 2017 (spring composite). A threshold was determined which represents 75% of a district’s overall bare soil. The remaining 25% is considered to have above-threshold bare soil.
Approximately four percent of the pastoral district had negligible bare soil (< 20% of the 30m Landsat pixel) towards the end of 2017 (Figure 57). One quarter of the district had > 46% bare soil (area mapped in Figure 58).
Figure 56. Rank of the amount of remotely-sensed vegetation cover present from September to November 2017 against that for previous years back to 1988. Diagonal lines show those areas burnt between January and November 2017.
86
PASTORAL LAND BOARD | ANNUAL REPORT 2016-17

Figure 57. Percentage cumulative frequency of varying levels of bare soil in 30m square Landsat pixels in the Tennant Creek Pastoral District between September and November 2017 (spring composite). Areas with greater than 46% bare soil are mapped in Figure 58.
TENNANT CREEK PASTORAL DISTRICT
Figure 58. Parts of the Tennant Creek Pastoral District having more than 46% bare soil per Landsat pixel in late 2017. Areas burnt between January and November 2017 shown with diagonal lines. Note that the threshold level of bare soil used for mapping purposes varies between pastoral districts. It is selected to show at what level approximately 25% of the district is affected.
Site based monitoring
No pastoral leases were monitored in the Tennant Creek Pastoral District in the 2016-17 reporting year.
87
PASTORAL LAND BOARD | ANNUAL REPORT 2016-17

PLENTY PASTORAL DISTRICT
The Plenty Pastoral District encompasses 54 242 km2 and includes 14 pastoral leases.
The pastoral district experienced mainly above-average seasonal quality based on rainfall and AussieGRASS-modelled pasture growth. Correspondingly, Landsat imagery indicated that most of the region had above-average vegetation cover compared to the long-term record.
One quarter of the district had > 50% bare soil. Twenty-four of 78 sites monitored on nine pastoral leases were in good condition, 35 in fair condition and 19 in poor condition. Three leases had serious gully erosion of tracks or old roads and nearly half the monitoring sites showed evidence of wind erosion. Four sites showed evidence of past erosion.
Seasonal quality
“Seasonal quality” describes the relative value of recent rainfall in producing forage for livestock. It is judged with reference to the historical record. Two indicators are used: rainfall amount compared with the long-term median and expected pasture growth based on rainfall received, simulated using AussieGRASS (www.longpaddock.qld.gov.au).
Descriptors of seasonal quality provide useful context for interpreting various measures of land condition at particular times. However, to the extent possible, land condition is assessed independently of seasonal conditions.
Rainfall statistics (Table 27) are based on gridded rainfall produced by the Bureau of Meteorology (www.bom.gov.au/jsp/awap/rain/index.jsp). Pixel (grid cell) values are calculated from rainfall amounts at recognised recording stations. Rainfall is from October of one year to September the following year. Modelled pasture growth is for the same period (October 2016 to September 2017) to take account of useful winter rainfall during 2017. This growth is ranked as a percentile of growth for all previous October – September periods.
Table 27. Indicators of seasonal quality. Data spatially averaged for the Plenty Pastoral District.
Rainfall (mm) AussieGRASS
2016 - 2017 295 Growth (kg/ha) 1119
Long term median 206 Percentile 80
Spatially averaged rainfall for the Plenty Pastoral District was slightly above the long-term median (Table 27) due to average falls in the west. Rainfall increased from east to west, with above-average rainfall in the western parts (Figure 59, left-hand panel) of greater than 450 mm between October 2016 and September 2017.
Map 9: Location of Plenty Pastoral District
88
PASTORAL LAND BOARD | ANNUAL REPORT 2016-17

PLENTY PASTORAL DISTRICT
Most of the pastoral district experienced significantly above-average seasonal quality, based on modelled pasture growth, in the 12 months October 2016 to September 2017, generally consistent with rainfall distribution.
Rain
Low: 100mm
Mid: 300mm
High: 400mm
0 50 100 150 km 0 50 100 150 km
Figure 59. Maps of seasonal quality for the period, October 2016 to September 2017. Left, gridded rainfall; Right, AussieGRASS-modelled pasture growth as a percentage of previous similar periods.
Fire
There was minimal fire in the Plenty Pastoral District between October 2016 and September 2017 based on data from the North Australian Fire Information website with only 2 km2 burnt in May 2017 and 6 km2 in September 2017 (www.firenorth.org.au/nafi3).
Bare soil dynamics
It is important to maintain adequate ground cover in the latter months of each year to minimise soil loss from wind erosion and intense summer storms. The highly variable nature of rainfall in the southern NT also means that it is necessary to carry dry feed, and associated ground cover, into the hotter months in case summer rains fail.
The amount of bare soil present at any location changes from year to year depending on rainfall and its effectiveness, fire history and amount of grazing. The percentage of bare soil in each 30m square Landsat pixel (900 m2 or 0.09 ha) was used to report the amount of bare soil across all pixels in the Plenty Pastoral District.
Spatially interpolated rainfall October 2016 to September 2017
Simulated 12 month pasture growth as a
percentage of the long term record
Percen�le Growth
very much below average
much below average
below average
average
above average
much above average
very much above average
89
PASTORAL LAND BOARD | ANNUAL REPORT 2016-17

Most of the pastoral district had much above-average vegetation cover relative to that present in the latter part of each year back to 1988 (Figure 60). Good winter rainfall across much of the region was no doubt a contributing factor. Some sections of the Tobermorey and Marqua pastoral leases had the lowest or very much below vegetation cover compared with the past 29 years.
Figure 60. Rank of the amount of remotely-sensed vegetation cover present from September to November 2017 (spring composite) against that for previous years back to 1988.
PLENTY PASTORAL DISTRICT
The bare soil threshold for each pastoral district was based on the frequency distribution of all 30m Landsat bare soil fractional ground cover pixels at the end of 2017 (spring composite). A threshold was determined which represents 75% of a district’s overall bare soil. The remaining 25% is considered to have above-threshold bare soil.
The 75% threshold bare soil for the Plenty Pastoral District equates to 50% actual bare soil of a Landsat fractional ground cover pixel (Figure 61). Bare soil pixel values above 50% are shown in Figure 62, and include extensive areas of the eastern pastoral district.
Less than 2% of the pastoral district had a small amount of bare soil (< 20% of the 30m Landsat pixel) towards the end of 2017 (Figure 61).
90
PASTORAL LAND BOARD | ANNUAL REPORT 2016-17

Figure 61. Percentage cumulative frequency of varying levels of bare soil in 30m square Landsat pixels in the Plenty Pastoral District between September and November 2017 (spring composite). Areas with greater than 50% bare soil are mapped in Figure 62.
PLENTY PASTORAL DISTRICT
Figure 62. Parts of the Plenty Pastoral District having more than 50% bare soil per Landsat pixel in late 2017. Areas with higher pastoral value are shown with black and blue polygons. Note that the threshold level of bare soil used for mapping purposes varies between pastoral districts. It is selected to show at what level approximately 25% of the district is affected.
91
PASTORAL LAND BOARD | ANNUAL REPORT 2016-17

Most sites showed minimal evidence of grazing (Table 28), although this assessment is partly dependent on the time at which a lease is visited relative to the end of the growing season; later assessments may mean increased levels of pasture utilisation.
Slight or moderate wind erosion was recorded at nearly half the monitoring sites, usually associated with slight to moderate scald or sheet erosion (Table 28).
Table 28. Levels of pasture utilisation and evidence of erosion recorded at 78 sites on nine pastoral leases in the Plenty Pastoral District.
Pasture Utilisation Evidence of Erosion
Rank % of sites Type % of sites
No grazing 12 Wind 47
Minimal 55 Scalding 22
Moderate 9 Water sheeting 38
Moderate to heavy 7 Gullying 4
Heavy 8
Very heavy 9
Site based monitoring
Nine pastoral leases were visited in the Plenty Pastoral District during 2017, comprising 66% of the pastoral lease area in that district.
Vegetation cover of the ground layer was measured using the point intercept method at 78 sites across the nine leases. Sites, on average, had a moderate amount of bare soil, reasonable litter cover and perennial grasses, and a moderate contribution of annual grasses (Figure 63), but all vegetation cover components were variable between leases and between sites. Perennial grasses (as a proportion of total ground cover) varied between 2% to 88% within a single property; bare soil varied between 6% to 85% on another property.
PLENTY PASTORAL DISTRICT
Figure 63. Mean percentage and standard error of measured components of vegetation cover in the ground layer from 78 sites on nine pastoral leases in the Plenty Pastoral District.
92
PASTORAL LAND BOARD | ANNUAL REPORT 2016-17

Station Condition Rating
Comments with regard to pastoral lease
1Good: 4 sitesFair: 2 sitesPoor: 1 site
Alluvial areas were generally considered to be in ‘Fair’ (C) to ‘Good’ (B) condition, with good ground cover and diversity of palatable annual and perennial grasses. However, in some areas palatable perennial grasses were growing only where protected from grazing. The mulga and gidgee woodlands in the north of the station were generally in ‘Good’ (B) to ‘Fair’ (C) condition, with good pasture growth and species composition. However, in some areas palatable perennial grasses were less abundant than expected and/or historical erosion was still affecting productivity. Bluebush swamps in the south-east of the station appeared to be in ‘Good’ (B) condition. Extensive areas of spinifex dominated country were also considered to be in ‘Good’ (B) condition.
2Good: 3 sitesFair: 3 sitesPoor: 1 site
Pasture recovery in areas burnt by wildfire in 2011 had been limited by relatively low rainfall prior to 2016. Above average rainfall in the summer period preceding this visit, along with substantial winter rainfall, provided favourable conditions for pasture growth in 2017. Integrated monitoring sites were assessed in mostly ‘Good’ (B) to ‘Fair’ (C) condition. Satellite imagery products identified that the areas with the highest levels of bare soil, to which past grazing may have contributed, were associated with alluvial country adjacent to the major creeks. Class B weed, rubber bush was encountered during this visit along creeks.
3Good: 2 sitesFair: 8 sitesPoor: 1 site
Open Mitchell grass plains were assessed as being generally in ‘Fair’ (C) condition, with a moderate cover of Mitchell grass, but often large spaces between tussocks, with annual grasses or perennial forbs in-filling. Plains with gidgee over Mitchell grass were generally in ‘Good’ (B) condition. The large areas of gidgee or mulga woodland were generally in Fair condition. There had usually been a reasonable response to summer rains but several issues were affecting productivity: a reduced abundance of palatable perennial grasses, and patchy ground cover. There is serious gully erosion of tracks in the south of the station.
4Good: 2 sites Fair: 2 sites Poor: 2 sites
Alluvial areas were mostly considered to be in ‘Fair’ (C) to ‘Good’ (B) condition, with good ground cover and diversity of palatable annual and perennial grasses. An exception was the alluvial country fronting the station’s main river in Sandover land system, which was assessed in ‘Poor’ (D) condition. The mulga and gidgee woodlands were considered to be in generally ‘Fair’ (C) condition. Where on-ground inspection was made, they had produced a moderate response to summer rains and had generally favourable pasture composition, although palatable perennial grasses were usually less abundant than expected. Extensive areas of less pastorally productive spinifex sandplain were considered to be in ‘Good’ (B) condition. The Class B weeds, rubber bush and parkinsonia, were observed to be well established on the station.
6Good: 2 sitesFair: 6 sites
Overall, the station was assessed as being in ‘Fair’ (C) condition. There had generally been a moderately abundant response to summer rain and there was often reasonable ground cover, although this was often dominated by unpalatable annual grasses. There were some areas lacking palatable annual and/or perennial grasses, areas with sparse ground cover, and areas dominated by ephemeral resurrection grasses.
Table 29. Assessed land condition at monitoring sites and traversed parts of nine pastoral leases in the Plenty Pastoral District.
PLENTY PASTORAL DISTRICT
93
PASTORAL LAND BOARD | ANNUAL REPORT 2016-17

PLENTY PASTORAL DISTRICT
Station Condition Rating
Comments with regard to pastoral lease
7Good: 3 sitesFair: 3 sitesPoor: 3 sites
Land condition at monitoring sites ranged from ‘Good’ (B) to ‘Poor’ (D). Parts of one catchment were affected by sheet erosion, and this was contributing to the higher levels of bare soil and reduced pasture at sites rated in ‘Poor’ (D) condition. Eastern and southern parts of the station were generally considered to be in ‘Fair’ (C) to ‘Good’ (B) condition. Gully erosion of old roads was noted across a significant area, especially in the north-western part of the lease. Roads closer to the homestead were observed to have erosion control measures in place and were in good condition. Class B weed, rubber bush, was well established in alluvial and floodout country associated with the station’s northern creek and there was no control work being undertaken in this area at the time of this visit.
8Fair: 6 sitesPoor: 6 sites
Gully erosion of roads and drainage lines was observed throughout the lease, with altered drainage leading to reduced infiltration, widespread sheet erosion, and loss of pasture in more pastorally productive areas. Monitoring sites were assessed in ‘Fair’ (C) to ‘Poor’ (D) condition. Moderate to severe sheet erosion was recorded at nine of the twelve integrated monitoring sites. Spinifex dominated areas in the south-west of the property (Simpson and Singleton land systems) have a lower grazing value and were considered to be in ‘Good’ (B) condition. Parts of the southern-most paddock not supporting spinifex were assessed in ‘Fair’ (C) to ‘Good’ (B) condition. Strategic management of degraded pasture production areas will be required to prevent further decline in land condition.
9Good: 2 Fair: 4 Poor: 5
The preferentially grazed calcareous country in the north-east of the lease was assessed as being in ’Poor’ (D) condition. The expected palatable annual grasses were absent or sparse, as were palatable perennial grasses, although buffel grass appeared to be establishing in some areas. There were also areas with high levels of bare ground and extensive historical erosion. The central area of the lease was assessed as being in generally ‘Fair’ (C) condition, with a reasonable ground cover and sometimes a good amount of palatable perennial grasses, although there were issues such as severe active erosion or increased abundance of unpalatable grasses which were continuing to affect productivity. The highly productive alluvial country in the south of the property was generally in ‘Poor’ (D) condition. There was often sparse ground cover, large amounts of bare ground and active erosion in this area. However, there were small areas that were considered to be in ‘Good’ (B) to ‘Fair’ (C) condition. The alluvial country in the north-east was also generally in ‘Poor’ (D) condition. Perennial grasses were often sparse, and there was a large amount of bare ground with reduced infiltration and active erosion.
94
PASTORAL LAND BOARD | ANNUAL REPORT 2016-17

The Northern Alice Springs Pastoral District encompasses 102 515 km2 including 29 pastoral leases.
Much of the pastoral district experienced above-average seasonal quality due to good winter rainfall. This was also quantified based on expected pasture growth (modelled using AussieGRASS). Parts of the south-western area had seasonal conditions that were very much above-average. From Landsat data, most of the district had more vegetation cover (relatively less bare soil) in the latter period of 2016 compared with previous years since 1988. There were, however, elevated levels of bare soil in some areas. Twenty five per cent of the region had more than 45% bare soil at this time and twelve percent of the district had > 50% bare soil. Approximately 5% of the district burnt over the reporting period, primarily over July to September
2017. On-ground monitoring was conducted at 13 sites on two pastoral leases, on average, a moderate to high level of bare soil, reasonable litter cover and small contributions of perennial and annual grasses, and forbs. Slightly less than half the sites showed evidence of erosion by wind or water and 35 sites (31%) were heavily grazed at the time of assessment. Sixty percent of sites were rated in fair or good condition.
Seasonal quality
“Seasonal quality” describes the relative value of recent rainfall in producing forage for livestock. It is judged with reference to the historical record. Two indicators are used: rainfall amount compared with the long-term median and expected pasture growth based on rainfall received, simulated using AussieGRASS (www.longpaddock.qld.gov.au).
Descriptors of seasonal quality provide useful context for interpreting various measures of land condition at particular times. However, to the extent possible, land condition is assessed independently of seasonal conditions.
Rainfall statistics (Table 30) are based on gridded rainfall produced by the Bureau of Meteorology (www.bom.gov.au/jsp/awap/rain/index.jsp). Pixel (grid cell) values are calculated from rainfall amounts at recognised recording stations. Rainfall is from October of one year to September the following year. Modelled pasture growth is for the same period (October 2016 to September 2017) to take account of any winter rainfall across parts of the region during 2017. This growth is ranked as a percentile of growth for all previous October – September periods.
Table 30. Indicators of seasonal quality. Data spatially averaged for the Northern Alice Springs Pastoral District.
Rainfall (mm) AussieGRASS
2016 – 2017 413 Growth (kg/ha) 1615
Long-term median 259 Percentile 69
NORTHERN ALICE SPRINGS PASTORAL DISTRICT
Map 10: Location of Northern Alice Springs Pastoral District
95
PASTORAL LAND BOARD | ANNUAL REPORT 2016-17

Percen�le Growth
very much below average
much below average
below average
average
above average
much above average
very much above average
0 50 100 150 km
Rain
Low: 280mm
Mid: 380mm
High: 480mm
0 50 100 150 km
NORTHERN ALICE SPRINGS PASTORAL DISTRICT
Figure 64. Maps of seasonal quality for the period, October 2016 to September 2017. Top, gridded rainfall; Bottom, AussieGRASS-modelled pasture growth as a percentage of previous similar periods.
Spatially interpolated rainfall, October 2016 to September 2017
Simulated 12 month pasture growth as a percentage of the
long term record
Spatially averaged rainfall for the Northern Alice Springs Pastoral District was well above the long-term median (Table 30) across north parts and average to above average elsewhere. The southern part of the district had the least rainfall, less than 300 mm, encompassing areas of Ambalindum, The Garden, and Newhaven (Figure 64, top image).
Modelled pasture growth in the 12 months, October 2016 to September 2017, was average to above-average compared with the long-term record (Figure 64, bottom image). Parts of the south eastern area had seasonal conditions that were very much above-average.
96
PASTORAL LAND BOARD | ANNUAL REPORT 2016-17

Figure 65. Monthly area burnt (km2) in the Northern Alice Springs Pastoral District between October 2016 and September 2017.
Fire
Data available from the North Australian Fire Information website (www.firenorth.org.au/nafi3) shows that 5598 km2 (5.5% of the district) burnt between October 2016 and September 2017 (Figure 65). Fire was most active in August and September 2017.
NORTHERN ALICE SPRINGS PASTORAL DISTRICT
Bare soil dynamics
It is important to maintain adequate ground cover in the latter months of each year to minimise soil loss from wind erosion and intense summer storms. The highly variable nature of rainfall in the southern NT also means that it is necessary to carry dry feed, and associated ground cover, into the hotter months in case summer rains fail.
The amount of bare soil present at any location changes from year to year depending on rainfall and its effectiveness, fire history and amount of grazing. The percentage of bare soil in each 30m square Landsat pixel (900 m2 or 0.09 ha) was used to report the amount of bare soil across all pixels in the Northern Alice Springs Pastoral District.
Most of the district had more vegetation cover (relatively less bare soil) in the latter period of 2017 compared with previous years since 1988 (Figure 66). This pattern largely conformed with the spatial pattern of modelled above-average pasture growth (Figure 64). The small areas of much below-average vegetation cover in the central and western parts of the region correspond with wildfire in 2017.
97
PASTORAL LAND BOARD | ANNUAL REPORT 2016-17

NORTHERN ALICE SPRINGS PASTORAL DISTRICT
Figure 67. Percentage cumulative frequency of varying levels of bare soil in 30m square Landsat pixels in the Northern Alice Springs Pastoral District between September and November 2017 (spring composite). Areas with greater than 45% bare soil are mapped in Figure 68.
The bare soil threshold for each pastoral district was based on the frequency distribution of all 30m Landsat bare soil fractional ground cover pixels at the end of 2017 (spring composite). A threshold was determined which represents 75% of a district’s overall bare soil. The remaining 25% is considered to have above-threshold bare soil.
Approximately 2% of the pastoral district had small amounts of bare soil (< 20% of the 30m Landsat pixel) towards the end of 2017 (Figure 67). Twenty-five percent of the region had > 45% bare soil (mapped in Figure 68) and twelve percent of the district had > 50% bare soil.
Figure 66. Rank of the amount of remotely-sensed vegetation cover present from September to November 2017 (spring composite) against that for previous years back to 1988.
98
PASTORAL LAND BOARD | ANNUAL REPORT 2016-17

Site based monitoring
Two pastoral leases were visited in the Northern Alice Springs Pastoral District during late 2016 and 2017. The combined area of these leases comprises 9% of the pastoral lease area for the district.
Vegetation cover of the ground layer was measured using the point intercept method at 13 sites across the two leases. Sites, on average, had a moderate level of bare soil, reasonable litter cover and small contributions of perennial and annual grasses, and forbs (Figure 69). Litter cover is important because it assists infiltration of rain water, helps retain seed on site and reduces erosion risk.
There was some variation in amounts of bare soil, ranging from 4% to 57%, but most sites were around the mean. There was considerable variation in perennial grass cover between sites and between the two properties.
NORTHERN ALICE SPRINGS PASTORAL DISTRICT
Figure 68. Parts of the Northern Alice Springs Pastoral District having more than 45% bare soil per Landsat pixel in late 2017. Areas with higher pastoral value are shown with black and blue polygons. Note that the threshold level of bare soil used for mapping purposes varies between pastoral districts. It is selected to show at what level approximately 25% of the district is affected.
99
PASTORAL LAND BOARD | ANNUAL REPORT 2016-17

The majority of the 13 sites were rated as being minimally or not grazed indicative of less than 25% of the seasonal growth utilised at the time of assessment (Table 31). Four of the 13 sites showed evidence of slight erosion by wind or water.
Land condition ratings assigned at monitoring sites and the more generalised assessment of land condition across those parts of pastoral leases traversed at the end of 2016, and over 2017, are summarised in Table 32. Most leases received useful winter rainfall in 2016 and above-average rainfall in 2017, and experienced above-average seasonal quality based on modelled pasture growth in October 2015 to September 2016 and October 2016 to September 2017. To the extent possible, condition assessments are independent of year-to-year variability in rainfall and associated seasonal conditions.
NORTHERN ALICE SPRINGS PASTORAL DISTRICT
Pasture Utilisation
Rank % of sites
No grazing 38
Minimal 46
Moderate 0
Moderate to heavy 8
Heavy 8
Table 31. Levels of pasture utilisation assessed at 13 sites across two pastoral leases in the Northern Alice Springs Pastoral District.
Figure 69. Mean percentage and standard error of measured components of vegetation cover in the ground layer from 13 sites on two pastoral leases in the Northern Alice Springs Pastoral District.
100
PASTORAL LAND BOARD | ANNUAL REPORT 2016-17

Table 32. Assessed land condition at monitoring sites and traversed parts of two pastoral leases in the Northern Alice Springs Pastoral District.
Station Condition Rating
Comments with regard to pastoral lease
1Good: 1 siteFair: 7 sitesPoor: 1 site
Land condition was assessed as ‘Fair’ (C) at most integrated monitoring sites. At the time of inspection, there was vigorous pasture growth at most sites. Lower than expected relative densities of palatable species accounted for the ‘Fair’ (C) rather than ‘Good’ (B) assessment at most sites. Class B weeds, rubber bush and parkinsonia, were established on the property and were being actively controlled. Several large athel pine trees (Class A weed), were observed around the homestead.
2 Fair: 4 sites
The overall condition of the lease was generally assessed as ‘Fair’ (C) with good ground cover but less palatable grass species. There was evidence of historical rabbit infestation, gully erosion in some drainage lines and incidence of rubber bush and noogoora burr. New infrastructue to improve grazing management was observed
NORTHERN ALICE SPRINGS PASTORAL DISTRICT
101
PASTORAL LAND BOARD | ANNUAL REPORT 2016-17

SOUTHERN ALICE SPRINGS PASTORAL DISTRICT
The Southern Alice Springs Pastoral District encompasses 92 529 km2 including 25 pastoral leases.
Winter rains produced good herbage growth with grasses also responding in some areas. Based on expected pasture growth (modelled using AussieGRASS), the far south and south-east of the region experienced very much above-average seasonal conditions – with seasonal quality being above average elsewhere. Analysis of Landsat imagery acquired in the latter months of 2017 showed that most of the district had above-average vegetation cover (i.e. less bare soil) in the latter part of 2017 compared with previous years since 1988. Despite this, one quarter of the region had more than 58% bare soil per Landsat pixel. Considerable areas of increased bare soil in the central and eastern portions of region appear to be a continuing legacy effect of extensive wildfire in 2011.
Three of the 20 sites measured on two pastoral leases were rated in good condition with 45% in poor condition. Slight wind erosion was measured at 70% of the sites, with only two of the 20 sites not showing any evidence of some type of erosion.
Seasonal quality
“Seasonal quality” describes the relative value of recent rainfall in producing forage for livestock. It is judged with reference to the historical record. Two indicators are used: rainfall amount compared with the long-term median and expected pasture growth based on rainfall received, simulated using AussieGRASS (www.longpaddock.qld.gov.au).
Descriptors of seasonal quality provide useful context for interpreting various measures of land condition at particular times. However, to the extent possible, land condition is assessed independently of seasonal conditions.
Rainfall statistics (Table 33) are based on gridded rainfall produced by the Bureau of Meteorology (www.bom.gov.au/jsp/awap/rain/index.jsp). Pixel (grid cell) values are calculated from rainfall amounts at recognised recording stations. Rainfall is from October of one year to September the following year. Modelled pasture growth is for the same period (October 2016 to September 2017) to take account of winter rainfall during 2017. This growth is ranked as a percentile of growth for all previous October – September periods.
Table 33. Indicators of seasonal quality. Data spatially averaged for the Southern Alice Springs Pastoral District.
Rainfall (mm) AussieGRASS
2016 – 2017 203 Growth (kg/ha) 468
Long-term median 174 Percentile 58
Map 11: Location of Southern Alice Springs Pastoral District
102
PASTORAL LAND BOARD | ANNUAL REPORT 2016-17

SOUTHERN ALICE SPRINGS PASTORAL DISTRICT
0 50 100 150 200 kmRain
Low: 100mm
Mid: 250mm
High: 400mm
Spatially averaged rainfall for the Southern Alice Springs Pastoral District was slightly above the long-term median (Table 33), but there was considerable spatial variation across the district (Figure 70) with a trend from well below average in the eastern parts to above average in the west. Areas within Andado, Horseshoe Bend and New Crown received less than 150 mm, whereas areas within Curtin Springs received more than 200 mm in the 12 months between October 2016 and September 2017.
Modelled pasture growth in the 12 months, October 2016 to September 2017, generally corresponded to rainfall distribution; above-average in the far south-west of the region and significantly below-average in the south-east (Figure 70, bottom image).
0 50 100 150 200 km
Figure 70. Maps of seasonal quality for the period, October 2016 to September 2017. Top, gridded rainfall; Bottom, AussieGRASS-modelled pasture growth as a percentage of previous similar periods.
Spatially interpolated rainfall, October 2016 to
September 2017
Simulated 12 month pasture growth as a percentage of the
long term record
Percen�le Growth
very much below average
much below average
below average
average
above average
much above average
very much above average
Fire
There was minimal fire in the Southern Alice Springs Pastoral District between October 2016 and September 2017 (35 km2 based on data available from the North Australian Fire Information website (www.firenorth.org.au/nafi3).
103
PASTORAL LAND BOARD | ANNUAL REPORT 2016-17

SOUTHERN ALICE SPRINGS PASTORAL DISTRICTBare soil dynamics
It is important to maintain adequate ground cover in the latter months of each year to minimise soil loss from wind erosion and intense summer storms. The highly variable nature of rainfall in the southern NT also means that it is necessary to carry dry feed, and associated ground cover, into the hotter months in case summer rains fail.
The amount of bare soil present at any location changes from year to year depending on rainfall and its effectiveness, fire history and amount of grazing. The percentage of bare soil in each 30m square Landsat pixel (900 m2 or 0.09 ha) was used to report the amount of bare soil across all pixels in the Southern Alice Springs Pastoral District.
Most of the district had above-average vegetation cover (i.e. less bare soil) in the latter part of 2017 compared with previous years since 1988 (Figure 71). The far south west and sections in the north east of the region had their highest cover compared with the last 29 years. Winter rains that produced good growth of herbage (and grasses in some areas) contributed to the relatively high level of vegetation cover present across most of the region in late 2017.
Figure 71. Rank of the amount of remotely-sensed vegetation cover present from September to November 2017 (spring composite) against that for previous years since 1988.
104
PASTORAL LAND BOARD | ANNUAL REPORT 2016-17
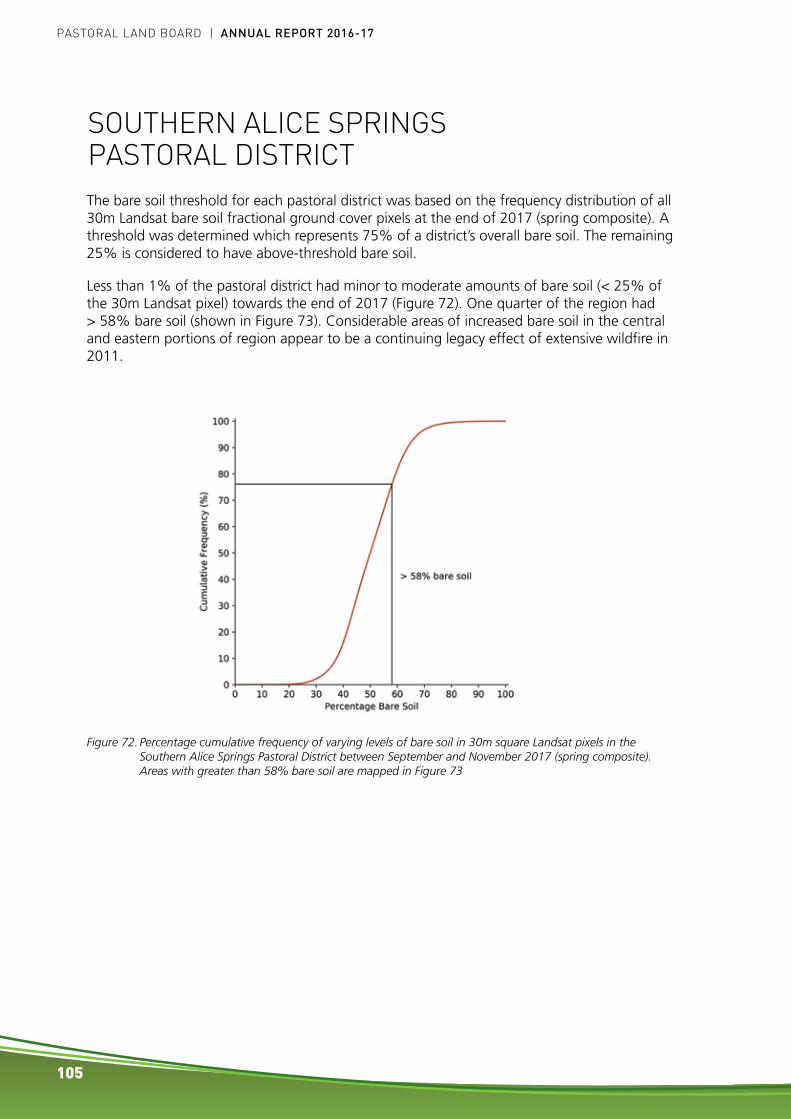
The bare soil threshold for each pastoral district was based on the frequency distribution of all 30m Landsat bare soil fractional ground cover pixels at the end of 2017 (spring composite). A threshold was determined which represents 75% of a district’s overall bare soil. The remaining 25% is considered to have above-threshold bare soil.
Less than 1% of the pastoral district had minor to moderate amounts of bare soil (< 25% of the 30m Landsat pixel) towards the end of 2017 (Figure 72). One quarter of the region had > 58% bare soil (shown in Figure 73). Considerable areas of increased bare soil in the central and eastern portions of region appear to be a continuing legacy effect of extensive wildfire in 2011.
Figure 72. Percentage cumulative frequency of varying levels of bare soil in 30m square Landsat pixels in the Southern Alice Springs Pastoral District between September and November 2017 (spring composite). Areas with greater than 58% bare soil are mapped in Figure 73
SOUTHERN ALICE SPRINGS PASTORAL DISTRICT
105
PASTORAL LAND BOARD | ANNUAL REPORT 2016-17
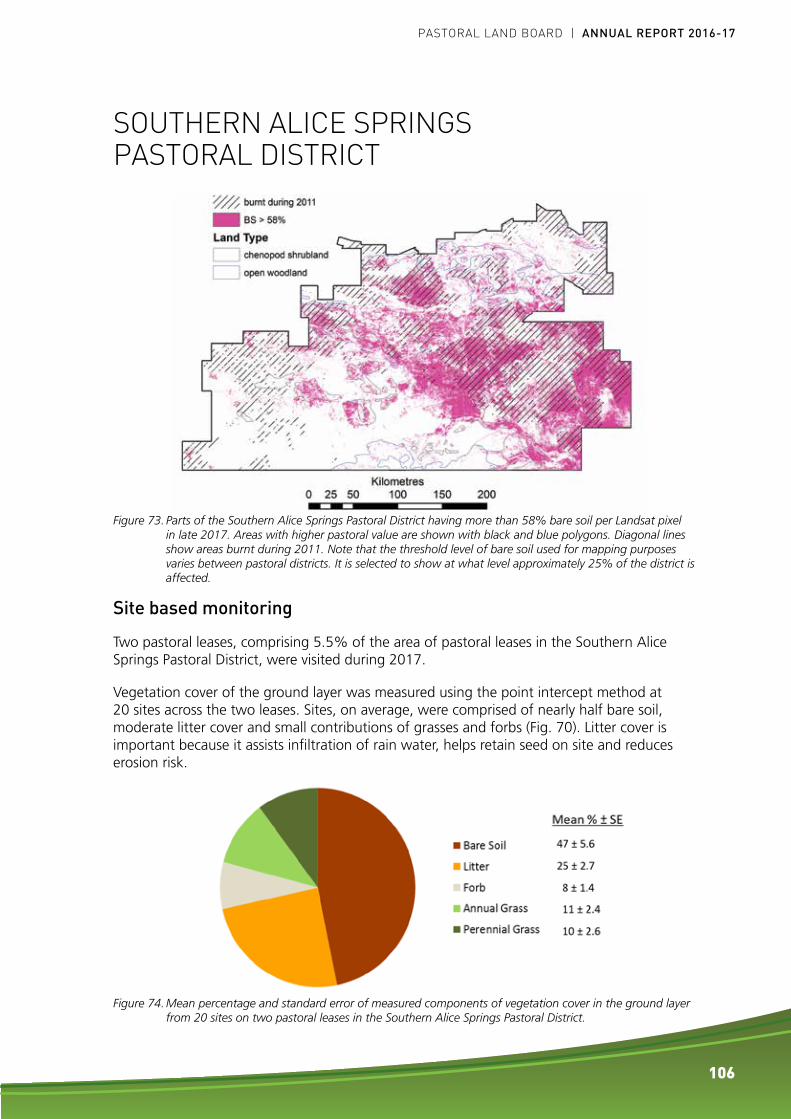
Figure 73. Parts of the Southern Alice Springs Pastoral District having more than 58% bare soil per Landsat pixel in late 2017. Areas with higher pastoral value are shown with black and blue polygons. Diagonal lines show areas burnt during 2011. Note that the threshold level of bare soil used for mapping purposes varies between pastoral districts. It is selected to show at what level approximately 25% of the district is affected.
SOUTHERN ALICE SPRINGS PASTORAL DISTRICT
Site based monitoring
Two pastoral leases, comprising 5.5% of the area of pastoral leases in the Southern Alice Springs Pastoral District, were visited during 2017.
Vegetation cover of the ground layer was measured using the point intercept method at 20 sites across the two leases. Sites, on average, were comprised of nearly half bare soil, moderate litter cover and small contributions of grasses and forbs (Fig. 70). Litter cover is important because it assists infiltration of rain water, helps retain seed on site and reduces erosion risk.
Figure 74. Mean percentage and standard error of measured components of vegetation cover in the ground layer from 20 sites on two pastoral leases in the Southern Alice Springs Pastoral District.
106
PASTORAL LAND BOARD | ANNUAL REPORT 2016-17

SOUTHERN ALICE SPRINGS PASTORAL DISTRICTThe majority of the sites (65%) were assessed as having nil or minimal levels of grazing (Table 34).
A combination of wind sheeting and erosion by water (scalding and water sheeting) was observed at most sites (Table 34), generally associated with past disturbances.
Table 34. Levels of pasture utilisation and evidence of erosion assessed at 20 sites across two pastoral leases in the Southern Alice Springs Pastoral District.
Pasture Utilisation Evidence of Erosion
Rank % of sites Type % of sites
Not grazed 35 Wind 75
Minimal 65 Scalding 20
Water sheeting 60
Land condition ratings assigned at monitoring sites and the more generalised assessment of land condition across those parts of pastoral leases traversed are summarised in Table 35. The two leases were visited in the early part of 2017, after good summer rain, so seasonal conditions were favourable for vegetation growth. However, to the extent possible, assessment of land condition is independent of recent seasonal conditions.
Table 35. Assessed land condition at monitoring sites and traversed parts of two pastoral leases in the Southern Alice Springs Pastoral District.
Station Condition Rating
Comments with regard to pastoral lease
1Good: 2 sitesFair: 5 sitesPoor: 3 sites
Hilly areas in the northern parts of the lease, including Harts and Pertnjara land systems, were considered to be in ‘Good’ (B) condition. Alluvial plains carrying gidgee in the east of the property (Ringwood land system) and lower parts of Allua land system were considered to be in ‘Fair’ (C) to ‘Poor’ (D) condition. Alluvial country fronting the river (Todd land system) was considered to be in ‘Fair’ (C) to ‘Poor’ (D) condition. Large, discrete areas with elevated levels of bare soil and active erosion corresponding to major tributaries of the Todd River were identified. Fractional cover products from satellite imagery indicated that these areas had persistently high levels of bare soil, even in good seasons.
2Good: 1 site Fair: 3 sitesPoor: 6 sites
The productive alluvial country along the river in the north-west of the station was considered to be in ‘Poor’ (D) to ‘Fair’ (C) condition. This area had a large amount of bare ground, active watersheeting, and sparse native perennial grasses. However, buffel grass and old man saltbush appeared to be stabilising the soil to some extent and providing feed. The calcareous country in the central and south-western parts of the station was assessed as being in generally ‘Poor’ (D) condition, with the sparse ground cover often dominated by unpalatable forbs and grasses, with widespread active watersheeting. The north-east of the station was considered to be in generally ‘Poor’ (D) condition, with a limited response to summer rain, a large amount of bare ground and poor water infiltration on the soil surface.
107
PASTORAL LAND BOARD | ANNUAL REPORT 2016-17

BUSHFIRE ACTIVITY
Information supplied by the Department of Environment and Natural Resources, Bushfires NT Division
1 November 2016 saw the introduction of the new Bushfires Management Act, replacing the previous Bushfires Act. A key underlying principle of the previous legislation has been retained – that landholders are responsible for the management of bushfires on their land.
Bushfires NT works with landholders and the wider community to manage bushfires in the NT by providing support for mitigation, management and suppression activities, and coordinating land owner and volunteer participation response to significant fires. Some of the major changes to the new Act include:
• the use of planning zones and fire management areas;
• improving the planning and response to fire activity throughout the season;
• endorsing volunteers as Authorised Bushfire Volunteers protecting them from civil or criminal liability for their participation in a bushfire response;
• the requirement to establish firebreaks within a fire protection zone; and
• all aerial incendiary burning activities require a permit.
Further information on the new Bushfires Management Act can be found at www.denr.nt.gov.au/land-resource-management/bushfire-information-and-management/bushfires-act-nt.
The Bushfires Emergency Management System (BEMS) has been developed and is being deployed throughout Bushfires NT and volunteer brigades. The BEMS is a web-based incident management system designed to capture the end-to-end lifecycle of an incident. BEMS will digitise three key processes which are currently undertaken manually by Bushfires NT staff and volunteers. These are digitising the current Permit to Burn and Planned Burn processes; developing an integrated incident management system for Bushfires NT personnel; and developing an integrated incident management system for volunteer brigades. The system has a range of features including an integrated mapping capability and Authorised Bushfires Volunteers will be able to access the system at any time. The BEMS provides users with access to critical information such as fire incident reports, copies of Permits and details of fire activity across the NT.
Bushfires NT has been working closely with the Australian Government and landholders across northern Australia to investigate long term funding options for the North Australian Fire Information (NAFI) website (http://www.firenorth.org.au/nafi3/). The NAFI site utilises satellite based remote sensing data to record fire activity across northern Australia, and is a vital tool for managing fire across the broad landscape. The Bushfires Council discussed with the Minister for Environment and Natural Resources, the relevance and importance of the
108
PASTORAL LAND BOARD | ANNUAL REPORT 2016-17
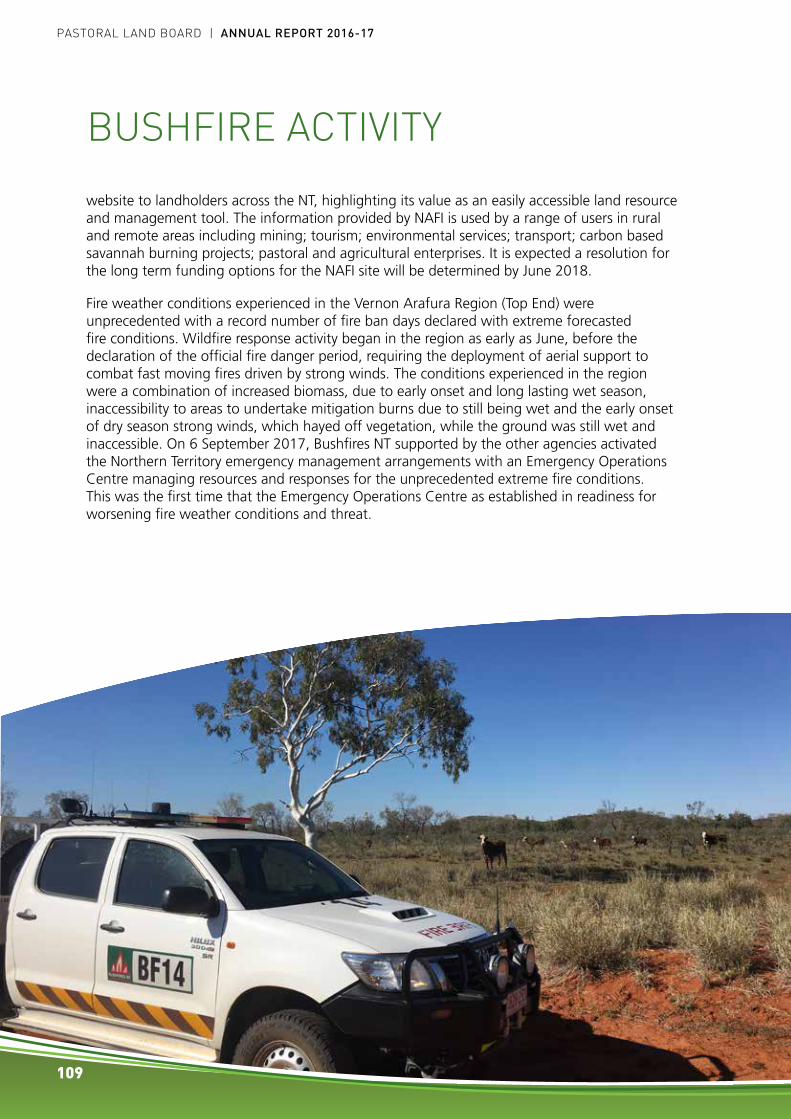
BUSHFIRE ACTIVITY
website to landholders across the NT, highlighting its value as an easily accessible land resource and management tool. The information provided by NAFI is used by a range of users in rural and remote areas including mining; tourism; environmental services; transport; carbon based savannah burning projects; pastoral and agricultural enterprises. It is expected a resolution for the long term funding options for the NAFI site will be determined by June 2018.
Fire weather conditions experienced in the Vernon Arafura Region (Top End) were unprecedented with a record number of fire ban days declared with extreme forecasted fire conditions. Wildfire response activity began in the region as early as June, before the declaration of the official fire danger period, requiring the deployment of aerial support to combat fast moving fires driven by strong winds. The conditions experienced in the region were a combination of increased biomass, due to early onset and long lasting wet season, inaccessibility to areas to undertake mitigation burns due to still being wet and the early onset of dry season strong winds, which hayed off vegetation, while the ground was still wet and inaccessible. On 6 September 2017, Bushfires NT supported by the other agencies activated the Northern Territory emergency management arrangements with an Emergency Operations Centre managing resources and responses for the unprecedented extreme fire conditions. This was the first time that the Emergency Operations Centre as established in readiness for worsening fire weather conditions and threat.
109
PASTORAL LAND BOARD | ANNUAL REPORT 2016-17

VERNON ARAFURA REGION (TOP END)
The region experienced an early wet season that continued into late May, resulting in the start of the 2017 dry season with above average biomass and fuel loads. Early mitigation activities were undertaken across pastoral lands and large land holdings across the region. Early windy conditions experienced from June onwards, hampered the implementation of the full annual mitigation program, importantly including the limitation of the aerial prescribed burning to one application rather than two. Some follow up prescribed burning was able to be undertaken by some stations as the ground dried up and became more accessible. Similarly the Strategic Fire Breaks Program was delayed, but was able to be completed by September 2017. Increased stocking rates across pastoral and large land holdings assisted to mitigate some of the high fuel loads.
Due to the extended wet season conditions and increased fuel loads (as a result of reduced mitigation activities) the region experienced unprecedented fire conditions and wildfire activity from June through to October. Volunteers and Bushfires NT staff attended 197 wildfires. Unusually, 35 of these wildfires occurred in May and June, resulting in fire fighters having limited access to the fires and fire fronts. Throughout the fire season, 22 fire ban days were declared with 8 days forecast with extreme fire weather conditions. Most of the days were consecutive from 19 August through to 17 September. A number of Incident Management Teams were stood up during these times to reflect the Fire Ban periods and predicted severe fire weather conditions. The establishment of Incident Management Teams enhanced emergency preparedness across Bushfires NT and supporting agencies.
SAVANNA REGION
The region experienced above average wet season and growing conditions with increased levels of biomass and fuel loads. Mitigation planning and burning was conducted across the region, with an extensive aerial prescribed burning program undertaken with pastoralists and land managers. The aerial burning program was conducted in conjunction with ground burning activities.
Landholders and stations who participated in the aerial prescribed burning program included Limmen National Park, Judbarra/Gregory National Park, Victoria River Downs, Birrindudu, Mt Sanford, Pigeon Hole, Moolooloo, Manbulloo, Delamere, Montejinni, Birrimba, Willeroo, Inverway, Murranji, Wubalawun, McArthur River, Spring Creek and Dungowan Stations.
The strategic fire break program, part of the National Disaster Resilience Projects, was completed across identified areas of the regions. This provides opportunity for increased collaboration between neighbouring landholders to manage fire across the broader landscape.
Bushfires NT staff continued to undertake stakeholder visits and inspections of high risk and strategic areas across the region. Training and support awareness was delivered to a number of landholders and pastoralists, with training increasing across the region.
BUSHFIRE ACTIVITY
110
PASTORAL LAND BOARD | ANNUAL REPORT 2016-17

In recent years, woody thickening has become an issue across the region, resulting in an increase in the number of late season fire permits issued for late fires to reduce woody thickening. This has increased the number of late season fires, but with pre-planning and advice, these fires have been controlled and were undertaken with strict conditions.
The aerial prescribed burning program that was undertaken provided protection and strategies for the management of wildfires in the region. Mitigation burning undertaken on Murranji Station prevented extensive damage as the fire was able to be contained by the aerial burning lines. Hodgson Downs, Elsey, Vermelha and Hodgson River Stations experienced similar fire management, utilising aerial burn lines to direct and contain wildfires across the land.
The region experienced a large number of hay stack fires both in 2016 and 2017, with many thousands of dollars in losses recorded. Fires starting along road verges continue to be a source of wildfires in the region, with Birrindudu, Inverway, Riveren and Bunda Stations affected this season.
BARKLY REGION
Throughout the region planned mitigation programs were implemented with strategic mineral earth breaks completed on Mt Drummond Station and Warrumungu Aboriginal Land Trust. Annual mitigation burns were conducted on the Nicholson Block, Warrumungu Aboriginal Land Trust, Tennant Creek Land Trust and the Tennant Creek town boundary.
Good rainfall and increased biomass and vegetation growth experienced across the region in early January contributed to wildfires on Benmarra, Tennant Creek, Phillip Creek, Muckaty, Helen Springs and Rockhampton Downs Stations. Vacant Crown land to the east of Tennant Creek and Aboriginal Land Trust lands of Warrumungu, Mungkarta and Karlantijpa were also impacted by wildfires.
Basic Wildfire Awareness training was delivered to a number of stakeholders across the region. Bushfires NT staff continued stakeholder engagement programs with visitation, inspections and planning programs. The Barkly Regional Bushfires Committee had a new Chairperson and members elected.
Barkly region based Bushfires NT staff provided logistical and operational support to the Vernon Arafura Region during the extreme fire conditions with staff deployed to the Katherine and Batchelor regional offices.
BUSHFIRE ACTIVITY
111
PASTORAL LAND BOARD | ANNUAL REPORT 2016-17

ALICE SPRINGS REGION
A trial aerial planned burn program was developed and implemented from March through to May 2017, to implement strategic fuel reduction across the pastoral estate. The program also worked to enhance collaboration between adjoining landholders and Bushfires NT. Pastoral properties that participated in the trial included Yambah, Aileron, Hamilton Downs and Napperby Stations. Further properties were planned to be a part of the trial, however unfavourable weather conditions to complete the planned burns, as well as availability of resources, prevented this occurring. To date, no wildfires have occurred in the area of the completed aerial burning trial. A review of the program will be undertaken to assess the success of the trial, however increased collaboration between adjoining landholders and Bushfires NT was a positive outcome. The aerial planned burn program is set to continue in 2018, with planning well advanced identifying current and emerging bushfire risks.
Bushfires NT continued to work with the Department of Infrastructure, Planning and Logistics in relation to reducing the bushfire risk along road corridors outside of the Fire Protection Zone. Successful mitigation burning has been completed by landholders along road corridors north of Alice Springs and along the Lasseter Highway and Nyrippi Road.
A Fire Weather Warning was issued for the Alice Springs Fire Protection Zone, the first warning since 2013. This was attributed to increased fuel loads within the area and the curing rate at that time.
Wildfire has impacted large areas throughout the Tanami and Great Sandy Desert Bio Regions, with minimal impacts to pastoral properties and/or assets. Smaller localised wildfires have occurred throughout the Burt Plains Bio Region impacting pastoral properties, some of these fires have resulted in enforcement action following a collaborative effort between Bushfires NT and Northern Territory Police.
For this reporting period, 6% of the Alice Springs Fire Management Zone was burnt. These burns occurred predominately during August and September 2017 and can be attributed to an increase in fuel reduction burning.
The Bushfires NT extension and engagement program continued across the region with 54 extension visits to pastoral stations during the reporting period. Training and fire awareness programs also continued with four Fire Fighter Level 1, three Basic Wildfire Awareness and two Remote Area Firefighter training courses held with various stakeholders trained in fire management. The stakeholders included pastoralists, government, Aboriginal rangers and Non-Government Organisations.
A remote community fire management program was implemented to increase community participation by removing bushfire risk faced in remote communities.
BUSHFIRE ACTIVITY
112
PASTORAL LAND BOARD | ANNUAL REPORT 2016-17

WEED ACTIVITY
Information supplied by the Department of Environment and Natural Resources, Weed Management Branch
The Weed Management Branch (WMB) of the Department of Environment and Natural Resources has Weed Management Officers based in the Darwin, Katherine, Tennant Creek and Alice Springs regions, and assists landholders to manage weeds by providing technical advice, assisting with weed management plans, conducting weed surveys and controlling emergency incursions.
NT WIDEPrickly Acacia and Mimosa Project
During this reporting year the Weed Management Branch continued implementation of the Prickly Acacia and Mimosa Project, funded by the Australian Government through the Agricultural Competitiveness White Paper. The prickly acacia component has enabled a range of activities including:
• Completion of an aerial herbicide application trial;
• Investigation into the applicability of using unmanned aerial vehicles (UAVs) for detecting prickly acacia,
• Commencement of an economic analysis for managing prickly acacia (including one case study each for the Barkly and VRD pastoral districts);
• Support to pastoral properties for prickly acacia eradication planning; and
• Implementation of the inaugural Natural Resource Management Champions Program in the Northern Territory.
Hay Strategy
The spread of declared weeds through hay production, transport and sale activities has been an ongoing concern raised by members of the pastoral industry. End users of hay regularly report that the hay they purchase has led to the germination of grader grass, senna, sida, gamba grass and other exotic contaminates on their property.
A preliminary consultation paper A strategy to improve the standard of hay production in the NT was disseminated to members of the NT Weed Advisory Committee for feedback. This process enabled the Weed Management Branch to obtain an appreciation for the inherent complexities involved with addressing the issue.
Following this consultation a plan was developed which outlines a range of activities for implementation to support development of a well-informed strategy in the future.
113
PASTORAL LAND BOARD | ANNUAL REPORT 2016-17

DARWIN REGIONMimosa (Mimosa pigra) remains the major weed impacting on the pastoral industry in the Top End, having infested the Mary, Adelaide, Finniss, Reynolds and Daly River catchments. Major infestations negatively impact on pastoral production, stocking rates and land condition.
The biological control agent ‘Nessie’ (Nesaecrepida infuscata) continues to increase its distribution. Nessie is having a dramatic effect reducing the vigour of mimosa plants especially in the lower Daly and Reynolds river areas.
In conjunction with Charles Darwin University, Weed Management Branch Officers presented a poster at the Territory Natural Resource Management conference. It detailed the dramatic reduction of mimosa soil seed bank over the 30 year lifespan of the Northern Territory’s biological control program. It shows a 95% decline from approximately 3400 seeds/m2 in 1987, not long after commencing the biocontrol program, to 200 seeds/m2 in 2015. This soil seed bank count is similar to the seed bank for the home range of mimosa in Mexico where the weed is ‘kept in check’ with other plant species through pressure by native insects and pathogens.
The year 2017 saw the wrap up of the Finniss Reynolds Mimosa Management Project, five-year Australian Government Biodiversity Fund project initiated in 2012. The project was administered by Territory NRM with technical advice provide by the Weed Management Branch and the Groups Steering Committee. The project resulted in a significant reduction and break up of mimosa monocultures over pastoral properties, conservation and indigenous managed lands in the Finniss and Reynolds rivers region. The properties that have benefited from the program over the past five years will need to ensure they continue their mimosa control to capitalise on the gains achieved through the program.
WEED ACTIVITY
114
PASTORAL LAND BOARD | ANNUAL REPORT 2016-17

Mimosa herbicide resistance
Pastoral properties in the Mary, Daly and Finniss regions have reported mimosa being resistant to metsulfuron-methyl (Brush Off™) herbicide. Resistance to herbicide should be reported to the Weed Management Branch and alternative herbicides should be used immediately. It must be realised that plants that are resistant produce resistant seedlings.
Alternative herbicides permitted for aerial application
• Fluroxypyr (Starane Advanced™)
• Tebuthiuron (Graslan™)
• Dicamba (Kamba™)
• Aminopyralid and metsulfuron-methyl (Stinger™) Not recommended for resistant mimosa as product also contains metsulfuron- methyl
Prickly acacia (Vachellia nilotica) is still only known on a single pastoral lease in the Darwin Pastoral District. An isolated population in the Adelaide River catchment was treated in 2015, monitoring will continue for several years as prickly acacia has potential for its long lived seed to germinate for up to 15 years.
Grader grass (Themeda quadrivalvis). Weed Management Officers have noticed a marked increase in the prevalence of grader grass across some Top End properties in recent years. Pastoralists must ensure that machinery and vehicles are clean of these weeds when entering a property especially when hiring or contracting heavy machinery. Once grader grass is known to be on the property educating staff and contractors in avoiding these weeds with machinery is essential. They are extremely easy to spread especially on machinery and in soils.
The cryptic nature of grader grass means that identification and control is very difficult. Being an annual grass it is almost impossible to identify until flowering. However the time between flowering and seed set is very short. Stations need to be ready to treat the grass as soon as it becomes noticeable or have measures in place to treat known infestation areas prior to flowering.
WEED ACTIVITY
Distinctive prickly acacia seed pod
115
PASTORAL LAND BOARD | ANNUAL REPORT 2016-17 PASTORAL LAND BOARD | ANNUAL REPORT 2015-16

Rat’s tail grass. The 2015-16 report detailed the increase in prevalence and distribution of weedy rat’s tail grasses (Sporobolus spp.) and its distribution on pastoral properties across the Top End. Amongst others impacts of this easily spread grassy weed reportedly include reduction of the grazing life of cattle through increased wear of teeth.
In early 2017 the Weed Management Branch partnered with a local agronomist, aerial applicator, herbicide manufacturer and two pastoral properties to trial broad scale aerial application of flupropanate in controlling rat’s tail grass. In addition to the effect on rat’s tail grass the trial aims to ascertain damage to beneficial species on both improved exotic pasture and native pasture.
The broad scale trial of the slow acting soil residual herbicide comes on the back of successful small scale scoping trials conducted by Weed Management Branch which indicated that careful application of flupropanate along with well managed competitive pasture grasses can selectively supress rat’s tail grass in pasture. Results from the trials should be seen toward the end of the 2017-18 wet season.
Rat’s tail grass infested paddock.
WEED ACTIVITY
116
PASTORAL LAND BOARD | ANNUAL REPORT 2016-17

Gamba compliance
The Weed Management Branch is now actively enforcing landholders to be compliant with the NT Weeds Management Act. Gamba grass and Darwin rural area properties are the main focus of the compliance program.
Gamba was originally introduced as an improved pasture through the mid 1900’s. It was promoted and planted widely on the Darwin pastoral areas through the latter half of the century. Unfortunately the weedy potential of the plant was not given enough attention and it has led to severe infestations in areas where gamba is not controlled and maintained through appropriate grazing regimes. Gamba continues to destroy infrastructure, native bushland and wildlife with its large biomass late curing and resulting in high intensity fires.
Landholders with gamba grass that is not actively maintained by grazing are obligated to treat the plant as a weed. Lessees and other land holders are required to prevent spread of gamba from their properties and not to promote the spread of the grass over their property.
Gamba may be utilised for hay by pastoral lessees however it must only be used internally on the property it was cut on. Gamba hay should be cut whilst the plant is vegetative and prior to flowering. Hay containing gamba must not be sold or traded, or transported along roadways.
Hot destructive gamba fire
117
PASTORAL LAND BOARD | ANNUAL REPORT 2016-17

WEED ACTIVITY
KATHERINE REGIONThe Katherine Region weed management area covers approximately 386 000 km2, encompassing 95 pastoral leases. The region includes the VRD, Katherine, Roper, Sturt Plateau and Gulf Pastoral Districts. Priority weeds identified in the Katherine Regional Weed Management Plan 2015-2020 have been the critical focus for Weed Management Branch business in this region. During the 2016-17 reporting year there has been particular focus on ensuring these priority weeds are managed on government land in accordance with statutory obligations. There has also been ongoing effort to ensure land holders have the advice and technical knowledge required to implement effective and strategic weed management.
Parthenium (Parthenium hysterophorus) is an issue of increasing concern for the Northern Territory. In December 2016 a single parthenium plant growing at Kidman Springs Research Station was reported. The Weed Management Branch implemented a rapid response on the same day the report was received. Diligence on behalf of the Department of Primary Industry and Resources staff meant that the plant was able to be destroyed by Weed Management Officers before it seeded. Considering one parthenium plant can produce 15 000 seeds and that parthenium currently costs the Australian pastoral industry an estimated $16.5 million per year (Queensland Government, 2016), the early detection and destruction of the plant ensured disaster was averted. More recently the Katherine team have received an increased number of parthenium reports which have not been confirmed due to insufficient information.
Grader grass (Themeda quadrivalvis) is a significant threat to the sustainability of pastoral production in the Katherine region. It has spread extensively throughout the Roper River and in the upper reaches of the Daly River Catchments. Pastoralists can be caught unaware by grader grass due to its similar appearance to kangaroo grass. A short window to maturity and prolific seed production means it can quickly establish before identification. As indicated by its name, the primary spread vectors for grader grass are vehicles and machinery. Spread prevention is critical for stopping further impact by grader grass to the pastoral industry. Weed Management Officers in Katherine frequently work to raise awareness of the threat posed by this weed and encourage pastoralists to ensure adequate spread prevention measures are being implemented. The statutory Weed Management Plan for grader grass contains information regarding management options and legislative obligations relating to this weed.
118
PASTORAL LAND BOARD | ANNUAL REPORT 2016-17

WEED ACTIVITY
Prickly acacia (Vachellia nilotica) remains a key concern for pastoral land in the Katherine region. A positive shift in management activity has been observed during this reporting year, with more pastoralists independently implementing control actions. The Weed Management Branch continues to work with all landholders impacted by this weed to raise awareness and provide technical advice. This weed is identified in the compliance program to ensure that it does not have the opportunity to negatively impact the NT pastoral industry as it has done in Queensland.
Bellyache bush (Jatropha gossypiifolia) impacts an estimated 20 000 hectares of land in the Katherine region, across 18 properties. It has invaded the upper reaches of both the Daly River and Roper River catchments and has proven to be immensely difficult to control. It has proven its ability to establish away from the riparian corridor resulting in production impacts. Funding obtained through the Biodiversity Fund to manage bellyache bush in the Daly River has resulted in recovery of some areas through an integrated management approach. The funding has also enabled production of a range of short movies about bellyache bush so landholders can understand the impacts and how to control it. This funding ceased 30 June 2017 however the project stakeholder group remains committed to ongoing bellyache bush management. Weed Management Officers have continued to remind landholders of their obligation to eradicate isolated infestations.
Mimosa (Mimosa pigra) is known to occur on six pastoral properties in the Katherine region. Weed Management Officers have visited five of these properties during the reporting period (some of received multiple visits). Improved management outcomes have been observed with most properties meeting their legislative requirements. Even though all mimosa infestations in the region are contained and considered feasible for eradication, mimosa is identified as a long term challenge. Given the high feasibility of control this weed is identified on the regions compliance program.
Parkinsonia (Parkinsonia aculeata) is very widespread throughout the region. Due to other priorities, this weed has not been a particular focus for the Katherine Weed Management Branch during the reporting period. Many properties are continuing control efforts with recognition that management of parkinsonia is a long term commitment.
TENNANT CREEK REGIONThe Weed Management Branch Tennant Creek region encompasses the Mitchell Grass Downs and Davenport Murchison Ranges bioregions, parts of the Tanami and Sturt Plateau. The Barkly region covers an area of 283 648 km2. The Weed Management Branch in conjunction with regional stakeholders implements the Barkly Regional Weed Management Plan. The Plan identifies the declared weeds prickly acacia, mesquite, bellyache bush, parkinsonia and rubber bush as priority species that require management in this region.
Mesquite (Prosopis spp.) is a Class A weed with only one large infestation, and a few isolated plants remaining on the Barkly. Eradication of Mesquite from the Barkly is achievable if a Weed Management Plan and a dedicated control program can be implemented at the infested property.
119
PASTORAL LAND BOARD | ANNUAL REPORT 2016-17

WEED ACTIVITY
Prickly acacia (Vachellia nilotica) is a Class A weed, has been the major focus for 2017 with the goal of eradication of all standing plants by 2020. Prickly acacia will remain a high priority weed species for the Barkly and will require continued monitoring of all historically affected properties. The three properties with the largest infestations in the Barkly region continued with treatment programs in 2017 with the Weed Management Branch in collaboration with Territory Natural Resource Management (TNRM) and Barkly Landcare Association (BLCA). As of the end of 2017 these properties had treated up to 80% of their prickly acacia. Annual follow up work on these three stations is vital to achieve eradication on the Barkly. All remaining properties on the Barkly with known isolated prickly acacia records are aware of their responsibilities to have treatment programs in place.
Bellyache bush (Jatropha gossypiifolia) is a Class A weed, with two currently known occurrences on the Barkly. A control program has been implemented, and all standing plants have been treated, with only seasonal recruitment requiring control.
Parkinsonia (Parkinsonia aculeata) continues to be the most widespread and serious weed on the Barkly and remains a major concern for many properties. Most properties in the region have management plans and treatment schedules. A natural die-back has spread throughout the Barkly Downs regions and in some regions along the Playford River where kill rates of over 50% have been observed. The bioherbicide “Di-bak”, a combination of fungal pathogens inserted as a capsule into the trunk of parkinsonia, has been trialled at strategic locations in the Lake Sylvester and Lake Tarrabool catchments. Parkinsonia die-back has not been found to be as prevalent in the southern Davenport Murchison Ranges properties of the Barkly, the introduction of “Di-bak” into the parkinsonia in this region is seen as an important strategy for parkinsonian control for this region.
Rubber bush (Calotropis procera) will continue to pose a significant risk to productivity of grazing land in the Barkly Region. The Tennant Creek Weed Management Branch presented the results of the Meat and Livestock Australia (MLA) funded rubber bush chemical trials on the Barkly to the NT TNRM conference these results indicated the need for further trials of tebuthiuron as the chemical was found to be highly effective in Queensland but not in the NT trials. As Tebuthiuron is an easy to use granular herbicide with a residual component the Tennant Creek Weed Management Branch will conduct further trials in 2018. These results will assist Barkly land managers in gaining a more thorough understanding of the control options available to them.
Rubber vine (Cryptostegia grandiflora) is a Class A weed, with one historical occurrence on the Barkly identified and controlled in 2011. This year there was a re-occurrence all plants were controlled and the greater area was surveyed. This site will continue to be monitored regularly by the station and Weed Management Branch.
120
PASTORAL LAND BOARD | ANNUAL REPORT 2016-17

ALICE SPRINGS REGIONThe Alice Springs region covers a vast area of approximately 576 000 km² bordered by Western Australia, Queensland and South Australia. The pastoral estate in central Australia is made up of 66 pastoral leases which cover approximately 40% of the land area. Aboriginal land in the region makes up 50% of the total land area. The Alice Springs Regional Weed Management Plan (2013-18) lists priority weed species and landscapes areas across the region which are the focus for weed management activities. The priority weeds listed for management within the region includes athel pine, cacti, parkinsonia and rubber bush all of which have undergone a rigorous scientific weed risk assessment process which has determined their weed risk and high potential for effective management.
Athel pine (Tamarix aphylla) had a Statutory Weed Management Plan released in March 2017. The Weed Management Branch have been working collaboratively with affected landholders in the upper managed 420 km of the Finke River catchment to manage residual infestations of athel pine located on Henbury, Idracowra, Maryvale, and Horseshoe Bend Stations. The residual infestations of athel pine in the upper 420 km managed part of the Finke River catchment are targeted for eradication in the next 5-10 years.
Cacti (Opuntioid spp.) All known naturalised infestations of Opuntioid cacti located on Orange Creek, Pine Hill, Yambah, Undoolya and Aileron Stations are being actively managed with eradication a real possibility in the next 5-10 years. The development of best practice manual for Managing Opuntioid Cacti in Australia by consultants in 2017 involved input from several local pastorals affected by cacti in the region when workshops were held in Alice Springs in March 2017. Onground surveillance continues across much of the pastoral estate in the Alice Springs region for historic plantings and naturalised cacti along with education and awareness raising. The Weed Management Branch continues to provide assistance to affected landholders through assistance with the development of weed management plans, equipment loans (eg spray tanks) to affected landholders.
Mesquite (Prosopis spp.) is listed as an alert species within the Alice Springs Regional Weed Management Plan, and was identified on a pastoral lease northwest of Alice Springs at the end of 2016 by DENR Rangeland Monitoring staff. Since initial detection of the infestation the Weed Management Branch have been working collaboratively with the affected landholder in limiting the spread of the infestation and determining most appropriate management options for eradication of this weed species in the short term.
WEED ACTIVITY
121
PASTORAL LAND BOARD | ANNUAL REPORT 2016-17

FERAL ANIMALS
Information supplied by the Department of Environment and Natural Resources, Flora and Fauna Division
Camels
No aerial culling operations were undertaken for camels in 2016-17. Anecdotal reports from landholders suggest that feral camel density remains relatively low across the broader western desert region of the NT although there were some small-scale incursions onto pastoral leases in the past six months. Anecdotal reports also suggest that feral camel numbers remain very low in the Simpson Desert. A small number of camels are still being harvested from the wild in the southern NT and shipped to Peterborough abattoir.
Feral cats
Exclusion fences are used to protect small populations of the endangered mala (rufous hare wallaby) from foxes and cats on Watarrka National and Uluru Kata Tjuta National Parks.
A multifaceted research effort is underway in the Top End to investigate the role of feral cats in mammal declines, funded by the National Environmental Science Program. Two 64 ha experimental cat exclusion plots have been constructed in Kakadu National Park to investigate the natural population responses of in situ small mammal and reptile populations in comparison to unfenced paired areas. Sampling will continue until the end of 2017.
In 2017, the Department of Environment and Natural Resources again carried out experimental cat control with the 1080 Eradicat bait in core central rock-rat refuge habitat in the Tjaritja/West MacDonnell National Park. Baits were deployed aerially at a density of 50/km2 in two 4000 ha areas during winter months. Preliminary results indicate that the numbers of central rock-rats have increased in the baited areas.
A research program is continuing to investigate cat ecology and management on Groote Eylandt, which is an important refuge for threatened species. This includes testing whether cat baiting will also impact native species, including the northern quoll. Feral cats are close to being eradicated on West Island as a result of trapping, baiting and hunting efforts undertaken by Aboriginal rangers and researchers.
122
PASTORAL LAND BOARD | ANNUAL REPORT 2016-17

Water buffalo
In 2017, a record 8982 (until November) live water buffalo were exported out of the Port of Darwin. Most of these animals were taken from the wild. The level of offtake is expected to grow in future years and the Department of Primary Industry and Resources (DPIR) is playing a key role in facilitating development of this industry. Current estimates put the feral water buffalo population across Arnhem Land at a minimum of 100 000 and the present level of offtake is probably having only a minor impact in reducing buffalo numbers and impacts in the wild.
Horses and donkeys
No aerial culling operations were undertaken for horses in 2016. Aboriginal work crews continued to trap horses at water points around Hermannsburg. The horses were loaded onto trucks destined for Peterborough abattoir.
There is a large-scale horse and donkey management program in the Victoria River District (mostly through the Victoria River District Conservation Association), where horses and donkeys have been declared as a pest and landholders are required to manage horse and donkey populations on their property under the Territory Parks and Wildlife Conservation Act. This program achieved substantive reductions in the horse and donkey populations between 1999 and 2006 and current activity is directed at maintaining those reductions.
The private sector continues to express interest in establishing a donkey industry in the NT to supply skins and other products to China. However, while a trade agreement has recently been signed with China for donkey products, a processing standard still needs to be developed before donkey products can be exported. DPIR is playing a key role in facilitating development of this processing standard. In anticipation of this happening in the near future, donkeys have been taken from the wild and released onto a property near Darwin.
FERAL ANIMALS
123
PASTORAL LAND BOARD | ANNUAL REPORT 2016-17

Feral pigs
Feral pig management is undertaken on some pastoral properties in the Top End using an integrated program of 1080 baiting, trapping, aerial and ground shooting. There is increasing interest from pastoral properties to undertake pig management using 1080 baiting. Some pig management is being undertaken in Arnhem Land, particularly in the Blue Mud Bay area, to manage the impacts of pigs on the environment. Parks and Wildlife staff provide assistance to landholders who wish to conduct 1080 management for pigs on a cost recovery basis.
Rabbits
While rabbit numbers in central Australia have increased in recent years, numbers are still well below levels recorded prior to the arrival of Rabbit Haemorrhagic Disease (RHD) in the mid-1990s. RHD and myxomatosis are periodically active throughout the region and help keep rabbit numbers in check. Very little additional rabbit management is undertaken anywhere in central Australia. The new K5 strain of RHD was released nationally in 2017 including at one site in central Australia. This strain is expected to increase the level of control across some parts of Australia.
Wild dogs
Wild dogs continue to be managed on the pastoral estate under permits issued by DPIR. The Departments of Environment and Natural Resources and Department of Primary Industry and Resources continue to collaborate on the project “Best practice management of wild dogs in the Northern Territory”. The project is funded through the Australian Government’s Agriculture White Paper. The project is documenting the negative impacts of wild dogs on cattle and current approaches to managing these impacts. This research will underpin the development of best practice guidelines for managing wild dog impacts. The project will ensure that dog impact management in the NT is consistent with the objectives of the National Wild Dog Action Plan.
FERAL ANIMALS
124
PASTORAL LAND BOARD | ANNUAL REPORT 2016-17

Five meetings of the Pastoral Land Board were held between 1 October 2016 and 30 September 2017 as follows:
111th Meeting: held 13 October 2016 in Katherine
Three land clearing permits were granted by the Board, as well as the approval of a 12 month extension to a previously issued land clearing permit. The Board deferred consideration of two land clearing applications requiring amended clearing plans, reviewed a voluntary management plan, granted a non-pastoral use permit for tourism activities, considered content for its next newsletter to be distributed to pastoralists, and approved amendments to its Land Clearing Guidelines.
112th Meeting: teleconference held 15 November 2016
The Board met to discuss the requirements of its participation in the Northern Territory Civil and Administrative Tribunal review process, following an objection to a decision of the Board. The Board noted the progress of two non-pastoral use and five land clearing applications.
113th Meeting: held 29 March 2017 in Darwin
Further consideration was given by the Board in relation to the Northern Territory Civil and Administrative Tribunal’s determination and the required processes. The Board noted native title concerns in relation to a non-pastoral use permit, a request for a voluntary management plan and the lodgement of three new non-pastoral use applications, as well as the current status of three land clearing applications. The Board consented to the reissuing of permits due to a lease subdivision and considered the content of its draft 2015-16 Annual Report. The Board noted satellite imagery that appeared to show land clearing had occurred from an expired permit, and outside the permit area, so determined that the status of approved clearing areas will be assessed annually against satellite imagery.
114th Meeting: teleconference held 23 May 2017
The Board noted completion of the matter under appeal with the Northern Territory Civil and Administrative Tribunal. One non-pastoral use permit was granted for commercial hay production and further consideration was given to one clearing application, with the Board determining to continue discussions at a later date, to allow for all members to be available to consider the matter. On 7 June 2017, the Board continued discussions via teleconference and reviewed the land clearing application and information provided to date. The Board determined the application should be referred for further assessment to the Northern Territory Environment Protection Authority (NT EPA). The Board agreed that to provide certainty to the applicant, address public concerns and ensure all environmental matters had been contemplated, it was appropriate the application should be considered by the NT EPA.
MEETINGS OF THE BOARD
125
PASTORAL LAND BOARD | ANNUAL REPORT 2016-17

115th Meeting: held 15 September 2017 in Katherine
The Board considered amendments to the Land Clearing Guidelines, recommended a pastoral lease conversion to the Minister, agreed to grant a non-pastoral use permit for tourism, noted the current status of one non-pastoral use and two land clearing applications and discussed a five year voluntary management plan.
APPLICATIONS CONSIDERED BY THE BOARDLand Clearing Applications
Station Pastoral District PurposeTotal Area (approx.) Decision
Douglas Darwin Improved pasture 567 hectares Approved
Mount Ringwood Darwin Improved pasture 664.5 hectares Approved
Tipperary Darwin Improved pasture 16,688 hectares Approved
Tipperary East Darwin Improved pasture 16,688 hectares Reissued (Due to Subdivision)
Tipperary West Darwin Improved pasture 586 hectares Reissued (Due to Subdivision)
Tipperary East Darwin Improved pasture 18,126 hectares Reissued (Due to Subdivision)
Tipperary East Darwin Improved pasture 8340 hectares Reissued (Due to Subdivision)
Banjo Sturt Plateau Improved pasture 6885 hectares Approved
Non-Pastoral Use Applications
Station Pastoral District Purpose Term Decision
Ambalindum Alice Springs Tourism 30 years Approved
Mary River East Darwin Tourism 30 years Approved
Tipperary East Darwin Horticulture 30 years Reissued (Due to Subdivision)
Tipperary East Darwin Agriculture 30 years Reissued (Due to Subdivision)
Scott Creek Katherine Horticulture 30 years Approved
MEETINGS OF THE BOARD
126
PASTORAL LAND BOARD | ANNUAL REPORT 2016-17

Subdivision Applications
Under section 61 of the Pastoral Land Act, the Minister refers applications for subdivision of pastoral leases to the Board for consideration and recommendation. During 2016-17 the Board considered one application for subdivision
Perpetual Pastoral Lease Applications
Under section 62 of the Pastoral Land Act, the Minister refers applications for conversion of term pastoral leases to perpetual tenure to the Board for consideration and recommendation. During 2016-17 the Board considered one application for lease conversion.
MEETINGS OF THE BOARD
127
PASTORAL LAND BOARD | ANNUAL REPORT 2016-17

Appendix 1: NT Cattle Industry 129
Gross Value of Production 129
NT Farm Performance 130
Rural Land 130
Appendix 2: Pastoral Production Research and Advisory Services 131
Pastoral Feed Outlook 131
Carrying Capacity Research and Application 131
Beyond Continuous Grazing 132
Sustainable Grazing Practices 133
Future Developments 133
Appendix 3: Plant Species List (common and scientific names) 134
APPENDICES
128
PASTORAL LAND BOARD | ANNUAL REPORT 2016-17

APPENDIX 1
NT Cattle Industry Source: Department of Primary Industry and Resources: Major Agribusiness Projects
The NT cattle population has historically accounted for an estimated 2.1 million head, or over 7.7% of the Australian total. NT cattle herd by pastoral district, Alice Springs has 20%, Barkly Tablelands and Tennant Creek 30%, VRD and Katherine 32%, and Darwin, Elsey and Gulf 18% of the total NT herd.¹
In 2015-16, an estimated 596 829 head of cattle were turned off from NT pastoral properties, a decrease of 5.4% on 2014-15.
Of the total NT cattle turned off in 2015-16, 50.4% were destined for interstate trade, and 43% were exported live overseas reflecting the changing conditions in live export markets (mostly Indonesia). 6.5% or 38 975 cattle were slaughtered in abattoirs (mostly in AACo’s meat processing facility).
In 2015-16, 256 898 head of NT cattle were exported, a decrease of 22.7% compared to 2014-15. The decision of the Indonesian Government to allow the importation of frozen buffalo meat from India, as an attempt to reduce high domestic prices for beef, has greatly disrupted the Indonesian live trade.
Interstate movements rose to 300 956 a 15.5% increase on 2014-15 as domestic buyers demanded more cattle.
Gross Value of Production
The estimated gross value of production for the cattle industry was $324.4 million in 2015-16, a 5.9% decrease compared to the previous year. This was mainly due to a small decrease in turn-off. In 2016-17, cattle production value is projected to increase by 3.5% to $335.6 million.
Cattle contributed 44.1% of the total value of NT rural industries and fisheries production in 2015-16
(a) Direct Contribution to Gross State Product (GSP)
NT cattle industry’s value adding direct contribution (output) to NT GSP in 2015-16 is estimated to be $165.4 million, or approximately 0.7% of total NT GSP.
(b) Flow-on Value (Direct and Indirect Contribution)
The flow-on effects of additional output (direct contribution) of $165.4 million and additional income (indirect contribution) of $41.0 million by the pastoral industry on the rest of the NT economy is estimated to be $206.5 million.
129
PASTORAL LAND BOARD | ANNUAL REPORT 2016-17

NT Farm Performance
Many farm businesses in the upper Northern Territory derive a large share of their total cash receipts from selling cattle for live export, particularly to Indonesia. The expansion of the live export trade between 2013–14 and 2015–16 resulted in cattle being sourced from a much expanded area of northern Australia.
In 2015–16 beef cattle receipts increased by 50%, as a result of a 40% increase in the average price received for beef cattle and a 10% increase in the number of beef cattle sold. Average total cash costs increased by 15%, partly offsetting higher farm receipts. Expenditure was higher on beef cattle purchases, hired labour, contracts, freight and livestock selling costs. The value of cattle transferred onto stations by businesses with properties interstate also increased.
Further increases in beef cattle prices are projected to result in a small increase in average farm cash income for the Northern Territory in 2016–17. Average farm cash income is projected to decrease in the Victoria River District – Katherine region due to reduced cattle turn-off. Overall farm cash incomes in the Northern Territory are projected to increase slightly to an average $2 098 000 per farm in 2016–17, compared with the 10-year average to 2015–16 of $418 000 per farm.
In 2016–17 an increase in cattle numbers is expected due to favourable seasonal conditions and higher branding rates, increased purchases and transfers onto corporate properties. This is expected to result in an increase in the value of inventories and a larger increase in farm business profit.²
Rural Land
In the past 12 months, $61 million worth of commercial scale Northern Territory freehold has sold - a strong increase on 2015, according to a recent Herron Todd White (HTW) report. The property valuation firm says that despite the uptick in sales, water allocation and soils rights in the area are very tight.
“This tight supply has potential NT farmers (including foreign buyers) looking at pastoral leasehold land and its potential for landing a diversification permit to develop farm land.
“With improving profits from record live cattle export prices, local cattlemen have also been more active in acquiring smaller freehold (depot type) blocks.”
Northern Territory rural purchasers were concerned with long-term goals, according to Herron Todd White’s December 2016 report. It noted the first Month in Review for 2016 stated that the year was shaping up to be another active year on the pastoral sales front in the Northern Territory and Kimberley.
“It’s fair to say that the year has not disappointed,” the HTW report stated.
“A lot of the interest has come from the big end of town, both overseas and Australian purchasers.
“Many of these purchasers appear to be more concerned with positioning themselves in terms of long term food security than short term price movements. However, they are also no doubt benefiting from buoyant live export prices at present. “Despite the volume of sales this year, there are still parts of the Territory which have not been sold.”³
1. NT Herd figure based on MLA Factsheet 2016 link
https://www.mla.com.au/globalassets/mla-corporate/prices--markets/documents/trends--analysis/fast-facts--maps/mla_beef-fast-facts-2016.pdf
2. ABARES Australian farm survey results
http://www.agriculture.gov.au/abares/research-topics/surveys/farm-performance
3. Herron Todd White National Rural Market Update March 2016
https://www.propertyobserver.com.au/finding/location/rural/70726-nt-rural-market-heats-up-with-61-million-of-sales-htw.html
130
PASTORAL LAND BOARD | ANNUAL REPORT 2016-17

APPENDIX 2
Pastoral Production Research and Advisory Services Source: Department of Primary Industry and Resources Livestock Industries Development Group
The Department of Primary Industry and Resources (DPIR) Livestock Industries Development group provides research, development and extension services to facilitate the sustainable development of the Northern Territory pastoral industry. Areas of expertise include rangeland management, animal production, genetics, improved pastures and market development. During 2016-17, DPIR continued to support Indigenous economic development through its partnership in the Indigenous Pastoral Program.
The DPIR Rangeland Program’s research and extension activities aim to optimise the sustainable and productive use of native pastures. Recent research efforts have focussed on investigating the benefits and costs of a range of grazing systems and land management practices. Over the past 16 years, DPIR has developed a nationally-significant catalogue of pasture growth models for the important pastoral land types of the NT. These models are used to estimate sustainable livestock carrying capacity and to test management scenarios with potential to increase the resilience of pastoral businesses to seasonal variability and climate change. The following sections summarise the outcomes of some of the main activities undertaken by the Rangeland Program in the past year.
Pastoral Feed Outlook
Since late 2011 DPIR has produced a quarterly bulletin that summarises the seasonal outlook, recent forage growth and current standing pasture biomass in each of the 11 pastoral districts of the NT. The Outlook can alert producers and industry advisers to issues such as low pasture levels, increasing drought risk and high fire risk. The Outlook is available as a free subscription service on the DPIR website: https://dpir.nt.gov.au/primary-industry/primary-industry-publications/northern-territory-pastoral-feed-outlook
Carrying Capacity Research and Application
The DPIR provides carrying capacity assessments to property owners on request. This typically involves property visits to verify infrastructure and land type mapping and to assess pasture growth and land condition. The agency fields numerous requests each year from both family-owned and corporate enterprises to provide advice on property development and land management. DPIR also provides advice to the Pastoral Land Board on subdivision and land clearing applications.
131
PASTORAL LAND BOARD | ANNUAL REPORT 2016-17

The DPIR has calibrated pasture growth models for more than 20 pasture types across the NT. Median pasture growth estimates from these models are routinely used for property carrying capacity assessments, Grazing Land Management workshops and for testing the performance of management options/practices arising from research projects.
High quality land type mapping is essential for carrying capacity assessment. Ongoing investment by DENR to improve the land type mapping in the Roper, Gulf and southern Sturt Plateau Districts, in particular, has been welcomed by DPIR.
Beyond Continuous Grazing
DPIR grazing systems trials and demonstrations continue to be conducted at Old Man Plains Research Station near Alice Springs and Douglas Daly Research Farm. Updates on these projects can be found in the DPIR Annual Research Achievement report at: https://dpir.nt.gov.au/__data/assets/pdf_file/0015/462030/TB356.pdf
The “Quality Graze” trial at Old Man Plains is testing and demonstrating recommendations that have been identified from recent research projects and promoted through the Grazing Land Management (GLM) workshops. The strategies being investigated include using the GLM methodology to set sustainable stocking rates, annual stocking rate adjustment based on seasonal variability, and pasture spelling achieved via rotational grazing. Pasture productivity, land condition and animal performance are regularly measured. Key findings to date include:
• Our current carrying capacity methodology appears to be sustainably matching stocking rate to land capability and maintaining land condition regardless of spelling or annual stocking strategy, and provides a buffering strategy for cattle production over a dry period of at least 12 months.
• Consistent production of steers for premium beef markets is possible in terms of growth rate and fat development across a range of seasons when stocking rates are matched to forage supply.
• Meat Standards Australia (MSA) compliance is possible under conditions similar to those experienced over the past five years however more research is required to determine how to achieve more consistent levels of compliance.
• Spelling has had no detectable effect on pasture dynamics over the trial period. Although it would be expected that spelling may be important in land condition recovery, no clear evidence has been found to date because all paddocks were spelled to some extent prior to the trial starting.
More information about this trial can be obtained by contacting [email protected].
A cell grazing trial has been conducted on improved pastures at the Douglas Daly Research Farm since 2009. The treatments include cell grazing, set stocking at the long-term safe carrying capacity and set stocking at a variable stocking rate equivalent to the effective stocking rate in the cell grazing treatment. Young cattle enter the trial shortly after weaning and remain in it for about one year at which time they are replaced by the next year’s group of weaners.
APPENDIX 2
132
PASTORAL LAND BOARD | ANNUAL REPORT 2016-17

APPENDIX 2
The cattle are rotated around 30 paddocks while the set stocked animals remain in the same 6ha paddock. Results to date clearly show that individual animal performance and production per hectare have been highest under set-stocking. More information about this trial can be obtained by contacting [email protected].
Sustainable Grazing Practices
The “Shruburn” experiment at Kidman Springs (established in 1993) has been investigating how best to use prescribed burning to manage woodland thickening and optimise pasture production. The trial plots are replicated on red and black soil sites, with the experiment testing the influence of season of burning (early vs late dry season) and frequency of burning (every two, four and six years). The experiment also includes a series of unburnt control plots for comparison. The major findings can be found in the Rangeland Journal (Cowley et al. 2014, Rangeland Journal 36(4): 323-345). More information about this experiment can be found at http://futurebeef.com.au/resources/projects/kidman-springs-fire-experiment-shruburn/ or by contacting [email protected].
DPIR commenced a new experiment in 2017 in partnership with the Barkly Landcare and Conservation Association and Newcastle Waters Station to investigate whether prescribed burning can be used as a tool for controlling feathertop wiregrass in Mitchell grass pastures. Research previously conducted in Queensland has shown that burning in about July or August can reduce feathertop whilst not adversely affecting the preferred grasses. However, burning Mitchell grass plains at that time of the dry season is risky so the experiment aims to determine whether the rewards outweigh the risks in the Barkly region. A series of experimental plots were burnt in the 2017 dry season and the results will be known as soon as it is dry enough to access the site.
DPIR continues to provide a range of grazing management training opportunities to industry. These include the EDGE Network Grazing Land Management (GLM) course, the new one-day Grazing Fundamentals workshop, Rangeland Management Courses for first-year stock-camp staff and the Barkly Herd Management Forum. Producers can contact their local DPIR office to find out more.
Future Developments
A number of new and existing owners have expressed an intention to greatly increase herd numbers. The DPIR is therefore anticipating an increase in development advice, related to pastoral infrastructure intensification, improved pastures and crops.
DPIR has started a project to estimate the potential for a sustainable increase in cattle numbers in the Northern Territory and the developments that would be needed to achieve this increase in the different production zones.
133
PASTORAL LAND BOARD | ANNUAL REPORT 2016-17
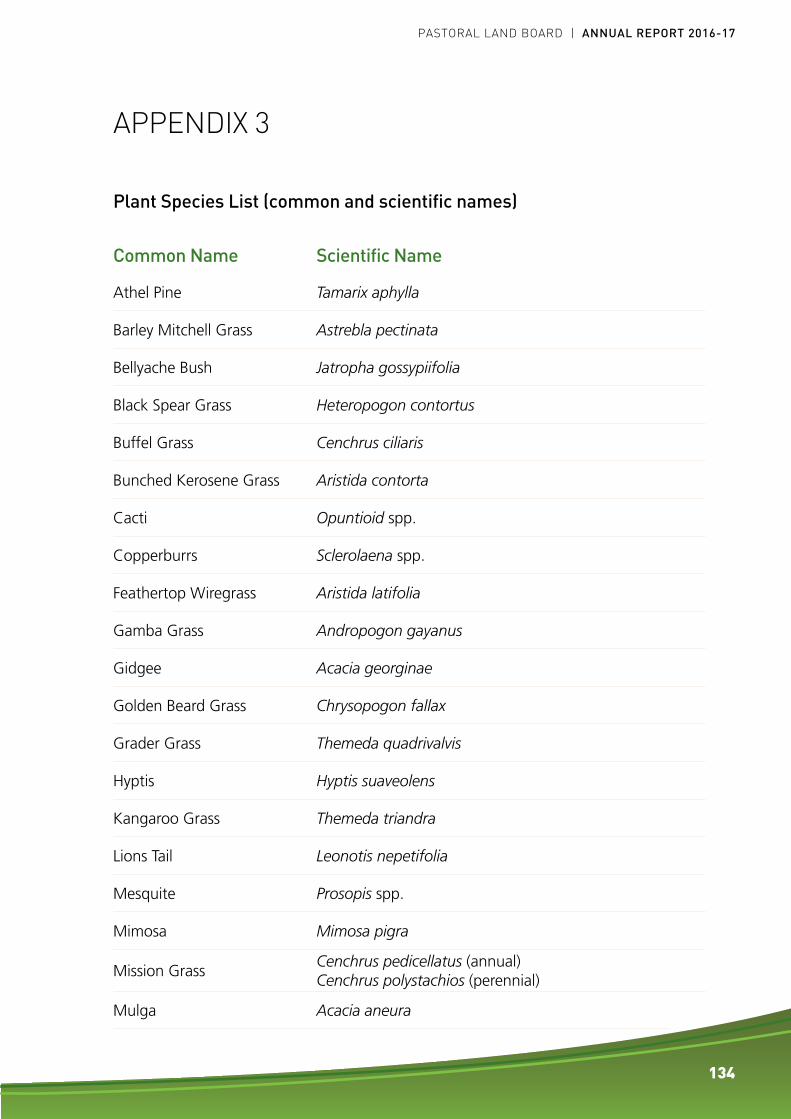
APPENDIX 3
Plant Species List (common and scientific names)
Common Name Scientific Name
Athel Pine Tamarix aphylla
Barley Mitchell Grass Astrebla pectinata
Bellyache Bush Jatropha gossypiifolia
Black Spear Grass Heteropogon contortus
Buffel Grass Cenchrus ciliaris
Bunched Kerosene Grass Aristida contorta
Cacti Opuntioid spp.
Copperburrs Sclerolaena spp.
Feathertop Wiregrass Aristida latifolia
Gamba Grass Andropogon gayanus
Gidgee Acacia georginae
Golden Beard Grass Chrysopogon fallax
Grader Grass Themeda quadrivalvis
Hyptis Hyptis suaveolens
Kangaroo Grass Themeda triandra
Lions Tail Leonotis nepetifolia
Mesquite Prosopis spp.
Mimosa Mimosa pigra
Mission GrassCenchrus pedicellatus (annual)Cenchrus polystachios (perennial)
Mulga Acacia aneura
134
PASTORAL LAND BOARD | ANNUAL REPORT 2016-17

APPENDIX 3
Common Name Scientific Name
Noogoora Burr Xanthium strumarium
Oat Grass Enneapogon spp.
Old Man Saltbush Atriplex nummularia
Para Grass Urochloa mutica
Parkinsonia Parkinsonia aculeate
Parthenium Parthenium hysterophorus
Prickly Acacia Vachellia nilotica
Queensland Bluebush Chenopodium auricomum
Rat’s Tail Grass Sporobolus spp.
Red Flinders Grass Iseilema vaginiflorum
Rubber Bush Calotropis procera
Rubber Vine Cryptostegia grandiflora
Sedge Cyperus spp.
Sida Sida acuta spp.
Silky Browntop Eulalia aurea spp.
Spinifex Trioda spp.
Wiregrass Aristida sp.
135
PASTORAL LAND BOARD | ANNUAL REPORT 2016-17

136
PASTORAL LAND BOARD | ANNUAL REPORT 2016-17