Embed Size (px)
Citation preview
Northern ShenandoahValley Water Resources Initiative
Frederick County Board ofSupervisors and PlanningCommissionMay 25, 2005Winchester, VA
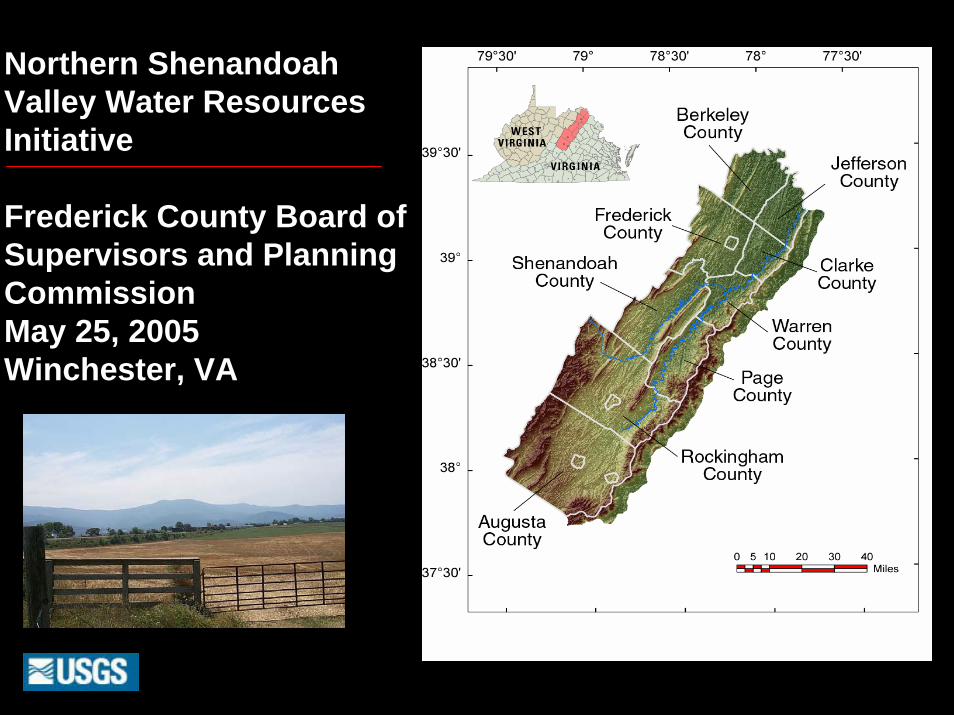
Water Balance
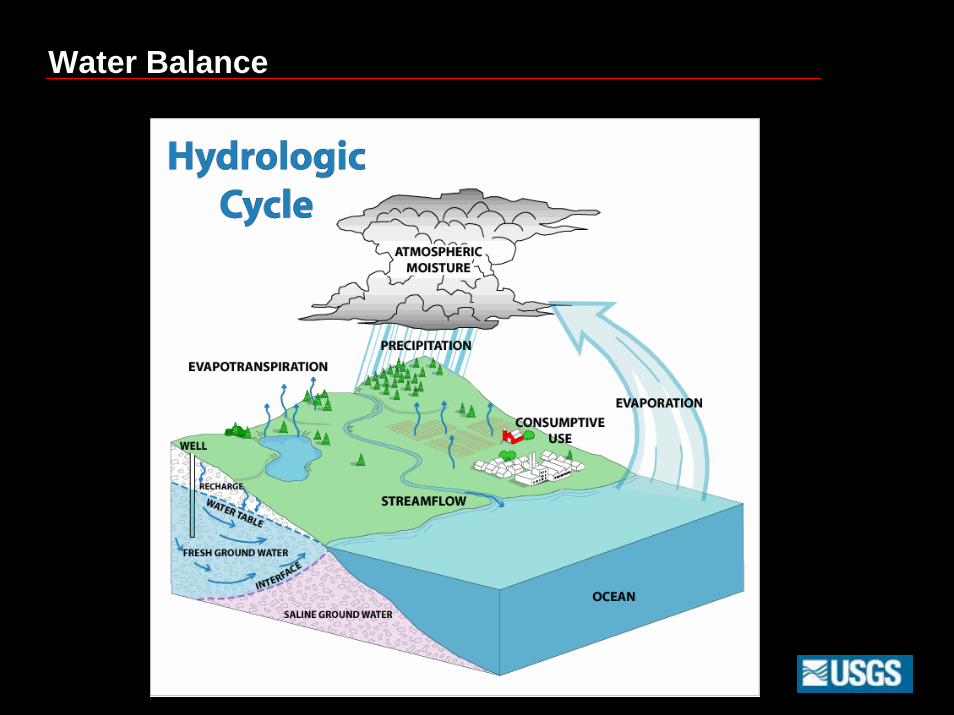
Aquifer Material
Sand
Shell material
Crystallinerock
Sedimentaryrock
Carbonates
Coal
Shenandoah Valley
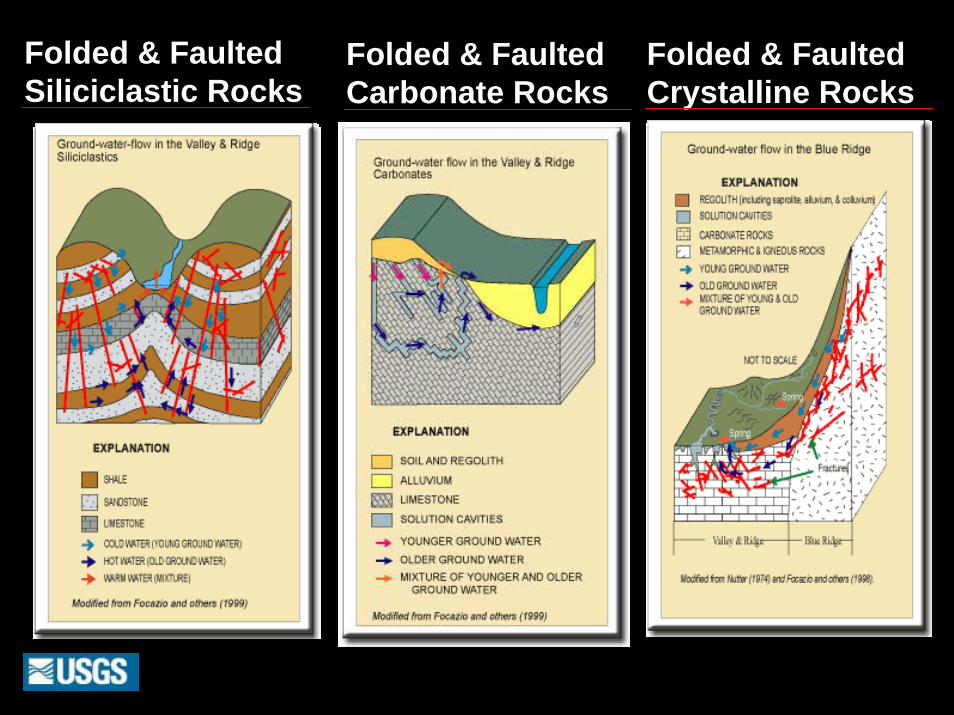
Folded & FaultedSiliciclastic Rocks
Folded & FaultedCarbonate Rocks
Folded & FaultedCrystalline Rocks
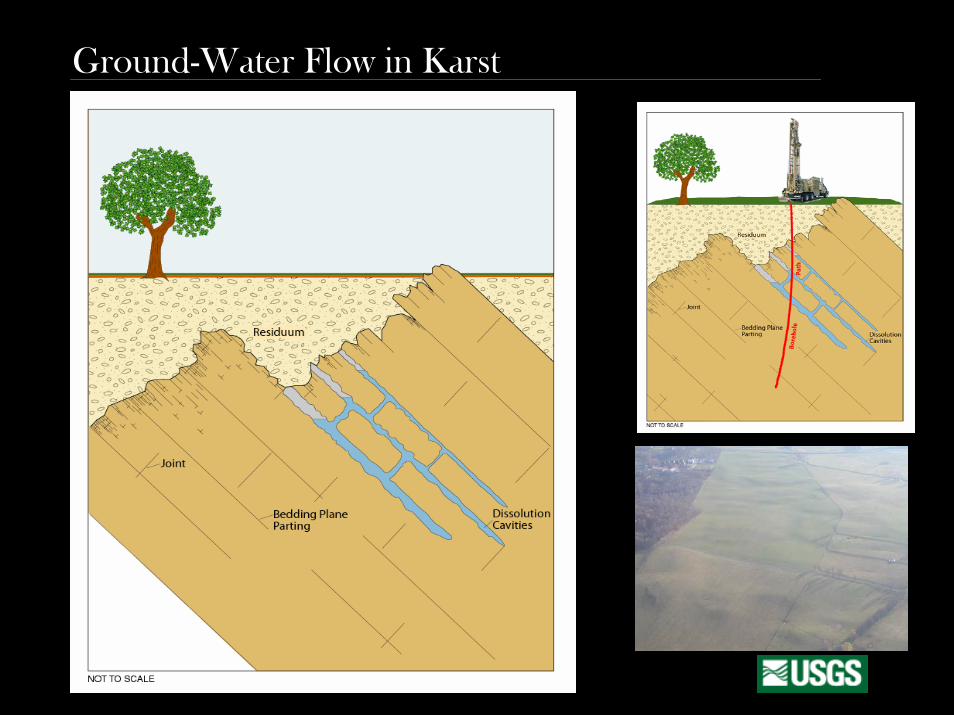
Ground-Water Flow in Karst
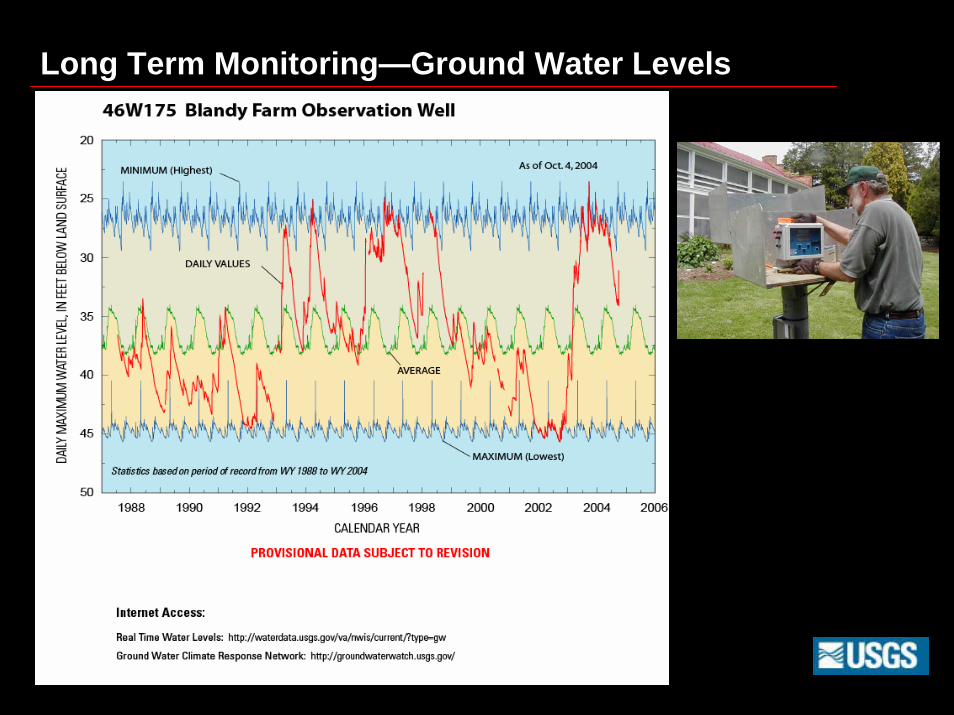
Long Term Monitoring—Ground Water Levels
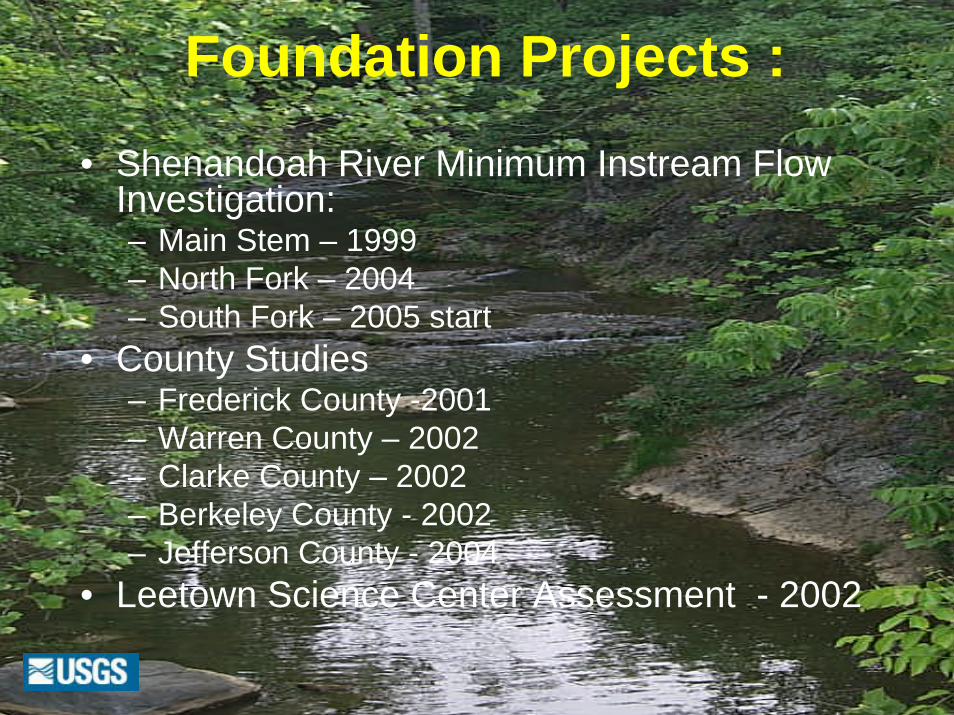
Foundation Projects :• Shenandoah River Minimum Instream Flow
Investigation:– Main Stem – 1999– North Fork – 2004– South Fork – 2005 start
• County Studies– Frederick County -2001– Warren County – 2002– Clarke County – 2002– Berkeley County - 2002– Jefferson County - 2004
• Leetown Science Center Assessment - 2002
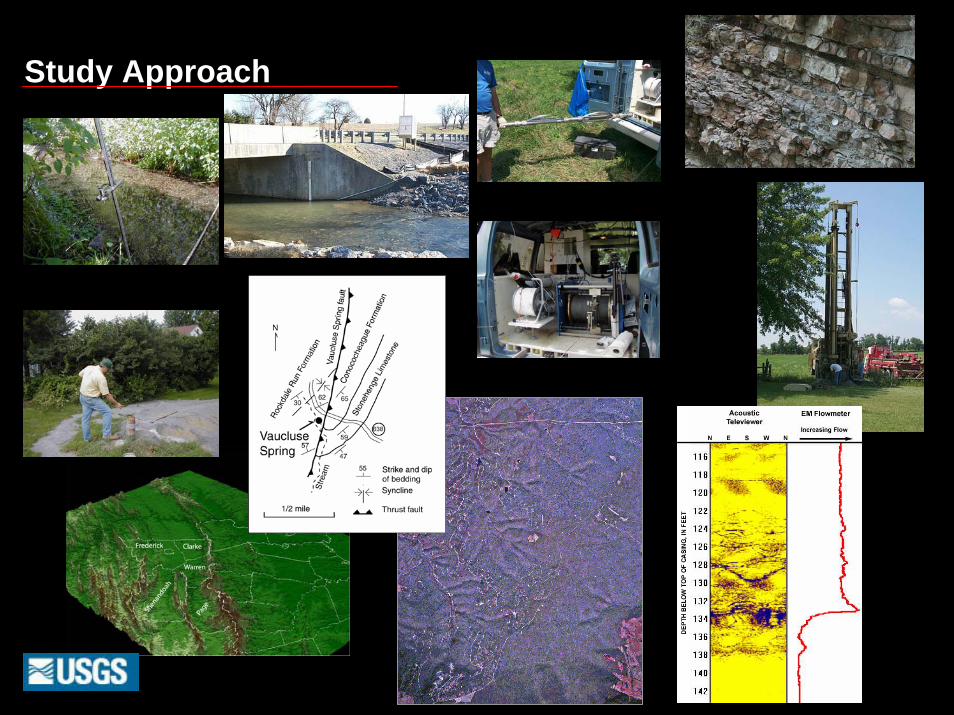
Study Approach
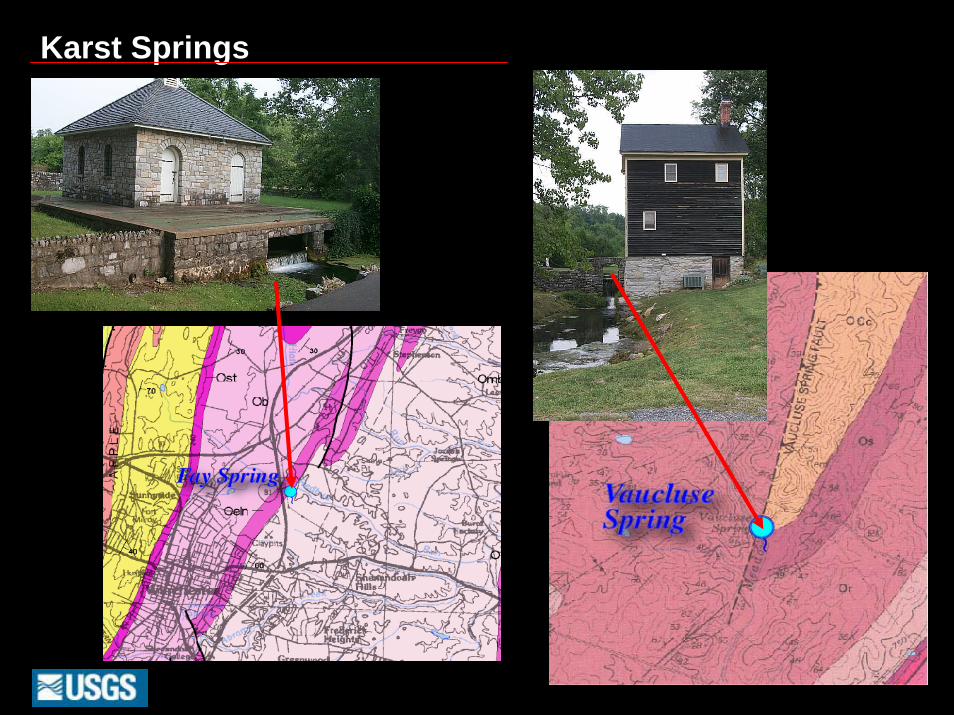
Karst Springs
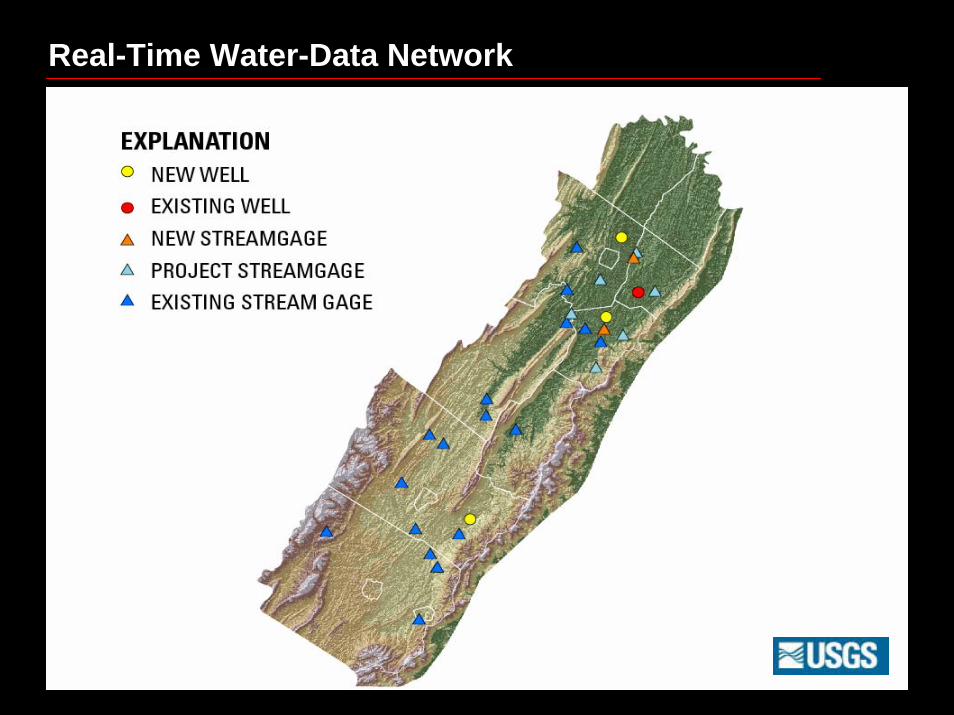
Real-Time Water-Data Network
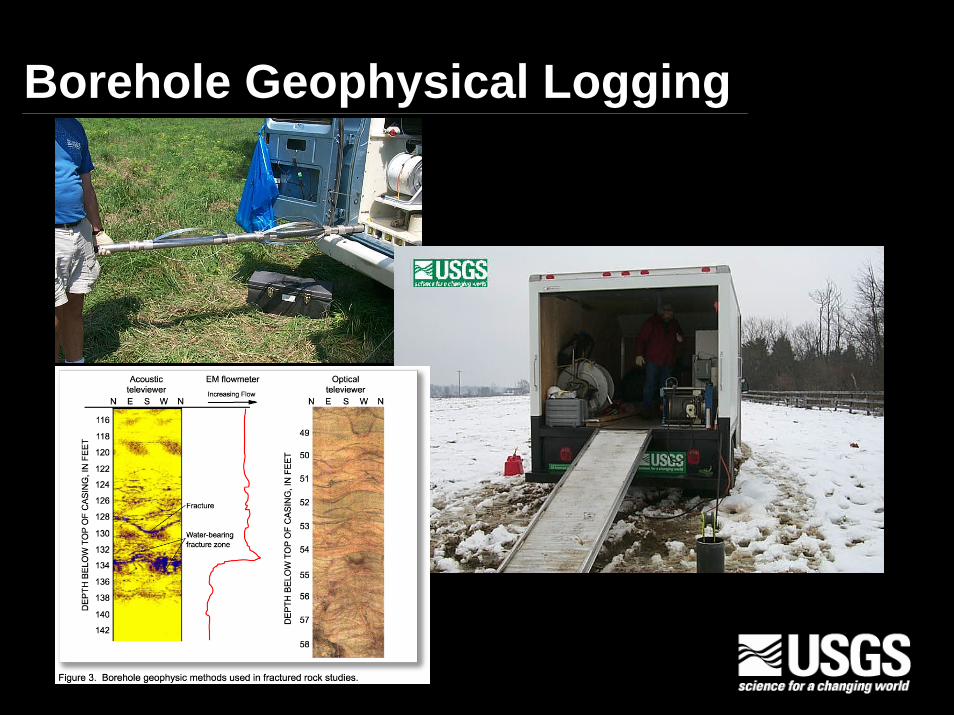
Borehole Geophysical Logging
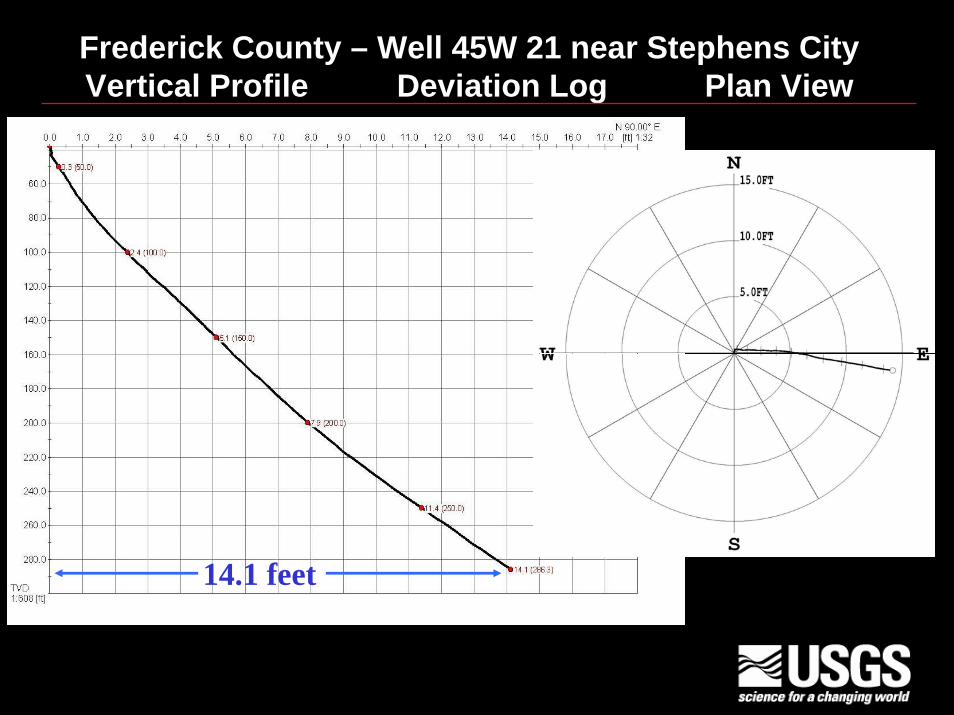
Frederick County – Well 45W 21 near Stephens CityVertical Profile Deviation Log Plan View
14.1 feet
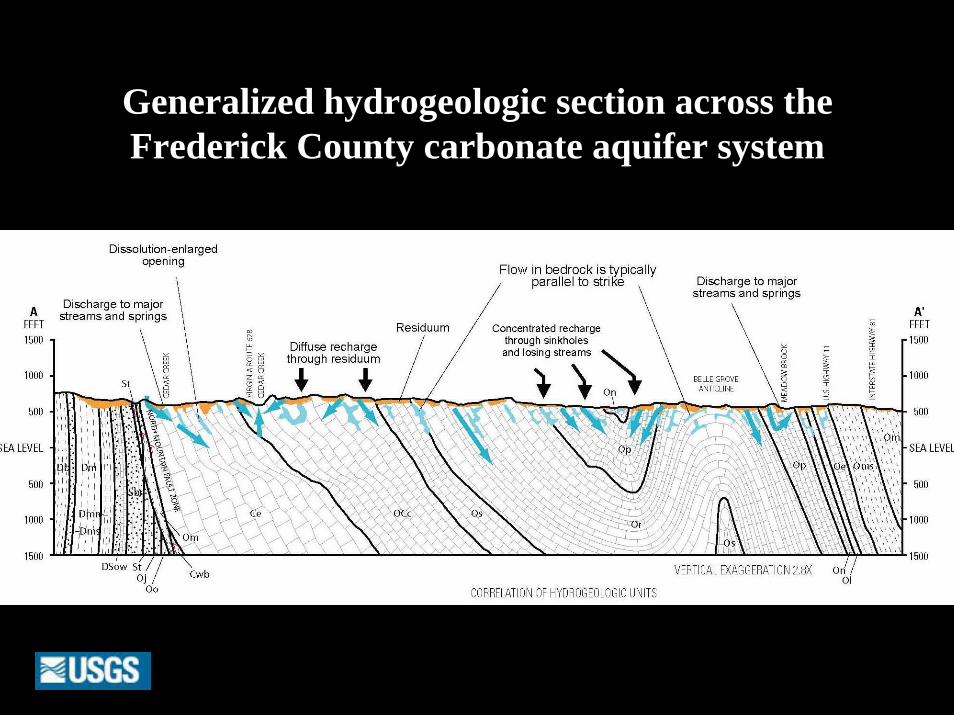
Generalized hydrogeologic section across the Frederick County carbonate aquifer system

Multidisciplinary Assessment of the Northern Shenandoah Valley in Virginia and West Virginia
• The objective of this first integrated regional assessment is tobetter characterize the aquifer systems in the Northern Shenandoah Valley and provide relevant hydrogeologic information that can be used to guide the development and management of these water resources.
• This regional study of the karst and fractured-rock aquifer systems will use hydrologic, geologic, cartographic, and biologic information to improve the understanding of the aquifer systems,their relationship to surface features, and potential hazards over a multi-county area of Virginia and West Virginia.

Study Approach for Regional System:
• Characterize karst and fractured-rock aquifer systems
• Characterize ground-water/surface water interactions• Develop numerical models to simulate the regional
and local ground-water-flow systems• Characterize water quality and sources of
degradation• Assess implications of water resources management
decisions on aquatic ecosystems
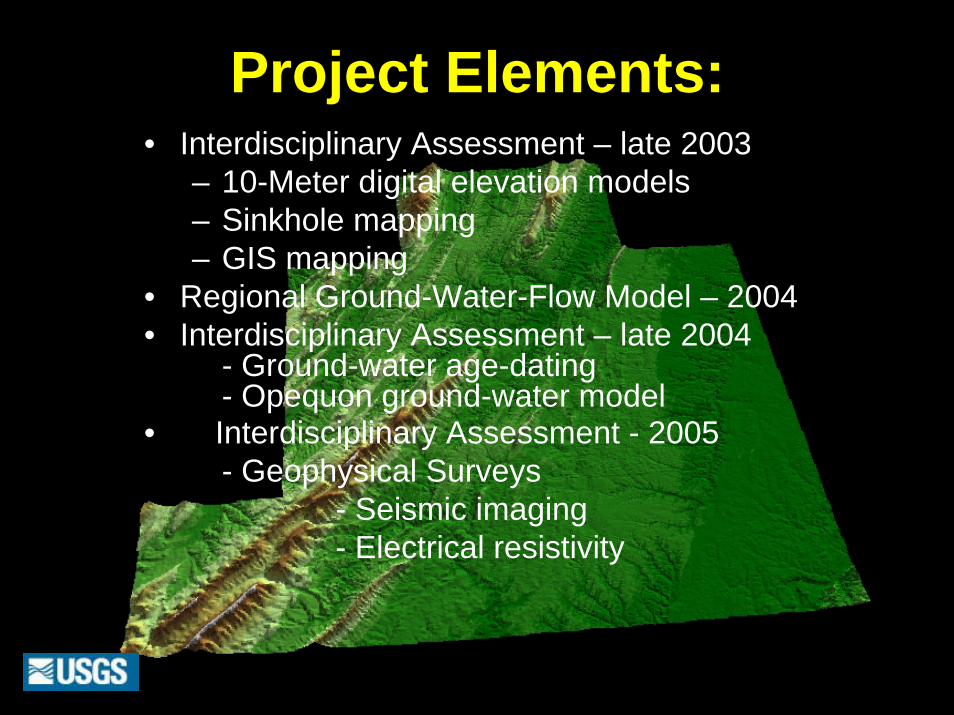
Project Elements:• Interdisciplinary Assessment – late 2003
– 10-Meter digital elevation models– Sinkhole mapping– GIS mapping
• Regional Ground-Water-Flow Model – 2004• Interdisciplinary Assessment – late 2004
- Ground-water age-dating- Opequon ground-water model
• Interdisciplinary Assessment - 2005- Geophysical Surveys
- Seismic imaging- Electrical resistivity
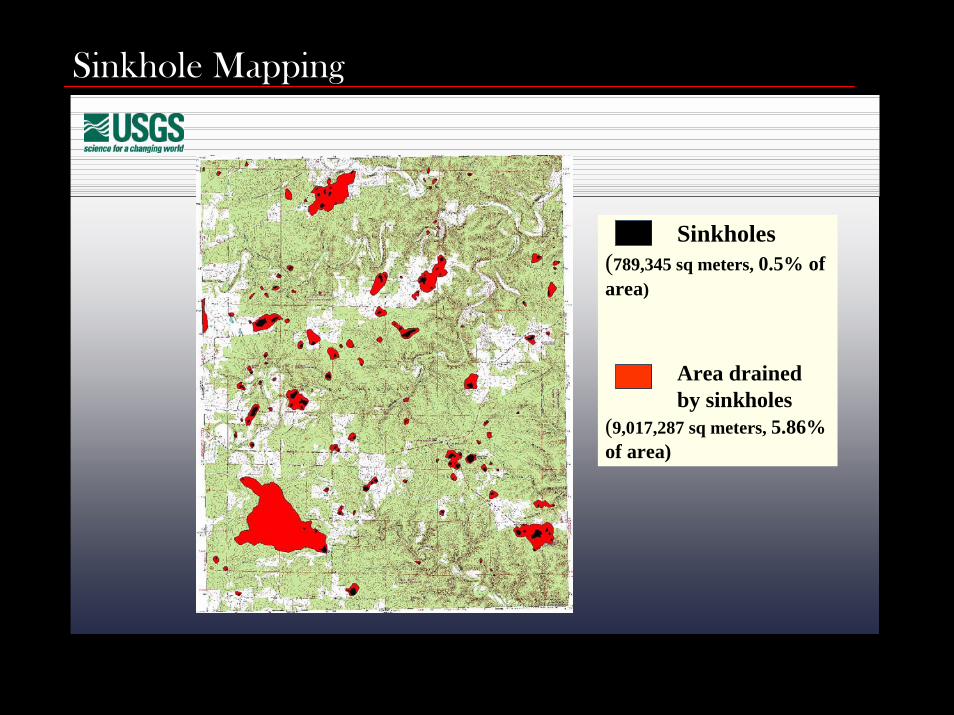
Sinkholes(789,345 sq meters, 0.5% of area)
Area drained by sinkholes
(9,017,287 sq meters, 5.86% of area)
Sinkhole Mapping
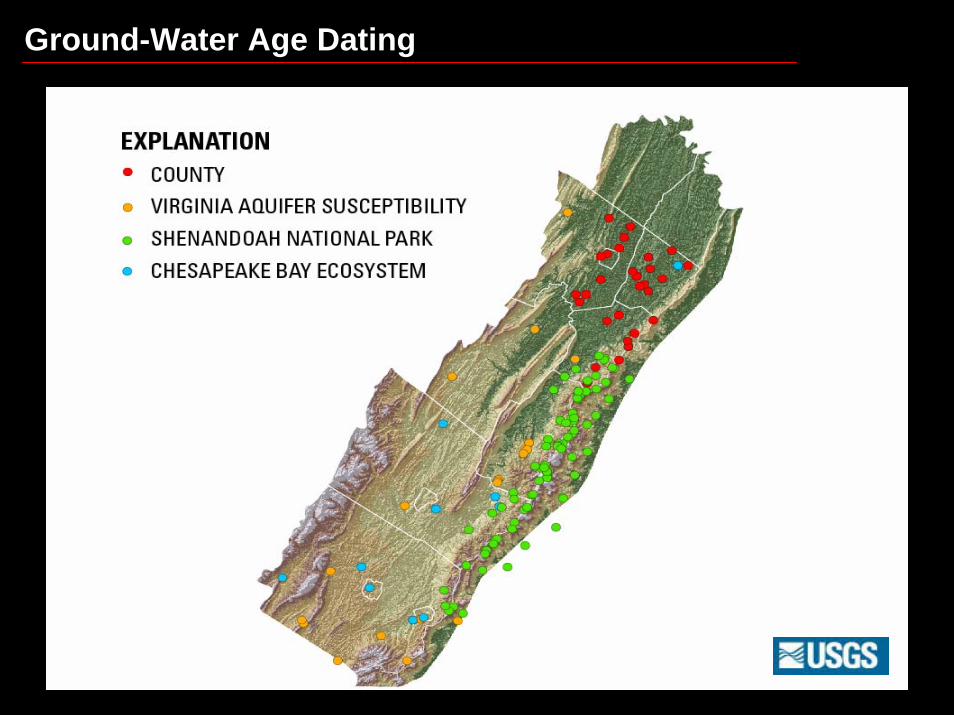
Ground-Water Age Dating
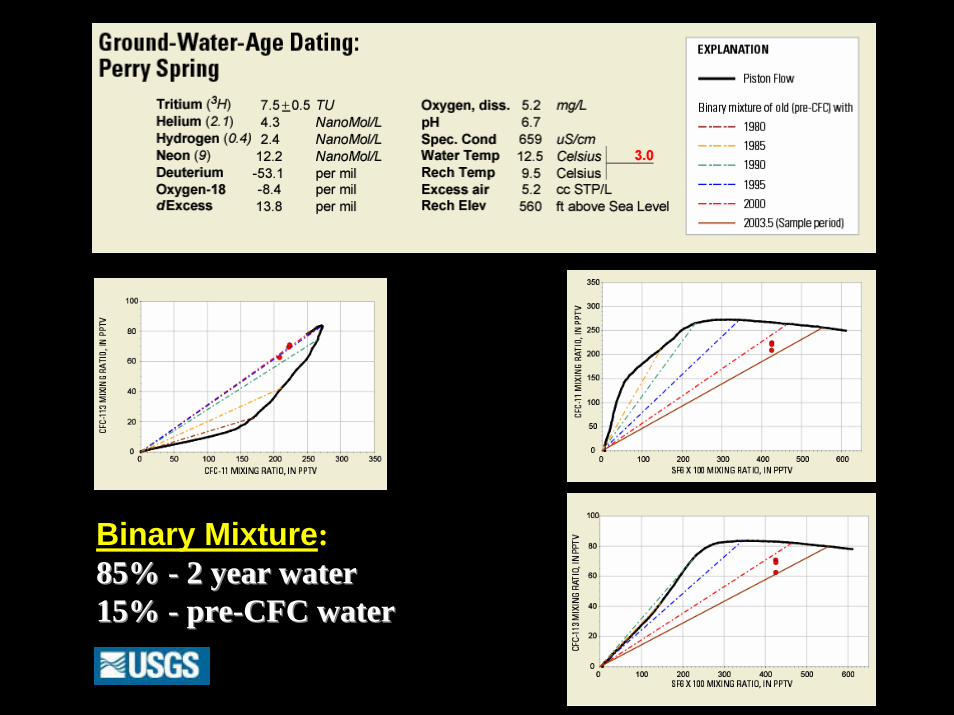
Binary Mixture:85% 85% -- 2 year water2 year water15% 15% -- prepre--CFC waterCFC water
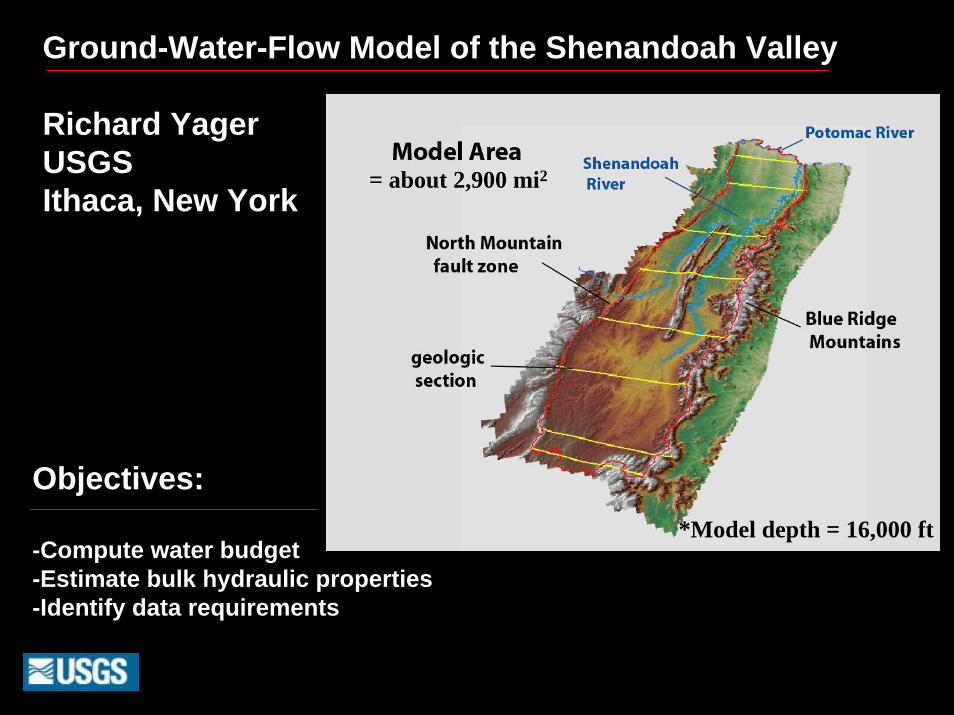
Ground-Water-Flow Model of the Shenandoah Valley
Richard YagerUSGSIthaca, New York
Objectives:
-Compute water budget-Estimate bulk hydraulic properties-Identify data requirements
= about 2,900 mi2
*Model depth = 16,000 ft*Model depth = 16,000 ft
= about 2,900 mi2
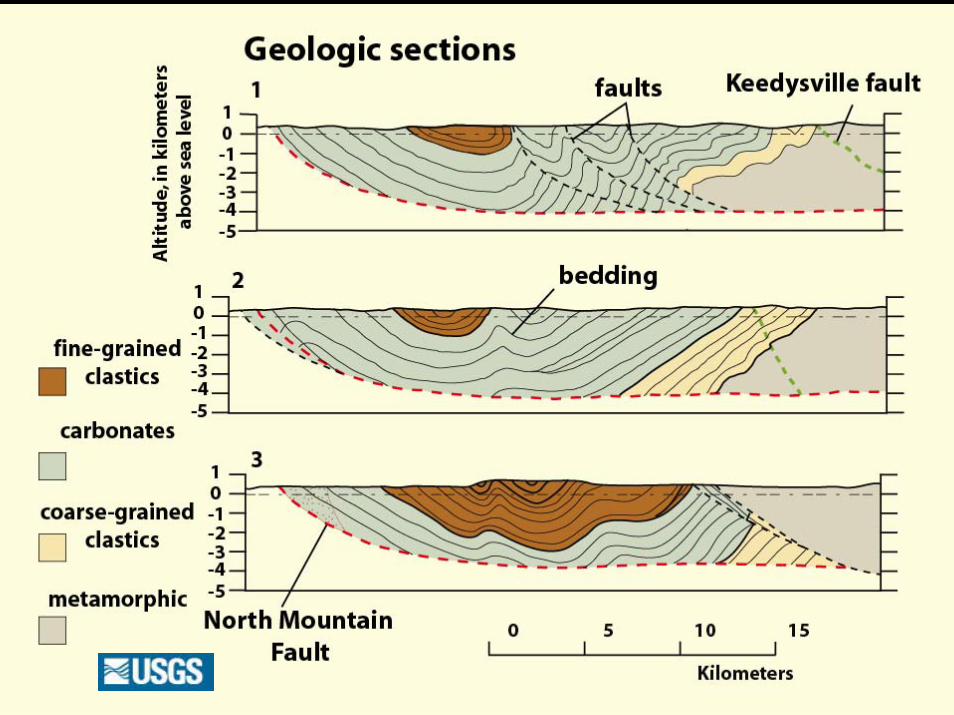
Geologic sections
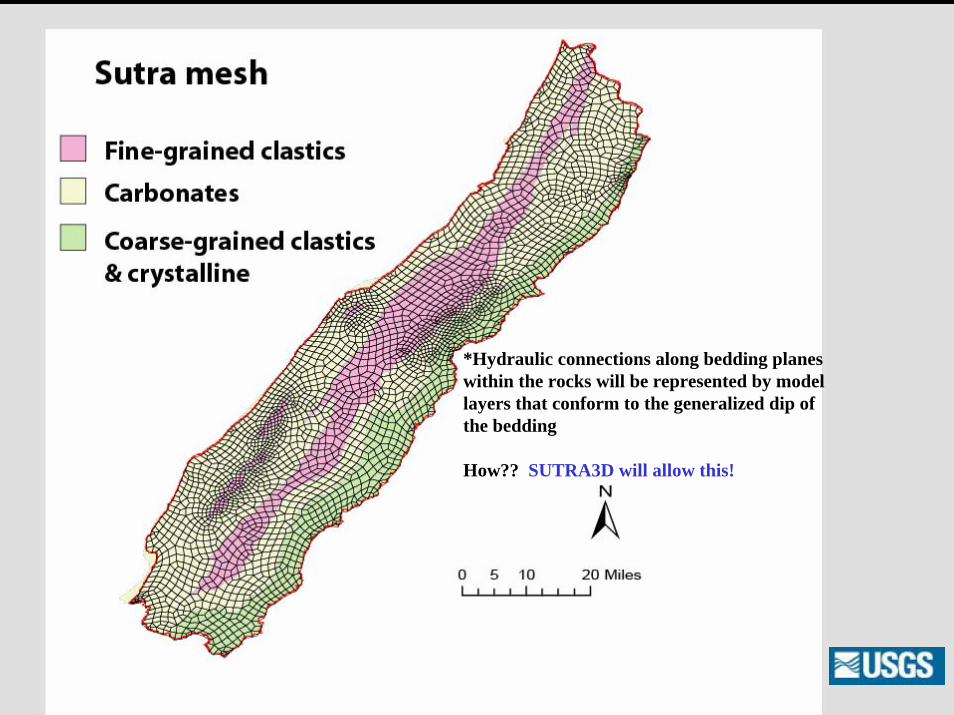
Mesh
*Hydraulic connections along bedding planeswithin the rocks will be represented by modellayers that conform to the generalized dip of the bedding
How?? SUTRA3D will allow this!
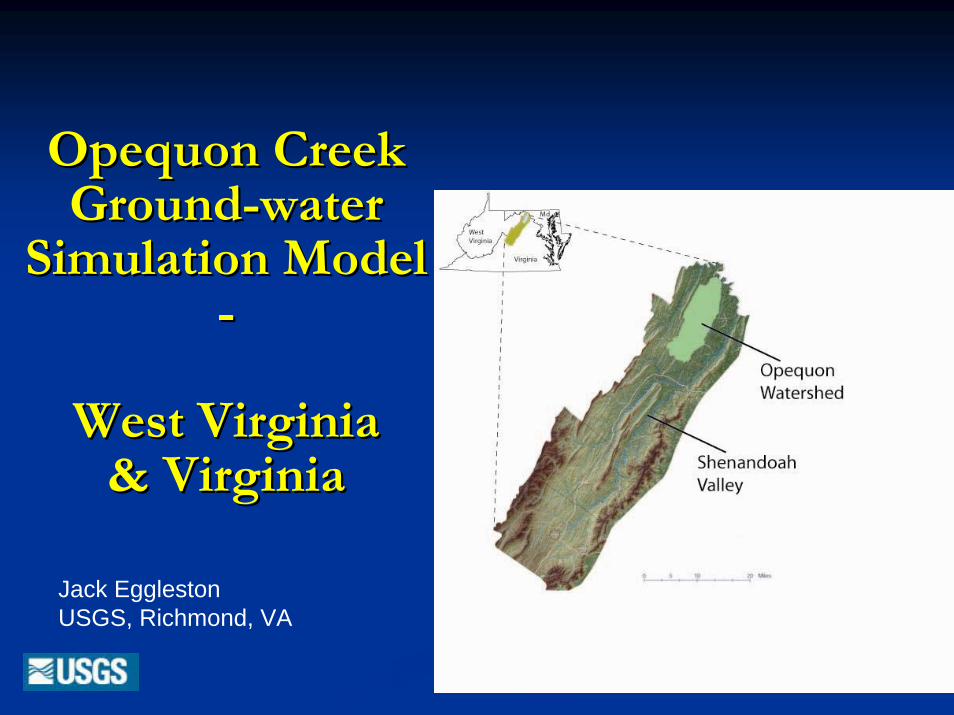
Opequon Creek Opequon Creek GroundGround--water water
Simulation ModelSimulation Model--
West Virginia West Virginia & Virginia& Virginia
Jack EgglestonUSGS, Richmond, VA
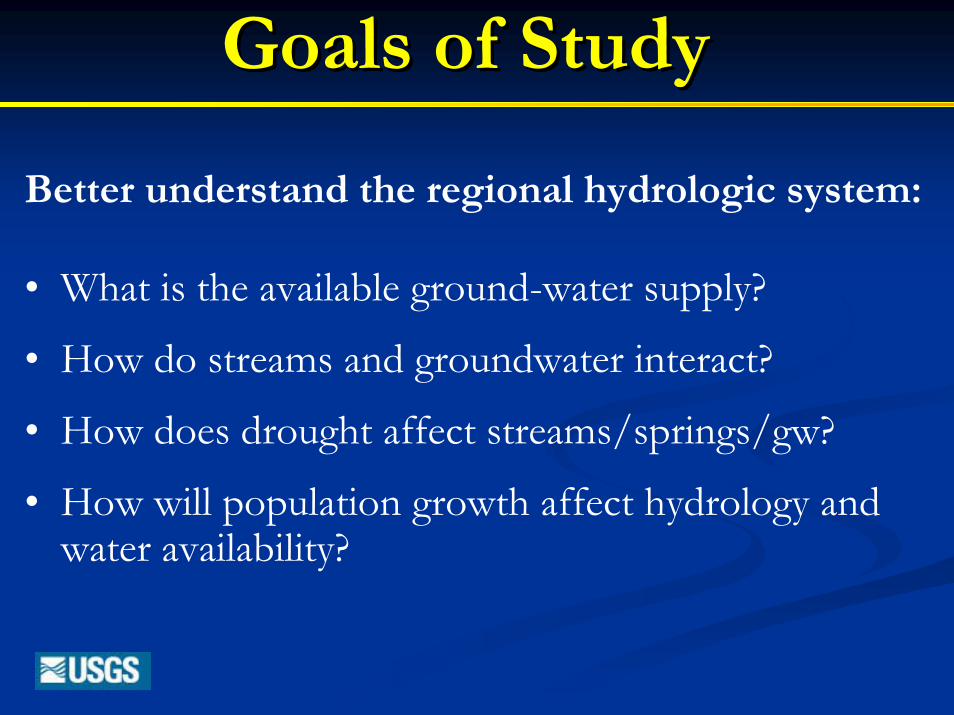
Goals of StudyGoals of Study
Better understand the regional hydrologic system:
• What is the available ground-water supply?
• How do streams and groundwater interact?
• How does drought affect streams/springs/gw?
• How will population growth affect hydrology and water availability?
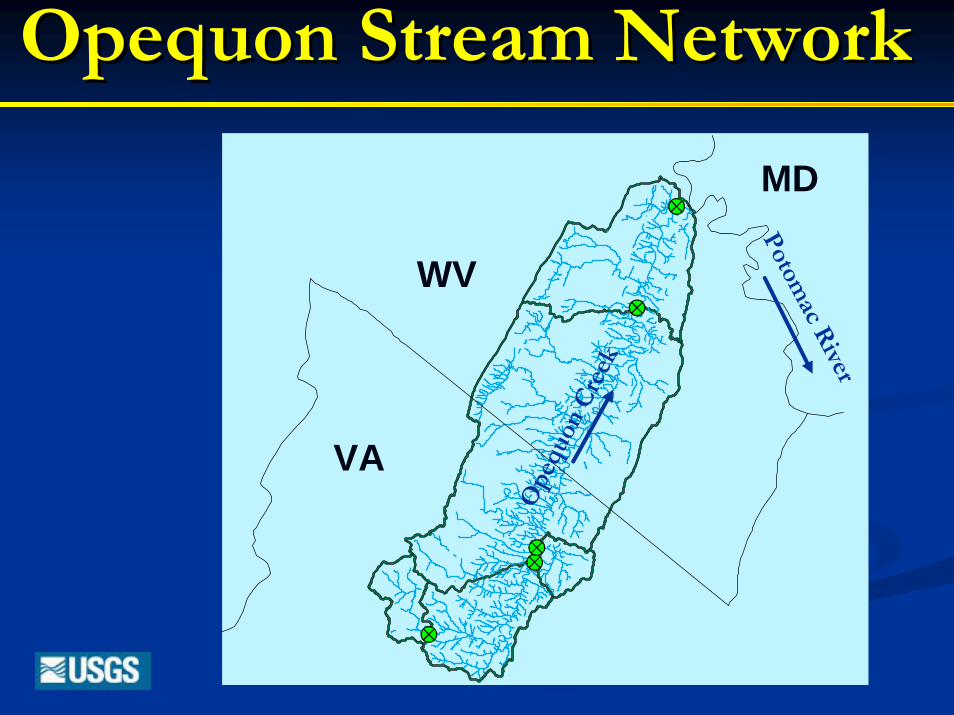
Opequon Stream NetworkOpequon Stream Network
VA
MD
WV
Potomac R
iver
Ope
quon
Cre
ek
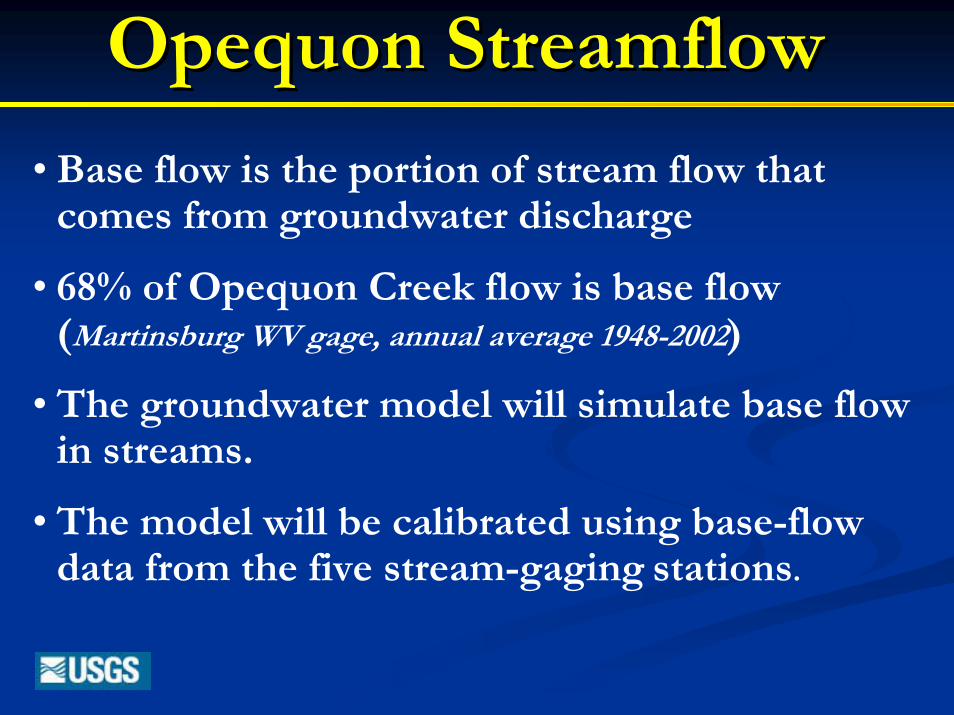
Opequon StreamflowOpequon Streamflow
• Base flow is the portion of stream flow that comes from groundwater discharge
• 68% of Opequon Creek flow is base flow (Martinsburg WV gage, annual average 1948-2002)
• The groundwater model will simulate base flow in streams.
• The model will be calibrated using base-flow data from the five stream-gaging stations.
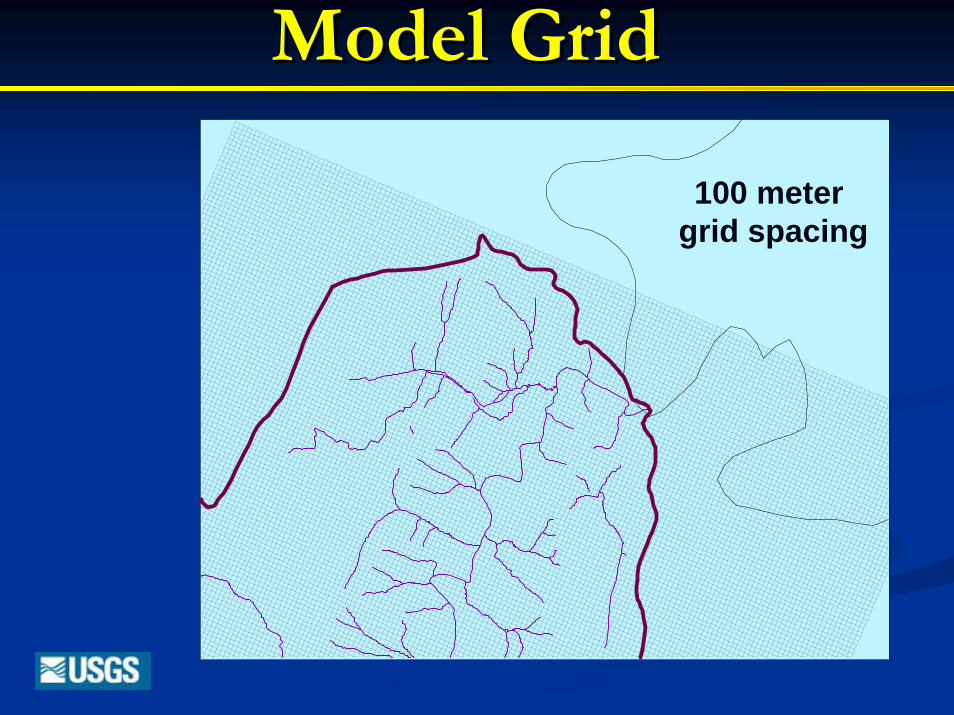
Model GridModel Grid
100 meter grid spacing
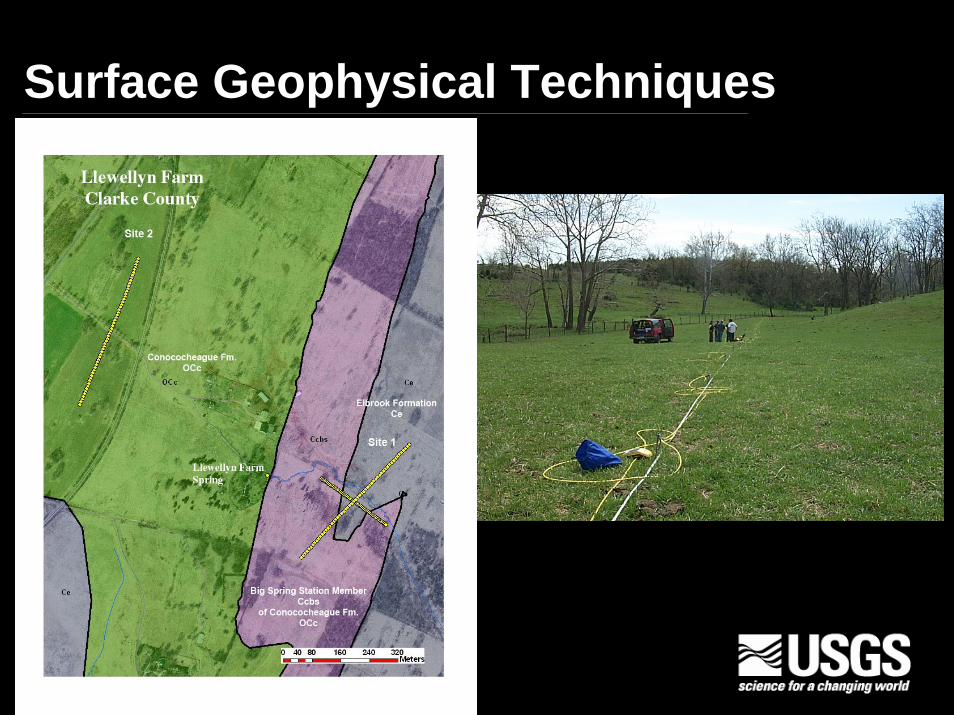
Surface Geophysical Techniques
Internet Sites
• Water Resources of Virginiahttp://va.water.usgs.gov/
• Frederick County Projecthttp://va.water.usgs.gov/projects/va134.html
• Clarke County Projecthttp://va.water.usgs.gov/projects/va146.html
• Warren County Projecthttp://va.water.usgs.gov/projects/va142.html
• Shenandoah River Minimum Instream Flow Projecthttp://va.water.usgs.gov/projects/va111.html
• Great Valley Water-Resources Science Forumhttp://va.water.usgs.gov/GreatValley/Index.htm