Embed Size (px)
Citation preview
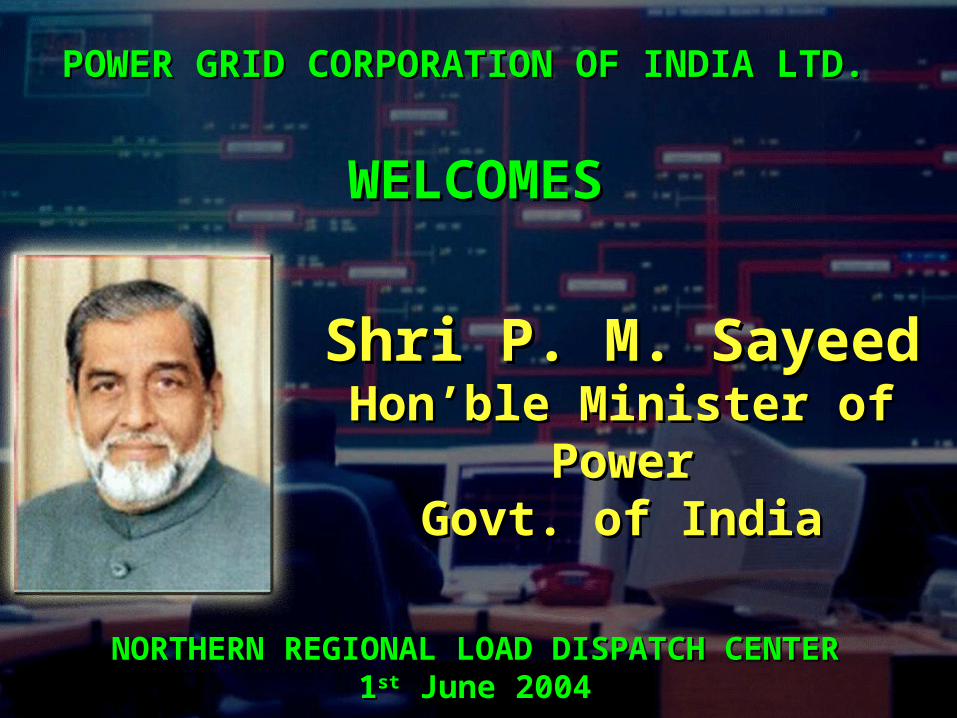
NORTHERN REGIONAL LOAD DISPATCH CENTERNORTHERN REGIONAL LOAD DISPATCH CENTER
11stst June 2004 June 2004
Shri P. M. SayeedShri P. M. SayeedHon’ble Minister of PowerHon’ble Minister of Power
Govt. of IndiaGovt. of India
WELCOMESWELCOMES
POWER GRID CORPORATION OF INDIA LTD.POWER GRID CORPORATION OF INDIA LTD.
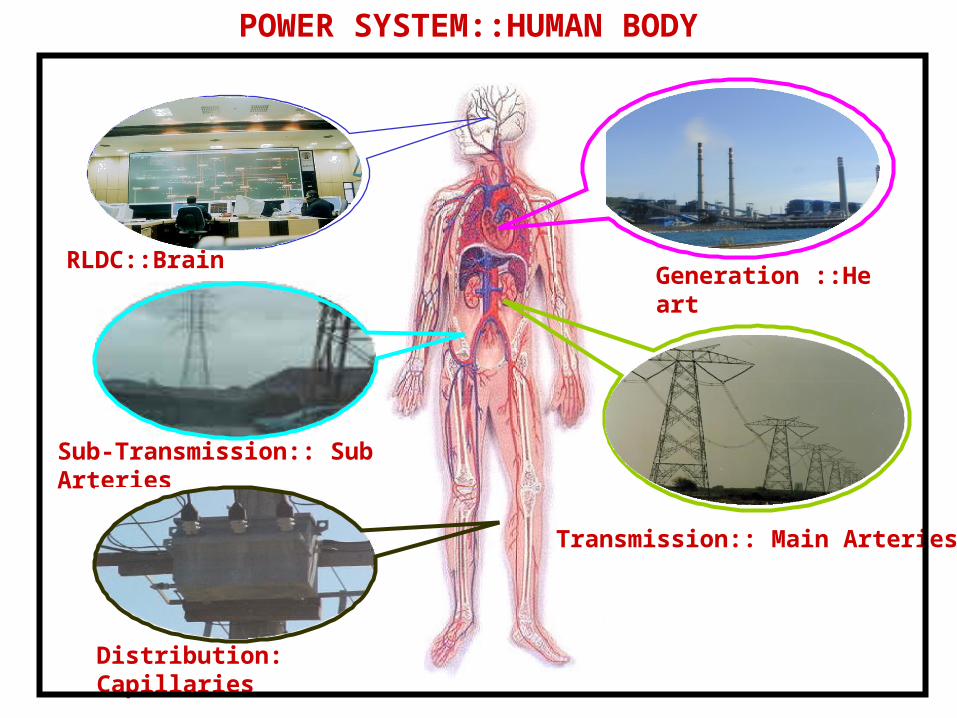
RLDC::BrainGeneration ::Heart
Sub-Transmission:: Sub Arteries
Transmission:: Main Arteries
Distribution: Capillaries
POWER SYSTEM::HUMAN BODY
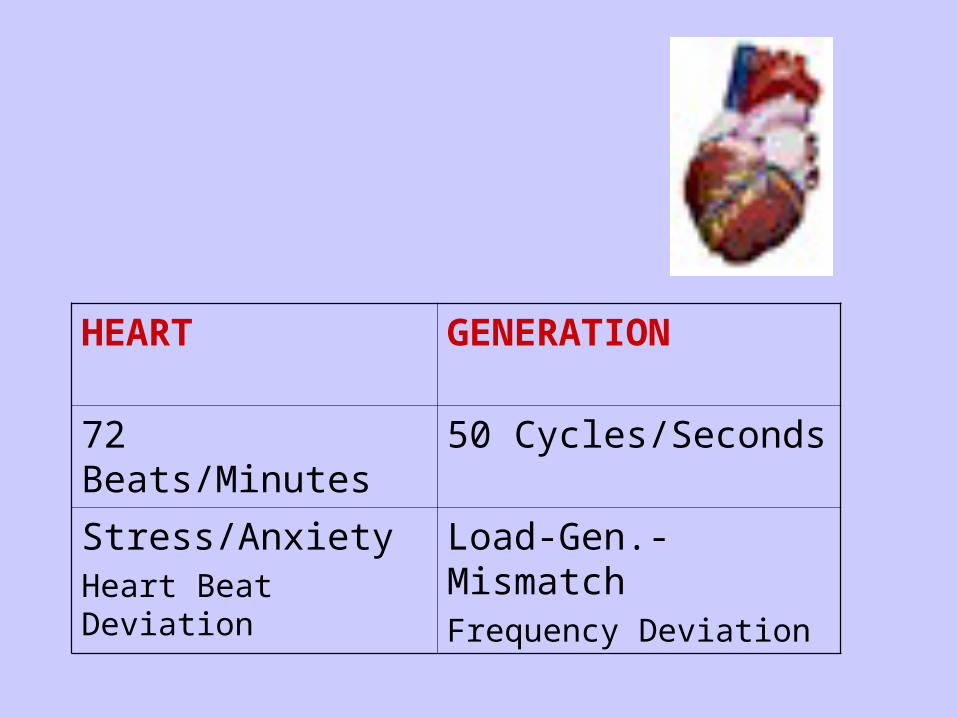
HEART GENERATION
72 Beats/Minutes 50 Cycles/Seconds
Stress/AnxietyHeart Beat Deviation
Load-Gen.-MismatchFrequency Deviation
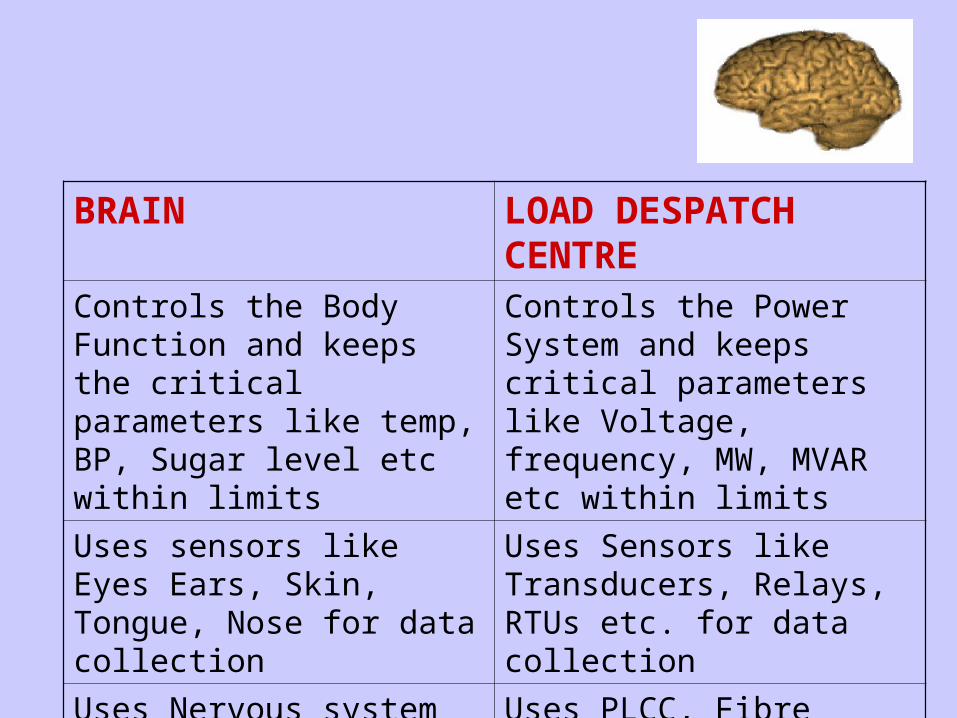
BRAIN LOAD DESPATCH CENTRE
Controls the Body Function and keeps the critical parameters like temp, BP, Sugar level etc within limits
Controls the Power System and keeps critical parameters like Voltage, frequency, MW, MVAR etc within limits
Uses sensors like Eyes Ears, Skin, Tongue, Nose for data collection
Uses Sensors like Transducers, Relays, RTUs etc. for data collection
Uses Nervous system for communication
Uses PLCC, Fibre Optics, Microwave for communication
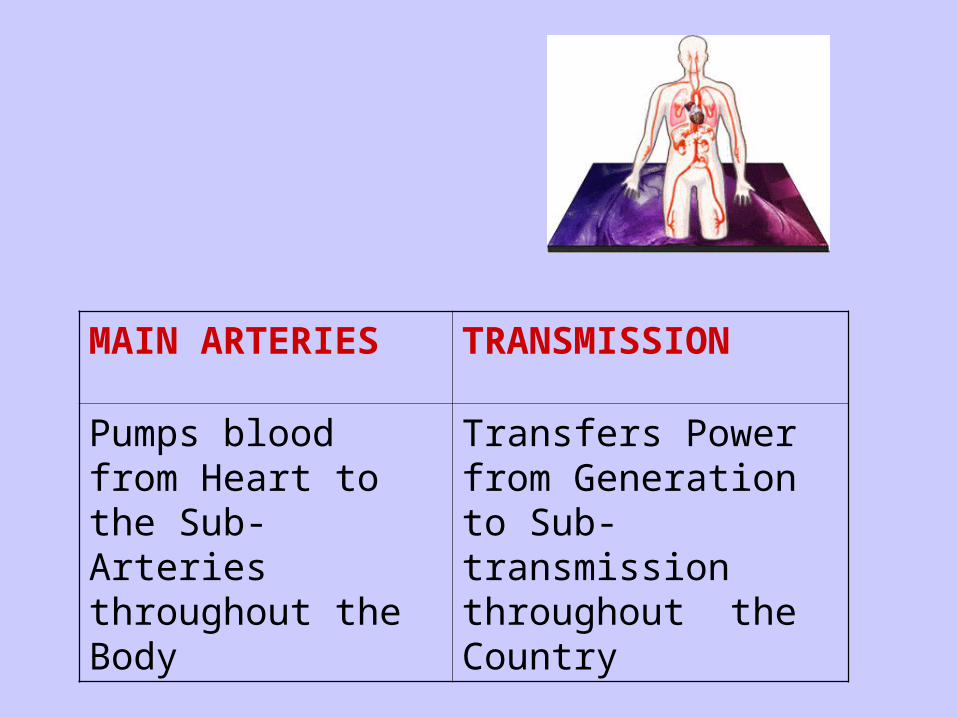
MAIN ARTERIES TRANSMISSION
Pumps blood from Heart to the Sub-Arteries throughout the Body
Transfers Power from Generation to Sub-transmission throughout the Country
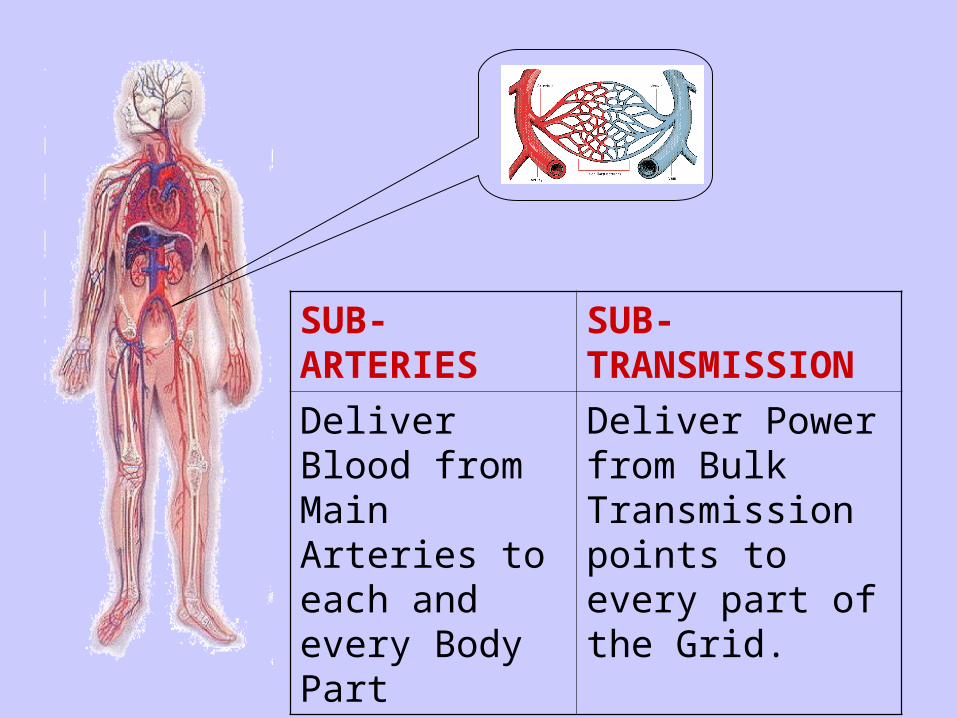
SUB- ARTERIES
SUB- TRANSMISSION
Deliver Blood from Main Arteries to each and every Body Part
Deliver Power from Bulk Transmission points to every part of the Grid.
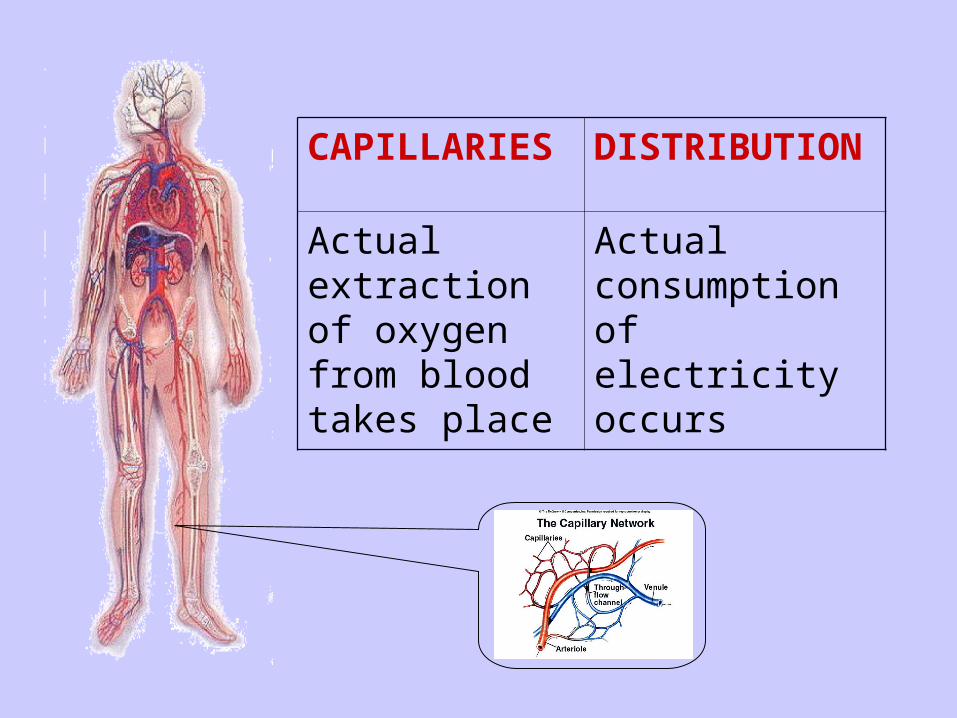
CAPILLARIES
DISTRIBUTION
Actual extraction of oxygen from blood takes place
Actual consumption of electricity occurs
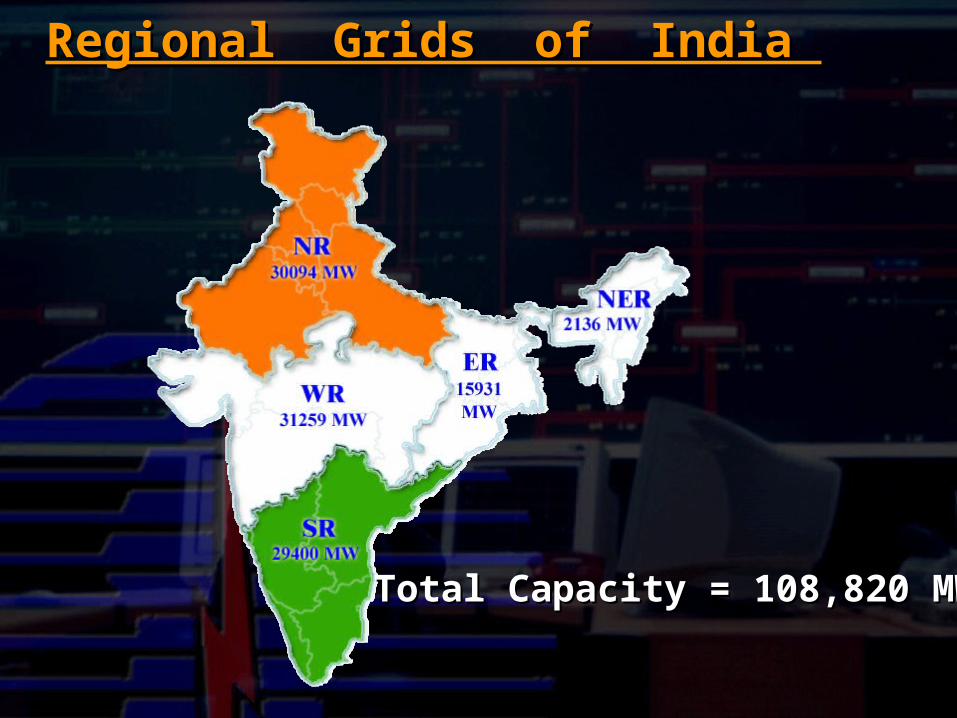
Regional Grids of India Regional Grids of India
Total Capacity = 108,820 MWTotal Capacity = 108,820 MW
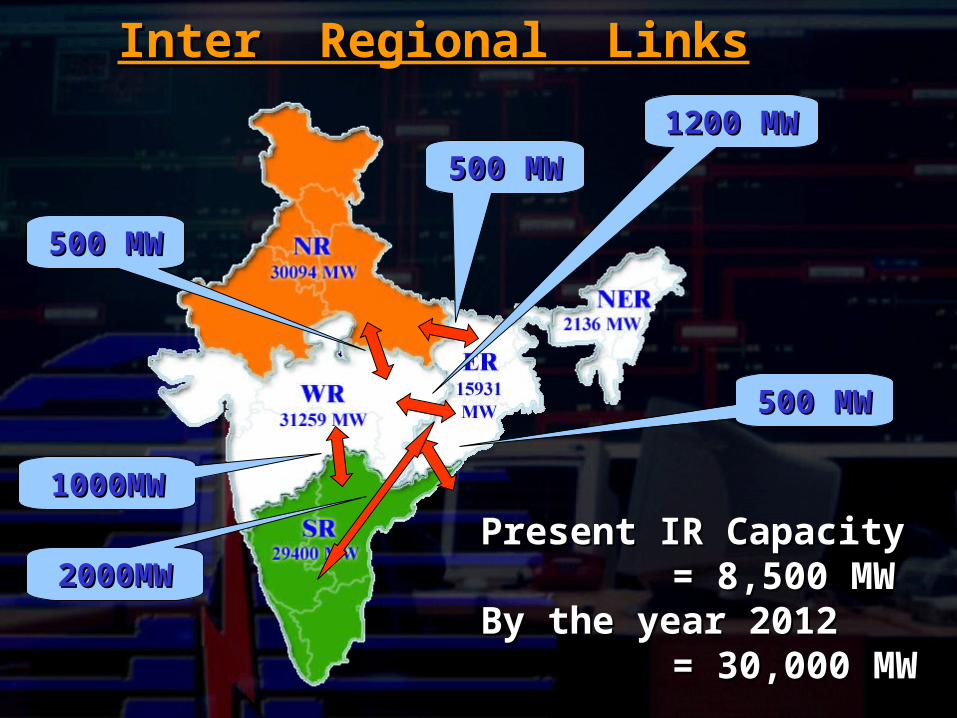
Inter Regional LinksInter Regional Links
Present IR CapacityPresent IR Capacity= 8,500 MW= 8,500 MW
By the year 2012By the year 2012= 30,000 MW= 30,000 MW
500 MW500 MW1200 MW1200 MW
1000MW1000MW
2000MW2000MW
500 MW500 MW
500 MW500 MW
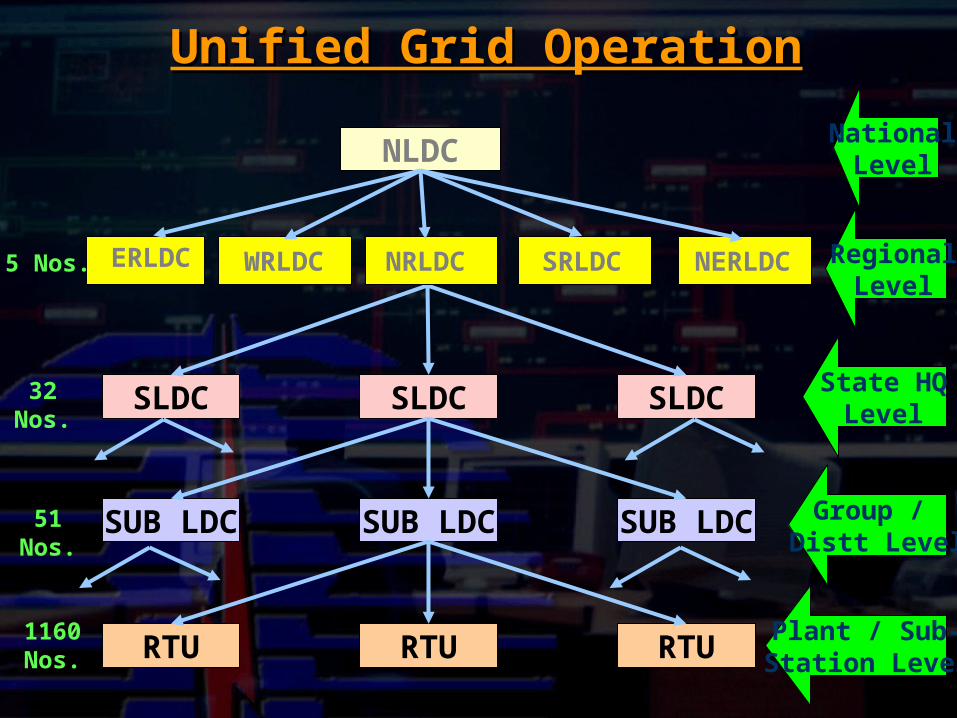
RTU RTU RTU
SUB LDC SUB LDC SUB LDC
SLDC SLDC SLDC
ERLDC
WRLDC NRLDC SRLDC
NERLDC
NLDC
32 Nos.
51 Nos.
1160Nos.
Unified Grid OperationUnified Grid Operation
5 Nos.
NationalLevel
RegionalLevel
State HQLevel
Group / Distt Level
Plant / Sub-Station Level
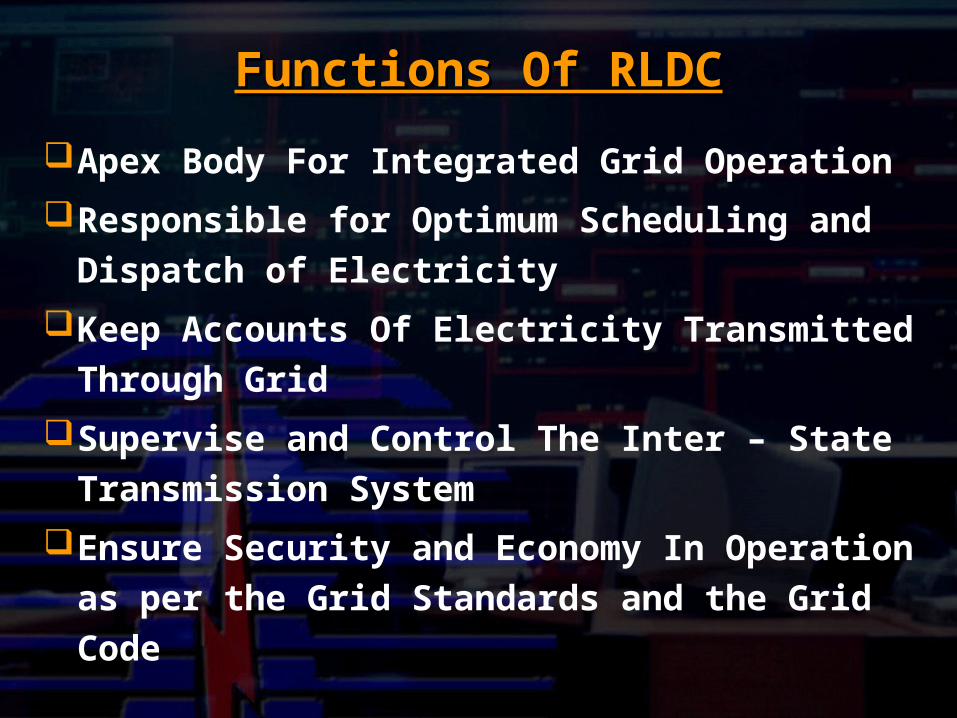
Functions Of RLDCFunctions Of RLDC
Apex Body For Integrated Grid Operation
Responsible for Optimum Scheduling and Dispatch of Electricity
Keep Accounts Of Electricity Transmitted Through Grid
Supervise and Control The Inter – State Transmission System
Ensure Security and Economy In Operation as per the Grid Standards and the Grid Code
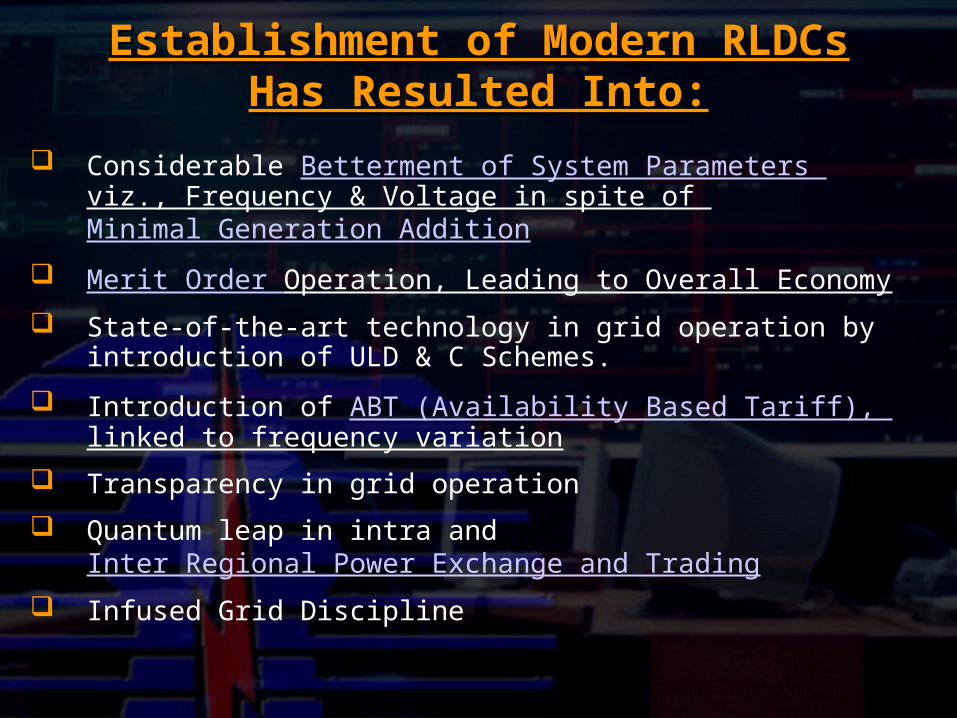
Establishment of Modern RLDCsEstablishment of Modern RLDCsHas Resulted Into:Has Resulted Into:
Considerable Betterment of System Parameters viz., Frequency & Voltage in spite of Minimal Generation Addition
Merit Order Operation, Leading to Overall Economy
State-of-the-art technology in grid operation by introduction of ULD & C Schemes.
Introduction of ABT (Availability Based Tariff), linked to frequency variation
Transparency in grid operation
Quantum leap in intra and Inter Regional Power Exchange and Trading
Infused Grid Discipline
POWERGRID’s POWERGRID’s DiversificationDiversification
intointoTelecomTelecom
To utilize spare capacity of ULDC schemes and maximize return on its transmission infrastructure, POWERGRID decided to diversify into Telecom Through an incremental investment
Telecom networks on Transmission Infrastructure Sturdy & secure
Rodent menace free
Vandalism proof
POWERGRID’s Diversification into TelecomPOWERGRID’s Diversification into Telecom
Only utility in the country providing
overhead fibre optic cable for telecom
networks
DWDM/SDH equipment deployed
Scalable to Terabit Capacity
Obtained IP-II license in Jan 2001 and ISP
Category-A license in May 2003
POWERGRID’s Diversification into TelecomPOWERGRID’s Diversification into Telecom
All India Fibre Optic Network of 20,000 kms, spread over 60
cities including all Metros & major cities
Links under commercial operation
Delhi-Lucknow -Mumbai
Delhi-Ambala-Chandigarh-Shimla-Jallandar-Jammu
Delhi- Jaipur
Ahmedabad-Mumbai-Pune
Mumbai-Hyderabad-Bangalore-Cochin
Within NER
Maintaining availability of 100% on overhead OFC network
POWERGRID’s Broadband NetworkPOWERGRID’s Broadband Network
Complete network to be in place by 2004
Chennai June, 2004
Allahabad, Kanpur, Agra June, 2004
Kolkatta, NER June, 2004
Trivandrum Sept, 2004
POWERGRID’s Broadband NetworkPOWERGRID’s Broadband Network
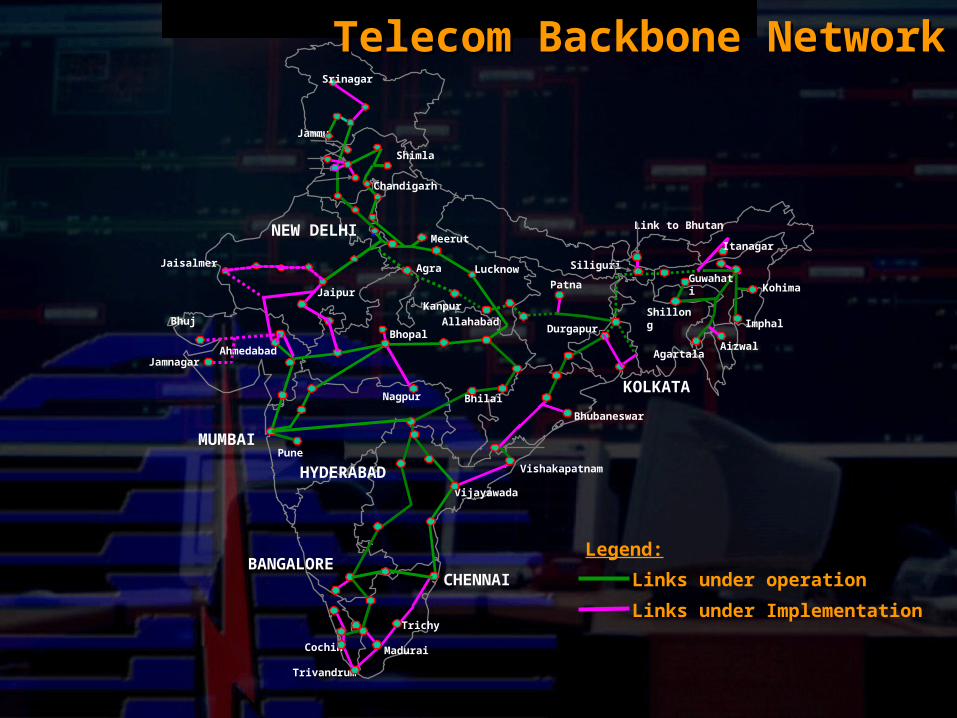
Legend:
Links under operation
Links under Implementation
NEW DELHI
Lucknow
KOLKATA
MUMBAI
HYDERABAD
CHENNAIBANGALORE
Ahmedabad
Bhilai
Kanpur
Allahabad
Chandigarh
Shimla
Jaipur
Vijayawada
Vishakapatnam
Pune
Madurai
Trichy
Agra
Jammu
Patna
Nagpur
Bhopal
Cochin
Trivandrum
Agartala
ShillongImphal
KohimaGuwahati
Bhubaneswar
Meerut
Siliguri
Link to Bhutan
Durgapur
Srinagar
Bhuj
Itanagar
Aizwal
Jaisalmer
Jamnagar
Telecom Backbone Network Telecom Backbone Network
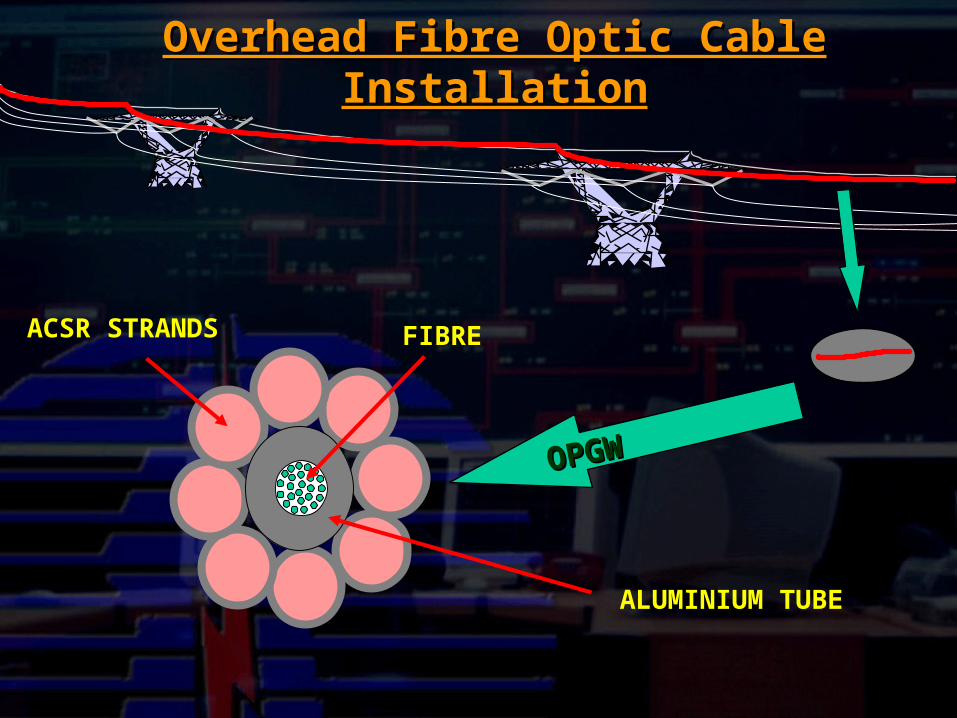
Overhead Fibre Optic Cable InstallationOverhead Fibre Optic Cable Installation
ACSR STRANDS
ALUMINIUM TUBE
FIBRE
OPGWOPGW
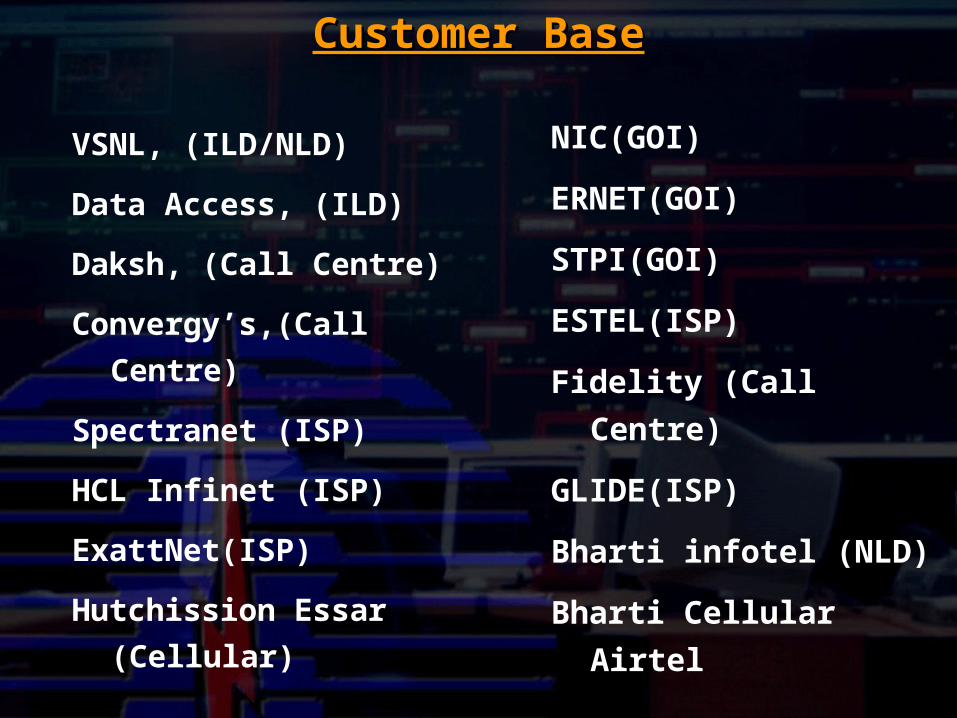
Customer BaseCustomer Base
NIC(GOI)
ERNET(GOI)
STPI(GOI)
ESTEL(ISP)
Fidelity (Call Centre)
GLIDE(ISP)
Bharti infotel (NLD)
Bharti Cellular Airtel
VSNL, (ILD/NLD)
Data Access, (ILD)
Daksh, (Call Centre)
Convergy’s,(Call Centre)
Spectranet (ISP)
HCL Infinet (ISP)
ExattNet(ISP)
Hutchission Essar (Cellular)
Thank You
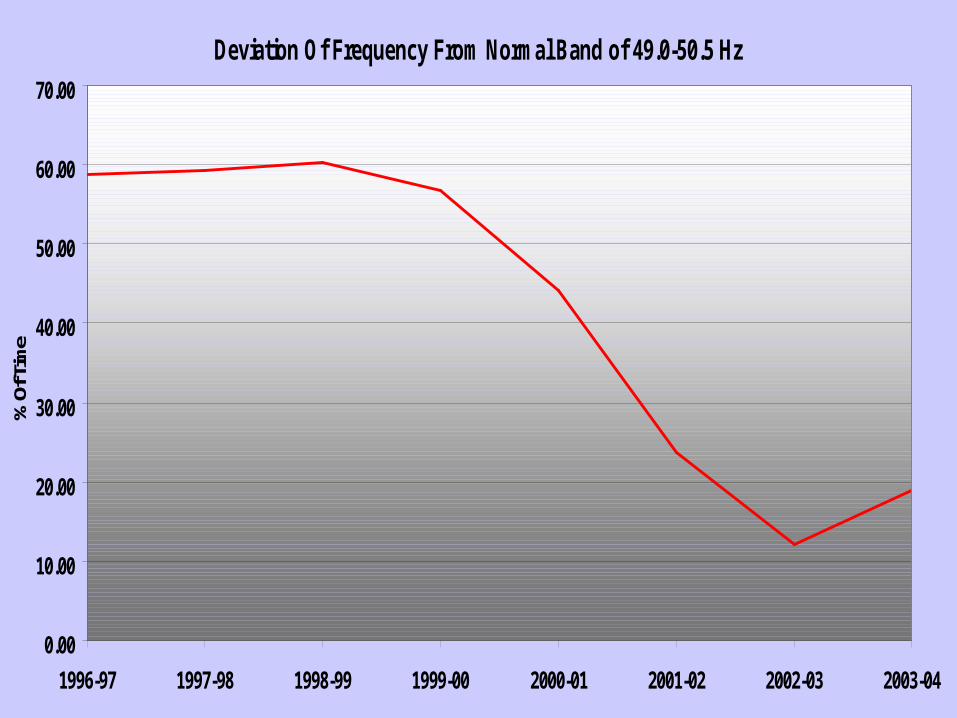
Deviation Of Frequency From Normal Band of 49.0-50.5 Hz
0.00
10.00
20.00
30.00
40.00
50.00
60.00
70.00
1996-97 1997-98 1998-99 1999-00 2000-01 2001-02 2002-03 2003-04
% O
f Tim
e
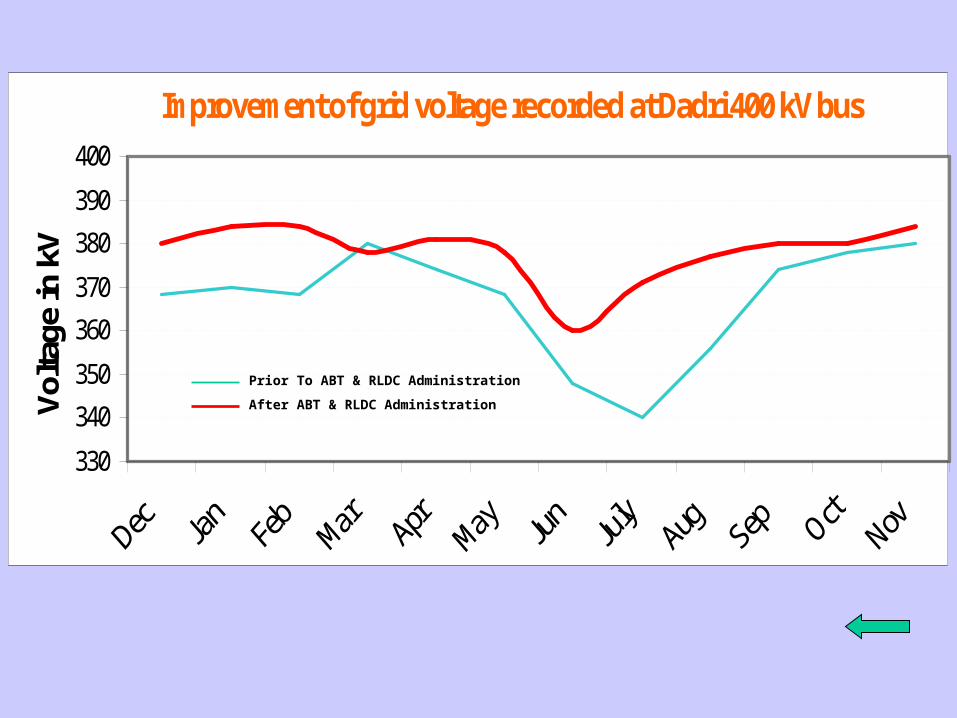
Improvement of grid voltage recorded at Dadri 400 kV bus
330
340
350
360
370
380
390
400
Vol
tage
in k
V
Prior To ABT & RLDC Administration
After ABT & RLDC Administration
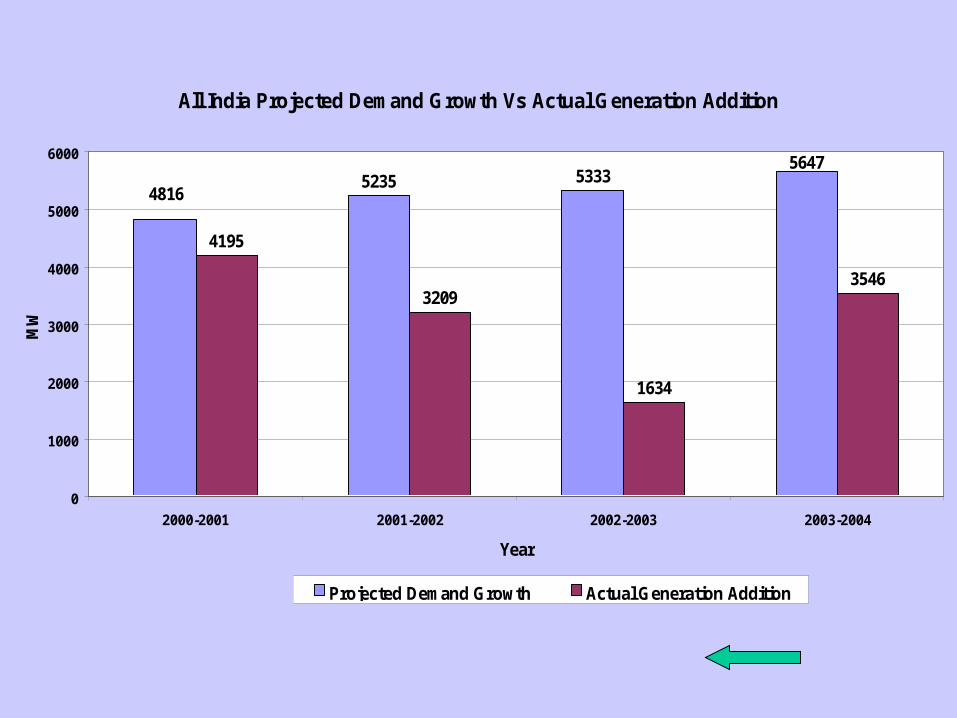
All India Projected Demand Growth Vs Actual Generation Addition
5235 5333
4195
3209
1634
3546
5647
4816
0
1000
2000
3000
4000
5000
6000
2000-2001 2001-2002 2002-2003 2003-2004
Year
MW
Projected Demand Growth Actual Generation Addition
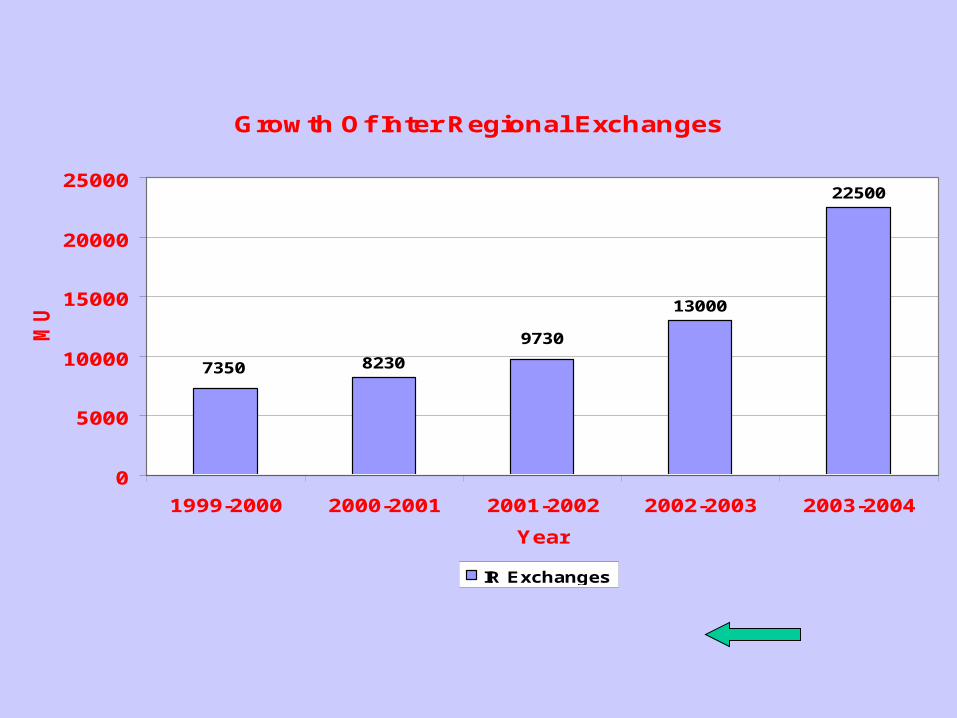
Growth Of Inter Regional Exchanges
8230
13000
22500
9730
7350
0
5000
10000
15000
20000
25000
1999-2000 2000-2001 2001-2002 2002-2003 2003-2004
Year
MU
IR Exchanges
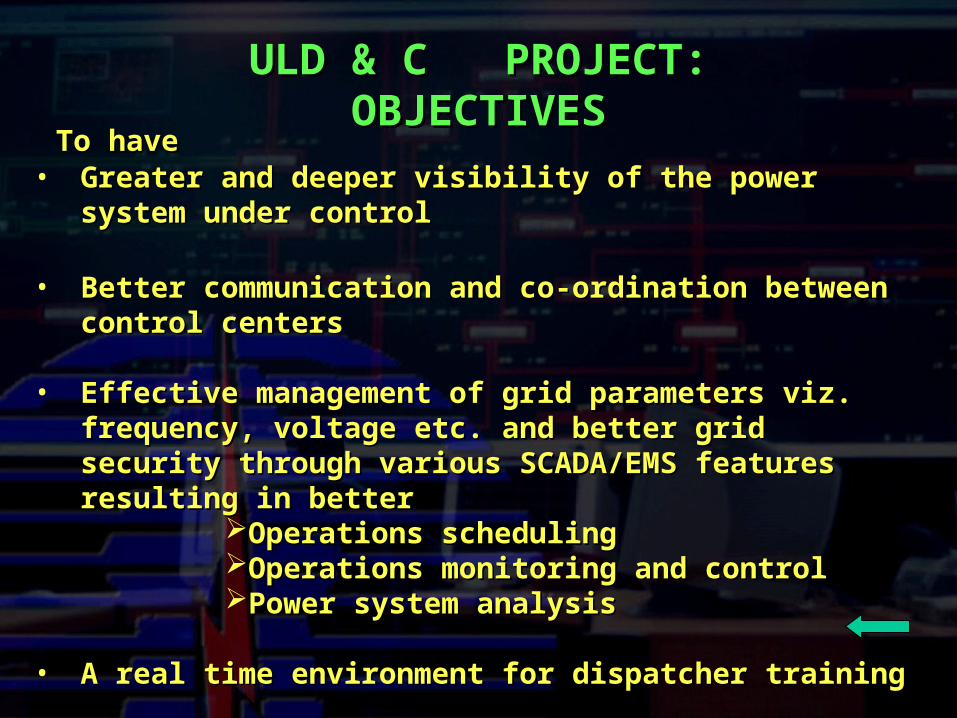
ULD & C PROJECT: OBJECTIVESULD & C PROJECT: OBJECTIVES
To haveTo have• Greater and deeper visibility of the power system Greater and deeper visibility of the power system
under controlunder control
• Better communication and co-ordination between Better communication and co-ordination between control centers control centers
• Effective management of grid parameters viz. Effective management of grid parameters viz. frequency, voltage etc. and better grid security frequency, voltage etc. and better grid security through various SCADA/EMS features resulting in through various SCADA/EMS features resulting in betterbetter
Operations schedulingOperations schedulingOperations monitoring and controlOperations monitoring and controlPower system analysisPower system analysis
• A real time environment for dispatcher trainingA real time environment for dispatcher training
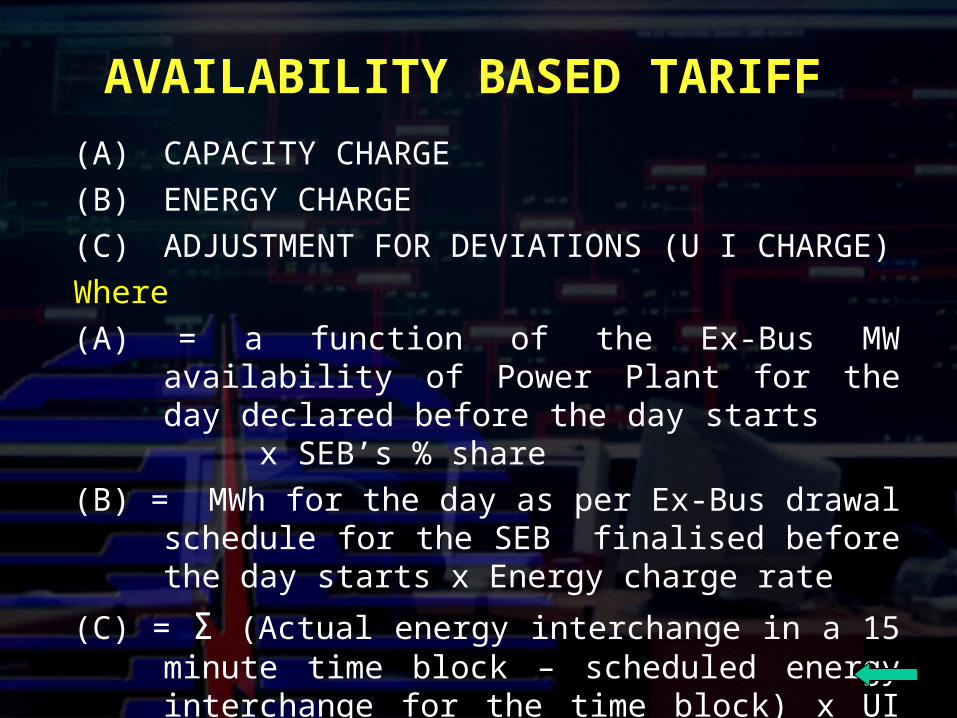
AVAILABILITY BASED TARIFF
(A) CAPACITY CHARGE
(B) ENERGY CHARGE
(C) ADJUSTMENT FOR DEVIATIONS (U I CHARGE)
Where
(A) = a function of the Ex-Bus MW availability of Power Plant for the day declared before the day starts x SEB’s % share
(B) = MWh for the day as per Ex-Bus drawal schedule for the SEB finalised before the day starts x Energy charge rate
(C) = Σ (Actual energy interchange in a 15 minute time block – scheduled energy interchange for the time block) x UI rate for the time block
TOTAL PAYMENT FOR THE DAY = (A) + (B) ± (C)