Embed Size (px)
Citation preview
NORTHERN IRELAND TECHNOLOGY GROWTH FUND
EVALUATION - FINAL
14th
December 2015
NORTHERN IRELAND TECHNOLOGY GROWTH FUND
EVALUATION
CONTENTS
Page
EXECUTIVE SUMMARY .............................................................................................................................. i
1. INTRODUCTION AND BACKGROUND............................................................................................ 1
1.1 Introduction .......................................................................................................................................... 1
1.2 The Northern Ireland Technology Growth Fund .................................................................................. 1
1.3 Invest NI’s Requirements ..................................................................................................................... 2
1.4 Methodology ........................................................................................................................................ 3
2. STRATEGIC CONTEXT AND RATIONALE .................................................................................... 5
2.1 Introduction .......................................................................................................................................... 5
2.2 Investment Rationale ............................................................................................................................ 5
2.3 Strategic Context .................................................................................................................................. 8
2.4 Summary Conclusions .......................................................................................................................... 8
3. FUND ACTIVITY ................................................................................................................................... 9
3.1 Introduction .......................................................................................................................................... 9
3.2 Establishment of the Limited Partnership and Fund Governance Procedures...................................... 9
3.3 The Investment Process ...................................................................................................................... 10
3.4 Investment Activity ............................................................................................................................ 13
3.5 Risks ................................................................................................................................................... 15
3.6 Progress towards Targets .................................................................................................................... 16
3.7 Equality Considerations...................................................................................................................... 18
3.9 Summary Conclusions ........................................................................................................................ 20
4. IMPACT OF THE FUND ..................................................................................................................... 21
4.1 Introduction ........................................................................................................................................ 21
4.2 Investment Leveraged ........................................................................................................................ 21
4.3 Employment ....................................................................................................................................... 26
4.4 Salary Levels ...................................................................................................................................... 28
4.5 Gross Value Added............................................................................................................................. 29
4.6 Wider and regional benefits ................................................................................................................ 33
4.7 Status of the Portfolio Companies ...................................................................................................... 34
4.8 Duplication and complementarity ...................................................................................................... 35
4.9 Assessing the Economic Impact of Similar Funds ............................................................................. 39
4.10 Summary Conclusions ................................................................................................................... 40
5. FUND FINANCE, RETURN-ON-INVESTMENT AND VALUE-FOR-MONEY .......................... 41
5.1 Introduction ........................................................................................................................................ 41
5.2 Summary of Income and Expenditure ................................................................................................ 41
5.3 Return-on-investment ......................................................................................................................... 42
5.4 Value-for-Money ................................................................................................................................ 42

5.5 Exit Strategy from the Fund ............................................................................................................... 45
6. CONCLUSIONS AND RECOMMENDATIONS ............................................................................... 48
6.1 Introduction ........................................................................................................................................ 48
6.2 Conclusions ........................................................................................................................................ 48
6.3 Recommendations .............................................................................................................................. 51
APPENDICES
I Detailed Evaluation Requirements
II Stakeholders participating in the Evaluation process
III Detailed Strategic Review
IV Other business support initiatives available to SMEs during the period of the Nitech
This report has been prepared for, and only for Invest NI and for no other purpose. Cogent Management Consulting
LLP does not accept or assume any liability or duty of care for any other purpose or to any other person to whom this
report is shown or into whose hands it may come save where expressly agreed by our prior consent in writing.

List of Abbreviations
Abbreviation Definition
AB Advisory Board
BERD Business Expenditure on Research and Development
CFD Corporate Finance Division
DETI Department of Enterprise, Trade and Investment
EAM Economic Appraisal Methodology
EBITDA Earnings before interest, taxes, depreciation, and amortization
EIB European Investment Bank
FCA Financial Conduct Authority
FSMA Financial Services and Market Act
FTE Full Time Employees
GB Great Britain
GVA Gross Value Added
HM Her Majesty's
HMT's Her Majesty's Treasury
Invest NI Invest Northern Ireland
IP Intellectual Property
IPR Intellectual Property Rights
IRR Internal Rate of Return
LBT Losses Before Tax
LEDU Local Enterprise Development Unit (LEDU)
LPA Limited Partnership Agreement
LPs Limited Partners
MoU Memorandum of Understanding
NED Non-Executive Director
NI Northern Ireland
NICS Northern Ireland Civil Service
NIGEAE Northern Ireland Guide to Expenditure Appraisal and Evaluation
NISPO Northern Ireland Spin Out
PPS Priority Profit Share
QUB Queen’s University Belfast
SMART Specific, Measurable, Achievable, Relevant and Time-bound
SMEs Small and Medium Sized Enterprises
TOR Terms of Reference
UK United Kingdom
UU University of Ulster
VFM Value-for-Money
VGF Viridian Growth Fund
NITECH GROWTH FUND EVALUATION - VERSION 1.0 Page i
EXECUTIVE SUMMARY
Introduction
Invest Northern Ireland (Invest NI) has commissioned Cogent Management Consulting LLP (‘Cogent’) to
undertake a post project evaluation of the Northern Ireland Technology Growth Fund Limited Partnership
(‘Nitech’ or ‘the Fund’) covering the period January 2003 to January 2013.
The Evaluation has been undertaken in line with national and regional requirements. It is compliant with
Central Government guidance including:
“The Green Book: Appraisal and Evaluation in Central Government”, HM Treasury 2003;
“The Northern Ireland Guide to Expenditure Appraisal and Evaluation (NIGEAE), Current Edition”,
Department of Finance and Personnel;
“The Magenta Book: Guidance for Evaluation”; and
“Evaluation in the Northern Ireland Civil Service: A Guide for Departments”.
The Northern Ireland Technology Growth Fund
During May 1998, the then UK Chancellor announced a £315m package of spending measures and tax
reliefs to contribute to Northern Ireland's (NI’s) economic development. Four specific investment packages
were announced, one of which was the Northern Ireland Tourism and Innovation Fund which included
provision for the creation of a £3m Research and Development Challenge Fund (RDCF) to assist in the
creation and expansion of research-led, market orientated businesses. The Fund was launched in 2003 as the
Northern Ireland Technology Growth Fund (Nitech).
Established as a pilot Fund, the stated objectives of Nitech were to:
Encourage and support research and development activities from university spin-outs and new business starts, and
to enable researchers to develop products or services that meet an identifiable market need;
Encourage enhanced levels of technology research within existing SMEs; and
Increase the volume of projects with the potential to become investment opportunities for Venture Capitalists and
Business Angels.
Initially established with a ten-year life, consisting of a 5 year investment phase and a 5 year follow-on and
portfolio management phase, Nitech was a £3m government only funded venture capital fund. The Fund
provided staged investment that ranged from £20k to £200k with a maximum investment of £250k to any
one company.
It was envisaged that two types of investments would be made, namely:
Stage 1: Research Exemplification, Proof of Principle, Construction of Prototypes - It was
anticipated that Stage 1 investments would range between £20k and £45k and would be used to fund
crucial experiments either to prove scientific prototypes or to exemplify research in more detail,
construct prototypes and ultimately enable the potential business opportunity to get to the stage where
external investors might consider direct involvement, or where industry might undertake joint ventures
for further development, licensing etc.; and
Stage 2: Development Programmes - Stage 2 investments were provided when research had been
sufficiently exemplified to bring the technology to the stage that demonstrators would be produced for
evaluation by potential customers and joint venture partners or to develop the technology to create initial
products for sale. It was anticipated that Stage 2 investments would range between £50k and £150k.
NITECH GROWTH FUND EVALUATION - VERSION 1.0 Page ii
Strategic Context and Rationale
During the period under review, there was a need for Government to provide support to address a gap in the
continuum of the supply of finance for deals up to £2m for start-up and early growth businesses. This gap
arose due to (amongst other things) key structural market failures and other structural issues associated with
the NI Economy.
In line with Government’s strategic focus, the provision of venture capital through Nitech offered the
potential to promote a continuum of funds, create a deal flow chain across seed, early and development funds
and retain and build on skills and capability of venture capitalists. In doing so, the Fund offered the potential
to “help eliminate the real and perceived barriers to growth” faced by SMEs.
Operation and Delivery
Between April 2003 and November 2013, Nitech invested c. £2.92m in a total of 16 companies. £70k was
invested in 3 companies to support them to exemplify their research and/or construct a prototype (Stage 1),
whilst the remainder (£2.85m) were made in 13 businesses to undertake more fundamental R&D to support
the development of novel products and services (Stage 2). The number and level of Stage 1 investments was
lower than anticipated at the outset of the Fund, whilst the levels of demand for Stage 2 investments was
relatively higher than anticipated.
Whilst other more financially attractive initiatives existed within the marketplace which supported
businesses to undertake Stage 1type activities, the size of the Fund meant that there was a limited
opportunity to provide follow-on investment to support the scaling of businesses and make them an attractive
proposition for acquisition. The lack of availability of follow-on funding also resulted in the dilution of the
Fund’s shares and prevented the Fund from participating in subsequent funding rounds., This in-turn meant
that the Fund Manager had a lack of ability to influence the investment terms of these rounds (which were set
by the incoming investors) many of which included liquidation preferences, allowing these later investors to
realise repayment of their investment on exit, ahead of investors (such as Nitech) from previous rounds.
Whilst the Fund was, in retrospect, too small to fully address the follow-on needs of NI businesses at that
time, we note that it was created as a pilot Fund during a period when the importance of the role of seed and
early stage finance (including VC finance) was potentially less well known amongst economic development
agencies in NI and further afield, hence there was a lack of public sector initiatives available to support local
SMEs.
Based on all available evidence, the Fund appears to have been appropriately managed by the Fund Manager
who undertook their roles and responsibilities in accordance with the Limited Partnership Agreement which
included undertaking commensurate levels of technical and market due diligence in advance of investing,
stimulating deal flow and subsequently playing an active and supportive mentoring role within the portfolio
companies.
Fund Impact
During the Nitech funding rounds an additional £13.3m was invested in the 16 companies, 75% (or c.
£9.94m) of which came from private sector sources and the remaining 25% (or c. £3.36m) was derived from
public sector sources. The analysis suggests that, the Fund may have directly supported the 16 companies to
leverage between £6.7m to £10.6m in net additional investment, of which between £5m and £7.9m came
from private sector sources.
Of the 16 businesses that received investment through the Fund, 11 businesses no longer exist and 5
businesses are continuing to operate. As of September 2015, there have been no successful exits. The Fund
Manager’s updated estimates of the value of the Fund’s investments for companies that continue to exist
indicate that the potential value of these investments is c. £418k, which is significantly below their value at
cost.
NITECH GROWTH FUND EVALUATION - VERSION 1.0 Page iii
Only 1 of the 5 existing investments have been valued by the Fund Manager in excess of its value at cost and
the Fund Manager has confirmed that the Fund is likely to see a return during 2016. Whilst the progression
of the 16 portfolio companies to date, has performed below expectations, it’s performance should be viewed
in the context of:
Its relatively small size and associated inability to provide adequate levels of follow on funding, to
support the growth and scaling of the businesses and mitigate against any dilution of the Fund’ shares
value;
The limited number of other equity funds and low levels of investor readiness support that existed
during the early years of Nitech;
The depressed macro-economic climate (particularly from 2008 onwards) is likely to have impacted on
company scaling and growth, resulting in companies with insufficient sales or profitable growth to
become attractive acquisition targets; and
There was a general lack of acquisition activity across NI (and the UK) during the period under review
(largely due to the economic climate which drove higher levels of risk aversion and negatively impacted
on the availability of finance).
In the absence of undertaking primary research with businesses that received investment, the Evaluation
Team cannot definitely conclude on the levels of additionality and displacement. However, discussions with
Invest NI and the Fund manager suggest that Nitech played a pivotal role in supporting the businesses to
lever investment (and hence additionality levels were high and the risk of displacement was low.
The analysis indicates that Nitech may have directly contributed to creating and/or maintaining between 483
and 720 FTE job years. A total of 75 NI-based FTEs continue to be employed in 5 of the 16 portfolio
companies that continue to operate. The application of the calculated levels of additionality, suggests that,
depending on which additionality scenario is selected, Nitech has directly contributed to creating and
potential safeguarding of between 38 and 56 of the jobs that continued to exist in 2014. The analysis
indicates that Nitech is likely to have created, maintained and safeguarded a significant proportion of jobs
with salaries in excess of the NI private sector median;
The analysis suggests that the portfolio companies potentially cost the NI economy £559k in gross GVA (net
of the investment made through Nitech). However, much of the expenditure that has contributed to the
negative GVA impacts was as a result of considerable expenditure on undertaking further R&D activities,
and thus contributing to other strategic goals within an NI context, such as increasing levels of Business
Expenditure R&D (BERD).
The investment made through Nitech may have directly cost the NI economy between £116k (Scenario 1)
and £419k (Scenario 2) in net additional GVA to the NI economy. Given the level of investment made in
each of the portfolio companies suggests that the investment made through Nitech potentially cost the NI
economy between £0.04 and £0.14 in net additional GVA for every pound invested through the Fund.
In addition to the aforementioned benefits, the analysis suggests that the investment made through Nitech has
contributed to delivering a number of wider (e.g. knowledge transfer, skills development, entrepreneurship
etc.) and regional benefits (degree of R&D being injected and innovative nature of the project) to the NI
economy.
Progress towards targets
Whilst the Evaluation Team is unable to draw direct comparisons between the anticipated deal flow activity
targets and the actual outturn, the Fund achieved or partially achieved all other activity targets. We do
however note that the designation of target achievement masks the overall outcomes of the companies
invested in, which was below that anticipated.
NITECH GROWTH FUND EVALUATION - VERSION 1.0 Page iv
Fund Finance
The full economic cost of delivering the Fund over its ten year life was £3.96m, which was broadly aligned
to the anticipated costs (£4m (inclusive of the Fund extension). Fund administration costs (direct fund costs
plus priority profit share (PPS)) represented just over one-quarter (26% or c. £1.1m) of the full economic
cost.
A total of c. £868k of management fees (PPS) were paid to the Fund Manager over the period, representing
c. 22% of total Fund costs (inclusive of direct fund costs, PPS and investment in portfolio companies). Based
on the Evaluation Team’s understanding of the management fees paid on other Funds (which Invest NI
confirmed can typically range between 20% and 30%), the proportion of Fund costs allocated to the Fund
Manager appears reasonable.
During the period under review there were no realisations from the investments and there has been no capital
return to Invest NI.
Return-on-investment
Given the calculated levels of net additional GVA (between (£116k) and (£419k)) and the full economic
costs (£3.96m) suggests that the Fund may have potentially cost the NI economy between £0.03 and £0.11 in
net additional GVA for every pound invested.
Value-for-Money
In the absence of the original approval documentation (Economic Appraisal and Casework) it is difficult to
ascertain what value-for-money (VFM) was anticipated to be in the context of Nitech. However, based on all
available evidence, including the overall performance of the Fund, we conclude that the Nitech Fund has not
delivered VFM during the period under review.
Whilst Nitech did not deliver VFM as a standalone Fund/intervention, a number of key learning points were
identified during the delivery of the Fund which were subsequently built into the administration and
operation of subsequent Access to Finance Initiatives provided by Invest NI (e.g. in NISPO).The integration
of these learning points potentially paved the way for subsequent Funds to realise VFM.
Exit Strategy from the Fund
The Evaluation Team understands that the Fund Manager agreed to actively manage or closely monitor the
progress of the 5 companies that are continuing to operate until the end of 2014 (at no additional cost).
However, these investments are, at present, sitting in abeyance with the Fund Manager not contractually
required to provide ongoing support to the companies on behalf of the Nitech Fund. We therefore
recommend that Invest NI takes appropriate action in a timely manner to ensure that the investments are
appropriately supported and monitored.
Discussions with the Fund Manager indicate that a number of Options could be taken forward including:
Option 1: Return Shares to LP
Option 2: Sell the portfolio to a secondary buyer
Option 3: Manage-out the portfolio
Option 4: Transfer the shares under the Co-Fund NI umbrella
Whilst the financial implications of taking forward each of these options would need to be fully assessed by
Invest NI in conjunction with the Fund Manager, Option 4 would possibly be the least disruptive Option and
may facilitate further follow-on support to be provided to protect the valuation position of the outstanding
investments.

NITECH GROWTH FUND EVALUATION - VERSION 1.0 Page v
Recommendations
1. Invest NI should ensure to takes appropriate action in a timely manner to ensure that all existing
investments in companies that are continuing to operate are appropriately supported and monitored. This
should include providing consideration to the operational merits and associated costs of each of the
identified potential exit strategies.
2. As part of the development of future funds, cognisance should be taken of the need to establish funds
that are of a suitable size to facilitate appropriate levels of follow-on investment.
NITECH GROWTH FUND PPE - VERSION 1.0 Page 1
1. INTRODUCTION AND BACKGROUND
1.1 Introduction
Invest Northern Ireland (Invest NI) has commissioned Cogent Management Consulting LLP
(‘Cogent’) to undertake a post project evaluation of the Northern Ireland Technology Growth Fund
Limited Partnership (‘Nitech’ or ‘the Fund’) covering the period January 2003 to January 2013.
The Evaluation has been undertaken in line with national and regional requirements. It is compliant
with Central Government guidance including:
“The Green Book: Appraisal and Evaluation in Central Government”, HM Treasury 2003;
“The Northern Ireland Guide to Expenditure Appraisal and Evaluation (NIGEAE), Current
Edition”, Department of Finance and Personnel;
“The Magenta Book: Guidance for Evaluation”; and
“Evaluation in the Northern Ireland Civil Service: A Guide for Departments”.
This section of the report considers the background to Nitech and the overall objectives of the
Evaluation.
1.2 The Northern Ireland Technology Growth Fund
1.2.1 Background to the Development of the Fund
During May 1998, the then UK Chancellor announced a £315m package of spending measures and tax
reliefs to contribute to Northern Ireland's (NI’s) economic development. Four specific investment
packages were announced, one of which was the Northern Ireland Tourism and Innovation Fund
which included provision for the creation of a £3m Research and Development Challenge Fund
(RDCF) to assist in the creation and expansion of research-led, market orientated businesses. The
Fund was launched in 2003 as the Northern Ireland Technology Growth Fund (Nitech).
Established as a pilot Fund, the stated objectives of Nitech were to:
Encourage and support research and development activities from university spin-outs and new business
starts, and to enable researchers to develop products or services that meet an identifiable market need;
Encourage enhanced levels of technology research within existing SMEs; and
Increase the volume of projects with the potential to become investment opportunities for Venture
Capitalists and Business Angels.
1.2.2 Operation and Delivery
Initially established with a ten-year life, consisting of a 5 year investment phase and a 5 year follow-on
and portfolio management phase, Nitech was a £3m1 government only funded venture capital fund.
The Fund provided staged investment that ranged from £20k to £200k with a maximum investment of
£250k to any one company.
It was envisaged that two types of investments would be made, namely:
1 It was initially anticipated that the £3m would be inclusive of Fund management costs. Please note that the level of
investment and investment period was extended at the agreement of Invest NI. This is discussed in further detail in
Section 3.
NITECH GROWTH FUND PPE - VERSION 1.0 Page 2
Stage 1: Research Exemplification, Proof of Principle, Construction of Prototypes - It was
anticipated that Stage 1 investments would range between £20k and £45k and would be used to
fund crucial experiments either to prove scientific prototypes or to exemplify research in more
detail, construct prototypes and ultimately enable the potential business opportunity to get to the
stage where external investors might consider direct involvement, or where industry might
undertake joint ventures for further development, licensing etc.; and
Stage 2: Development Programmes - Stage 2 investments were provided when research had
been sufficiently exemplified to bring the technology to the stage that demonstrators would be
produced for evaluation by potential customers and joint venture partners or to develop the
technology to create initial products for sale. It was anticipated that Stage 2 investments would
range between £50k and £150k.
Costs eligible for support included research and development to underpin the value of the technology,
initial patent filings, commercial due diligence, technology-related market appraisal and certain
company start-up and operating costs.
Support through the Fund was available for NI-based start-ups or existing SMEs and individual
researchers, research teams and University departments. Projects were selected based on their ability
to demonstrate the:
Innovative nature of the technology that would be created;
Protected and unencumbered ownership of intellectual property;
Commercial opportunity for the product or service that would ultimately be created;
Likelihood of the project securing third party equity funding at some point in the future; and
Quality of the proposed team including the availability of appropriately skilled management.
1.2.3 Fund Management
The Fund was initially established via a Limited Partnership Agreement (LPA) in January 2003
between Invest NI and ANGLE Technology Limited (acting as the General Partner) in conjunction
with Clarendon Fund Managers Limited (CFM) 2
. The creation of the LPA is discussed in further
detail in Section 3.
1.3 Invest NI’s Requirements
Invest NI requires an Evaluation of Nitech for the period January 2003 to January 2013. The overall
evaluation objectives are to:
Examine the extent to which the Nitech Fund has performed against its targets and objectives and
determine whether the targets were appropriate;
Determine the economic impact (actual and projected) of the investment projects brokered by Nitech;
Assess the impact of the Nitech Fund in increasing equity/venture capital investment in Northern Ireland;
Determine the extent to which the Nitech Fund represented good Value for Money and the appropriate use
of public funds;
Assess the management of the Nitech Fund through Limited Partnerships and Management Service
agreements with Clarendon Fund Managers;
Examine options for an Invest NI exit strategy from Nitech, including secondary buy-out, internal portfolio
management and managing out by existing Fund Manager; and
Make recommendations on what the findings imply for current and future interventions.
Further details of Invest NI’s specific requirements are detailed in full within Appendix I.
2 It should be noted that CFM became the General Partner with sole responsibility for the management of Nitech. The
change in General Partner is discussed in further detail in Section 3.
NITECH GROWTH FUND PPE - VERSION 1.0 Page 3
1.4 Methodology
In conducting the evaluation, Cogent employed a methodology that included:
A robust desk-based analysis of pertinent materials relating to Nitech during the period under
review including the LPA, quarterly monitoring reports, the Fund’s annual accounts, the previous
Interim Evaluation and supplementary monitoring information provided by the General Partner;
Face-to-face consultations with the Fund Manager (Clarendon Fund Managers);
Telephone and face-to-face consultations with:
The Evaluation Steering Group that was established for the evaluation. This included
representation from Invest NI’s Business Solutions and Strategy Groups;
Other Fund Managers including Crescent Capital (Development Fund), XCell Partners
Propel Programme Delivery Agent, NISP (Halo NI and NISP Connect) and Ulster
Community Investment (Small Business Load Fund Manager); and
InterTradeIreland.
1.4.1 Limitations to the Evaluation Team’s ability to address the Terms of Reference
In undertaking the Evaluation of Nitech, the Evaluation Team notes that there were a number of
factors that have limited our research activities. They are:
The Fund’s original approval documentation (Economic Appraisal and Casework) was not
available for the Evaluation Team to review;
The “Proposal for Fund Management Services” (January 1999) and the “Approach to Fund
Management Services” (October 2002), which were prepared for the Industrial Research and
Technology Unit (IRTU) and Invest NI (documenting the investment approach that was to be
taken) were not available; and
Based upon feedback from the Fund Manager, the Evaluation Steering Group requested that
primary research was not undertaken with portfolio companies and private sector investors (that
provided leveraged investment) given the extensive time period that has passed since making their
investment and the associated concerns over the reliability of any feedback that might be received.
The absence of this documentation, and lack of primary research with some key stakeholders, limits
the ability of the Evaluation Team from making definitive conclusions in relation to a number of areas
of the TOR including:
The rationale/need for the Fund including the strategic context under which Nitech operated, the
market failure(s) that Nitech sought to address and the extent to which the intervention
subsequently addressed the market failure (as would be identified by portfolio companies);
The nature of the potential risks that were identified at the outset and the activities that were
anticipated to be undertaken to mitigate against these risks (in the event they arose);
Levels of activity and impact additionality (as would be identified by portfolio companies and
private sector investors) and displacement and the associated economic impact of the Fund;
The nature and appropriateness of any targets and objectives that were created for the Fund and
the extent to which Nitech achieved these;
The anticipated full economic costs of delivering the Fund over its life time;
The anticipated monetary and non-monetary economic impact that the Fund was envisaged to
provide over its life time;
Effectiveness of the management of Nitech and the role played by the Fund Manager (as would be
identified by portfolio companies and private investors); and
Overall value-for-money (VFM) provided by the Fund (on the basis that uncertainty exists as to
targets, outputs and outcomes that were anticipated to be achieved through the Fund).
NITECH GROWTH FUND PPE - VERSION 1.0 Page 4
In an effort to address any gaps in information, the Evaluation Team was requested to draw upon the
findings of the Interim Evaluation of Nitech3.
Notwithstanding the above, the Evaluation has made best efforts to conclude as far as possible on each
of the TOR’s requirements in light of the information and feedback that was provided by key
stakeholders during the Evaluation process.
We also note that, at the time of Evaluation (August 2015), a significant period of time (c. 12 years)
had passed since the creation of Nitech and much has changed on how projects are appraised,
approved, monitored and subsequently evaluated. As such, the Evaluation Team is aware that many of
the aforementioned weaknesses in governance procedures have subsequently been addressed by Invest
NI (as part of its wider Corporate Governance procedures).
Please note that the Fund Manager has provided all information to inform the Evaluation on a strictly
commercial-in-confidence basis and has advised that it should only be used for the sole purpose of the
Evaluation.
Whilst the Evaluation Team has sought to, as far as possible, maintain the confidentiality of the
companies that received support through Nitech during the period under review, certain information
presented (particularly information documented in Sections 3 and 4) may inadvertently disclose the
identity of some individual companies, the support they have received and/or other commercially
sensitive information.
The Evaluation Team further notes that this report has been prepared for, and only for Invest NI and
for no other purpose. Cogent Management Consulting LLP does not accept or assume any liability or
duty of care for any other purpose or to any other person to whom this report is shown or into whose
hands it may come save where expressly agreed by our prior consent in writing.
3 Interim Evaluation completed in April 2007.
NITECH GROWTH FUND PPE - VERSION 1.0 Page 5
2. STRATEGIC CONTEXT AND RATIONALE
2.1 Introduction
Section 2 provides a high-level summary of the rationale for the introduction of Nitech and the policy
environment within which the Fund operated during the period under review4.
2.2 Investment Rationale
It has widely been acknowledged that, whilst progress has been made in recent years, “NI has
traditionally lacked the vibrant venture capital and debt finance markets that are necessary to support
economic growth”5. Specifically, research suggests that a number of factors combined both prior to,
and during the course of Nitech, to necessitate Government intervention. These include:
The existence of the ‘Debt and Equity Gap’ - A significant body of research6 existed which
suggested that there was a recognised gap in the continuum of the supply of finance (typically for
deals up to £2m) for start-up and early growth businesses during the investment period of Nitech.
The research suggested that a number of market failure and non-market failure factors combined
in relation to the demand for, and supply of, finance to create the debt and equity gap. These
included:
Structural market failures on the supply and demand side - Research suggested that the
existence of asymmetric information on the supply and demand side had (and continues to
have) contributed to creating the finance gap (both in debt and equity terms).
Supply side
On the supply side, in relation to debt finance to SMEs, it was difficult for lenders to
distinguish between high and low risk entrepreneurs without incurring significant costs. To
avoid the costs associated with gathering this information, lenders often require borrowers to
provide evidence of a financial track record and/or collateral as security for the finance.
Therefore, a market failure exists because the financial institution’s decision to lend is based
on collateral and track record, rather than the economic viability of the business. This means
some fledgling businesses7 with viable business propositions that lack a track record or
collateral have historically been prevented from raising the finance they need.
Another differentiating factor in NI has been the structure of bank ownership. In particular,
NI’s local banking sector is in a unique position in that it lacks a major indigenously owned
institution with each of the four main high street banks being externally owned. Historically,
this has restricted their access to some of the initiatives to improve business lending.
It was widely recognised that an ‘equity gap’ also existed in the provision of modest amounts
of equity finance to individuals and SMEs. This was also due to asymmetric information
between the investor and the business on the likely viability and profitability of the business.
Assessing the quality of SME proposals and associated risks is difficult and leads to the
4 As detailed in Section 1, in the absence of an Economic Appraisal and associated Casework approval documentation,
which would have substantiated the market and strategic need for the Fund, the Evaluation Team has based the
following analysis upon its consultation with key stakeholders and its review other pertinent information (e.g. Interim
Evaluation of Nitech (2007), other independent evaluations undertaken of other access to finance initiatives that existed
during the same period (e.g. the Viridian Growth Fund, undertaken by Cogent (2014)) and other publicly available
research. 5 Source: NI Economic Strategy.
6 For example, see ‘Bridging the Finance Gap’, HM Treasury (2003), ‘SME Financing Gap’, Joint European Resources
for Micro to Medium Enterprises (April 2008), ‘The Supply of Equity Finance for SMEs: Revisiting the equity gap’,
SQW for BIS (2009) and SME Access to External Finance (BIS Economics Paper No. 16 (2012). 7 The focus of these businesses is quite often based around new and disruptive technology.
NITECH GROWTH FUND PPE - VERSION 1.0 Page 6
investor incurring transaction costs of undertaking due diligence. These transaction costs are
generally fixed and do not vary greatly with the size of investment. For instance, consultation
with Invest NI suggests that typical due diligence costs for companies at a similar stage of
development as those supported through Nitech are generally between £5k and £10k (and
these can rise to £20k - £50k depending on the stage of development). They are therefore
higher as a proportion of the investment deal size for smaller investments, and for a small
investment in a technically complex company, the costs can easily account for 10% or more of
the investment. This resulted, and continues to result, in a structural gap in the market where
investors and risk capital fund managers focus on fewer, larger investments in more
established (lower risk) businesses at the expense of early stage venture capital. This leaves
potentially viable businesses with growth potential not being able to obtain equity finance
given their relatively small deal size.
In addition to the above, discussion with consultees suggests that investors (especially those
from outside NI) were reluctant to invest in deals which required them to manage their
investments remotely and/or they may not be aware of the potential investments that exist in a
small peripheral market such as NI due to the historic lack of investment activity and their
lack of knowledge of the NI market (i.e. asymmetric information).
Feedback from consultees also suggests that, at the outset of the Nitech Fund, the importance
of the role of seed and early stage finance (including VC finance) was potentially less well
known amongst economic development agencies in NI and further afield. Hence there was a
lack of public sector initiatives available to support local SMEs (see Section 3.6 for further
details). However, consultees did acknowledge that the role and importance of seed and early
stage finance is now better understood by these stakeholders and this has been reflected by the
increase in the range of interventions that are currently available through (amongst other
things) Invest NI’s Access to Finance Initiative.
Demand side
The level of venture capital investment in NI over the period from 1985 to 2000 totalled
£228m which represented 0.7% of the UK total venture capital investment over this period
(compared to NI’s share of UK GDP of 2.2%)8. Research suggested that venture capital in
Northern Ireland would have had to increase by four times this level to match the per capita
levels of Wales or Scotland. Whilst there was considerable demand for VC funds in GB to
support the ‘dot com’ boom (1997-2000) and technology start-up businesses, this was not
mirrored within the more traditionally-based NI economy where venture capital demand and
investment lagged well below the UK national average.
Economic research suggests that, during the period of Nitech, there were asymmetric
information market failures affecting the demand side for businesses seeking finance.
Principally, these related to the fact that individuals or SMEs did not fully understand the
potential benefits to their business of raising finance or their likely chance of success in
gaining finance, which ultimately meant they did not apply, which, in turn, restricted the
growth of businesses. Business owners also lacked the knowledge of funding sources
available and/or lacked the skills to present themselves as investable opportunities to
investors, which combined with problems on the supply-side. It is suggested that demand side
market failures were potentially most acute in businesses seeking equity finance, with many
SMEs lacking information on how equity finance works and where to obtain such finance.
The NI business sector was, and continues to be, dominated by SMEs who are typically
characterised as being risk adverse, conservative in their growth plans and reluctant to
sacrifice equity in exchange for finance. Therefore, bank lending and (of particular relevance
8 Source: Market Failure in the Supply of Venture Capital Funds for SMEs in Northern Ireland’ (2002).
NITECH GROWTH FUND PPE - VERSION 1.0 Page 7
to NI) grant support have historically been the main sources of funding for local businesses.
However, as detailed previously, businesses have been (and continue to be) faced with lower
levels of grant available and more stringent lending regimes by banks, making it more difficult
for them to finance growth.
Existence of positive externalities - There is an under supply of equity finance to young high
growth potential businesses due to the divergence of private and social benefits from investing
in these businesses (as investors are primarily concerned with the financial returns from their
investment). It is suggested that this results because investing in early stage innovative
businesses can lead to a number of positive spill-over effects known as externalities through
innovation and knowledge transfers to other parts of the economy, which private investors do
not take into account when making their decision to invest in venture capital
Market power - Market power can arise as a result of insufficient actual or potential
competition to ensure that the market continues to operate efficiently. Market power can also
be created by high start-up costs, which can deter entry by competitors in the first place.
Research suggests that this form of market failure is evident in the NI VC due to the limited
supply of VC funds and the lack of outside private investment. The relatively low levels of
VC activity in NI means that the cost of VC management and set up costs are
disproportionately high, which may be a deterrent to investors from outside NI. Market failure
could be said to be brought about by the high fixed cost of the formal process. Within such
markets, the private sector will provide the capital but they require assistance with the delivery
and set up costs. .
Structural issues in the NI Economy – The Evaluation Team notes that a number of structural
issues associated with the NI economy have historically impacted on the demand for equity
finance. These issues, including the peripherality of NI, its small business population and high
levels of economic inactivity, have all contributed to lower levels of GDP per head in NI than the
rest of the UK. Other economic factors, more specifically related to early stage and development
investment activity, are likely to have resulted in market imperfections, including the relatively
small number of technology and knowledge based businesses located in the region, a smaller
number of universities from which spin-outs have emerged and a dependency on government
grants, which have helped to displace equity9.
The importance of the High Technology sector and businesses – The interim evaluation of
Nitech highlighted the importance of high technology sectors and businesses to contributing to
longer term economic growth and prosperity. In doing so, the Evaluation noted the important role
that Nitech would potentially have in stimulating technology transfer activity from NI’s
Universities and collaborating with local businesses to encourage the growth of these high value
added sectors.
In conclusion, the Interim Evaluation noted that the initial need for government intervention was
premised on the fact that:
9 The Evaluation Team notes that the NI public sector had played a key role through its industrial development
strategies in countering the negative socio-economic effects of civil unrest in Northern Ireland. By 1999/2000, public
expenditure on industrial development per capita in Northern Ireland was more than 2.5% of the UK average. As a
result, SMEs tended to be less dependent on private sector risk capital and more dependent on state support, and
therefore the challenge facing industrial development policy makers was to re-orientate SMEs towards more normal
financing of growth, including the use of venture capital. Furthermore, it was projected that over the 2003 to 2007
period, industrial development budgets would decrease by almost 17% in real terms and this would create a ‘funding
gap’ in the local market, and this was viewed as evidence of latent demand.
NITECH GROWTH FUND PPE - VERSION 1.0 Page 8
The SME sector in Northern Ireland had a number of distinct characteristics, features and issues that
needed to be addressed through investments focused on increasing innovation and commercialising
research and development;
There was an identified need to enhance the interaction, interfaces, innovation and entrepreneurship of the
Northern Ireland technology transfer sector and the SME business community and therefore, to develop
support services to provide appropriate access to the advice, information and resources needed by
businesses to develop finance and support the commercialisation of technology within new-start and
existing SME businesses;
University-business collaboration offered considerable opportunity to influence economic growth and that
intervention was required to assist university researchers to maximise their potential and the value and
influence of their research and innovative development projects; and
There was a significant gap in the market at the ‘smaller deals size range’. There existed a need for the
supply of funds and appropriate support and assistance to be put in place for fledgling ideas and business
ventures to be progressed through to a commercial stage/opportunity. The analysis identified that Northern
Ireland and the university research market and SME business community had a number of prevalent
features that were hindering and constraining VC activity and investment including issues relating to the
local economy, levels of entrepreneurship and the higher availability of smaller deal sizes in Northern
Ireland and their associated higher costs and risks, thus reducing the attraction for investment by Venture
Capitalists or other interested parties.
The Interim Evaluation noted that at the time of drafting (2007) there was “no evidence to believe that
this situation has improved” and other research available at that time had “confirmed that there
continues to be a market failure across the world and an area which requires government
intervention.”
2.3 Strategic Context
Appendix II provides a detailed analysis of the contribution of the Nitech with the various NI
Government strategic objectives and imperatives that existed (or continue to exist) for the period under
review. However, in summary, we note there was (at the time of approval), and throughout the period
under review, clear alignment between the aims and objectives of Nitech and the strategic imperatives
of the NI Government (including with DETI and Invest NI’s Corporate Plans and the Invest NI Access
to Finance Strategies that existed).
Specifically, in line with Government’s strategic focus, the provision of venture capital through Nitech
offered the potential to promote a continuum of funds, create a deal flow chain across seed, early and
development funds and retain and build on skills and capability of venture capitalists. In doing so, the
Fund has offered the potential to “help eliminate the real and perceived barriers to growth” faced by
SMEs and, in doing so; contribute to promoting and encouraging private sector growth including
productivity and employment.
2.4 Summary Conclusions
During the period under review, there was a need for Government to provide support to address a gap
in the continuum of the supply of finance for deals up to £2m for start-up and early growth businesses.
The research evidence suggests that this gap arose due to (amongst other things) key structural market
failures (including asymmetric information on the demand and supply side, risk aversion, existence of
positive externalities and market power) and other structural issues associated with the NI Economy.
There was (at the time of approval), and throughout the period under review, clear alignment between
the aims and objectives of Nitech and the strategic imperatives of the NI Government (including with
DETI and Invest NI’s Corporate Plans and the Invest NI’s Access to Finance Strategies that existed).
Specifically, in line with Government’s strategic focus, the provision of venture capital through Nitech
offered the potential to promote a continuum of funds, create a deal flow chain across seed, early and
development funds and retain and build on skills and capability of venture capitalists. In doing so, the
Fund has offered the potential to “help eliminate the real and perceived barriers to growth” faced by
SMEs and, in doing so; contribute to promoting and encouraging private sector growth including
productivity and employment.
NITECH GROWTH FUND PPE - VERSION 1.0 Page 9
3. FUND ACTIVITY
3.1 Introduction
Section 3 provides a summary of activity that was delivered through Nitech during the period under
review. In doing so, the section also considers the role of the Fund Manager (CFM).
3.2 Establishment of the Limited Partnership and Fund Governance Procedures
As detailed in Section 1, the Fund was established in January 2003 via a Limited Partnership
Agreement (LPA) between Invest NI as Limited Partner (LP) and Angle as the General Partner (GP)
and overall Fund Manager. In-line with the objectives of the Fund, the stated purpose10
of the
Partnership was to:
Provide advisory, management and consultancy services and a funding resource to assist in bringing
research discoveries and early stage technologies to the point where they can be transformed into viable
businesses through the formation of SMEs in the Region; and
Carry on the business of an investor and in particular but without limitation to identify, research, negotiate
make and monitor the progress of and arrange the purchase and sale and/or making of investments in
manufacturing and tradable service based industrial SMEs located in the Region.
The General Partner/Fund Manager was exclusively responsible for the management and control of the
business and affairs of the Partnership, with the Limited Partner (Invest NI) performing no active role
in the day-to-day management and delivery of the Fund. That is to say, Invest NI was a passive
investor who had no executive powers of decision making regarding the management of the funds.
Rather they set the investment policy and expected adherence to it by the Fund Manager11
.
In its proposal to Invest NI to manage Nitech12
, Angle proposed to work in collaboration with
Clarendon to establish and manage the Fund. Specifically, it was proposed that Angle would have day-
to-day responsibility of managing the Fund including:
Fund marketing and promotion;
Identifying investment opportunities;
Undertaking the initial assessment of all applications for funding;
Monitoring the performance of investee companies and projects;
Reporting on Fund’s performance to Invest NI; and
Managing the Fund’s portfolio of investments.
It was anticipated that CFM would act as the regulated Fund Manager responsible for conducting the
due diligence on the applications referred by Angle (following its initial assessment), completing all
the financial negotiations and agreeing terms with clients. The Evaluation Team understands that it
was informally agreed that CFM would support Angle with the marketing and promotion of the Fund
given CFM’s ongoing interaction with NI’s technology transfer/start-up community.
On appointment however the roles and responsibilities of Angle and Clarendon were reviewed in
conjunction with Invest NI and a sub-contract agreement was created which established CFM as the
lead contractor and Angle as the subcontractor. There was no change in the operational roles and
responsibilities that were taken forward by each contractor13
.
10
As per the Limited Partnership Agreement (January 2003) 11
During consultation, Invest NI confirmed that such a structure is attractive to a government investor as it means that
the FCA approved fund manager is responsible for decision making. 12
See ‘Approach to Fund Management Services’ (October 2002). 13
Nor was there a change in the Priority Share, with Angle receiving 60% of management fees and CFM receiving
40%.
NITECH GROWTH FUND PPE - VERSION 1.0 Page 10
The roles and responsibilities were maintained by each organisation until early 2006, at which time
Angle wished to withdraw from the contract. With Invest NI’s agreement, Clarendon took over
complete responsibility for all operational aspects of the Fund14
. The Evaluation Team’s review of
monitoring reports and the interim Evaluation indicates that there is no evidence to suggest that the
transfer of all responsibilities to Clarendon had any negative impact on the administration and
management of the Fund. Indeed, consultation with Clarendon indicates that its presence in NI and
involvement in the VGF facilitated a close working relationship with all businesses that received
investment through the Fund.
The General Manager was responsible for providing quarterly and annual reports to Invest NI which
contained details of (amongst other things):
Movements/changes in the value of investments previously made through the Fund;
Partnership assets;
Investments purchased including a brief summary of all investee companies; and
Investments sold and otherwise disposed of.
A Supervisory Group (SG) was established by Invest NI in consultation with the General Partner with
the stated purpose of15
:
Monitoring and supervising the performance of the General Partner in relation to the Investment and
Operational Guidelines;
Reviewing and advising on investment policy from time to time; and
Performing such other functions as are envisaged under the Investment and Operational Guidelines
During the period under review, the SG consisted of Edward Cartin (then Chief Executive of Qubis
Ltd.) and a number of representatives from Invest NI. Like Invest NI, the LPA stated that the SG was
to take no role in the management or control of the business or the affairs of the Partnership.
3.3 The Investment Process16
By way of raising awareness of, and stimulating demand for, the Fund and co-investment, the Fund
Manager undertook networking meetings and participated in events with a variety of enterprise
networks and strategic referral network partners who were actively involved in supporting the growth
of NI SMEs. These stakeholders included:
Table 3.1: Enterprise networks and Strategic referral network partners utilised to stimulate deal flow
Invest NI (including sector head, Client Executives, Corporate Finance Team, Programme Manager) and
its supported programmes (e.g. Propel and Halo, the NI Business Angel Network);
NISP Connect Programmes (including Springboard, £25k Awards);
InterTradeIreland and its supported programmes (e.g. HBAN, Seedcorn Competition, VC Conference);
Enterprise NI and the regional Enterprise Agencies;
Higher Education (including their Commercialisation Departments) and Further Education Institutions;
Institute of Electronics, Communications and Information Technology (ECIT);
NI Corporate legal advisors;
Intermediaries including small and mainstream Corporate Finance and Accountancy practices; and
Business Angels (individuals, groups and syndicates).
14
The change in operational roles and responsibilities was agreed formally by the NICS Central Procurement
Directorate (letter dated 20th December 2006). 15
Source: Limited Partnership Agreement (January 2003). 16
Commentary on the investment process in drawn from the Interim Evaluation of Nitech and the Fund’s Annual
reports.
NITECH GROWTH FUND PPE - VERSION 1.0 Page 11
It is the Fund Managers’ view that the demand for the investment through the Fund (and in particular
Stage 2 investments) remained strong through the early years, especially when placed in the context
where:
There was initially limited understanding and awareness of venture capital as a source of growth
finance within the private and public sector. The Fund Manager does note however that the role of
venture capital is now well known in NI public sector circles as demonstrated by the significant
expansion of access to finance initiatives (including market awareness and investor readiness
training schemes);
Private equity and early stage venture capital and SME founders and their management were
particularly risk adverse and typically required the encouragement of their advisors to consider
equity investment to fund their expansion;
Many of the Enterprise Network Partners had only been established or were in their infancy during
the initial years of the Fund (and hence relatively less experience in their respective roles); and
There was a greater ease of access to grants and relatively cheap bank finance. Indeed, whilst not
quantified, the Fund Manager suggests that there are a number of examples where the Fund’s
investment offers were not taken as a result of individual companies taking grant or bank finance.
Businesses interested in receiving support were required to complete and submit an application form
(accessed from the Invest NI website) and a business plan with 3 year financial projections, prior to
formal appraisal, to Angle. All applications to the Fund were reviewed by Angle to ascertain whether
they met the basic eligibility criteria (identified under Section 1.2.3) for investment from the Fund.
Applicants that complied with these basic criteria then met with Angle to clarify the degree to which
they met the criteria. In many cases, the initial assessment (the stage prior to the performance of a
technical and commercial evaluation by Angle), also involved an Angle specialist in the particular
sector who also reviewed the application form and business plan and any further information
subsequently requested. At this point, applications which did not meet the basic eligibility criteria
were declined.
Applications that proceeded through this filtering stage were then subject to a technical and
commercial appraisal by an appropriate Angle specialist consisting of a critical analysis of the
technology, intellectual property rights (IPR) position, potential market, competitive position, route to
market, management team and projected revenues.
The outcome of the evaluation concluded with a recommendation being made by Angle to CFM as to
whether the investment opportunity should be taken through to the next stage of investment appraisal,
together with any recommendations on factors that were to be taken into consideration when making
the investment decision and conditions that had to be met by the company or project principles should
the investment be made. In the case of small grant applications (typically less than £50k or for Stage 1
investments), a more streamlined short-form evaluation was performed.
If Angle recommended the proposal to move forward to the next stage, CFM was then responsible for:
Reviewing the analysis and conclusions of the technical and commercial assessment prepared by
Angle;
Carrying out a financial review of the company; and
Carrying out, in conjunction with Angle, further technical and commercial due-diligence (if this
was considered necessary) or commissioning further due diligence from a third party.
NITECH GROWTH FUND PPE - VERSION 1.0 Page 12
Dependent on the outcome of this due diligence work CFM:
Structured and negotiated a suitable investment proposal for the applicant seeking funding and
presented this to the Fund’s Investment Approval Committee (IAC); and
Managed the final investment process including the issue of draft offer letters, completion of
further commercial and financial due diligence, and worked with the Fund’s appointed legal
representatives to complete the necessary investment documentation.
Consultation with CFM indicates that this work proved to be time consuming as the Fund Manager
was often dealing with several co-investors and needed to take into consideration a company’s
operations and total financing requirements, rather than only the specific elements of expenditure that
may be part-financed by the Fund. The position was further complicated by the fact that, in most
circumstances, companies were not investor-ready at this stage of financing. In the absence of other
wrap-around investor readiness support, in order to expedite the investment process, it was therefore
necessary in some cases for CFM to work with companies and provide assistance in putting them into
a suitable framework for investment. With hindsight, the Fund Manager suggested that the realisation
of this need should have been expected during the early years of the Fund given the nature of most
early stage investments.
Once an investment has been made, Clarendon and / or Angle monitored the performance of the
company or project in which the Fund has invested, in order to protect the Fund’s interests. In the case
of investments of over £100k, a non-executive director (NED) was appointed to the company and
attended all board meetings.
The likely exit of an investment was considered as part of the due diligence process, including
consideration of the likelihood of trade sale, licensing deals, Initial Public Offering (IPO) and
Management Buy Out (MBO)/Management Buy In (MBI). However, given the early stage of the
companies forming the portfolio and the experience of the Fund Manager in the additional investment
needed beyond the first round to grow the company to a stage where an exit could be contemplated,
the initial emphasis of the approach taken by the Fund Manager was to attract follow on finance for a
large part of the portfolio company’s life (which was 7-9 years in the case of Nitech). Underlying this
approach was (is) the expectation that maximising the amount and diversity of sources of follow on
finance for portfolio companies (rather than focusing on short-term exit planning) would ultimately
maximise financial returns for the Fund.
Progress in achieving the business plan (with a fall-back Plan B in place in case the funding
requirement was not achieved) and, where necessary, the timescale to achieve follow-on finance was
monitored through the quarterly Investor Reports and the Advisory Board. The Fund Manager also
identified potential contingency/mitigation arrangements in the event that follow-on funding was not
achieved. Through Board attendance the Fund Manager worked closely with portfolio companies to
ensure later stage investor readiness and to assist in sourcing finance in the fund raising activities.
Portfolio progress and follow-on funding was formally reviewed in Quarterly Reports and Advisory
Board meetings.
During consultation, the Fund Manager stated that the most significant issue faced by the Fund, the
Fund Manager and portfolio companies was the limited follow-on finance available within the Fund
itself, which it views as being a small fund (of £3m). The Fund Manager suggested that this issue was
compounded by the fact that:
VC managers from outside NI were reluctant to consider deals within NI due to their relatively
small size and the fact that NI’s peripheral location made it more difficult to actively manage
potential investments; and
There was a general lack of investor readiness amongst companies approaching the Fund. As such,
it is Fund Manager’s view that it had to take on a role of being an equity advisory service
(especially in the early years of the Fund) as much as a VC fund manager.
NITECH GROWTH FUND PPE - VERSION 1.0 Page 13
3.4 Investment Activity
3.4.1 Overview of Investments made in Portfolio Companies
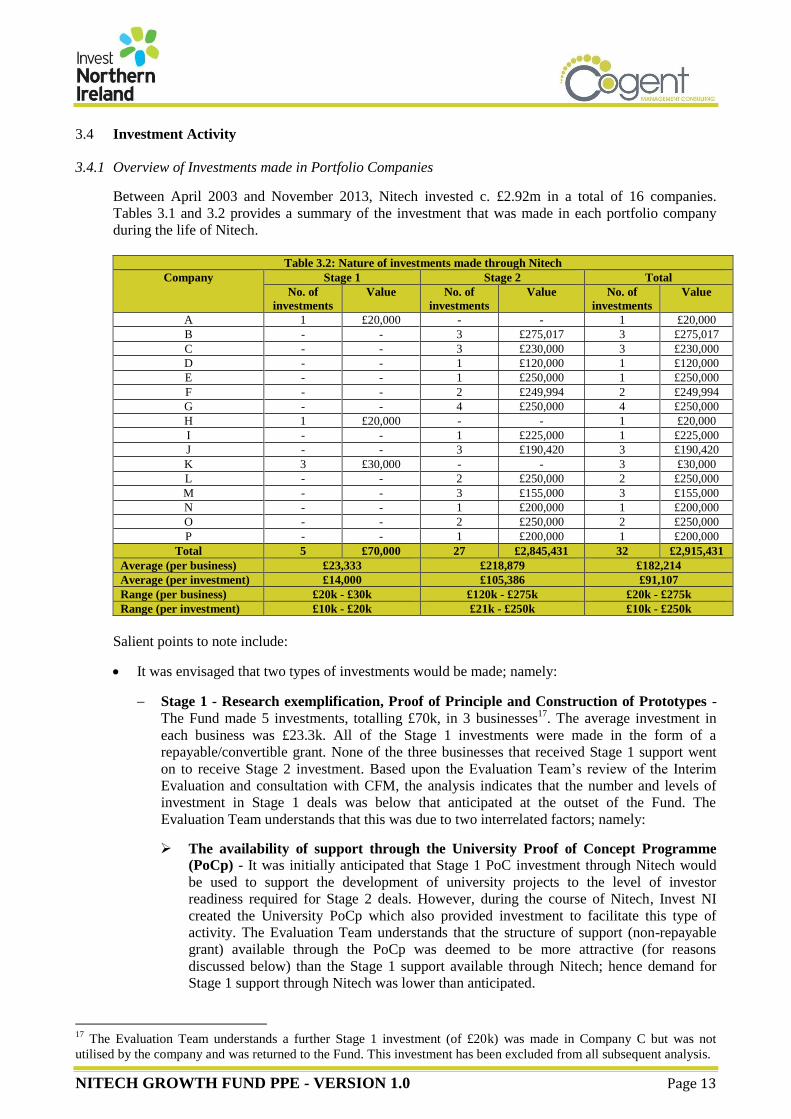
Between April 2003 and November 2013, Nitech invested c. £2.92m in a total of 16 companies.
Tables 3.1 and 3.2 provides a summary of the investment that was made in each portfolio company
during the life of Nitech.
Table 3.2: Nature of investments made through Nitech
Company Stage 1 Stage 2 Total
No. of
investments
Value No. of
investments
Value No. of
investments
Value
A 1 £20,000 - - 1 £20,000
B - - 3 £275,017 3 £275,017
C - - 3 £230,000 3 £230,000
D - - 1 £120,000 1 £120,000
E - - 1 £250,000 1 £250,000
F - - 2 £249,994 2 £249,994
G - - 4 £250,000 4 £250,000
H 1 £20,000 - - 1 £20,000
I - - 1 £225,000 1 £225,000
J - - 3 £190,420 3 £190,420
K 3 £30,000 - - 3 £30,000
L - - 2 £250,000 2 £250,000
M - - 3 £155,000 3 £155,000
N - - 1 £200,000 1 £200,000
O - - 2 £250,000 2 £250,000
P - - 1 £200,000 1 £200,000
Total 5 £70,000 27 £2,845,431 32 £2,915,431
Average (per business) £23,333 £218,879 £182,214
Average (per investment) £14,000 £105,386 £91,107
Range (per business) £20k - £30k £120k - £275k £20k - £275k
Range (per investment) £10k - £20k £21k - £250k £10k - £250k
Salient points to note include:
It was envisaged that two types of investments would be made; namely:
Stage 1 - Research exemplification, Proof of Principle and Construction of Prototypes -
The Fund made 5 investments, totalling £70k, in 3 businesses17
. The average investment in
each business was £23.3k. All of the Stage 1 investments were made in the form of a
repayable/convertible grant. None of the three businesses that received Stage 1 support went
on to receive Stage 2 investment. Based upon the Evaluation Team’s review of the Interim
Evaluation and consultation with CFM, the analysis indicates that the number and levels of
investment in Stage 1 deals was below that anticipated at the outset of the Fund. The
Evaluation Team understands that this was due to two interrelated factors; namely:
The availability of support through the University Proof of Concept Programme
(PoCp) - It was initially anticipated that Stage 1 PoC investment through Nitech would
be used to support the development of university projects to the level of investor
readiness required for Stage 2 deals. However, during the course of Nitech, Invest NI
created the University PoCp which also provided investment to facilitate this type of
activity. The Evaluation Team understands that the structure of support (non-repayable
grant) available through the PoCp was deemed to be more attractive (for reasons
discussed below) than the Stage 1 support available through Nitech; hence demand for
Stage 1 support through Nitech was lower than anticipated.
17
The Evaluation Team understands a further Stage 1 investment (of £20k) was made in Company C but was not
utilised by the company and was returned to the Fund. This investment has been excluded from all subsequent analysis.
NITECH GROWTH FUND PPE - VERSION 1.0 Page 14
Nature of financial assistance – Businesses that received Stage 1 investment did so on
the basis that the investment would be repaid or converted to equity shares when the
businesses value could be better determined (following a reasonable period of operation).
However, it is the Fund Manager’s view that the availability of other non-repayable
grants (e.g. through the PoCp, START, SMART etc.), which did not require businesses to
sacrifice equity, were considerably more attractive to businesses and hence there was a
reduction in demand for Stage 1 deals. This is discussed further in Section 4.8.
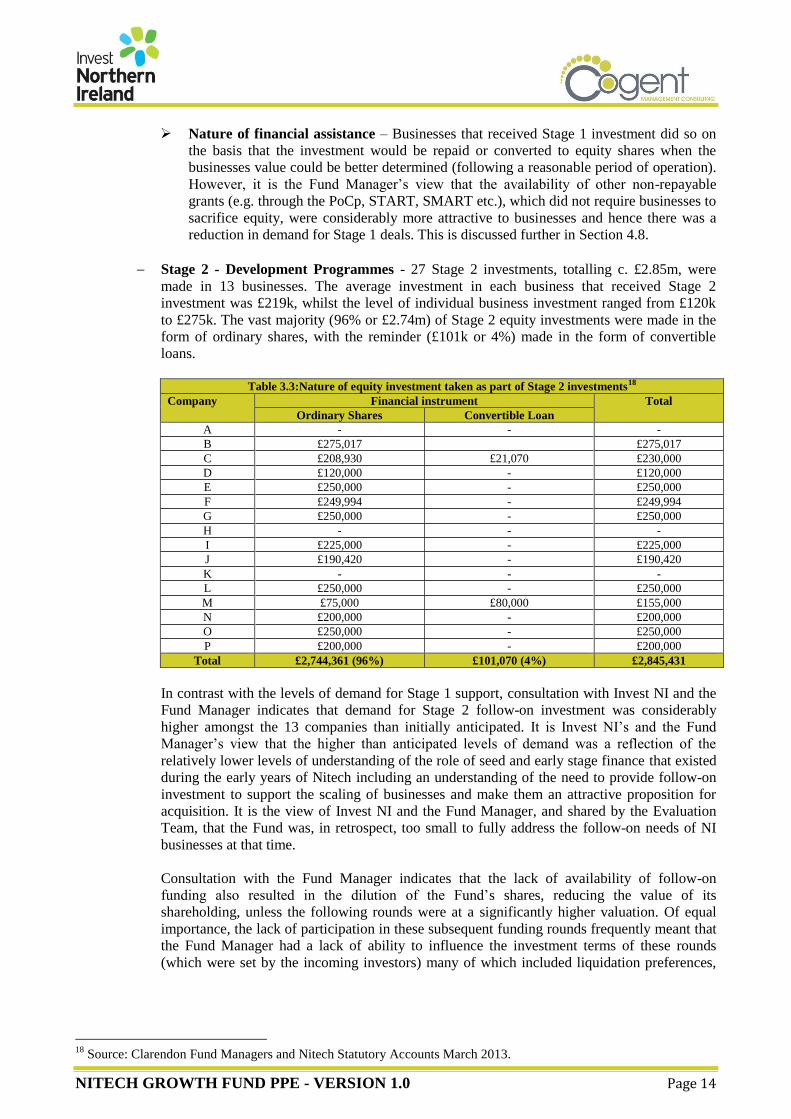
Stage 2 - Development Programmes - 27 Stage 2 investments, totalling c. £2.85m, were
made in 13 businesses. The average investment in each business that received Stage 2
investment was £219k, whilst the level of individual business investment ranged from £120k
to £275k. The vast majority (96% or £2.74m) of Stage 2 equity investments were made in the
form of ordinary shares, with the reminder (£101k or 4%) made in the form of convertible
loans.
Table 3.3:Nature of equity investment taken as part of Stage 2 investments18
Company Financial instrument Total
Ordinary Shares Convertible Loan
A - - -
B £275,017 £275,017
C £208,930 £21,070 £230,000
D £120,000 - £120,000
E £250,000 - £250,000
F £249,994 - £249,994
G £250,000 - £250,000
H - - -
I £225,000 - £225,000
J £190,420 - £190,420
K - - -
L £250,000 - £250,000
M £75,000 £80,000 £155,000
N £200,000 - £200,000
O £250,000 - £250,000
P £200,000 - £200,000
Total £2,744,361 (96%) £101,070 (4%) £2,845,431
In contrast with the levels of demand for Stage 1 support, consultation with Invest NI and the
Fund Manager indicates that demand for Stage 2 follow-on investment was considerably
higher amongst the 13 companies than initially anticipated. It is Invest NI’s and the Fund
Manager’s view that the higher than anticipated levels of demand was a reflection of the
relatively lower levels of understanding of the role of seed and early stage finance that existed
during the early years of Nitech including an understanding of the need to provide follow-on
investment to support the scaling of businesses and make them an attractive proposition for
acquisition. It is the view of Invest NI and the Fund Manager, and shared by the Evaluation
Team, that the Fund was, in retrospect, too small to fully address the follow-on needs of NI
businesses at that time.
Consultation with the Fund Manager indicates that the lack of availability of follow-on
funding also resulted in the dilution of the Fund’s shares, reducing the value of its
shareholding, unless the following rounds were at a significantly higher valuation. Of equal
importance, the lack of participation in these subsequent funding rounds frequently meant that
the Fund Manager had a lack of ability to influence the investment terms of these rounds
(which were set by the incoming investors) many of which included liquidation preferences,
18
Source: Clarendon Fund Managers and Nitech Statutory Accounts March 2013.
NITECH GROWTH FUND PPE - VERSION 1.0 Page 15
allowing these later investors to realise repayment of their investment on exit, ahead of
investors (such as Nitech) from previous rounds19
.
Whilst the Fund was initially allocated £3m to cover all Fund costs (i.e. investment in businesses
and Fund Management costs), by March 2007 the Fund had been fully committed (reflecting the
strong demand for Nitech, and in particular Stage 2, support). As such, Invest NI sought, and was
subsequently granted, up to an additional £1m in funding to accommodate additional funding
opportunities that would potentially arise between March and December 2007, when it was
anticipated Invest NI would introduce a new and enhanced VC Fund (the Northern Ireland Spin
Out (NISPO) Fund) which would provide investment for similar businesses;
Whilst it was initially envisaged that Nitech would have a ten year-life (and thus would operate from
January 2003 to January 2013), the Fund availed of a 21-month extension to September 2014, which
was permissible under the terms of the LPA, to explore potential options on how best to close the
Fund, dissolve the Partnership and deal with any portfolio companies that continued to exist (including
opportunities to ‘realise’ any returns from the investments). The Evaluation Team understands that this
time period was further extended to December 2014 to facilitate the completion of the current final
evaluation of Nitech20
.
During February 2014, Invest NI requested and was subsequently provided with a ‘Realisation’ Paper
by the CFM which identified a number of options that could be taken by Invest NI as to how the
outstanding companies could be managed and ultimately realised. Based on the findings of the
Realisation Paper, Invest NI requested and was subsequently provided with a paper by CFM
summarising the value of existing portfolio companies/investments at that time and a cost-benefit
analysis of CFM ‘managing-out’ the existing portfolio companies/investments.
An analysis of the current status of the each of the portfolio companies in detailed in Section 4.7.
3.5 Risks
The absence of the Fund’s original approval documentation (Economic Appraisal and Casework)
limits the Evaluation Team from commenting on whether the potential risks identified at the outset,
arose during the delivery of the Fund, as well as the appropriateness of any contingency measures that
were put in place to mitigate against these risks (in the event that they occurred).
Notwithstanding this we note that:
In August 2005, an independent Third Party Organisation (TPO) report of Nitech was provided to
Invest NI. Whilst the Evaluation Team was only provided with a high level summary of the
findings of this report, we note that no issues were identified by the inspection in relation to the
use of funds and only a “number of minor recommendations” were made21
.
19
These effects are not solely restricted to Nitech, but are typical of many early-stage funds investing in technology
businesses requiring multiple rounds of investment. 20
Please note that due to considerable delays (amounting to months) in receiving information to facilitate the
completion of the Evaluation meant that the Evaluation could only be completed after December 2014. 21
These Recommendations were not available during the Evaluation.
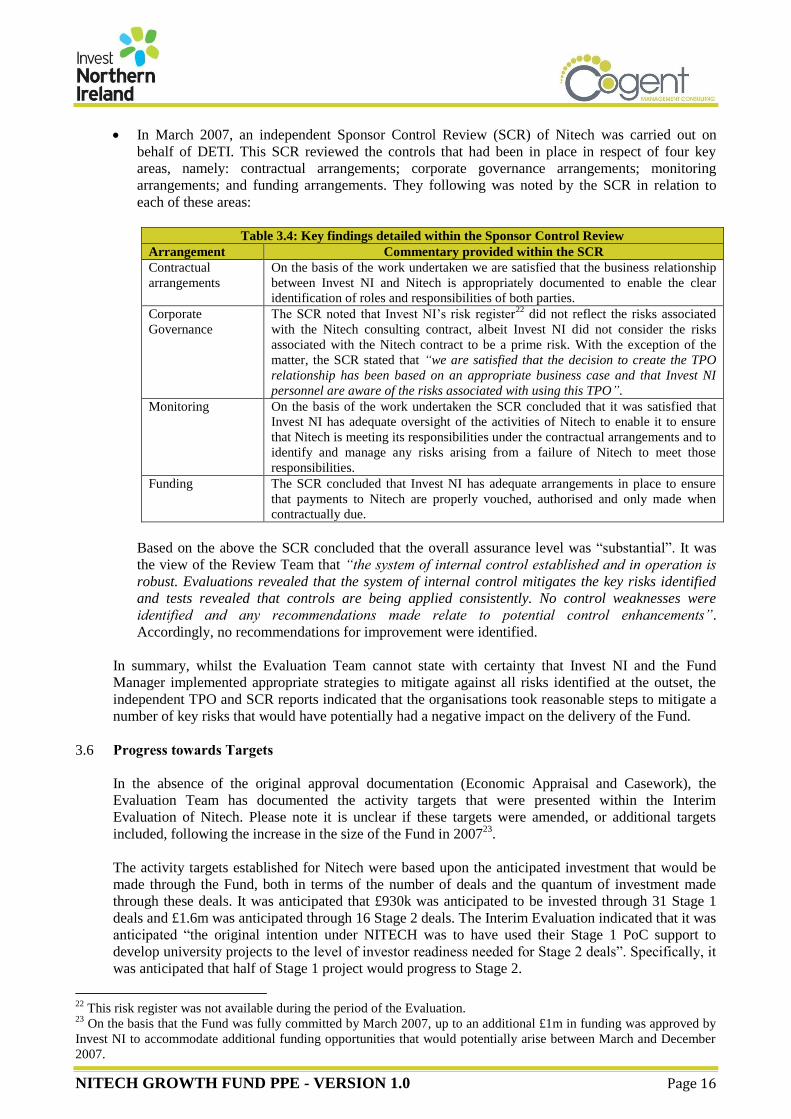
NITECH GROWTH FUND PPE - VERSION 1.0 Page 16
In March 2007, an independent Sponsor Control Review (SCR) of Nitech was carried out on
behalf of DETI. This SCR reviewed the controls that had been in place in respect of four key
areas, namely: contractual arrangements; corporate governance arrangements; monitoring
arrangements; and funding arrangements. They following was noted by the SCR in relation to
each of these areas:
Table 3.4: Key findings detailed within the Sponsor Control Review
Arrangement Commentary provided within the SCR
Contractual
arrangements
On the basis of the work undertaken we are satisfied that the business relationship
between Invest NI and Nitech is appropriately documented to enable the clear
identification of roles and responsibilities of both parties.
Corporate
Governance
The SCR noted that Invest NI’s risk register22
did not reflect the risks associated
with the Nitech consulting contract, albeit Invest NI did not consider the risks
associated with the Nitech contract to be a prime risk. With the exception of the
matter, the SCR stated that “we are satisfied that the decision to create the TPO
relationship has been based on an appropriate business case and that Invest NI
personnel are aware of the risks associated with using this TPO”.
Monitoring On the basis of the work undertaken the SCR concluded that it was satisfied that
Invest NI has adequate oversight of the activities of Nitech to enable it to ensure
that Nitech is meeting its responsibilities under the contractual arrangements and to
identify and manage any risks arising from a failure of Nitech to meet those
responsibilities.
Funding The SCR concluded that Invest NI has adequate arrangements in place to ensure
that payments to Nitech are properly vouched, authorised and only made when
contractually due.
Based on the above the SCR concluded that the overall assurance level was “substantial”. It was
the view of the Review Team that “the system of internal control established and in operation is
robust. Evaluations revealed that the system of internal control mitigates the key risks identified
and tests revealed that controls are being applied consistently. No control weaknesses were
identified and any recommendations made relate to potential control enhancements”.
Accordingly, no recommendations for improvement were identified.
In summary, whilst the Evaluation Team cannot state with certainty that Invest NI and the Fund
Manager implemented appropriate strategies to mitigate against all risks identified at the outset, the
independent TPO and SCR reports indicated that the organisations took reasonable steps to mitigate a
number of key risks that would have potentially had a negative impact on the delivery of the Fund.
3.6 Progress towards Targets
In the absence of the original approval documentation (Economic Appraisal and Casework), the
Evaluation Team has documented the activity targets that were presented within the Interim
Evaluation of Nitech. Please note it is unclear if these targets were amended, or additional targets
included, following the increase in the size of the Fund in 200723
.
The activity targets established for Nitech were based upon the anticipated investment that would be
made through the Fund, both in terms of the number of deals and the quantum of investment made
through these deals. It was anticipated that £930k was anticipated to be invested through 31 Stage 1
deals and £1.6m was anticipated through 16 Stage 2 deals. The Interim Evaluation indicated that it was
anticipated “the original intention under NITECH was to have used their Stage 1 PoC support to
develop university projects to the level of investor readiness needed for Stage 2 deals”. Specifically, it
was anticipated that half of Stage 1 project would progress to Stage 2.
22
This risk register was not available during the period of the Evaluation. 23
On the basis that the Fund was fully committed by March 2007, up to an additional £1m in funding was approved by
Invest NI to accommodate additional funding opportunities that would potentially arise between March and December
2007.
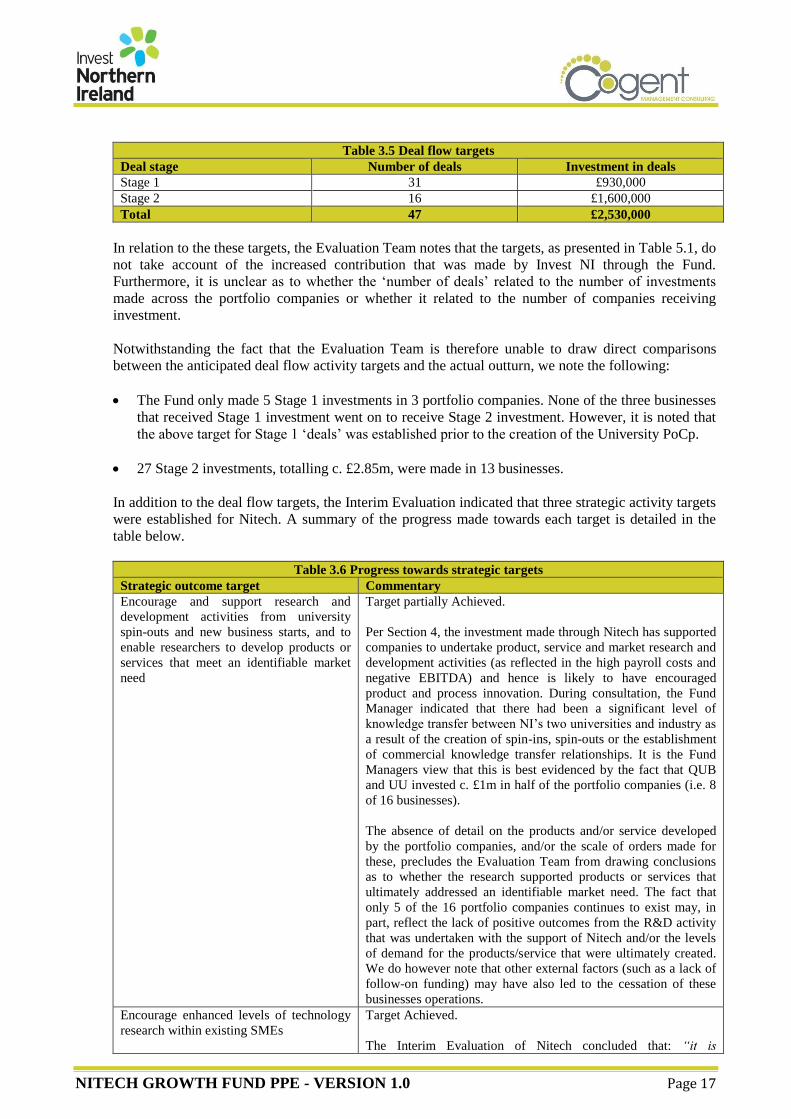
NITECH GROWTH FUND PPE - VERSION 1.0 Page 17
Table 3.5 Deal flow targets
Deal stage Number of deals Investment in deals
Stage 1 31 £930,000
Stage 2 16 £1,600,000
Total 47 £2,530,000
In relation to the these targets, the Evaluation Team notes that the targets, as presented in Table 5.1, do
not take account of the increased contribution that was made by Invest NI through the Fund.
Furthermore, it is unclear as to whether the ‘number of deals’ related to the number of investments
made across the portfolio companies or whether it related to the number of companies receiving
investment.
Notwithstanding the fact that the Evaluation Team is therefore unable to draw direct comparisons
between the anticipated deal flow activity targets and the actual outturn, we note the following:
The Fund only made 5 Stage 1 investments in 3 portfolio companies. None of the three businesses
that received Stage 1 investment went on to receive Stage 2 investment. However, it is noted that
the above target for Stage 1 ‘deals’ was established prior to the creation of the University PoCp.
27 Stage 2 investments, totalling c. £2.85m, were made in 13 businesses.
In addition to the deal flow targets, the Interim Evaluation indicated that three strategic activity targets
were established for Nitech. A summary of the progress made towards each target is detailed in the
table below.
Table 3.6 Progress towards strategic targets
Strategic outcome target Commentary
Encourage and support research and
development activities from university
spin-outs and new business starts, and to
enable researchers to develop products or
services that meet an identifiable market
need
Target partially Achieved.
Per Section 4, the investment made through Nitech has supported
companies to undertake product, service and market research and
development activities (as reflected in the high payroll costs and
negative EBITDA) and hence is likely to have encouraged
product and process innovation. During consultation, the Fund
Manager indicated that there had been a significant level of
knowledge transfer between NI’s two universities and industry as
a result of the creation of spin-ins, spin-outs or the establishment
of commercial knowledge transfer relationships. It is the Fund
Managers view that this is best evidenced by the fact that QUB
and UU invested c. £1m in half of the portfolio companies (i.e. 8
of 16 businesses).
The absence of detail on the products and/or service developed
by the portfolio companies, and/or the scale of orders made for
these, precludes the Evaluation Team from drawing conclusions
as to whether the research supported products or services that
ultimately addressed an identifiable market need. The fact that
only 5 of the 16 portfolio companies continues to exist may, in
part, reflect the lack of positive outcomes from the R&D activity
that was undertaken with the support of Nitech and/or the levels
of demand for the products/service that were ultimately created.
We do however note that other external factors (such as a lack of
follow-on funding) may have also led to the cessation of these
businesses operations.
Encourage enhanced levels of technology
research within existing SMEs
Target Achieved.
The Interim Evaluation of Nitech concluded that: “it is
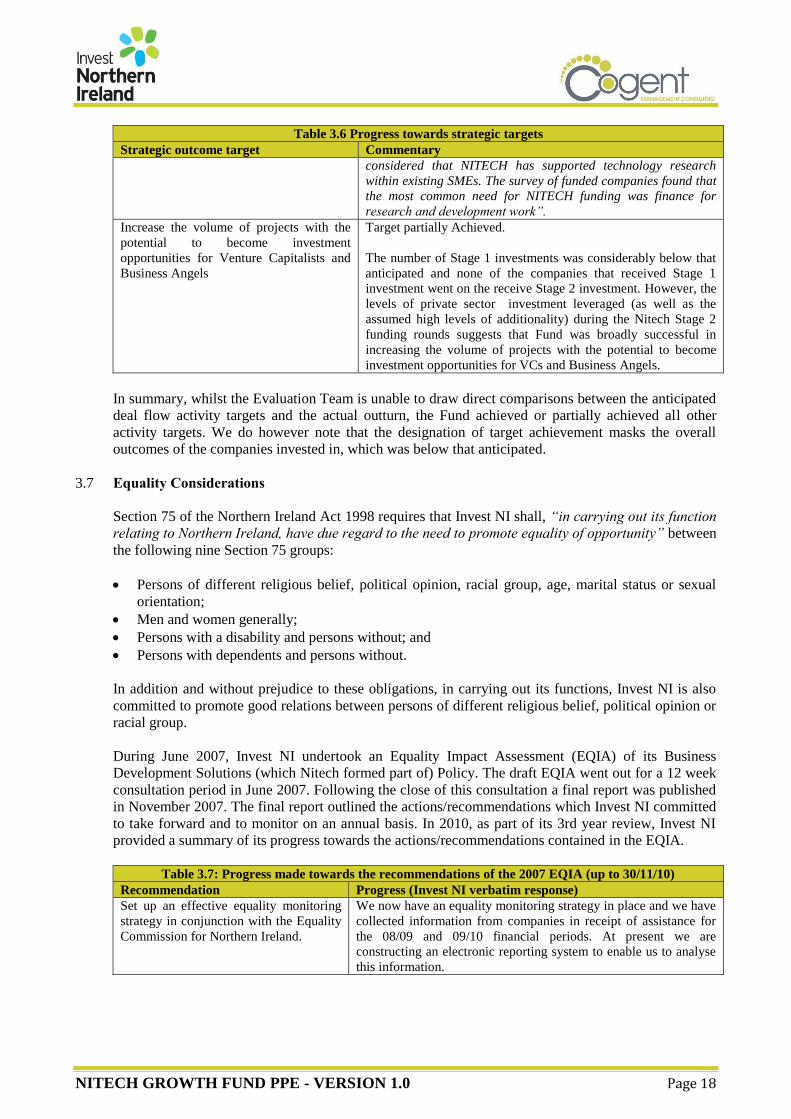
NITECH GROWTH FUND PPE - VERSION 1.0 Page 18
Table 3.6 Progress towards strategic targets
Strategic outcome target Commentary
considered that NITECH has supported technology research
within existing SMEs. The survey of funded companies found that
the most common need for NITECH funding was finance for
research and development work”.
Increase the volume of projects with the
potential to become investment
opportunities for Venture Capitalists and
Business Angels
Target partially Achieved.
The number of Stage 1 investments was considerably below that
anticipated and none of the companies that received Stage 1
investment went on the receive Stage 2 investment. However, the
levels of private sector investment leveraged (as well as the
assumed high levels of additionality) during the Nitech Stage 2
funding rounds suggests that Fund was broadly successful in
increasing the volume of projects with the potential to become
investment opportunities for VCs and Business Angels.
In summary, whilst the Evaluation Team is unable to draw direct comparisons between the anticipated
deal flow activity targets and the actual outturn, the Fund achieved or partially achieved all other
activity targets. We do however note that the designation of target achievement masks the overall
outcomes of the companies invested in, which was below that anticipated.
3.7 Equality Considerations
Section 75 of the Northern Ireland Act 1998 requires that Invest NI shall, “in carrying out its function
relating to Northern Ireland, have due regard to the need to promote equality of opportunity” between
the following nine Section 75 groups:
Persons of different religious belief, political opinion, racial group, age, marital status or sexual
orientation;
Men and women generally;
Persons with a disability and persons without; and
Persons with dependents and persons without.
In addition and without prejudice to these obligations, in carrying out its functions, Invest NI is also
committed to promote good relations between persons of different religious belief, political opinion or
racial group.
During June 2007, Invest NI undertook an Equality Impact Assessment (EQIA) of its Business
Development Solutions (which Nitech formed part of) Policy. The draft EQIA went out for a 12 week
consultation period in June 2007. Following the close of this consultation a final report was published
in November 2007. The final report outlined the actions/recommendations which Invest NI committed
to take forward and to monitor on an annual basis. In 2010, as part of its 3rd year review, Invest NI
provided a summary of its progress towards the actions/recommendations contained in the EQIA.
Table 3.7: Progress made towards the recommendations of the 2007 EQIA (up to 30/11/10)
Recommendation Progress (Invest NI verbatim response)
Set up an effective equality monitoring
strategy in conjunction with the Equality
Commission for Northern Ireland.
We now have an equality monitoring strategy in place and we have
collected information from companies in receipt of assistance for
the 08/09 and 09/10 financial periods. At present we are
constructing an electronic reporting system to enable us to analyse
this information.
NITECH GROWTH FUND PPE - VERSION 1.0 Page 19
Additional criteria for programmes or
schemes will be clearly defined and set
out; and any potential adverse impacts
associated with these criteria will be
considered.
The majority of BDS programmes target client companies. On the
rare occasion where programmes have targeted individuals, there
has been a sound rationale for this and criteria have been explicitly
defined. There is also ongoing screening of all programmes to
ensure equality of opportunity. We will again look at access to our
programmes and services within the remit of the ongoing
Communications and Access EQIA.
When a BDS programme targets certain
groups then the reasons for targeting
these groups will be made transparent. A
review of programme accessibility will
also be undertaken to ensure consistency
of approach.
Where a BDS programme targets a certain grouping there will be a
clear rationale outlined for this. The Communication and Access
EQIA, due to be finalised in 2010, will review overall accessibility
to Invest NI, including that of programme accessibility
There will be ongoing training of front
line staff and in particular Client
Executives in Section 75. Where external
consultants are employed then their
responsibilities under Section 75 will
also be made clear, and this will include
any training requirements.
All Invest NI staff has received equality and diversity training. This
will continue for any newly recruited staff. In 07/08 staff received
specific disability awareness training and tailored training is
ongoing for all staff. Staff also availed of equality screening and
monitoring training in May 2009 and we have conducted additional
training on how to complete the new equality screening forms
during the summer of 2010.
Each programme will make clear, in all
documentation, that materials can be
made available in alternative formats
where necessary and on request.
It is stated on all major Invest NI corporate publications, that they
will be made available, on request, in alternative formats. We will
however review this through the course of the Communications
and Access EQIA and make changes where appropriate.
Marketing of BDS programmes and
services among minority communities
will be considered as part of a broader
positive action programme.
In August 2008 Invest NI held an Engaging Ethnic Minority
Enterprise seminar in conjunction with NICEM. This seminar
promoted Invest NI programmes and how this grouping could best
avail of the assistance on offer. We are also working with ex-
prisoners groups to promote services and better accessibility to
services.
All application forms will use a format
with clear fonts, layout, and colours etc.
that are accessible to those with special
needs.
We have developed and produced “Making Information More
Accessible” guidelines which are held on Invest NI's intranet and
accessible to all staff. We are currently reviewing this as we
conduct our Communications and Access EQIA to ensure that the
information and guidance is still up to date and practical.
As stated within the Interim Evaluation, a lack of profiling data of applicants (in terms of the Section
75 categories) precludes the Evaluation Team from concluding that there were no adverse impacts on
persons from Section 75 categories or upon equality of opportunity. However, we note that the Fund
was available to all NI businesses and there is no evidence to suggest that the Fund Manager rejected
applications on the basis of anything other than the future viability of the business proposition.
Similarly, the Evaluation Team’s review of Nitech activity and monitoring information provided
during the evaluation process has identified:
No evidence of higher or lower participation or uptake of different groups;
No evidence to indicate that different groups had different needs, experiences, issues and priorities
in relation to Nitech investment activity;
No opportunities to better promote equality of opportunity or better community relations by
altering the work of Nitech;
No accessibility issues that might run contrary to the Disability Discrimination Act 1995.
On this basis, the Evaluation Team concludes that, whilst Nitech was not specifically targeted at any
specific Section 75 categories, it does not appear to have had an adverse impact on any Section 75
group.
NITECH GROWTH FUND PPE - VERSION 1.0 Page 20
3.9 Summary Conclusions
The following key conclusions can be drawn with regards to the activity that was delivered through
Nitech during the period under review:
Between April 2003 and November 2013, Nitech invested c. £2.92m in a total of 16 companies;
The Fund made 5 Stage 1 investments, totalling £70k, in 3 businesses. The average investment in
each business was £23.3k. All of the Stage 1 investments were made in the form of a
repayable/convertible grant. None of the three businesses that received Stage 1 support went on to
receive Stage 2 investment.
27 Stage 2 investments, totalling c. £2.85m, were made in 13 businesses. The average investment
in each business that received Stage 2 investment was £219k, whilst the level of individual
business investment ranged from £120k to £275k. The vast majority (96% or £2.74m) of Stage 2
equity investments were made in the form of ordinary shares, with the reminder (£101k or 4%)
made in the form of convertible loans.
The lack of availability of follow-on funding also resulted in the dilution of the Fund’s shares,
reducing the value of its shareholding, unless the following rounds were at a significantly higher
valuation. Of equal importance, the lack of participation in these subsequent funding rounds
frequently meant that the Fund Manager had a lack of ability to influence the investment terms of
these rounds (which were set by the incoming investors) many of which included liquidation
preferences, allowing these later investors to realise repayment of their investment on exit, ahead
of investors (such as Nitech) from previous rounds;
Whilst the Evaluation Team cannot state with certainty that Invest NI and the Fund Manager
implemented appropriate strategies to mitigate against all risks identified at the outset (on the basis
that these risks are unknown), the independent TPO and SCR reports indicated that the
organisations took reasonable steps to mitigate against a number of key risks that would have
potentially had a negative impact on the delivery and impact of the Fund; and
Whilst Nitech was not specifically targeted at any specific Section 75 categories, it does not
appear to have had an adverse impact on any Section 75 group.
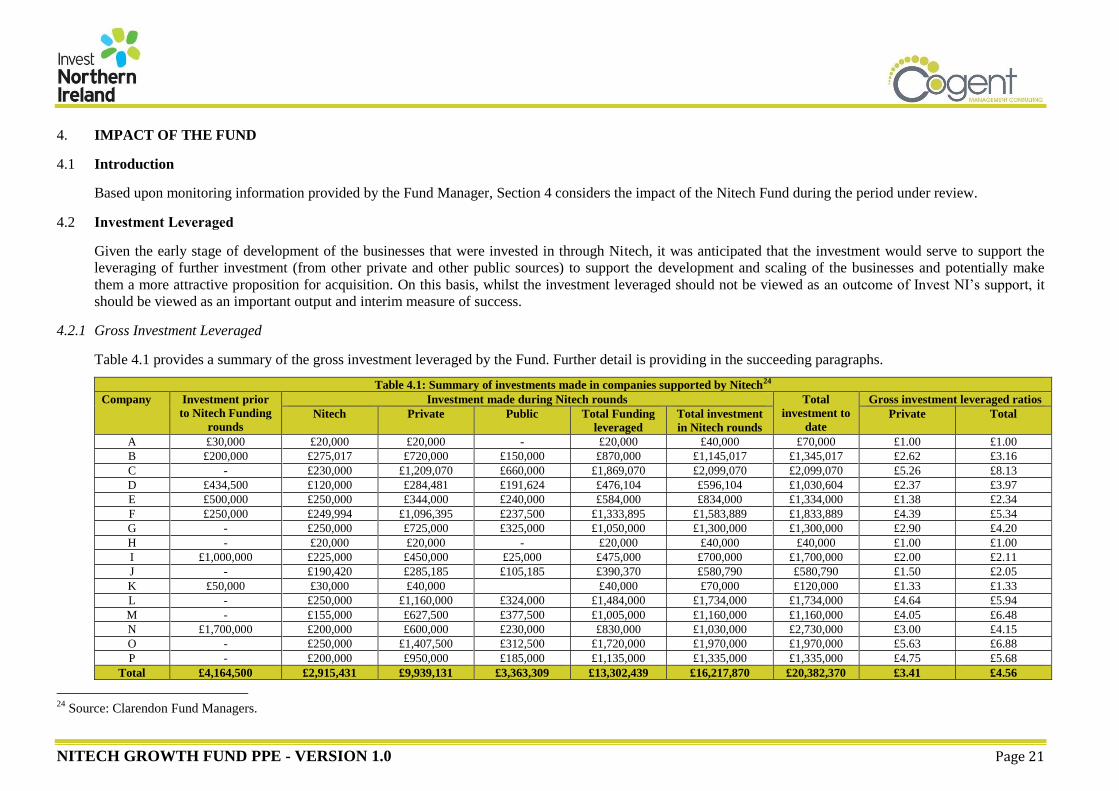
NITECH GROWTH FUND PPE - VERSION 1.0 Page 21
4. IMPACT OF THE FUND
4.1 Introduction
Based upon monitoring information provided by the Fund Manager, Section 4 considers the impact of the Nitech Fund during the period under review.
4.2 Investment Leveraged
Given the early stage of development of the businesses that were invested in through Nitech, it was anticipated that the investment would serve to support the
leveraging of further investment (from other private and other public sources) to support the development and scaling of the businesses and potentially make
them a more attractive proposition for acquisition. On this basis, whilst the investment leveraged should not be viewed as an outcome of Invest NI’s support, it
should be viewed as an important output and interim measure of success.
4.2.1 Gross Investment Leveraged
Table 4.1 provides a summary of the gross investment leveraged by the Fund. Further detail is providing in the succeeding paragraphs.
Table 4.1: Summary of investments made in companies supported by Nitech24
Company Investment prior
to Nitech Funding
rounds
Investment made during Nitech rounds Total
investment to
date
Gross investment leveraged ratios
Nitech Private Public Total Funding
leveraged
Total investment
in Nitech rounds
Private Total
A £30,000 £20,000 £20,000 - £20,000 £40,000 £70,000 £1.00 £1.00
B £200,000 £275,017 £720,000 £150,000 £870,000 £1,145,017 £1,345,017 £2.62 £3.16
C - £230,000 £1,209,070 £660,000 £1,869,070 £2,099,070 £2,099,070 £5.26 £8.13
D £434,500 £120,000 £284,481 £191,624 £476,104 £596,104 £1,030,604 £2.37 £3.97
E £500,000 £250,000 £344,000 £240,000 £584,000 £834,000 £1,334,000 £1.38 £2.34
F £250,000 £249,994 £1,096,395 £237,500 £1,333,895 £1,583,889 £1,833,889 £4.39 £5.34
G - £250,000 £725,000 £325,000 £1,050,000 £1,300,000 £1,300,000 £2.90 £4.20
H - £20,000 £20,000 - £20,000 £40,000 £40,000 £1.00 £1.00
I £1,000,000 £225,000 £450,000 £25,000 £475,000 £700,000 £1,700,000 £2.00 £2.11
J - £190,420 £285,185 £105,185 £390,370 £580,790 £580,790 £1.50 £2.05
K £50,000 £30,000 £40,000 £40,000 £70,000 £120,000 £1.33 £1.33
L - £250,000 £1,160,000 £324,000 £1,484,000 £1,734,000 £1,734,000 £4.64 £5.94
M - £155,000 £627,500 £377,500 £1,005,000 £1,160,000 £1,160,000 £4.05 £6.48
N £1,700,000 £200,000 £600,000 £230,000 £830,000 £1,030,000 £2,730,000 £3.00 £4.15
O - £250,000 £1,407,500 £312,500 £1,720,000 £1,970,000 £1,970,000 £5.63 £6.88
P - £200,000 £950,000 £185,000 £1,135,000 £1,335,000 £1,335,000 £4.75 £5.68
Total £4,164,500 £2,915,431 £9,939,131 £3,363,309 £13,302,439 £16,217,870 £20,382,370 £3.41 £4.56
24
Source: Clarendon Fund Managers.
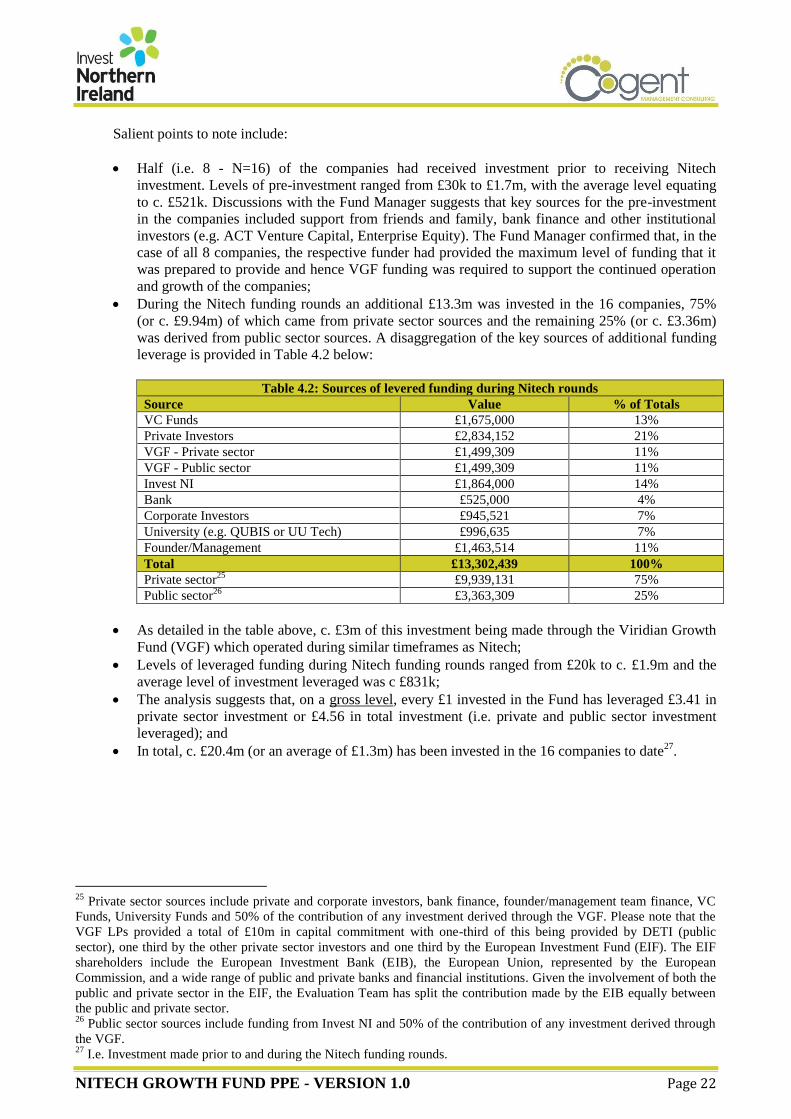
NITECH GROWTH FUND PPE - VERSION 1.0 Page 22
Salient points to note include:
Half (i.e. 8 - N=16) of the companies had received investment prior to receiving Nitech
investment. Levels of pre-investment ranged from £30k to £1.7m, with the average level equating
to c. £521k. Discussions with the Fund Manager suggests that key sources for the pre-investment
in the companies included support from friends and family, bank finance and other institutional
investors (e.g. ACT Venture Capital, Enterprise Equity). The Fund Manager confirmed that, in the
case of all 8 companies, the respective funder had provided the maximum level of funding that it
was prepared to provide and hence VGF funding was required to support the continued operation
and growth of the companies;
During the Nitech funding rounds an additional £13.3m was invested in the 16 companies, 75%
(or c. £9.94m) of which came from private sector sources and the remaining 25% (or c. £3.36m)
was derived from public sector sources. A disaggregation of the key sources of additional funding
leverage is provided in Table 4.2 below:
Table 4.2: Sources of levered funding during Nitech rounds
Source Value % of Totals
VC Funds £1,675,000 13%
Private Investors £2,834,152 21%
VGF - Private sector £1,499,309 11%
VGF - Public sector £1,499,309 11%
Invest NI £1,864,000 14%
Bank £525,000 4%
Corporate Investors £945,521 7%
University (e.g. QUBIS or UU Tech) £996,635 7%
Founder/Management £1,463,514 11%
Total £13,302,439 100%
Private sector25
£9,939,131 75%
Public sector26
£3,363,309 25%
As detailed in the table above, c. £3m of this investment being made through the Viridian Growth
Fund (VGF) which operated during similar timeframes as Nitech;
Levels of leveraged funding during Nitech funding rounds ranged from £20k to c. £1.9m and the
average level of investment leveraged was c £831k;
The analysis suggests that, on a gross level, every £1 invested in the Fund has leveraged £3.41 in
private sector investment or £4.56 in total investment (i.e. private and public sector investment
leveraged); and
In total, c. £20.4m (or an average of £1.3m) has been invested in the 16 companies to date27
.
25
Private sector sources include private and corporate investors, bank finance, founder/management team finance, VC
Funds, University Funds and 50% of the contribution of any investment derived through the VGF. Please note that the
VGF LPs provided a total of £10m in capital commitment with one-third of this being provided by DETI (public
sector), one third by the other private sector investors and one third by the European Investment Fund (EIF). The EIF
shareholders include the European Investment Bank (EIB), the European Union, represented by the European
Commission, and a wide range of public and private banks and financial institutions. Given the involvement of both the
public and private sector in the EIF, the Evaluation Team has split the contribution made by the EIB equally between
the public and private sector. 26
Public sector sources include funding from Invest NI and 50% of the contribution of any investment derived through
the VGF. 27
I.e. Investment made prior to and during the Nitech funding rounds.
NITECH GROWTH FUND PPE - VERSION 1.0 Page 23
4.2.3 Net Additional Investment Leveraged
Additionality
The net impact of Nitech (i.e. its additionality) relating to its ability to enable companies to leverage
investment during Nitech funding rounds can only be measured after making allowances for what
would have happened in the absence of the support from Nitech. In the absence of undertaking
primary research with private sector investors28
, the Evaluation Team is unable to conclude with
certainty as to the contribution that Nitech (both in terms of financial and non-financial support
provided) had in supporting businesses to leverage investment or maintain and expand their
operations.
However, discussions with Invest NI and the Fund Manager suggest that Nitech would have played a
pivotal role in supporting the businesses to lever investment (and hence additionality level would be
high) on the basis that (amongst other things):
Funders, who had provided investment to companies prior to the Nitech funding round, were no
longer willing and/or able to provide further funding nor were they likely to attract funding from
alternative sources. As such, in the majority of cases, Nitech and its Fund Manager led or was part
of a subsequent first institutional investor round, was the major investor and (in a number of cases)
led or was part of a ‘rescue round’;
There was a lack of other investment funds and wrap-around investor readiness support available
in the marketplace (VGF and Crescent Capital II being the only other equity fund available at that
time);
VC managers from outside NI were reluctant to consider deals within NI due to their relatively
small size and the fact that NI’s peripheral location made it more difficult to actively manage
potential investments;
A number of the private sector investors would have been located outside NI and would have been
unwilling to manage their investment remotely. As such, it is Invest NI’s view that these investors
would have been reluctant to invest had they not had a trusted local partner (in the form of the
Nitech and the Fund Manager);
The Fund Manager also notes that it played an active role attracting other VC investors to the
companies during the period under review; and
There were a number of market and non-market failures (noted in Section 2) that were preventing
businesses from accessing finance at that time.
For illustrative purposes we have calculated the net additional funding leveraged using levels of
additionality based on three scenarios29
:
Levels of additionality assigned by the Fund Manager (Scenario 1) - Based on its
understanding of the impact that the Nitech support (financial and non-financial) had on
leveraging further investment to fund each individual company’s ongoing operations and growth,
the Fund Manager assigned a level of additionality which it feels best represents the likelihood
that the company would have derived the leveraged funding during the Nitech funding rounds (or
would have derived the funding to a similar scale or within a similar timescale) in the absence of
Nitech funding. The level of additionality assigned to each company by the Fund Manager is
provided in the table below:
28
As detailed in Section 1, the Evaluation Steering Group requested that Cogent did not undertake primary research
with private sector investors (that had provided leveraged investment) given the extensive time period that has passed
since making their investment and the associated concerns over the reliability of any feedback that would be received
during the primary research. 29
Please note that the approach to calculating net additional funding leveraged was agreed in conjunction with the
Evaluation Steering Group during the course of the Evaluation.
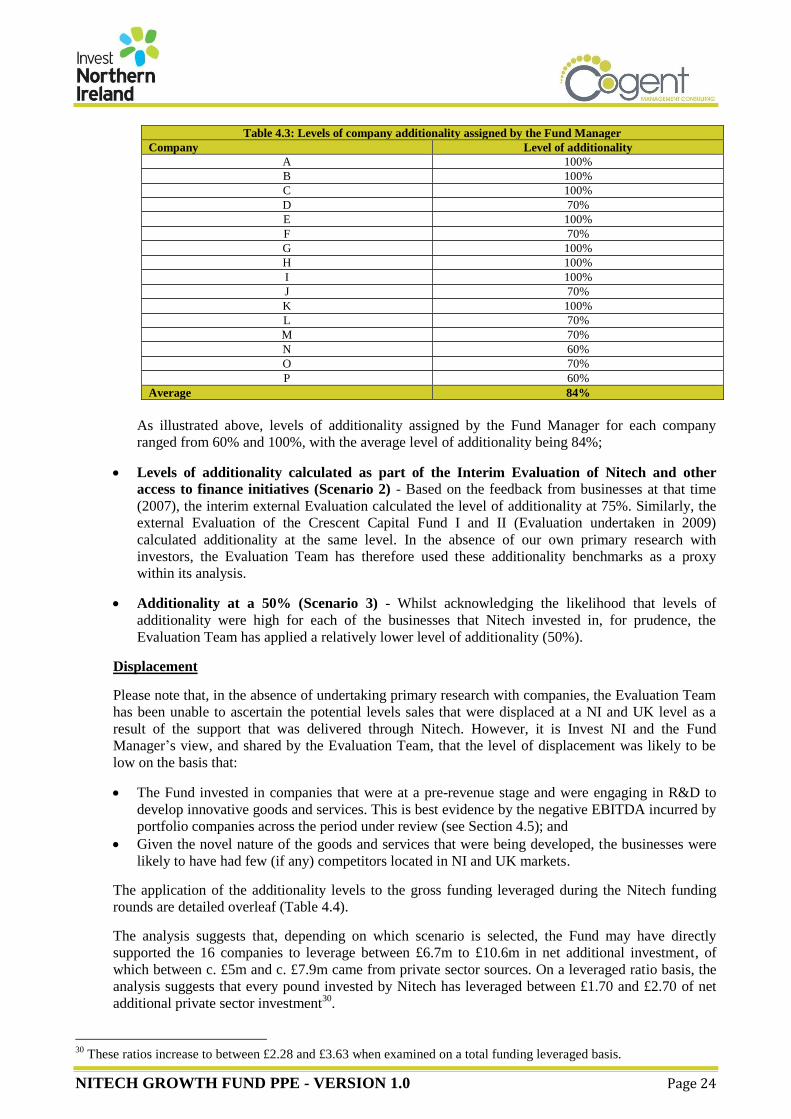
NITECH GROWTH FUND PPE - VERSION 1.0 Page 24
Table 4.3: Levels of company additionality assigned by the Fund Manager
Company Level of additionality
A 100%
B 100%
C 100%
D 70%
E 100%
F 70%
G 100%
H 100%
I 100%
J 70%
K 100%
L 70%
M 70%
N 60%
O 70%
P 60%
Average 84%
As illustrated above, levels of additionality assigned by the Fund Manager for each company
ranged from 60% and 100%, with the average level of additionality being 84%;
Levels of additionality calculated as part of the Interim Evaluation of Nitech and other
access to finance initiatives (Scenario 2) - Based on the feedback from businesses at that time
(2007), the interim external Evaluation calculated the level of additionality at 75%. Similarly, the
external Evaluation of the Crescent Capital Fund I and II (Evaluation undertaken in 2009)
calculated additionality at the same level. In the absence of our own primary research with
investors, the Evaluation Team has therefore used these additionality benchmarks as a proxy
within its analysis.
Additionality at a 50% (Scenario 3) - Whilst acknowledging the likelihood that levels of
additionality were high for each of the businesses that Nitech invested in, for prudence, the
Evaluation Team has applied a relatively lower level of additionality (50%).
Displacement
Please note that, in the absence of undertaking primary research with companies, the Evaluation Team
has been unable to ascertain the potential levels sales that were displaced at a NI and UK level as a
result of the support that was delivered through Nitech. However, it is Invest NI and the Fund
Manager’s view, and shared by the Evaluation Team, that the level of displacement was likely to be
low on the basis that:
The Fund invested in companies that were at a pre-revenue stage and were engaging in R&D to
develop innovative goods and services. This is best evidence by the negative EBITDA incurred by
portfolio companies across the period under review (see Section 4.5); and
Given the novel nature of the goods and services that were being developed, the businesses were
likely to have had few (if any) competitors located in NI and UK markets.
The application of the additionality levels to the gross funding leveraged during the Nitech funding
rounds are detailed overleaf (Table 4.4).
The analysis suggests that, depending on which scenario is selected, the Fund may have directly
supported the 16 companies to leverage between £6.7m to £10.6m in net additional investment, of
which between c. £5m and c. £7.9m came from private sector sources. On a leveraged ratio basis, the
analysis suggests that every pound invested by Nitech has leveraged between £1.70 and £2.70 of net
additional private sector investment30
.
30
These ratios increase to between £2.28 and £3.63 when examined on a total funding leveraged basis.
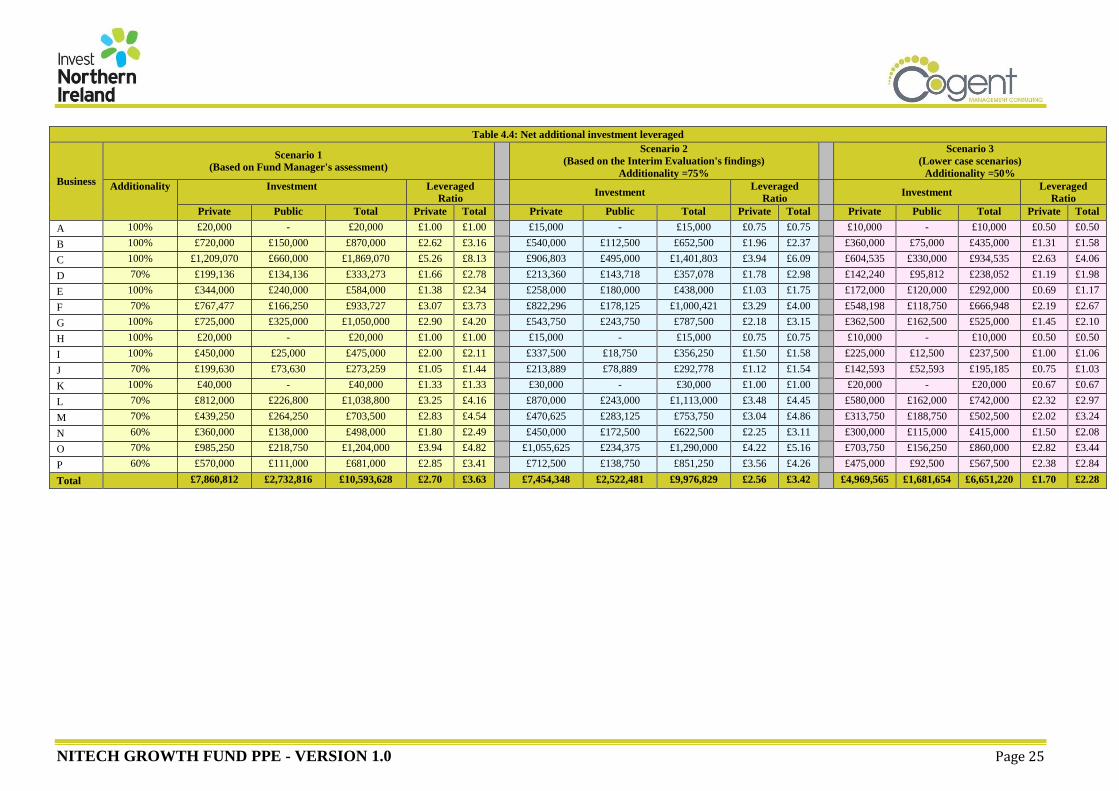
NITECH GROWTH FUND PPE - VERSION 1.0 Page 25
Table 4.4: Net additional investment leveraged
Business
Scenario 1
(Based on Fund Manager's assessment)
Scenario 2
(Based on the Interim Evaluation's findings)
Additionality =75%
Scenario 3
(Lower case scenarios)
Additionality =50%
Additionality Investment Leveraged
Ratio Investment
Leveraged
Ratio Investment
Leveraged
Ratio
Private Public Total Private Total Private Public Total Private Total Private Public Total Private Total
A 100% £20,000 - £20,000 £1.00 £1.00 £15,000 - £15,000 £0.75 £0.75 £10,000 - £10,000 £0.50 £0.50
B 100% £720,000 £150,000 £870,000 £2.62 £3.16 £540,000 £112,500 £652,500 £1.96 £2.37 £360,000 £75,000 £435,000 £1.31 £1.58
C 100% £1,209,070 £660,000 £1,869,070 £5.26 £8.13 £906,803 £495,000 £1,401,803 £3.94 £6.09 £604,535 £330,000 £934,535 £2.63 £4.06
D 70% £199,136 £134,136 £333,273 £1.66 £2.78 £213,360 £143,718 £357,078 £1.78 £2.98 £142,240 £95,812 £238,052 £1.19 £1.98
E 100% £344,000 £240,000 £584,000 £1.38 £2.34 £258,000 £180,000 £438,000 £1.03 £1.75 £172,000 £120,000 £292,000 £0.69 £1.17
F 70% £767,477 £166,250 £933,727 £3.07 £3.73 £822,296 £178,125 £1,000,421 £3.29 £4.00 £548,198 £118,750 £666,948 £2.19 £2.67
G 100% £725,000 £325,000 £1,050,000 £2.90 £4.20 £543,750 £243,750 £787,500 £2.18 £3.15 £362,500 £162,500 £525,000 £1.45 £2.10
H 100% £20,000 - £20,000 £1.00 £1.00 £15,000 - £15,000 £0.75 £0.75 £10,000 - £10,000 £0.50 £0.50
I 100% £450,000 £25,000 £475,000 £2.00 £2.11 £337,500 £18,750 £356,250 £1.50 £1.58 £225,000 £12,500 £237,500 £1.00 £1.06
J 70% £199,630 £73,630 £273,259 £1.05 £1.44 £213,889 £78,889 £292,778 £1.12 £1.54 £142,593 £52,593 £195,185 £0.75 £1.03
K 100% £40,000 - £40,000 £1.33 £1.33 £30,000 - £30,000 £1.00 £1.00 £20,000 - £20,000 £0.67 £0.67
L 70% £812,000 £226,800 £1,038,800 £3.25 £4.16 £870,000 £243,000 £1,113,000 £3.48 £4.45 £580,000 £162,000 £742,000 £2.32 £2.97
M 70% £439,250 £264,250 £703,500 £2.83 £4.54 £470,625 £283,125 £753,750 £3.04 £4.86 £313,750 £188,750 £502,500 £2.02 £3.24
N 60% £360,000 £138,000 £498,000 £1.80 £2.49 £450,000 £172,500 £622,500 £2.25 £3.11 £300,000 £115,000 £415,000 £1.50 £2.08
O 70% £985,250 £218,750 £1,204,000 £3.94 £4.82 £1,055,625 £234,375 £1,290,000 £4.22 £5.16 £703,750 £156,250 £860,000 £2.82 £3.44
P 60% £570,000 £111,000 £681,000 £2.85 £3.41 £712,500 £138,750 £851,250 £3.56 £4.26 £475,000 £92,500 £567,500 £2.38 £2.84
Total £7,860,812 £2,732,816 £10,593,628 £2.70 £3.63 £7,454,348 £2,522,481 £9,976,829 £2.56 £3.42 £4,969,565 £1,681,654 £6,651,220 £1.70 £2.28
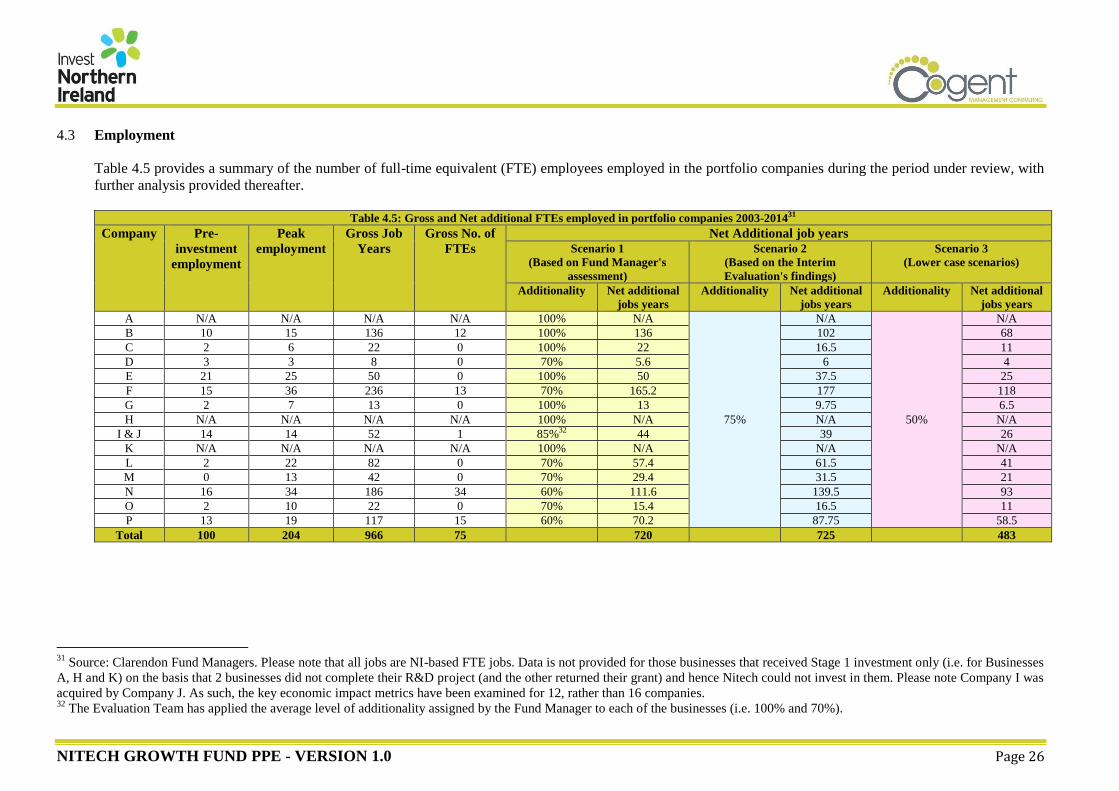
NITECH GROWTH FUND PPE - VERSION 1.0 Page 26
4.3 Employment
Table 4.5 provides a summary of the number of full-time equivalent (FTE) employees employed in the portfolio companies during the period under review, with
further analysis provided thereafter.
Table 4.5: Gross and Net additional FTEs employed in portfolio companies 2003-201431
Company Pre-
investment
employment
Peak
employment
Gross Job
Years
Gross No. of
FTEs
Net Additional job years
Scenario 1
(Based on Fund Manager's
assessment)
Scenario 2
(Based on the Interim
Evaluation's findings)
Scenario 3
(Lower case scenarios)
Additionality Net additional
jobs years
Additionality Net additional
jobs years
Additionality Net additional
jobs years
A N/A N/A N/A N/A 100% N/A
75%
N/A
50%
N/A
B 10 15 136 12 100% 136 102 68
C 2 6 22 0 100% 22 16.5 11
D 3 3 8 0 70% 5.6 6 4
E 21 25 50 0 100% 50 37.5 25
F 15 36 236 13 70% 165.2 177 118
G 2 7 13 0 100% 13 9.75 6.5
H N/A N/A N/A N/A 100% N/A N/A N/A
I & J 14 14 52 1 85%32 44 39 26
K N/A N/A N/A N/A 100% N/A N/A N/A
L 2 22 82 0 70% 57.4 61.5 41
M 0 13 42 0 70% 29.4 31.5 21
N 16 34 186 34 60% 111.6 139.5 93
O 2 10 22 0 70% 15.4 16.5 11
P 13 19 117 15 60% 70.2 87.75 58.5
Total 100 204 966 75 720 725 483
31
Source: Clarendon Fund Managers. Please note that all jobs are NI-based FTE jobs. Data is not provided for those businesses that received Stage 1 investment only (i.e. for Businesses
A, H and K) on the basis that 2 businesses did not complete their R&D project (and the other returned their grant) and hence Nitech could not invest in them. Please note Company I was
acquired by Company J. As such, the key economic impact metrics have been examined for 12, rather than 16 companies. 32
The Evaluation Team has applied the average level of additionality assigned by the Fund Manager to each of the businesses (i.e. 100% and 70%).
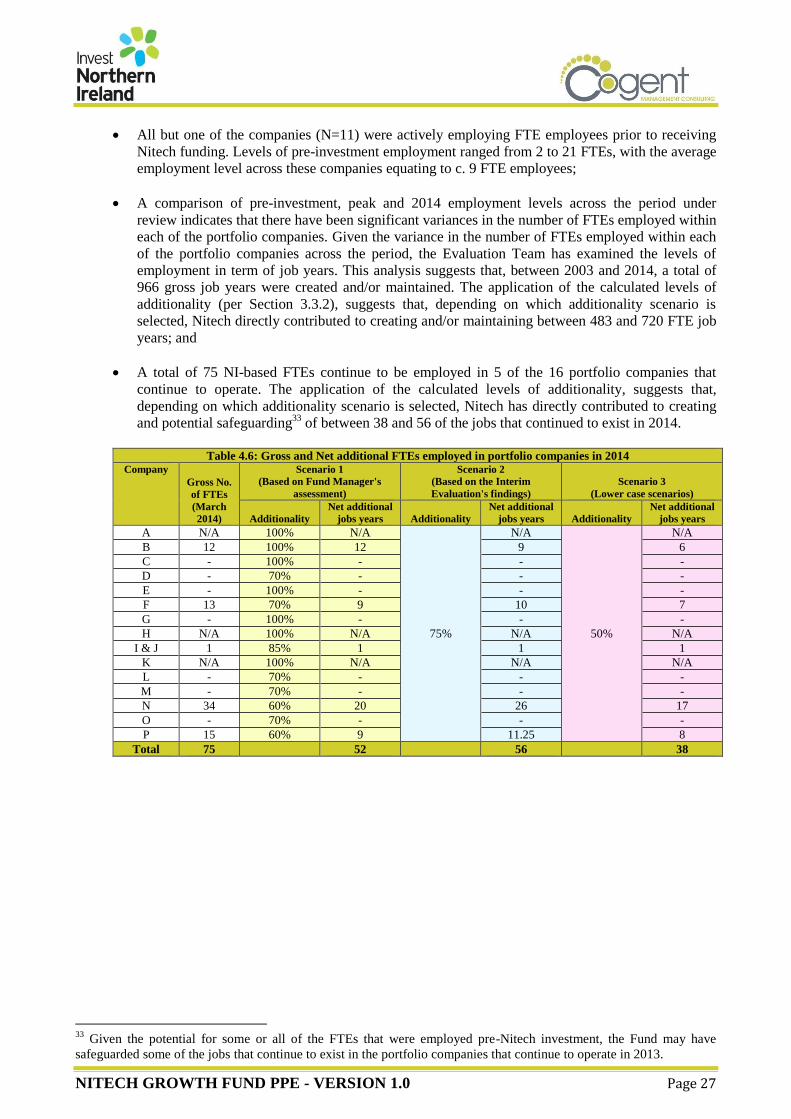
NITECH GROWTH FUND PPE - VERSION 1.0 Page 27
All but one of the companies (N=11) were actively employing FTE employees prior to receiving
Nitech funding. Levels of pre-investment employment ranged from 2 to 21 FTEs, with the average
employment level across these companies equating to c. 9 FTE employees;
A comparison of pre-investment, peak and 2014 employment levels across the period under
review indicates that there have been significant variances in the number of FTEs employed within
each of the portfolio companies. Given the variance in the number of FTEs employed within each
of the portfolio companies across the period, the Evaluation Team has examined the levels of
employment in term of job years. This analysis suggests that, between 2003 and 2014, a total of
966 gross job years were created and/or maintained. The application of the calculated levels of
additionality (per Section 3.3.2), suggests that, depending on which additionality scenario is
selected, Nitech directly contributed to creating and/or maintaining between 483 and 720 FTE job
years; and
A total of 75 NI-based FTEs continue to be employed in 5 of the 16 portfolio companies that
continue to operate. The application of the calculated levels of additionality, suggests that,
depending on which additionality scenario is selected, Nitech has directly contributed to creating
and potential safeguarding33
of between 38 and 56 of the jobs that continued to exist in 2014.
Table 4.6: Gross and Net additional FTEs employed in portfolio companies in 2014
Company
Gross No.
of FTEs
(March
2014)
Scenario 1
(Based on Fund Manager's
assessment)
Scenario 2
(Based on the Interim
Evaluation's findings)
Scenario 3
(Lower case scenarios)
Additionality
Net additional
jobs years Additionality
Net additional
jobs years Additionality
Net additional
jobs years
A N/A 100% N/A
75%
N/A
50%
N/A
B 12 100% 12 9 6
C - 100% - - -
D - 70% - - -
E - 100% - - -
F 13 70% 9 10 7
G - 100% - - -
H N/A 100% N/A N/A N/A
I & J 1 85% 1 1 1
K N/A 100% N/A N/A N/A
L - 70% - - -
M - 70% - - -
N 34 60% 20 26 17
O - 70% - - -
P 15 60% 9 11.25 8
Total 75
52
56
38
33
Given the potential for some or all of the FTEs that were employed pre-Nitech investment, the Fund may have
safeguarded some of the jobs that continue to exist in the portfolio companies that continue to operate in 2013.
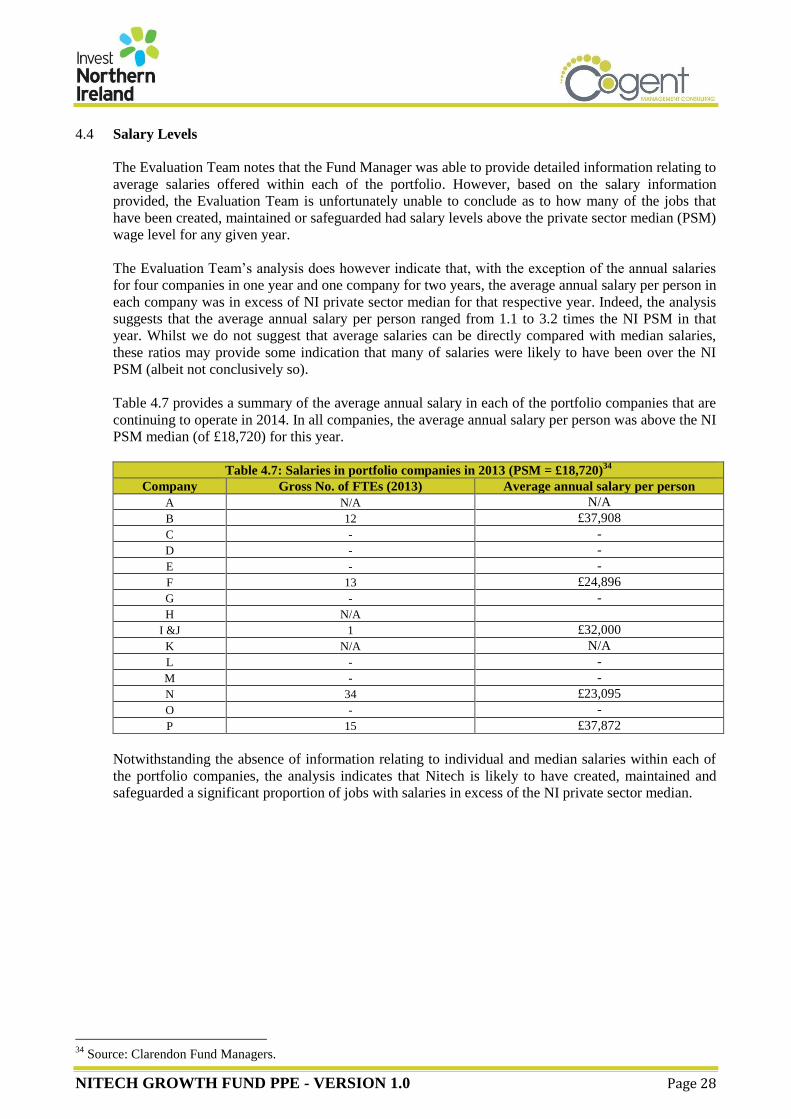
NITECH GROWTH FUND PPE - VERSION 1.0 Page 28
4.4 Salary Levels
The Evaluation Team notes that the Fund Manager was able to provide detailed information relating to
average salaries offered within each of the portfolio. However, based on the salary information
provided, the Evaluation Team is unfortunately unable to conclude as to how many of the jobs that
have been created, maintained or safeguarded had salary levels above the private sector median (PSM)
wage level for any given year.
The Evaluation Team’s analysis does however indicate that, with the exception of the annual salaries
for four companies in one year and one company for two years, the average annual salary per person in
each company was in excess of NI private sector median for that respective year. Indeed, the analysis
suggests that the average annual salary per person ranged from 1.1 to 3.2 times the NI PSM in that
year. Whilst we do not suggest that average salaries can be directly compared with median salaries,
these ratios may provide some indication that many of salaries were likely to have been over the NI
PSM (albeit not conclusively so).
Table 4.7 provides a summary of the average annual salary in each of the portfolio companies that are
continuing to operate in 2014. In all companies, the average annual salary per person was above the NI
PSM median (of £18,720) for this year.
Table 4.7: Salaries in portfolio companies in 2013 (PSM = £18,720)
34
Company Gross No. of FTEs (2013) Average annual salary per person
A N/A N/A
B 12 £37,908
C - -
D - -
E - -
F 13 £24,896
G - -
H N/A
I &J 1 £32,000
K N/A N/A
L - -
M - -
N 34 £23,095
O - -
P 15 £37,872
Notwithstanding the absence of information relating to individual and median salaries within each of
the portfolio companies, the analysis indicates that Nitech is likely to have created, maintained and
safeguarded a significant proportion of jobs with salaries in excess of the NI private sector median.
34
Source: Clarendon Fund Managers.
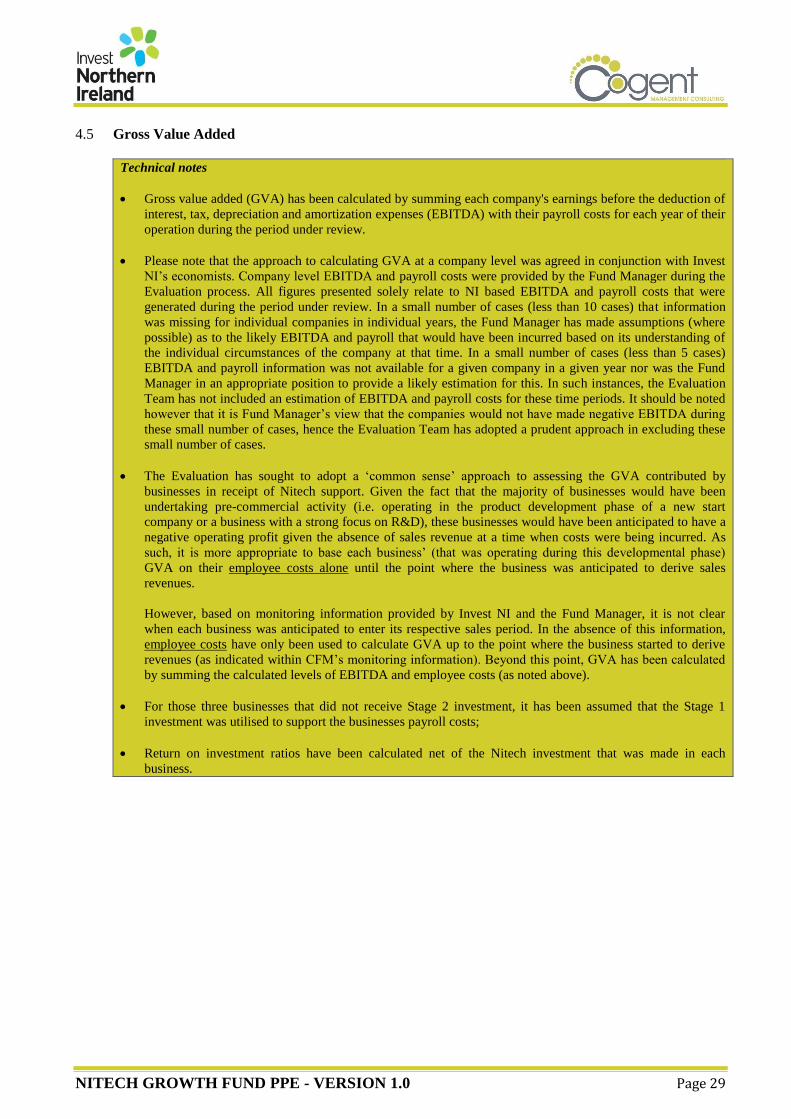
NITECH GROWTH FUND PPE - VERSION 1.0 Page 29
4.5 Gross Value Added
Technical notes
Gross value added (GVA) has been calculated by summing each company's earnings before the deduction of
interest, tax, depreciation and amortization expenses (EBITDA) with their payroll costs for each year of their
operation during the period under review.
Please note that the approach to calculating GVA at a company level was agreed in conjunction with Invest
NI’s economists. Company level EBITDA and payroll costs were provided by the Fund Manager during the
Evaluation process. All figures presented solely relate to NI based EBITDA and payroll costs that were
generated during the period under review. In a small number of cases (less than 10 cases) that information
was missing for individual companies in individual years, the Fund Manager has made assumptions (where
possible) as to the likely EBITDA and payroll that would have been incurred based on its understanding of
the individual circumstances of the company at that time. In a small number of cases (less than 5 cases)
EBITDA and payroll information was not available for a given company in a given year nor was the Fund
Manager in an appropriate position to provide a likely estimation for this. In such instances, the Evaluation
Team has not included an estimation of EBITDA and payroll costs for these time periods. It should be noted
however that it is Fund Manager’s view that the companies would not have made negative EBITDA during
these small number of cases, hence the Evaluation Team has adopted a prudent approach in excluding these
small number of cases.
The Evaluation has sought to adopt a ‘common sense’ approach to assessing the GVA contributed by
businesses in receipt of Nitech support. Given the fact that the majority of businesses would have been
undertaking pre-commercial activity (i.e. operating in the product development phase of a new start
company or a business with a strong focus on R&D), these businesses would have been anticipated to have a
negative operating profit given the absence of sales revenue at a time when costs were being incurred. As
such, it is more appropriate to base each business’ (that was operating during this developmental phase)
GVA on their employee costs alone until the point where the business was anticipated to derive sales
revenues.
However, based on monitoring information provided by Invest NI and the Fund Manager, it is not clear
when each business was anticipated to enter its respective sales period. In the absence of this information,
employee costs have only been used to calculate GVA up to the point where the business started to derive
revenues (as indicated within CFM’s monitoring information). Beyond this point, GVA has been calculated
by summing the calculated levels of EBITDA and employee costs (as noted above).
For those three businesses that did not receive Stage 2 investment, it has been assumed that the Stage 1
investment was utilised to support the businesses payroll costs;
Return on investment ratios have been calculated net of the Nitech investment that was made in each
business.
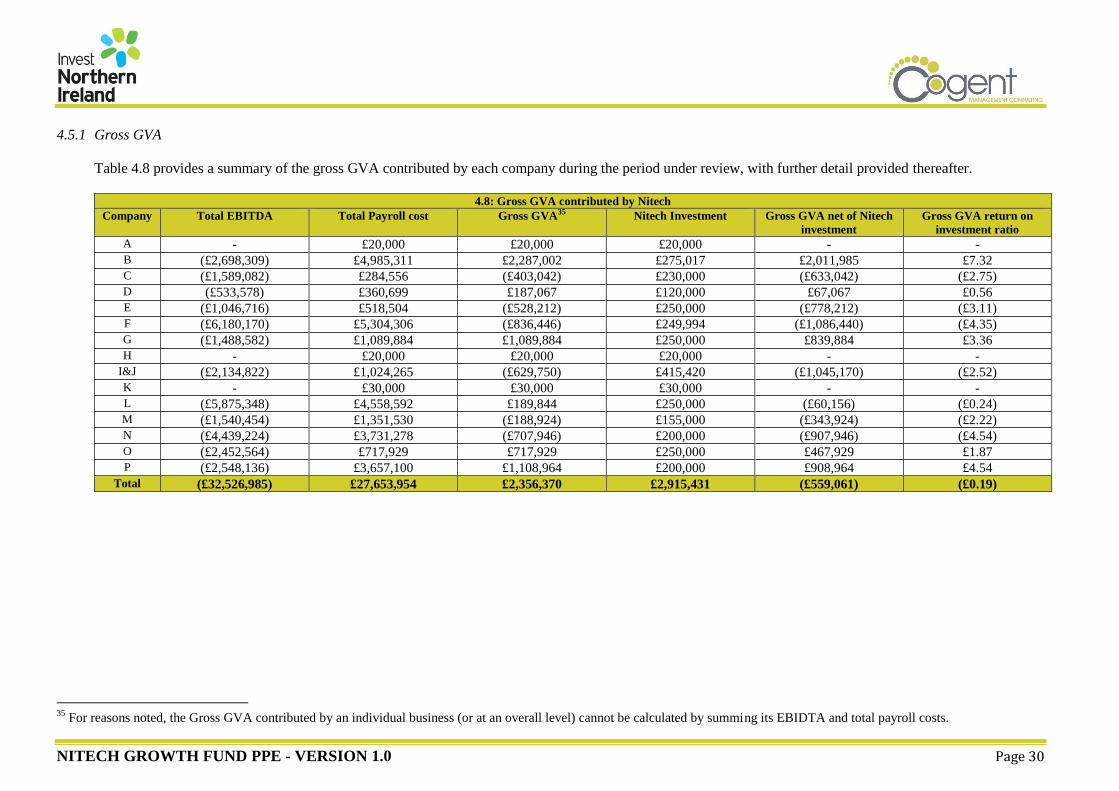
NITECH GROWTH FUND PPE - VERSION 1.0 Page 30
4.5.1 Gross GVA
Table 4.8 provides a summary of the gross GVA contributed by each company during the period under review, with further detail provided thereafter.
4.8: Gross GVA contributed by Nitech
Company Total EBITDA Total Payroll cost Gross GVA35 Nitech Investment Gross GVA net of Nitech
investment
Gross GVA return on
investment ratio
A - £20,000 £20,000 £20,000 - - B (£2,698,309) £4,985,311 £2,287,002 £275,017 £2,011,985 £7.32 C (£1,589,082) £284,556 (£403,042) £230,000 (£633,042) (£2.75) D (£533,578) £360,699 £187,067 £120,000 £67,067 £0.56 E (£1,046,716) £518,504 (£528,212) £250,000 (£778,212) (£3.11) F (£6,180,170) £5,304,306 (£836,446) £249,994 (£1,086,440) (£4.35) G (£1,488,582) £1,089,884 £1,089,884 £250,000 £839,884 £3.36 H - £20,000 £20,000 £20,000 - -
I&J (£2,134,822) £1,024,265 (£629,750) £415,420 (£1,045,170) (£2.52) K - £30,000 £30,000 £30,000 - - L (£5,875,348) £4,558,592 £189,844 £250,000 (£60,156) (£0.24) M (£1,540,454) £1,351,530 (£188,924) £155,000 (£343,924) (£2.22) N (£4,439,224) £3,731,278 (£707,946) £200,000 (£907,946) (£4.54) O (£2,452,564) £717,929 £717,929 £250,000 £467,929 £1.87 P (£2,548,136) £3,657,100 £1,108,964 £200,000 £908,964 £4.54
Total (£32,526,985) £27,653,954 £2,356,370 £2,915,431 (£559,061) (£0.19)
35
For reasons noted, the Gross GVA contributed by an individual business (or at an overall level) cannot be calculated by summing its EBIDTA and total payroll costs.
NITECH GROWTH FUND PPE - VERSION 1.0 Page 31
Salient points to note include:
Total EBITDA for the period under review was c. (£32.5m). The analysis suggests that, when
examined on a cumulative basis, all of the companies derived negative EBITDA during their
respective years of operation during the period under review, with the level of negative EBITDA
ranging from c. £534k to £6.2m. Indeed, none of the 12 companies derived positive EBITDA for
any given year of operation.
However, the Evaluation Team considers that the preceding analysis should be viewed in context.
Empirical evidence36
suggests that there is a tendency for private equity funds focusing on seed
and early stage growth companies to derive negative returns and cash flows in the short to medium
term (which may amount to years), given the infancy of the companies invested in and the
extensive research and development activities that are often undertaken to bring innovative
products or services to market. These funds tend to anticipate and derive positive returns and cash
flow later in the investment fund’s life as the portfolio companies mature and are gradually exited
(also known as the ‘J-curve’ effect).
It is the Fund Manager’s view, that the duration of the negative EBITDA incurred by portfolio
companies is also likely to reflect, and have been influenced by, the depressed macro-economic
climate (particularly from 2008 onwards) which negatively impacted on company scaling and
growth during the period.
Reflecting the high number of jobs years and salaries supported, the total payroll costs for the 12
companies equated to c. £27.7m during the period under review, albeit 67% (or £18.6m) of costs
were attributed to 4 companies.
The analysis suggests that the portfolio companies potentially cost the NI economy £559k37
in
gross GVA (net of the investment made through Nitech). 5 (31%) of the 12 companies (that
received stage 2 investment) contributed positive GVA during the period under review, with the
level of gross GVA contributed by an individual company ranging from £67k to £2m. The level of
negative GVA contributed by the remaining 7 companies ranged from £60k to £1.1m. However,
we understand, through discussion with Fund Manager, that much of the expenditure that has
contributed to the negative GVA impacts was as a result of considerable expenditure on
undertaking further R&D activities, and thus contributing to other strategic goals within an NI
context, such as increasing levels of Business Expenditure R&D (BERD). Furthermore, the Fund
Manager has indicated that there is likely to have been positive knowledge and market spillovers
resulting from the R&D activities that were supported by the Fund during the period under review.
On an overall basis, the analysis indicates that the portfolio companies provided an economic loss
of £0.19 to date in gross GVA (net of the investment made through Nitech) for every pound
invested through the Nitech Fund.
4.5.2 Net additional GVA
The application of the three additionality scenarios (see Table 4.9 overleaf) to the gross levels of GVA
contributed by each company, suggests that the investment made through Nitech may have directly
cost the NI economy between £116k (Scenario 1) and £419k (Scenario 2) in net additional GVA to the
NI economy38
.
Given the level of investment made in each of the portfolio companies suggests that the investment
made through Nitech potentially cost the NI economy between £0.04 and £0.14 in net additional
GVA for every pound invested through the Fund.
36
For example see ‘The private equity J-Curve: cash flow considerations from primary and secondary points of view’,
Christian Diller, Ivan Herger, Marco Wulff, Capital Dynamics 37
The negative GVA should be viewed as a cost to the economy on the basis that the investment (Nitech and other
investment) could have been allocated to support other commercial/economic development activities that would have
possible made a positive contribution to the NI economy during the same period. 38
Please note that the figures are net of the investment made through Nitech.
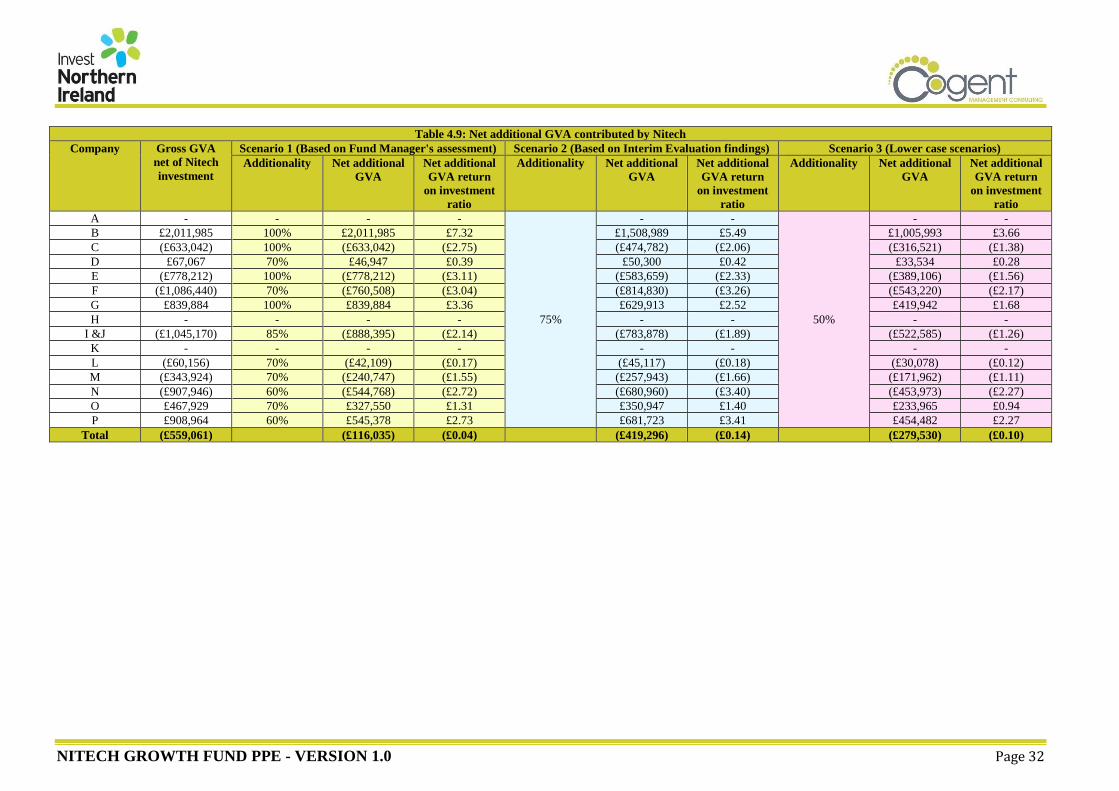
NITECH GROWTH FUND PPE - VERSION 1.0 Page 32
Table 4.9: Net additional GVA contributed by Nitech Company Gross GVA
net of Nitech
investment
Scenario 1 (Based on Fund Manager's assessment) Scenario 2 (Based on Interim Evaluation findings) Scenario 3 (Lower case scenarios)
Additionality Net additional
GVA
Net additional
GVA return
on investment
ratio
Additionality Net additional
GVA
Net additional
GVA return
on investment
ratio
Additionality Net additional
GVA
Net additional
GVA return
on investment
ratio
A - - - -
75%
- -
50%
- - B £2,011,985 100% £2,011,985 £7.32 £1,508,989 £5.49 £1,005,993 £3.66
C (£633,042) 100% (£633,042) (£2.75) (£474,782) (£2.06) (£316,521) (£1.38)
D £67,067 70% £46,947 £0.39 £50,300 £0.42 £33,534 £0.28
E (£778,212) 100% (£778,212) (£3.11) (£583,659) (£2.33) (£389,106) (£1.56)
F (£1,086,440) 70% (£760,508) (£3.04) (£814,830) (£3.26) (£543,220) (£2.17)
G £839,884 100% £839,884 £3.36 £629,913 £2.52 £419,942 £1.68
H - - - - - - - - I &J (£1,045,170) 85% (£888,395) (£2.14) (£783,878) (£1.89) (£522,585) (£1.26)
K - - - - - - - - L (£60,156) 70% (£42,109) (£0.17) (£45,117) (£0.18) (£30,078) (£0.12)
M (£343,924) 70% (£240,747) (£1.55) (£257,943) (£1.66) (£171,962) (£1.11)
N (£907,946) 60% (£544,768) (£2.72) (£680,960) (£3.40) (£453,973) (£2.27)
O £467,929 70% £327,550 £1.31 £350,947 £1.40 £233,965 £0.94
P £908,964 60% £545,378 £2.73 £681,723 £3.41 £454,482 £2.27
Total (£559,061) (£116,035) (£0.04) (£419,296) (£0.14) (£279,530) (£0.10)
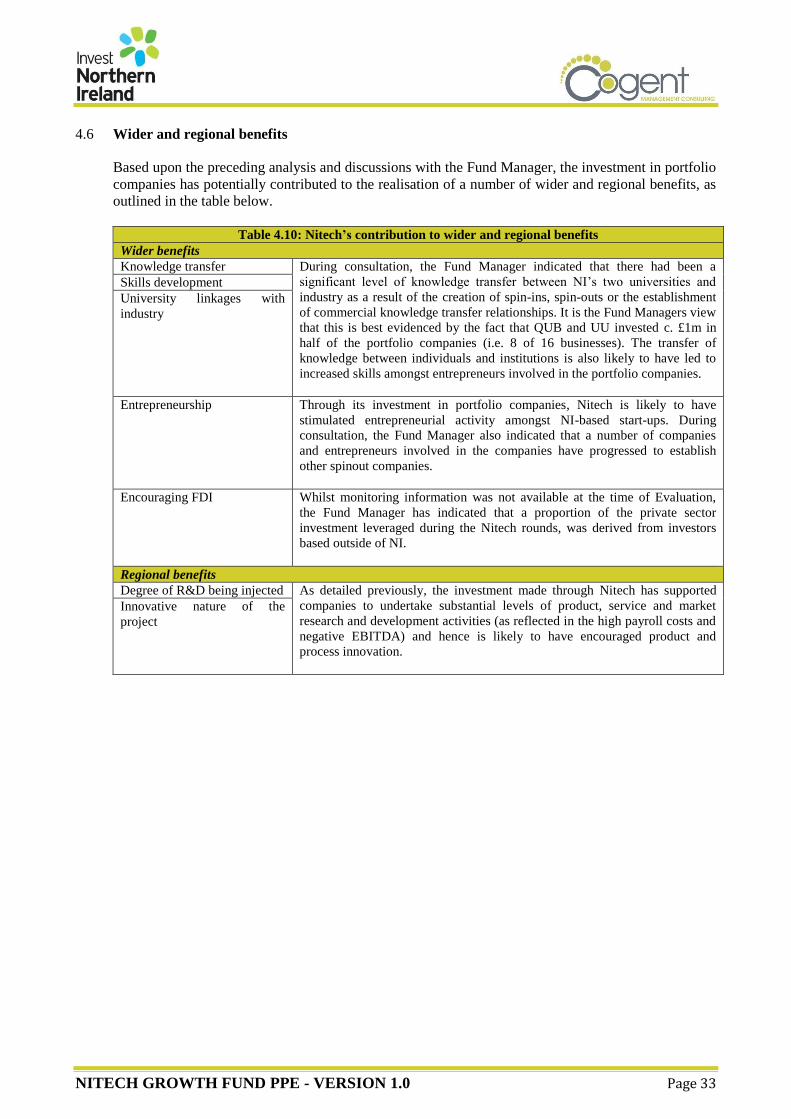
NITECH GROWTH FUND PPE - VERSION 1.0 Page 33
4.6 Wider and regional benefits
Based upon the preceding analysis and discussions with the Fund Manager, the investment in portfolio
companies has potentially contributed to the realisation of a number of wider and regional benefits, as
outlined in the table below.
Table 4.10: Nitech’s contribution to wider and regional benefits
Wider benefits
Knowledge transfer During consultation, the Fund Manager indicated that there had been a
significant level of knowledge transfer between NI’s two universities and
industry as a result of the creation of spin-ins, spin-outs or the establishment
of commercial knowledge transfer relationships. It is the Fund Managers view
that this is best evidenced by the fact that QUB and UU invested c. £1m in
half of the portfolio companies (i.e. 8 of 16 businesses). The transfer of
knowledge between individuals and institutions is also likely to have led to
increased skills amongst entrepreneurs involved in the portfolio companies.
Skills development
University linkages with
industry
Entrepreneurship Through its investment in portfolio companies, Nitech is likely to have
stimulated entrepreneurial activity amongst NI-based start-ups. During
consultation, the Fund Manager also indicated that a number of companies
and entrepreneurs involved in the companies have progressed to establish
other spinout companies.
Encouraging FDI Whilst monitoring information was not available at the time of Evaluation,
the Fund Manager has indicated that a proportion of the private sector
investment leveraged during the Nitech rounds, was derived from investors
based outside of NI.
Regional benefits
Degree of R&D being injected As detailed previously, the investment made through Nitech has supported
companies to undertake substantial levels of product, service and market
research and development activities (as reflected in the high payroll costs and
negative EBITDA) and hence is likely to have encouraged product and
process innovation.
Innovative nature of the
project
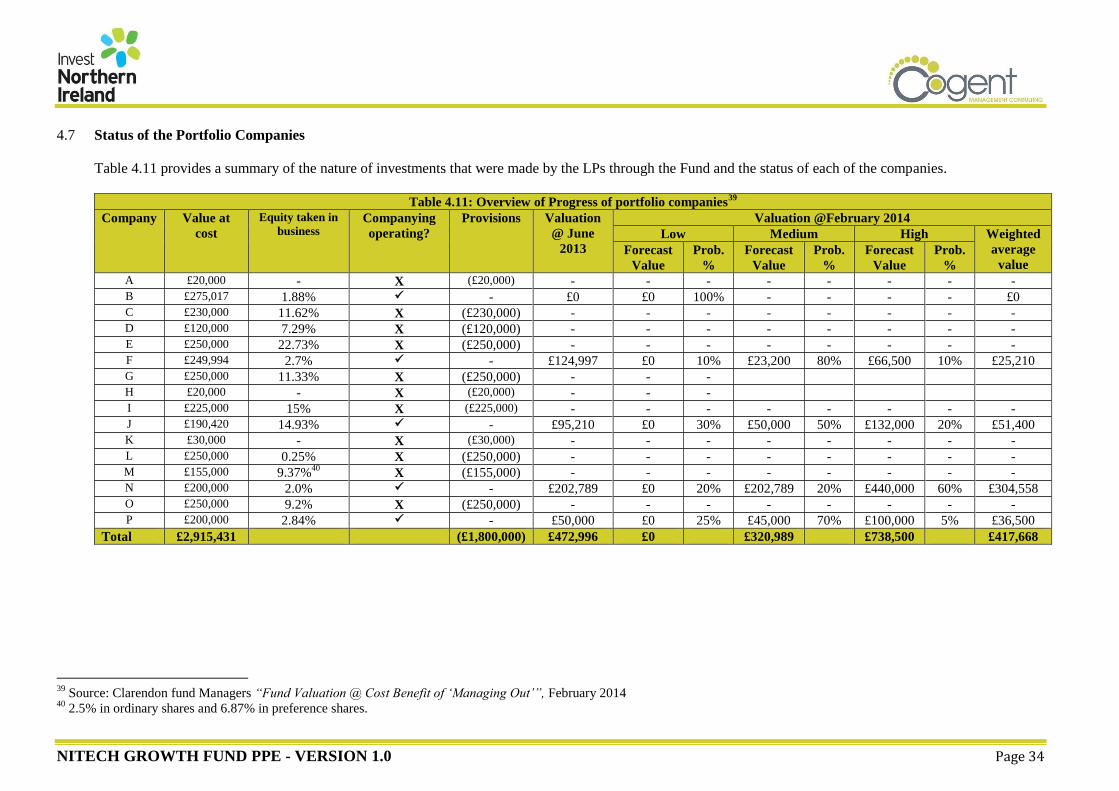
NITECH GROWTH FUND PPE - VERSION 1.0 Page 34
4.7 Status of the Portfolio Companies
Table 4.11 provides a summary of the nature of investments that were made by the LPs through the Fund and the status of each of the companies.
Table 4.11: Overview of Progress of portfolio companies
39
Company Value at
cost
Equity taken in
business Companying
operating?
Provisions Valuation
@ June
2013
Valuation @February 2014
Low Medium High Weighted
average
value Forecast
Value
Prob.
%
Forecast
Value
Prob.
%
Forecast
Value
Prob.
% A £20,000 - X (£20,000) - - - - - - - - B £275,017 1.88% - £0 £0 100% - - - - £0 C £230,000 11.62% X (£230,000) - - - - - - - - D £120,000 7.29% X (£120,000) - - - - - - - - E £250,000 22.73% X (£250,000) - - - - - - - - F £249,994 2.7% - £124,997 £0 10% £23,200 80% £66,500 10% £25,210 G £250,000 11.33% X (£250,000) - - - H £20,000 - X (£20,000) - - - I £225,000 15% X (£225,000) - - - - - - - - J £190,420 14.93% - £95,210 £0 30% £50,000 50% £132,000 20% £51,400 K £30,000 - X (£30,000) - - - - - - - - L £250,000 0.25% X (£250,000) - - - - - - - - M £155,000 9.37%
40 X (£155,000) - - - - - - - -
N £200,000 2.0% - £202,789 £0 20% £202,789 20% £440,000 60% £304,558 O £250,000 9.2% X (£250,000) - - - - - - - - P £200,000 2.84% - £50,000 £0 25% £45,000 70% £100,000 5% £36,500
Total £2,915,431 (£1,800,000) £472,996 £0 £320,989 £738,500 £417,668
39
Source: Clarendon fund Managers “Fund Valuation @ Cost Benefit of ‘Managing Out’”, February 2014 40
2.5% in ordinary shares and 6.87% in preference shares.
NITECH GROWTH FUND PPE - VERSION 1.0 Page 35
Salient points to note include:
Of the 16 businesses that received investment through the Fund, 11 businesses no longer exist
(one of which (Company I) was acquired by another portfolio company (Company J)) and 5
businesses are continuing to operate. As of September 2015, there have been no successful exits.
Total provisions made by the Fund for businesses that received investment but no longer exist
equate to c. £1.8m.
In February 2014, the Fund Manager provided a range of updated estimates of the value of the
Fund’s investments for companies that continue to exist (N=5). Based on the weighted average of
three potential scenarios (low/medium/high), the Fund Manager has indicated that the potential
value of these investments is c. £418k, which is significantly below (63% or c. 696k) their value at
cost (of c. £1.1m).
Only 1 of the 5 existing investments have been valued by the Fund Manager in excess of its value
at cost (Company N) and the Fund Manager has confirmed that the Fund is likely to see a return
during 2016. The reduced value of the remaining 4 companies is reflective of:
The investments held by the fund have been significantly diluted due the lack of participation
of Nitech in subsequent funding rounds (due to the lack of availability of follow on funding);
and/or
The shares held by other investors that made investment in subsequent funding rounds include
liquidation preferences, allowing these later investors to realise repayment of their investment
on exit, ahead of investors (such as Nitech) from previous rounds; and/or
The companies have not progressed in the manner anticipated at the outset due to internal
and/or external factors (e.g. market driven factors).
Discussions with Invest NI suggest that whilst the levels of anticipated success from a seed and
early stage VC fund will typically vary depending on a range of factors including the wider macro-
economic environment and the other support mechanisms available within the wider ecosystem, it
would typically anticipate that one-third of companies would fail, one-third would continue to
operate but underperform and one-third would excel. Whilst the progression of the 16 portfolio
companies to date, has performed below this trend, it is the Fund Manager’s view, and shared by
the Evaluation Team, that the performance should be viewed in the context of:
The Fund was, in retrospect too small to support follow on funding, to support the growth and
scaling of the businesses and mitigate against any dilution of the Fund’ shares value;
The limited number of other equity funds and low levels of investor readiness support that
existed during the early years of Nitech – as noted Nitech was a pilot Fund;
The depressed macro-economic climate (particularly from 2008 onwards) is likely to have
impacted on company scaling and growth, resulting in companies with insufficient sales or
profitable growth to become attractive acquisition targets; and
There was a general lack of acquisition activity across NI (and the UK) during the period
under review (largely due to the economic climate which drove higher levels of risk aversion
and negatively impacted on the availability of finance).
4.8 Duplication and complementarity
Figure 4.1 and Table 4.12 provides an overview of other public and private sector initiatives that
sought to provide seed and early stage growth finance to SMEs during the period under review (2003-
2013). Commentary on the ‘fit’ of the Nitech is provided in the succeeding paragraphs.
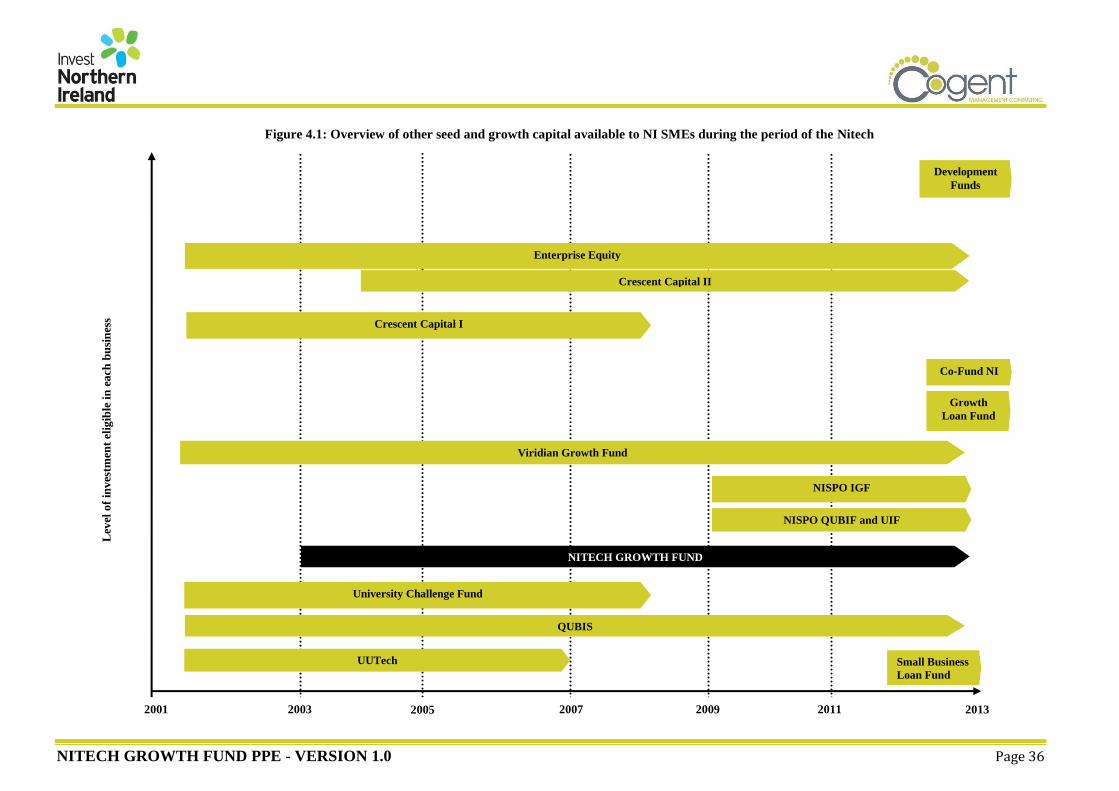
NITECH GROWTH FUND PPE - VERSION 1.0 Page 36
Figure 4.1: Overview of other seed and growth capital available to NI SMEs during the period of the Nitech
Viridian Growth Fund
NITECH GROWTH FUND
Crescent Capital I
Enterprise Equity
Crescent Capital II
University Challenge Fund
QUBIS
UUTech Small Business
Loan Fund
NISPO IGF
NISPO QUBIF and UIF
Co-Fund NI
Development
Funds
Growth
Loan Fund
2001 2013 2007 2003 2005 2009 2011
Lev
el o
f in
ves
tmen
t el
igib
le i
n e
ach
bu
sin
ess
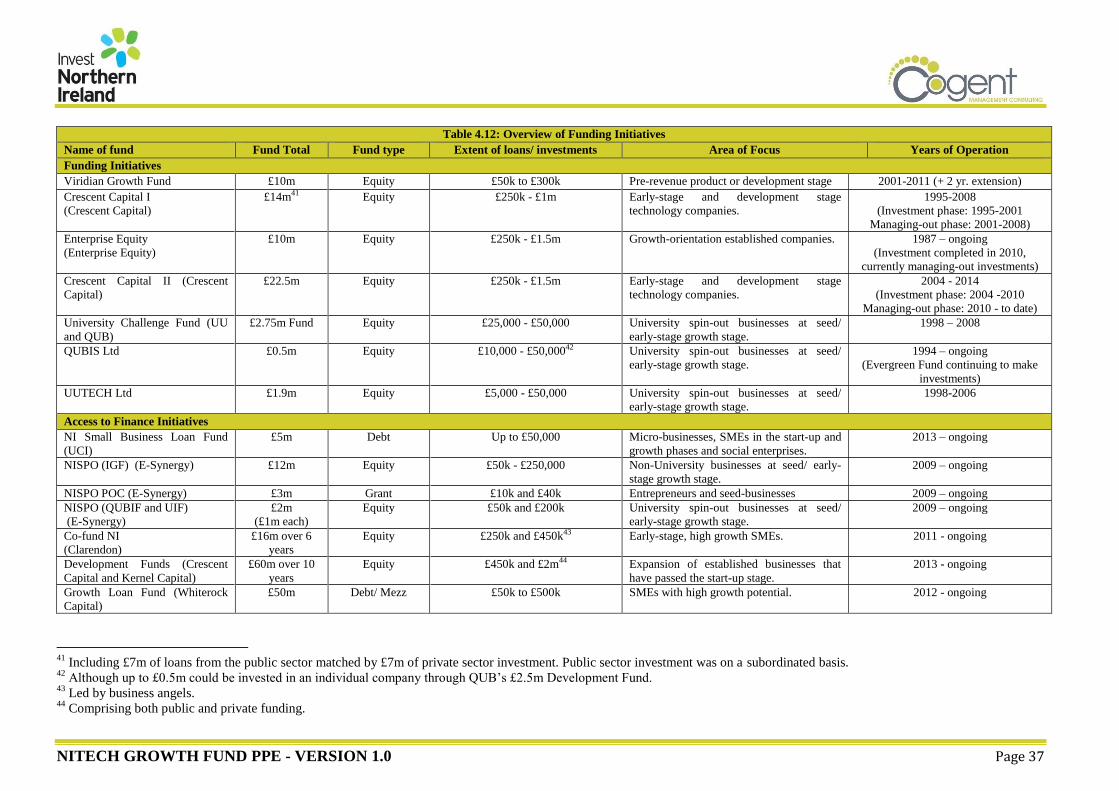
NITECH GROWTH FUND PPE - VERSION 1.0 Page 37
Table 4.12: Overview of Funding Initiatives
Name of fund Fund Total Fund type Extent of loans/ investments Area of Focus Years of Operation
Funding Initiatives
Viridian Growth Fund £10m Equity £50k to £300k Pre-revenue product or development stage 2001-2011 (+ 2 yr. extension)
Crescent Capital I
(Crescent Capital)
£14m41 Equity £250k - £1m Early-stage and development stage
technology companies.
1995-2008
(Investment phase: 1995-2001
Managing-out phase: 2001-2008)
Enterprise Equity
(Enterprise Equity)
£10m Equity £250k - £1.5m Growth-orientation established companies. 1987 – ongoing
(Investment completed in 2010,
currently managing-out investments)
Crescent Capital II (Crescent
Capital)
£22.5m Equity £250k - £1.5m Early-stage and development stage
technology companies.
2004 - 2014
(Investment phase: 2004 -2010
Managing-out phase: 2010 - to date)
University Challenge Fund (UU
and QUB)
£2.75m Fund Equity £25,000 - £50,000 University spin-out businesses at seed/
early-stage growth stage.
1998 – 2008
QUBIS Ltd £0.5m Equity £10,000 - £50,00042 University spin-out businesses at seed/
early-stage growth stage.
1994 – ongoing
(Evergreen Fund continuing to make
investments)
UUTECH Ltd
£1.9m Equity £5,000 - £50,000 University spin-out businesses at seed/
early-stage growth stage.
1998-2006
Access to Finance Initiatives
NI Small Business Loan Fund
(UCI)
£5m Debt Up to £50,000 Micro-businesses, SMEs in the start-up and
growth phases and social enterprises.
2013 – ongoing
NISPO (IGF) (E-Synergy) £12m Equity £50k - £250,000 Non-University businesses at seed/ early-
stage growth stage.
2009 – ongoing
NISPO POC (E-Synergy) £3m Grant £10k and £40k Entrepreneurs and seed-businesses 2009 – ongoing
NISPO (QUBIF and UIF)
(E-Synergy)
£2m
(£1m each)
Equity £50k and £200k University spin-out businesses at seed/
early-stage growth stage.
2009 – ongoing
Co-fund NI
(Clarendon)
£16m over 6
years
Equity £250k and £450k43 Early-stage, high growth SMEs. 2011 - ongoing
Development Funds (Crescent
Capital and Kernel Capital)
£60m over 10
years
Equity £450k and £2m44 Expansion of established businesses that
have passed the start-up stage.
2013 - ongoing
Growth Loan Fund (Whiterock
Capital)
£50m Debt/ Mezz £50k to £500k SMEs with high growth potential. 2012 - ongoing
41
Including £7m of loans from the public sector matched by £7m of private sector investment. Public sector investment was on a subordinated basis. 42
Although up to £0.5m could be invested in an individual company through QUB’s £2.5m Development Fund. 43
Led by business angels. 44
Comprising both public and private funding.
NITECH GROWTH FUND PPE - VERSION 1.0 Page 38
In addition to the support provided through Invest NI’s Access to Finance initiatives, a number of
other financial and non-financial initiatives were available during the period under review that sought
to support start-up and early growth businesses (including funds to support R&D activity and
technology and knowledge transfer from NI’s universities). These initiatives included:
Proof of Concept Programme (University, Invest NI)
START Programme (Invest NI)
Small Firms Merit Award for Research and
Development (SMART) Programme (Invest NI)
COMPETE Programme (Invest NI)
Halo NI (NISP)
£25k awards (NISP CONNECT)
VC Forum (NISP CONNECT)
Seedcorn Competition (InterTradeIreland)
NISPO Investment Readiness/Awareness Programme
(IRP) (E-Synergy funded by Invest NI)
Propel Programme (Invest NI)
Springboard (NISP CONNECT)
Enterprise Forum (NISP CONNECT)
Frameworks Workshops (NISP CONNECT)
An overview of each of these initiatives is provided in Appendix IV.
Salient points to note in relation to the range of initiatives that were available to provide seed and early
stage support (financial and non-financial) to SMEs during the period under review includes:
Whilst there was a small number of other VC funds in operation during the early years of the
Nitech (i.e. VGF, Crescent Capital I and II and Enterprise Equity), these funds focused on
different investment ranges than Nitech and the businesses that were supported were typically at a
later stage of development (i.e. after the pre-revenue stage). As such, the Fund played a
complementary role to these Funds during the period under review;
In terms of the other R&D Funds that were available during the investment phase of Nitech, Invest
NI created a Memorandum of Understanding (MoU) which concluded that: Invest NI and Angle
Technology Ltd were in agreement that:
“Angle Technology Ltd and Invest NI agree that the NITECH Fund and the existing Invest NI R&D programmes are
not mutually exclusive. On the contrary, they are intended to operate on a complementary basis alongside each
other. Flexibility is vital; the proportionate contribution from the Fund or any of the individual R&D support
programs may vary from a single source (i.e. either the Fund or an individual Invest NI R&D programme) or a
combination of the Fund and an individual and appropriate programme. Both parties recognise the need for close
liaison and co-operation, on a case by case basis, in deciding the most appropriate allocation of support.”
In-line with the conclusions of the MOU, discussions with Invest NI indicates that demand for
R&D initiatives such as START, SMART and COMPETE remained strong throughout their
respective delivery periods and there was no evidence to suggest the Nitech displaced these
initiatives (or vice versa). Indeed, supported by evidence within the Interim Evaluation of Nitech
which indicated that a number of portfolio companies had received support through both Nitech
and these other Funds, it appears that the initiatives complemented one another.
However, the availability of University PoCp support from 2003 (in the form of a non-repayable
grant) was deemed to be more attractive than the Stage 1 support available through Nitech (which
required the investment to be repaid or converted to equity shares) which resulted in demand for
Stage 1 support through Nitech being lower than anticipated. Whilst it is unclear as to whether the
projects in receipt of PoCp support would have performed relatively better if they had been
supported through Stage 1 of Nitech, we do note that the lower than anticipated levels of demand
for Stage 1 support resulted in an increased quantum of support to be invested in supporting Stage
2 activity; and
More recently, the Evaluation Team notes that whilst the introduction of the NISPO IGF (in 2009
through Invest NI’s Access to Finance Initiative) offered similar levels of funding (between £50k
and £250k), Nitech was not making investment in its portfolio companies at that stage (on the
basis that the Fund was fully invested). As such, there was (is) no opportunity for Nitech to have
duplicated or displaced support that has been available through Invest NI’s current portfolio of
Access to Finance initiatives. Indeed these initiatives (and the other identified business supports)
offered the potential to provide follow-on support the businesses in receipt of Nitech investment.
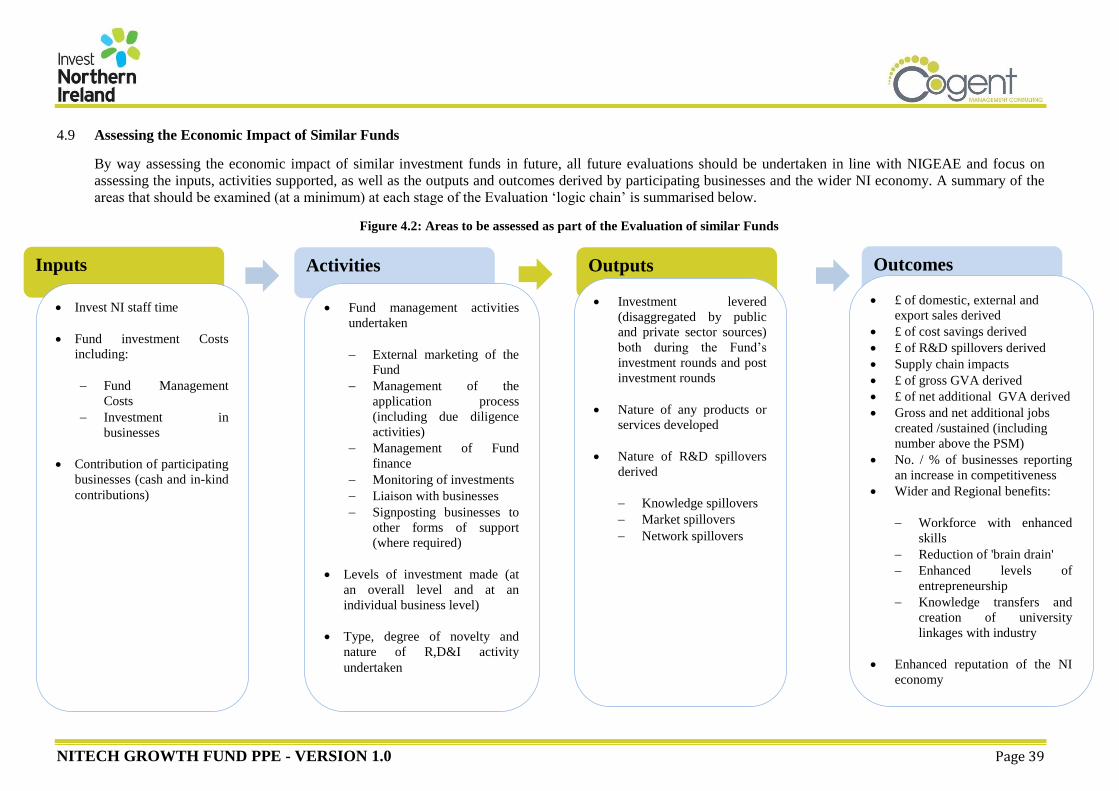
NITECH GROWTH FUND PPE - VERSION 1.0 Page 39
Activities
Outputs
Outcomes
Inputs
4.9 Assessing the Economic Impact of Similar Funds
By way assessing the economic impact of similar investment funds in future, all future evaluations should be undertaken in line with NIGEAE and focus on
assessing the inputs, activities supported, as well as the outputs and outcomes derived by participating businesses and the wider NI economy. A summary of the
areas that should be examined (at a minimum) at each stage of the Evaluation ‘logic chain’ is summarised below.
Figure 4.2: Areas to be assessed as part of the Evaluation of similar Funds
Fund management activities
undertaken
External marketing of the
Fund
Management of the
application process
(including due diligence
activities)
Management of Fund
finance
Monitoring of investments
Liaison with businesses
Signposting businesses to
other forms of support
(where required)
Levels of investment made (at
an overall level and at an
individual business level)
Type, degree of novelty and
nature of R,D&I activity
undertaken
Investment levered
(disaggregated by public
and private sector sources)
both during the Fund’s
investment rounds and post
investment rounds
Nature of any products or
services developed
Nature of R&D spillovers
derived
Knowledge spillovers
Market spillovers
Network spillovers
£ of domestic, external and
export sales derived
£ of cost savings derived
£ of R&D spillovers derived
Supply chain impacts
£ of gross GVA derived
£ of net additional GVA derived
Gross and net additional jobs
created /sustained (including
number above the PSM)
No. / % of businesses reporting
an increase in competitiveness
Wider and Regional benefits:
Workforce with enhanced
skills
Reduction of 'brain drain'
Enhanced levels of
entrepreneurship
Knowledge transfers and
creation of university
linkages with industry
Enhanced reputation of the NI
economy
Invest NI staff time
Fund investment Costs
including:
Fund Management
Costs
Investment in
businesses
Contribution of participating
businesses (cash and in-kind
contributions)
NITECH GROWTH FUND PPE - VERSION 1.0 Page 40
4.10 Summary Conclusions
Based on the analysis of available monitoring information and consultation with the Fund Manager,
the following key conclusions can be drawn with regards to the monetary and non-monetary economic
impact of Nitech during the period under review:
During the Nitech funding rounds an additional £13.3m was invested in the 16 companies, 75%
(or c. £9.94m) of which came from private sector sources and the remaining 25% (or c. £3.36m)
was derived from public sector sources. The analysis suggests that, the Fund may have directly
supported the 16 companies to leverage between £6.7m to £10.6m in net additional investment, of
which between £5m and £7.9m came from private sector sources.
In the absence of undertaking primary research with businesses that received investment, the
Evaluation Team cannot definitely conclude on the levels of additionality and displacement.
However, discussions with Invest NI and the Fund manager suggest that Nitech played a pivotal
role in supporting the businesses to lever investment (and hence additionality levels were high and
the risk of displacement was low.
The analysis indicates that Nitech may have directly contributed to creating and/or maintaining
between 483 and 720 FTE job years. A total of 75 NI-based FTEs continue to be employed in 5 of
the 16 portfolio companies that continue to operate. The application of the calculated levels of
additionality, suggests that, depending on which additionality scenario is selected, Nitech has
directly contributed to creating and potential safeguarding of between 38 and 56 of the jobs that
continued to exist in 2014. The analysis indicates that Nitech is likely to have created, maintained
and safeguarded a significant proportion of jobs with salaries in excess of the NI private sector
median;
The analysis suggests that the portfolio companies potentially cost the NI economy £559k in gross
GVA (net of the investment made through Nitech). However, much of the expenditure that has
contributed to the negative GVA impacts was as a result of considerable expenditure on
undertaking further R&D activities, and thus contributing to other strategic goals within an NI
context, such as increasing levels of Business Expenditure R&D (BERD).
The investment made through Nitech may have directly cost the NI economy between £116k
(Scenario 1) and £419k (Scenario 2) in net additional GVA to the NI economy. Given the level of
investment made in each of the portfolio companies suggests that the investment made through
Nitech potentially cost the NI economy between £0.04 and £0.14 in net additional GVA for every
pound invested through the Fund.
In addition to the aforementioned benefits, the analysis suggests that the investment made through
Nitech has contributed to delivering a number of wider (e.g. knowledge transfer, skills
development, entrepreneurship etc.) and regional benefits (degree of R&D being injected and
innovative nature of the project) to the NI economy.
Of the 16 businesses that received investment through the Fund, 11 businesses no longer exist and
5 businesses are continuing to operate. As of September 2015, there have been no successful exits.
The Fund Manager’s updated estimates of the value of the Fund’s investments for companies that
continue to exist indicate that the potential value of these investments is c. £418k, which is
significantly below their value at cost.
Only 1 of the 5 existing investments have been valued by the Fund Manager in excess of its value
at cost and the Fund Manager has confirmed that the Fund is likely to see a return during 2016.
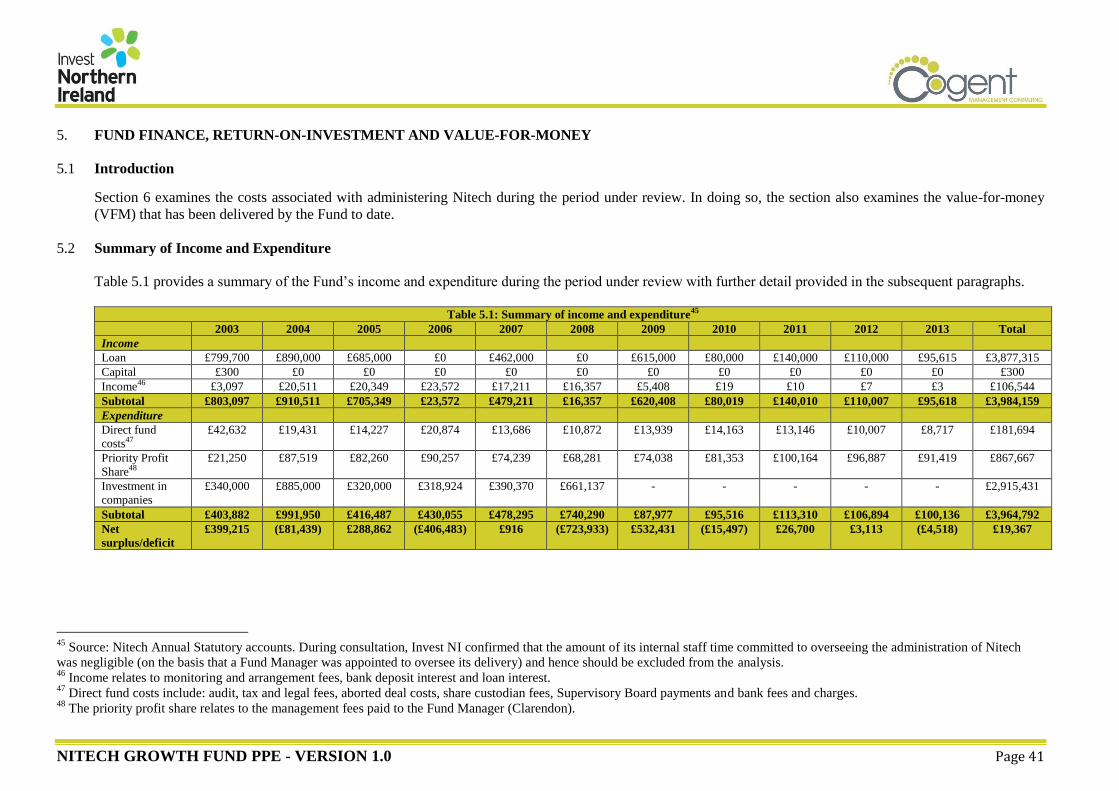
NITECH GROWTH FUND PPE - VERSION 1.0 Page 41
5. FUND FINANCE, RETURN-ON-INVESTMENT AND VALUE-FOR-MONEY
5.1 Introduction
Section 6 examines the costs associated with administering Nitech during the period under review. In doing so, the section also examines the value-for-money
(VFM) that has been delivered by the Fund to date.
5.2 Summary of Income and Expenditure
Table 5.1 provides a summary of the Fund’s income and expenditure during the period under review with further detail provided in the subsequent paragraphs.
Table 5.1: Summary of income and expenditure45
2003 2004 2005 2006 2007 2008 2009 2010 2011 2012 2013 Total
Income
Loan £799,700 £890,000 £685,000 £0 £462,000 £0 £615,000 £80,000 £140,000 £110,000 £95,615 £3,877,315
Capital £300 £0 £0 £0 £0 £0 £0 £0 £0 £0 £0 £300
Income46 £3,097 £20,511 £20,349 £23,572 £17,211 £16,357 £5,408 £19 £10 £7 £3 £106,544
Subtotal £803,097 £910,511 £705,349 £23,572 £479,211 £16,357 £620,408 £80,019 £140,010 £110,007 £95,618 £3,984,159
Expenditure
Direct fund
costs47
£42,632 £19,431 £14,227 £20,874 £13,686 £10,872 £13,939 £14,163 £13,146 £10,007 £8,717 £181,694
Priority Profit
Share48
£21,250 £87,519 £82,260 £90,257 £74,239 £68,281 £74,038 £81,353 £100,164 £96,887 £91,419 £867,667
Investment in
companies
£340,000 £885,000 £320,000 £318,924 £390,370 £661,137 - - - - - £2,915,431
Subtotal £403,882 £991,950 £416,487 £430,055 £478,295 £740,290 £87,977 £95,516 £113,310 £106,894 £100,136 £3,964,792
Net
surplus/deficit
£399,215 (£81,439) £288,862 (£406,483) £916 (£723,933) £532,431 (£15,497) £26,700 £3,113 (£4,518) £19,367
45
Source: Nitech Annual Statutory accounts. During consultation, Invest NI confirmed that the amount of its internal staff time committed to overseeing the administration of Nitech
was negligible (on the basis that a Fund Manager was appointed to oversee its delivery) and hence should be excluded from the analysis. 46
Income relates to monitoring and arrangement fees, bank deposit interest and loan interest. 47
Direct fund costs include: audit, tax and legal fees, aborted deal costs, share custodian fees, Supervisory Board payments and bank fees and charges. 48
The priority profit share relates to the management fees paid to the Fund Manager (Clarendon).
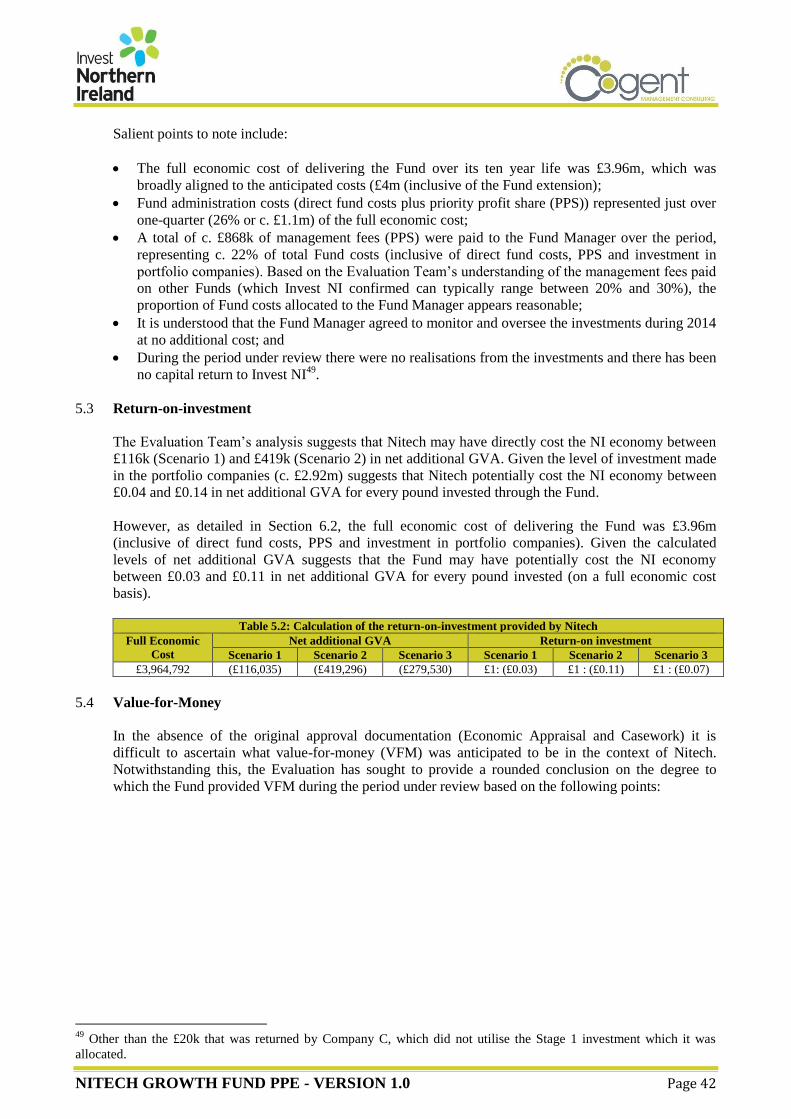
NITECH GROWTH FUND PPE - VERSION 1.0 Page 42
Salient points to note include:
The full economic cost of delivering the Fund over its ten year life was £3.96m, which was
broadly aligned to the anticipated costs (£4m (inclusive of the Fund extension);
Fund administration costs (direct fund costs plus priority profit share (PPS)) represented just over
one-quarter (26% or c. £1.1m) of the full economic cost;
A total of c. £868k of management fees (PPS) were paid to the Fund Manager over the period,
representing c. 22% of total Fund costs (inclusive of direct fund costs, PPS and investment in
portfolio companies). Based on the Evaluation Team’s understanding of the management fees paid
on other Funds (which Invest NI confirmed can typically range between 20% and 30%), the
proportion of Fund costs allocated to the Fund Manager appears reasonable;
It is understood that the Fund Manager agreed to monitor and oversee the investments during 2014
at no additional cost; and
During the period under review there were no realisations from the investments and there has been
no capital return to Invest NI49
.
5.3 Return-on-investment
The Evaluation Team’s analysis suggests that Nitech may have directly cost the NI economy between
£116k (Scenario 1) and £419k (Scenario 2) in net additional GVA. Given the level of investment made
in the portfolio companies (c. £2.92m) suggests that Nitech potentially cost the NI economy between
£0.04 and £0.14 in net additional GVA for every pound invested through the Fund.
However, as detailed in Section 6.2, the full economic cost of delivering the Fund was £3.96m
(inclusive of direct fund costs, PPS and investment in portfolio companies). Given the calculated
levels of net additional GVA suggests that the Fund may have potentially cost the NI economy
between £0.03 and £0.11 in net additional GVA for every pound invested (on a full economic cost
basis).
Table 5.2: Calculation of the return-on-investment provided by Nitech
Full Economic
Cost
Net additional GVA Return-on investment
Scenario 1 Scenario 2 Scenario 3 Scenario 1 Scenario 2 Scenario 3
£3,964,792 (£116,035) (£419,296) (£279,530) £1: (£0.03) £1 : (£0.11) £1 : (£0.07)
5.4 Value-for-Money
In the absence of the original approval documentation (Economic Appraisal and Casework) it is
difficult to ascertain what value-for-money (VFM) was anticipated to be in the context of Nitech.
Notwithstanding this, the Evaluation has sought to provide a rounded conclusion on the degree to
which the Fund provided VFM during the period under review based on the following points:
49
Other than the £20k that was returned by Company C, which did not utilise the Stage 1 investment which it was
allocated.
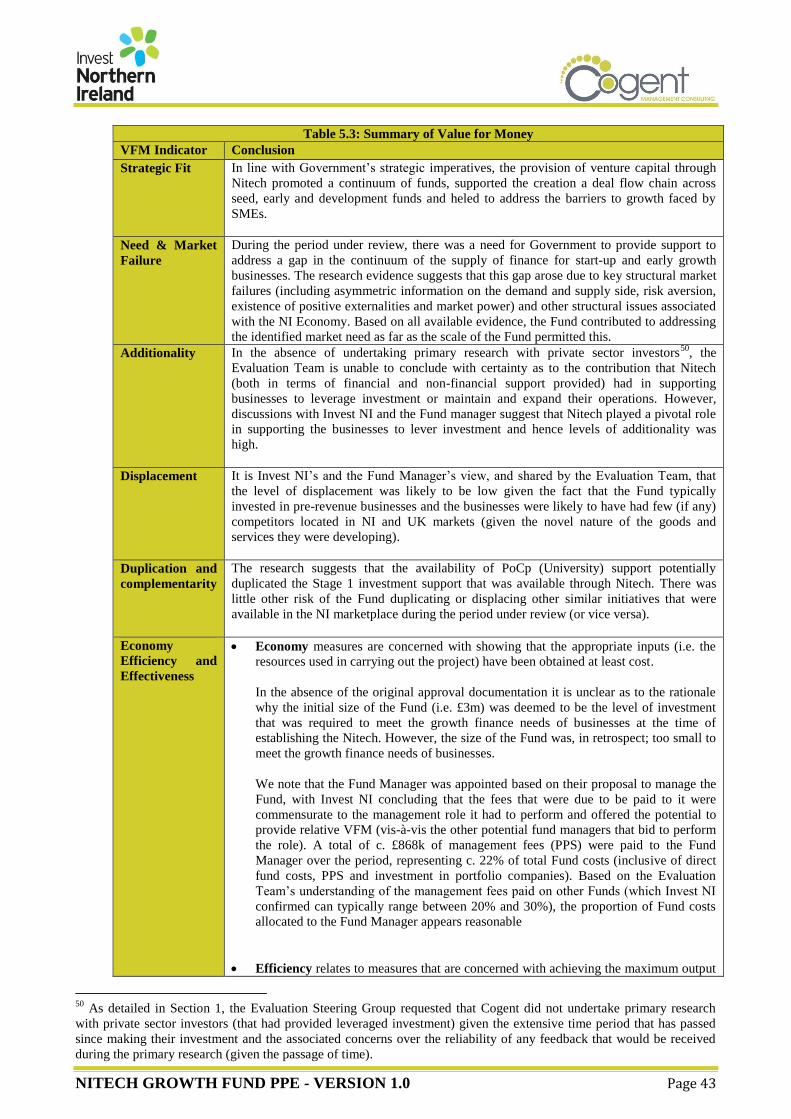
NITECH GROWTH FUND PPE - VERSION 1.0 Page 43
Table 5.3: Summary of Value for Money
VFM Indicator Conclusion
Strategic Fit In line with Government’s strategic imperatives, the provision of venture capital through
Nitech promoted a continuum of funds, supported the creation a deal flow chain across
seed, early and development funds and heled to address the barriers to growth faced by
SMEs.
Need & Market
Failure
During the period under review, there was a need for Government to provide support to
address a gap in the continuum of the supply of finance for start-up and early growth
businesses. The research evidence suggests that this gap arose due to key structural market
failures (including asymmetric information on the demand and supply side, risk aversion,
existence of positive externalities and market power) and other structural issues associated
with the NI Economy. Based on all available evidence, the Fund contributed to addressing
the identified market need as far as the scale of the Fund permitted this.
Additionality In the absence of undertaking primary research with private sector investors50
, the
Evaluation Team is unable to conclude with certainty as to the contribution that Nitech
(both in terms of financial and non-financial support provided) had in supporting
businesses to leverage investment or maintain and expand their operations. However,
discussions with Invest NI and the Fund manager suggest that Nitech played a pivotal role
in supporting the businesses to lever investment and hence levels of additionality was
high.
Displacement It is Invest NI’s and the Fund Manager’s view, and shared by the Evaluation Team, that
the level of displacement was likely to be low given the fact that the Fund typically
invested in pre-revenue businesses and the businesses were likely to have had few (if any)
competitors located in NI and UK markets (given the novel nature of the goods and
services they were developing).
Duplication and
complementarity
The research suggests that the availability of PoCp (University) support potentially
duplicated the Stage 1 investment support that was available through Nitech. There was
little other risk of the Fund duplicating or displacing other similar initiatives that were
available in the NI marketplace during the period under review (or vice versa).
Economy
Efficiency and
Effectiveness
Economy measures are concerned with showing that the appropriate inputs (i.e. the
resources used in carrying out the project) have been obtained at least cost.
In the absence of the original approval documentation it is unclear as to the rationale
why the initial size of the Fund (i.e. £3m) was deemed to be the level of investment
that was required to meet the growth finance needs of businesses at the time of
establishing the Nitech. However, the size of the Fund was, in retrospect; too small to
meet the growth finance needs of businesses.
We note that the Fund Manager was appointed based on their proposal to manage the
Fund, with Invest NI concluding that the fees that were due to be paid to it were
commensurate to the management role it had to perform and offered the potential to
provide relative VFM (vis-à-vis the other potential fund managers that bid to perform
the role). A total of c. £868k of management fees (PPS) were paid to the Fund
Manager over the period, representing c. 22% of total Fund costs (inclusive of direct
fund costs, PPS and investment in portfolio companies). Based on the Evaluation
Team’s understanding of the management fees paid on other Funds (which Invest NI
confirmed can typically range between 20% and 30%), the proportion of Fund costs
allocated to the Fund Manager appears reasonable
Efficiency relates to measures that are concerned with achieving the maximum output
50
As detailed in Section 1, the Evaluation Steering Group requested that Cogent did not undertake primary research
with private sector investors (that had provided leveraged investment) given the extensive time period that has passed
since making their investment and the associated concerns over the reliability of any feedback that would be received
during the primary research (given the passage of time).
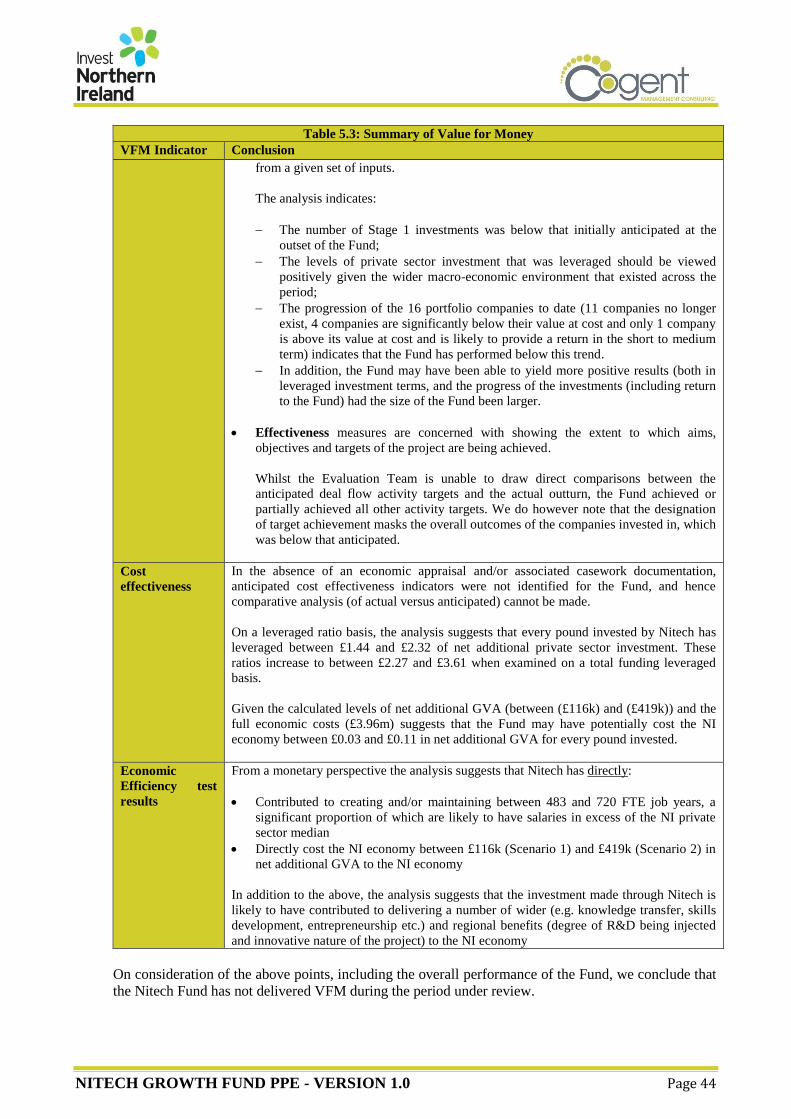
NITECH GROWTH FUND PPE - VERSION 1.0 Page 44
Table 5.3: Summary of Value for Money
VFM Indicator Conclusion
from a given set of inputs.
The analysis indicates:
The number of Stage 1 investments was below that initially anticipated at the
outset of the Fund;
The levels of private sector investment that was leveraged should be viewed
positively given the wider macro-economic environment that existed across the
period;
The progression of the 16 portfolio companies to date (11 companies no longer
exist, 4 companies are significantly below their value at cost and only 1 company
is above its value at cost and is likely to provide a return in the short to medium
term) indicates that the Fund has performed below this trend.
In addition, the Fund may have been able to yield more positive results (both in
leveraged investment terms, and the progress of the investments (including return
to the Fund) had the size of the Fund been larger.
Effectiveness measures are concerned with showing the extent to which aims,
objectives and targets of the project are being achieved.
Whilst the Evaluation Team is unable to draw direct comparisons between the
anticipated deal flow activity targets and the actual outturn, the Fund achieved or
partially achieved all other activity targets. We do however note that the designation
of target achievement masks the overall outcomes of the companies invested in, which
was below that anticipated.
Cost
effectiveness
In the absence of an economic appraisal and/or associated casework documentation,
anticipated cost effectiveness indicators were not identified for the Fund, and hence
comparative analysis (of actual versus anticipated) cannot be made.
On a leveraged ratio basis, the analysis suggests that every pound invested by Nitech has
leveraged between £1.44 and £2.32 of net additional private sector investment. These
ratios increase to between £2.27 and £3.61 when examined on a total funding leveraged
basis.
Given the calculated levels of net additional GVA (between (£116k) and (£419k)) and the
full economic costs (£3.96m) suggests that the Fund may have potentially cost the NI
economy between £0.03 and £0.11 in net additional GVA for every pound invested.
Economic
Efficiency test
results
From a monetary perspective the analysis suggests that Nitech has directly:
Contributed to creating and/or maintaining between 483 and 720 FTE job years, a
significant proportion of which are likely to have salaries in excess of the NI private
sector median
Directly cost the NI economy between £116k (Scenario 1) and £419k (Scenario 2) in
net additional GVA to the NI economy
In addition to the above, the analysis suggests that the investment made through Nitech is
likely to have contributed to delivering a number of wider (e.g. knowledge transfer, skills
development, entrepreneurship etc.) and regional benefits (degree of R&D being injected
and innovative nature of the project) to the NI economy
On consideration of the above points, including the overall performance of the Fund, we conclude that
the Nitech Fund has not delivered VFM during the period under review.
NITECH GROWTH FUND PPE - VERSION 1.0 Page 45
We do however note that the Fund was a pilot Fund that was created during a period when the
importance of the role of seed and early stage finance (including VC finance) was potentially less well
known amongst economic development agencies in NI and further afield, hence there was a lack of
public sector initiatives available to support local SMEs. Allied to this, at that time of the Fund’s
creation, there was a more limited understanding of the levels of follow-on investment that would be
required to support the scaling of businesses and make them an attractive proposition for acquisition.
The combination of these factors resulted in higher than anticipated levels of demand for a Fund which
was, in retrospect, too small to fully address the follow-on needs of NI businesses at that time.
Linked to the previous point, discussions with Invest NI and the Fund Manager indicate that, in
addition to increasing stakeholders understanding of the importance and role of seed and early stage
finance, a number of key learning points were identified which were subsequently built into the
administration and operation of subsequent Access to Finance Initiatives provided by Invest NI (e.g. in
NISPO). These learning points included:
There was a continued need for government intervention to meet the growth finance needs of
businesses;
The need to establish Funds that were of an appropriate scale (in terms of the quantum of
investment available) to facilitate reasonable levels of follow-on investment to minimise the
dilution of the Fund’s share values and enable the Fund Manager to play a more influential and
proactive role in the investment terms of these follow-on rounds;
The need to provide other non-finance support to businesses alongside the investment including:
Wrap-around investor readiness/business advisory support to provide specialist early-
stage business mentoring advice to those projects that need it, in order to improve the quality
of their business proposition and general business acumen;
Marketing/education function to make potential investees of the availability of funding and
the benefits of receiving this support vis-a-vis any equity that is required to be sacrificed to
receive this support;
The need for greater levels of communication, connectivity and interworking between relevant
stakeholders within the NI seed and early stage ecosystem to ensure that potential opportunities to
support businesses, through their various stage of growth, were not being missed;
Linked to the previous point, there was a greater recognition of the need to provide a wider
continuum of funding (across different investment levels) to ensure that businesses were receiving
the appropriate levels of support to facilitate the next stage of their development
Based on these learning points, the Evaluation Team concludes that whilst Nitech did not deliver VFM
as a standalone Fund/intervention, the integration of these learning points potentially paved the way
for subsequent Funds to realise VFM.
5.5 Exit Strategy from the Fund
The Evaluation Team understands that the Fund Manager agreed to actively manage or closely
monitor the progress of the 5 companies that are continuing to operate until the end of 2014 (at no
additional cost). However, these investments are, at present, sitting in abeyance with the Fund
Manager not contractually required to provide ongoing support to the companies on behalf of the
Nitech Fund. However it is noted that the remaining 5 portfolio companies also received support
through the VGF, also managed by Clarendon and as such continue to be appropriately supported and
monitored. Nevertheless, we recommend that Invest NI takes appropriate action in a timely manner to
ensure that the investments continue to be appropriately supported and monitored.
NITECH GROWTH FUND PPE - VERSION 1.0 Page 46
Discussions with the Fund Manager indicate that a number of Options could be taken forward by
Invest NI to close the Fund and provide ongoing management and monitoring support to the portfolio
companies that continue to exist. The options include:
Option 1: Return Shares to LP - Option 1 would involve the Fund’s shares in the individual
companies being returned to Invest NI (which is allowable under the terms of the LPA51
).
However, the Fund Manager has indicated that the shares are illiquid52
and the majority of the
active portfolio companies continue to require direct intervention by the Manager53
to protect the
interests of Nitech LP, in the absence of further follow-on investment from the Fund.
Option 2: Sell the portfolio to a secondary buyer - It is/has been possible to sell companies
and/or equity portfolios to secondary funders i.e. fund managers who specialise in buying-up
limited partners’ positions in VC and private equity funds. However, the Fund manager has
indicated that had there been ready buyers for individual companies, the Nitech portfolio would
already have been realised. Indeed, buyers have been sought for individual companies, or for a
significant part of the assets, but with little or no interest. The additional difficulty with the sale of
a Partner’s share of the portfolio to a secondary funder is the resultant substantial discount to the
carrying value (up to 50%) that is the norm for these transactions.
This option has been recently investigated with potential secondary buyers for the VGF portfolio
with the conclusion that the portfolio is not attractive to such buyers. Given the VGF portfolio is in
a more commercially advanced state than that of Nitech, it would be (in the Fund Manager’s view)
unlikely to find a buyer for the Nitech Fund’s portfolio.
Option 3: Manage-out the portfolio - The portfolio can be “managed out” i.e. realised either
within the Limited Partnership or under a new contract between the LP and an FCA-authorised
party and outside the original Limited Partnership Agreement (which has now terminated).
The original LPA stated that the General Partner of the Limited Partnership would act as the
liquidating trustee of the Partnership when it terminated54
. The power to allow the General Partner
to take the actions required in managing-out the portfolio and the extended period of time
envisaged, may be achievable practically for Nitech (given Invest NI is the sole Limited Partner)
by an agreed alteration to the wording of the clause in the LPA that authorises the General Partner
to become the liquidating trustee of the portfolio.
Option 4: Transfer the shares under the Co-Fund NI umbrella – A fourth option would
involve the Fund’s share transferred to Invest NI under the Co-Fund NI (which we understand is
allowable under an increased fund size). Discussions with the Fund Manager indicates that, in
such a scenario, Invest NI would potentially be charged a fee based on a fixed Co-Fund NI
contracted fee applied to cost or value of the transferred portfolio. There would potentially be no
bonus paid to the Fund Manager other than valuation performance of Co-Fund NI being measured
inclusive of the Nitech shares. The Evaluation Team understands that such an option could reduce
legal costs of transferring shares whilst retaining Invest NI rights in accordance with standard Co-
Fund rights. It is also noted that 3 of the investee companies are already Co-Fund NI investees so
minimal disruption would potentially be incurred. The Option may also allow for some follow on
investment to be provided to more effectively protect the valuation position.
51
See Clause 6.6.1 (b) of the LPA 52
That is, the shares could not be easily sold or exchanged for cash without a substantial loss in value 53
For example, to support companies to lever additional funding, support company re-structuring and deal with
management issues. 54
The Evaluation Team understands that the legal view is that the authority of the liquidating trustee under the original
LPA in the case of the VGF did not allow the trustee to take the actions. In this case, an extended period of time
(envisaged as up to 3 years) to realise (i.e. sell) the VGF portfolio assets and a new Liquidating Trust is required.

NITECH GROWTH FUND PPE - VERSION 1.0 Page 47
Assuming that Invest NI would not want to manage the outstanding investment portfolio (per Option
1), and Invest NI and the Fund Manager is unlikely to find a buyer for Nitech’s portfolio (per Option
2), then Options 3 and 4 are likely to be the most realistic options from which Invest NI can select to
support and monitor the outstanding investments. Whilst the financial implications of taking forward
each of these options would need to be fully assessed by Invest NI in conjunction with the Fund
Manager, Option 4 would possibly be the least disruptive Option and may facilitate further follow-on
support to be provided to protect the valuation position of the outstanding investments.
The operational merits and associated costs of each of the above options should be fully considered by
Invest NI in timely manner to facilitate the management and monitoring of the Fund’s outstanding
investments
NITECH GROWTH FUND PPE - VERSION 1.0 Page 48
6. CONCLUSIONS AND RECOMMENDATIONS
6.1 Introduction
The section presents the Evaluation Team’s key conclusions and recommendations arising from the
evaluation process.
6.2 Conclusions
6.2.1 Strategic Context and Rationale
During the period under review, there was a need for Government to provide support to address a gap
in the continuum of the supply of finance for deals up to £2m for start-up and early growth businesses.
This gap arose due to (amongst other things) key structural market failures and other structural issues
associated with the NI Economy.
In line with Government’s strategic focus, the provision of venture capital through Nitech offered the
potential to promote a continuum of funds, create a deal flow chain across seed, early and
development funds and retain and build on skills and capability of venture capitalists. In doing so, the
Fund offered the potential to “help eliminate the real and perceived barriers to growth” faced by
SMEs.
6.2.2 Operation and Delivery
Between April 2003 and November 2013, Nitech invested c. £2.92m in a total of 16 companies. £70k
was invested in 3 companies to support them to exemplify their research and/or construct a prototype
(Stage 1), whilst the remainder (£2.85m) were made in 13 businesses to undertake more fundamental
R&D to support the development of novel products and services (Stage 2). The number and level of
Stage 1 investments was lower than anticipated at the outset of the Fund, whilst the levels of demand
for Stage 2 investments was relatively higher than anticipated.
Whilst other more financially attractive initiatives existed within the marketplace which supported
businesses to undertake Stage 1type activities, the size of the Fund meant that there was a limited
opportunity to provide follow-on investment to support the scaling of businesses and make them an
attractive proposition for acquisition. The lack of availability of follow-on funding also resulted in the
dilution of the Fund’s shares and prevented the Fund from participating in subsequent funding rounds.,
This in-turn meant that the Fund Manager had a lack of ability to influence the investment terms of
these rounds (which were set by the incoming investors) many of which included liquidation
preferences, allowing these later investors to realise repayment of their investment on exit, ahead of
investors (such as Nitech) from previous rounds.
Whilst the Fund was, in retrospect, too small to fully address the follow-on needs of NI businesses at
that time, we note that it was created as a pilot Fund during a period when the importance of the role
of seed and early stage finance (including VC finance) was potentially less well known amongst
economic development agencies in NI and further afield, hence there was a lack of public sector
initiatives available to support local SMEs.
Based on all available evidence, the Fund appears to have been appropriately managed by the Fund
Manager who undertook their roles and responsibilities in accordance with the Limited Partnership
Agreement which included undertaking commensurate levels of technical and market due diligence in
advance of investing, stimulating deal flow and subsequently playing an active and supportive
mentoring role within the portfolio companies.
NITECH GROWTH FUND PPE - VERSION 1.0 Page 49
6.2.3 Fund Impact
During the Nitech funding rounds an additional £13.3m was invested in the 16 companies, 75% (or c.
£9.94m) of which came from private sector sources and the remaining 25% (or c. £3.36m) was derived
from public sector sources. The analysis suggests that, the Fund may have directly supported the 16
companies to leverage between £6.7m to £10.6m in net additional investment, of which between £5m
and £7.9m came from private sector sources.
In the absence of undertaking primary research with businesses that received investment, the
Evaluation Team cannot definitely conclude on the levels of additionality and displacement. However,
discussions with Invest NI and the Fund manager suggest that Nitech played a pivotal role in
supporting the businesses to lever investment (and hence additionality levels were high and the risk of
displacement was low.
The analysis indicates that Nitech may have directly contributed to creating and/or maintaining
between 483 and 720 FTE job years. A total of 75 NI-based FTEs continue to be employed in 5 of the
16 portfolio companies that continue to operate. The application of the calculated levels of
additionality, suggests that, depending on which additionality scenario is selected, Nitech has directly
contributed to creating and potential safeguarding of between 38 and 56 of the jobs that continued to
exist in 2014. The analysis indicates that Nitech is likely to have created, maintained and safeguarded
a significant proportion of jobs with salaries in excess of the NI private sector median.
The analysis suggests that the portfolio companies potentially cost the NI economy £559k in gross
GVA (net of the investment made through Nitech). However, much of the expenditure that has
contributed to the negative GVA impacts was as a result of considerable expenditure on undertaking
further R&D activities, and thus contributing to other strategic goals within an NI context, such as
increasing levels of Business Expenditure R&D (BERD).
The investment made through Nitech may have directly cost the NI economy between £116k
(Scenario 1) and £419k (Scenario 2) in net additional GVA to the NI economy. Given the level of
investment made in each of the portfolio companies suggests that the investment made through Nitech
potentially cost the NI economy between £0.04 and £0.14 in net additional GVA for every pound
invested through the Fund.
In addition to the aforementioned benefits, the analysis suggests that the investment made through
Nitech has contributed to delivering a number of wider (e.g. knowledge transfer, skills development,
entrepreneurship etc.) and regional benefits (degree of R&D being injected and innovative nature of
the project) to the NI economy.
Of the 16 businesses that received investment through the Fund, 11 businesses no longer exist and 5
businesses are continuing to operate. As of September 2015, there have been no successful exits. The
Fund Manager’s updated estimates of the value of the Fund’s investments for companies that continue
to exist indicate that the potential value of these investments is c. £418k, which is significantly below
their value at cost.
Only 1 of the 5 existing investments have been valued by the Fund Manager in excess of its value at
cost and the Fund Manager has confirmed that the Fund is likely to see a return during 2016. Whilst
the progression of the 16 portfolio companies to date, has performed below expectations, it’s
performance should be viewed in the context of:
Its relatively small size and associated inability to provide adequate levels of follow on funding,
to support the growth and scaling of the businesses and mitigate against any dilution of the Fund’
shares value;
The limited number of other equity funds and low levels of investor readiness support that existed
during the early years of Nitech;
NITECH GROWTH FUND PPE - VERSION 1.0 Page 50
The depressed macro-economic climate (particularly from 2008 onwards) is likely to have
impacted on company scaling and growth, resulting in companies with insufficient sales or
profitable growth to become attractive acquisition targets; and
There was a general lack of acquisition activity across NI (and the UK) during the period under
review (largely due to the economic climate which drove higher levels of risk aversion and
negatively impacted on the availability of finance).
6.2.4 Progress towards targets
Whilst the Evaluation Team is unable to draw direct comparisons between the anticipated deal flow
activity targets and the actual outturn, the Fund achieved or partially achieved all other activity targets.
We do however note that the designation of target achievement masks the overall outcomes of the
companies invested in, which was below that anticipated.
6.2.5 Fund Finance
The full economic cost of delivering the Fund over its ten year life was £3.96m, which was broadly
aligned to the anticipated costs (£4m (inclusive of the Fund extension). Fund administration costs
(direct fund costs plus priority profit share (PPS)) represented just over one-quarter (26% or c. £1.1m)
of the full economic cost.
A total of c. £868k of management fees (PPS) were paid to the Fund Manager over the period,
representing c. 22% of total Fund costs (inclusive of direct fund costs, PPS and investment in portfolio
companies). Based on the Evaluation Team’s understanding of the management fees paid on other
Funds (which Invest NI confirmed can typically range between 20% and 30%), the proportion of Fund
costs allocated to the Fund Manager appears reasonable.
During the period under review there were no realisations from the investments and there has been no
capital return to Invest NI.
6.2.6 Return-on-investment
Given the calculated levels of net additional GVA (between (£116k) and (£419k)) and the full
economic costs (£3.96m) suggests that the Fund may have potentially cost the NI economy between
£0.03 and £0.11 in net additional GVA for every pound invested.
6.2.7 Value-for-Money
In the absence of the original approval documentation (Economic Appraisal and Casework) it is
difficult to ascertain what value-for-money (VFM) was anticipated to be in the context of Nitech.
However, based on all available evidence, including the overall performance of the Fund, we conclude
that the Nitech Fund has not delivered VFM during the period under review.
Whilst Nitech did not deliver VFM as a standalone Fund/intervention, a number of key learning points
were identified during the delivery of the Fund which were subsequently built into the administration
and operation of subsequent Access to Finance Initiatives provided by Invest NI (e.g. in NISPO).The
integration of these learning points potentially paved the way for subsequent Funds to realise VFM.
NITECH GROWTH FUND PPE - VERSION 1.0 Page 51
6.2.9 Exit Strategy from the Fund
The Evaluation Team understands that the Fund Manager agreed to actively manage or closely
monitor the progress of the 5 companies that are continuing to operate until the end of 2014 (at no
additional cost). However, these investments are, at present, sitting in abeyance with the Fund
Manager not contractually required to provide ongoing support to the companies on behalf of the
Nitech Fund. We therefore recommend that Invest NI takes appropriate action in a timely manner to
ensure that the investments are appropriately supported and monitored.
Discussions with the Fund Manager indicate that a number of Options could be taken forward
including:
Option 1: Return Shares to LP
Option 2: Sell the portfolio to a secondary buyer
Option 3: Manage-out the portfolio
Option 4: Transfer the shares under the Co-Fund NI umbrella
Whilst the financial implications of taking forward each of these options would need to be fully
assessed by Invest NI in conjunction with the Fund Manager, Option 4 would possibly be the least
disruptive Option and may facilitate further follow-on support to be provided to protect the valuation
position of the outstanding investments.
6.3 Recommendations
1. Invest NI should ensure to takes appropriate action in a timely manner to ensure that all existing
investments in companies that are continuing to operate are appropriately supported and
monitored. This should include providing consideration to the operational merits and associated
costs of each of the identified potential exit strategies.
2. As part of the development of future funds, cognisance should be taken of the need to establish
funds that are of a suitable size to facilitate appropriate levels of follow-on investment.