Embed Size (px)
Citation preview

1
Northern California | 2012

Mike Kamm, CEO Cassidy Turley
Northern California
Introduction

Discover The State of Real Estate / 2012
Cassidy Turley
3,400 professionals
940 agents
60 US offices
455M SF under management on behalf of corporate, institutional
and private investors
25,000
corporate services locations

Discover The State of Real Estate / 2012
High Profile Hires

Discover The State of Real Estate / 2012
High Profile Hires

Discover The State of Real Estate / 2012
Santana Row Move

Kevin Thorpe Chief Economist
Cassidy Turley
Featured Speaker

Discover The State of Real Estate / 2012
World GDP Grows by 4.1% in 2012
Canada
Brazil
UK
Eurozone
Russia
India
China
Japan
GDP, 2012, Year-over-year % change
Source: IMF, The Economist
Mexico
2.5%
3.6%
1.7%
3.8%
3.6%
9.1%
2.1%
7.5%
-0.3%

Discover The State of Real Estate / 2012
U.S. Bank Exposure to Euro-zone
% of Tier 1 Capital
0
10
20
30
40
50
60
70
80
90
Portugal,Ireland,Italy Greece,Spain
All Claims(Entire Eurozone)
16.8%
76.7%
Private
Public
Banks
Source: Capital Economic, BIS
Exposure to Peripheral
Countries
Exposure to entire
Euro-zone

Discover The State of Real Estate / 2012
Source: CBO, Moody’s
Total of $4 trillion needed for long-run sustainability, 2012-2021
The Budget Control Act of 2011

Discover The State of Real Estate / 2012
DJIA Predicts Presidency When DJIA is up, Incumbent wins 100% of the time
Source: Bloomberg
Harry S.
Truman
1945
Dwight D. Eisenhower
1953
Ronald Regan
1983
Bill Clinton
1995
George W. Bush
2003
FDR
1936
FDR
1940

Discover The State of Real Estate / 2012
Historical Average
Still Deleveraging Household Debt-to-GDP
Source: Federal Reserve Board

Discover The State of Real Estate / 2012
Source: U.S. Census Bureau
Slow Recovery Continues…
Real GDP, % Chg
Potential GDP = 2.7%

Discover The State of Real Estate / 2012
Unemployment will stay high, but…
Source: BLS

Discover The State of Real Estate / 2012
Multifamily Hotel
Retail
Industrial
Office
Downturn Recovery Upturn Mature Downturn Weak demand
Vacancy not falling
Improving Demand
Falling Vacancy
Strong Demand
Tight Vacancy
Historic, demand,
vacancy, rents
Absorption Q1 – Q3 2011
Vacancy
YoY Chg
Rents Yoy
Chg
Sales
Yoy %Chg
Office +38.1 M -90 bps +$0.18 +57.1%
Industrial +71.6 M -50 bps -$0.07 +76.2%
Retail +247 K +10 bps -$0.06 +108.1%
Multifamily +122.7 units -170 bps +$21.00 +57.3%
CRE Fundamentals Improving

Discover The State of Real Estate / 2012 16
When will we reach normalcy?
Source: Cassidy Turley Research
Absorption vs. Available Office Space
49.5 M SF Historical Absorption
0
200
400
600
800
1000
1200
2011 2012 2013 2014 2015
Mil
lio
ns, s.f
.
Empty Office Space Equilibrium

Discover The State of Real Estate / 2012
NABE’s Consensus Forecast Annual Forecasts made in November 2011
2011 Forecast 2012 Forecast
Median Five
Lowest
Five
Highest Median
Five
Lowest
Five
Highest
Real GDP, % change, Q4/Q4 1.7 1.2 2.0 2.4 0.9 3.8
CPI, % change, Q4/Q4 3.4 1.3 3.9 2.0 0.7 3.9
Personal Consumption Expenditures
Price Index less food energy, % chg,
Q4/Q4
1.9 1.4 2.3 1.8 0.9 2.8
Civilian Unemployment Rate, % annual
average 9.0 9.0 9.1 8.9 8.1 9.5
Federal Funds Target, % year-end 0.125 0.103 0.126 0.125 0.103 0.341
10-Yr Treasury Note Yield, % year-end 2.73 2.15 3.53 2.70 2.18 4.03
Foreign Exchange Rate, US$ per Euro,
December Average 1.37 1.22 1.43 1.37 1.11 1.47
Housing Starts, millions of units 0.60 0.57 0.74 0.66 0.60 0.96
Home Prices, FHFA, % change, Q4/Q4 -2.5 -6.2 1.8 0.9 -3.6 4.8
Oil Prices, $ per barrel, December
Average 92.0 78.7 97.0 94.8 79.6 110.6
S&P 500 Index, December 31 1294.4 1178.0 1391.2 1380.0 1202.6 1604.8
“While we still expect that economic
activity and labor market conditions
will improve gradually over time, the
pace of progress is likely to be
frustratingly slow.”
-Chairman Bernanke
"If the economy is growing only 1.5
percent to 2 percent and you get a
fiscal drag of 1.3 percent — that's
the difference between a growth
recession and effectively zero
growth.”
-Nouriel Roubini, NYU
"The economy is struggling to avoid
recession…There are a number of
things coming together with regards
to fiscal policy that makes early next
year look very iffy .”
-Mark Zandi, Moody’s Analytics

Discover The State of Real Estate / 2012 18
Reasons for optimism
Source: Federal Reserve Board
Historical Avg: 12.1
HH debt is affordable debt

Discover The State of Real Estate / 2012
Consumer Confidence Index
Gas prices
spike $4
Disaster in
Japan
Debt ceiling
debate begins
S&P
Downgrade
US GDP nearly
contracts in Q1 European Debt
Crisis Worsens
Couldn’t catch a break in 2011
Source: The Conference Board, Cassidy Turley Research

Discover The State of Real Estate / 2012
Reasons for optimism Corporate Profits, $ tril
• Corporate profits up
• Job growth hits 200k
• Auto sales rebounding
• Confidence is rebounding
• Exports strong
• ISM Index back up
Source: Census Bureau, Cassidy Turley

Discover The State of Real Estate / 2012
Source: Moody’s
10-Yr Sovereign Debt Yields, %
What to Watch: Italian Bonds

Discover The State of Real Estate / 2012
What to Watch: Copper
Source: DOW Jones AIG, NSA
Copper Prices

Discover The State of Real Estate / 2012
Northern California
Includes four major metros:
• San Jose-Sunnyvale-Santa Clara
• San Francisco-San Mateo-Redwood city
• Oakland-Fremont-Hayward
• Sacramento Arden-Arcade-Roseville

Discover The State of Real Estate / 2012
Northern California
Midwest Economy • GDP $2.4 Trillion • Total Employment 29,778,000 • Unemployment Rate 8.8%
Economic Snapshot
• Total Employment
3.6 million
• GDP
$477.5 Billion
• Population
8.4 million
• Unemployment Rate:
9.8% Job Sectors

Discover The State of Real Estate / 2012
Northern California Employment
Source: Bureau of Labor Statistics
Is 2011 the first year of the
next tech boom?

Discover The State of Real Estate / 2012
-1,700
-1,000
1,200
2,700
5,100
5,400
6,600
17,100
18,000
-5,000 0 5,000 10,000 15,000 20,000
Government
Financial Activities
Other Service
Information
Leisure and Hospitality
Trade, Transportation and Utilities
Goods-Producing
Educational and Health Services
Prof. & Bus. Services
Employment Growth/Decline by Industry Northern California, Nov 2011 vs. Year-ago
Source: Bureau of Labor Statistics

Discover The State of Real Estate / 2012
Job Growth in NorCal Markets
Y/Y Percent Change: Nov 11 over Nov 10
Source: Bureau of Labor Statistics
+28,400 jobs
+14,800 jobs
+7,200 jobs
+3,000 jobs

Discover The State of Real Estate / 2012
-4
-3
-2
-1
0
1
2
3
4
5N
ew
Yo
rk, N
Y
Se
att
le, W
A
Ho
us
ton
, TX
Da
lla
s, T
X
Sa
n J
os
e-S
ilic
on
Va
lle
y
Sa
n F
ran
cis
co
, C
A
Au
sti
n,
TX
Ph
ila
de
lph
ia, P
A
Sa
n M
ate
o C
ou
nty
, C
A
Wa
sh
ing
ton
DC
Oa
kla
nd
-Ea
st
Ba
y, C
A
Sa
cra
me
nto
, CA
Cle
ve
lan
d, O
H
Sa
int
Lo
uis
, M
O
Ve
ntu
ra C
ou
nty
, C
A
Po
rtla
nd
, M
E
Ind
ian
ap
olis
, IN
We
stc
he
ste
r, N
Y
Lo
s A
ng
ele
s,
CA
Ch
ica
go
, IL
Mil
lio
ns, s
.f.
Office Sector: Net Absorption 2011
NorCal all over the Top 10
Source: Cassidy Turley Research

Discover The State of Real Estate / 2012
Is this tech boom sustainable?
This time it’s different
• Real businesses with real products
• More global – 2 billion internet users
today
• Huge growth potential in China &
other emerging economies
• 77% of the world has a cell –
5.3b of repeat demand
• NASDAQ not outpacing DJIA like it did
in the 90s
Late 90s all over again
• Too frothy
• Tech salaries growing too fast
• Venture capitalists have no where
else to put their money
• Fledging firms commanding huge
IPOs again
• Investors still don’t get technology

Discover The State of Real Estate / 2012
36,500
78,500
106,450
84000
0
20,000
40,000
60,000
80,000
100,000
120,000
140,000
160,000
2012 2013 2014 2015
0
20,000
40,000
60,000
80,000
100,000
120,000
Cassidy Turley
Moody's
Average
Source: Moody’s, Cassidy Turley
Northern California Job Growth Forecast
Strong Years Lie Ahead

Discover The State of Real Estate / 2012
Employment Forecast
Market 2012 2013 2014 2015
Oakland-East Bay 9.3 16.5 19.1 15.8
Sacramento 5.4 14.0 17.4 14.9
San Jose 12.6 15.7 18.9 15.8
San Francisco 12.6 19.8 22.6 18.5
Northern
California 40.0 66.0 78.9 65.0
Northern California, 000’s
Source: Cassidy Turley

Discover The State of Real Estate / 2012
Tech drove the bus in 2011
Top Office/R&D Leases in 2011
Tenant RSF Tenant RSF Tenant RSFFacebook, Inc. 1,029,000 Affymetrix, Inc. 201,052 Zynga 117,280
Google, Inc. 700,328 Atmel 194,000 Siemens 114,583
Sony 456,795 Dreamworks 193,000 Cavium Networks 113,381
Hewlett Packard 393,776 Wilson, Sonsini, etal 184,000 Healthnet 113,078
Linkedin, Inc 393,195 Jabil Circuits 181,656 Cepheid 110,217
Google, Inc. 387,939 Micro Semi Corp. 179,232 Abbott Labs 110,000
Apple, Inc. 377,927 TeleNav, Inc 175,000 Magma Design 109,450
Synopsys, Inc. 340,000 Intevac 169,795 Apple, Inc. 108,712
Motorola Mobility 317,166 Theranos 137,000 Covington & Burling 108,315
Hitachi 300,000 Symantec Corporation 136,377 Pillsbury, Winthrop, Shaw 107,447
Logitech, Inc. 263,543 Google, Inc. 135,656 Avid Technology 106,460
University Of The Pacific 260,843 SAP America, Inc. 135,080 Riverbed Technology 103,985
Avaya 257,155 Bristol-Myers Squibb 133,123 C8 Medisensors 102,114
Dell Computers 240,823 Flextronics 130,455 Perfect World 100,000
Microsoft Corporation 237,121 Celestica 128,250 Omnicell 99,880
Apple, Inc. 215,481 Silicon Image 128,154 NVIDIA 99,800
PolyCom, Inc. 212,863 Farella, Braun, & Martel 121,000 Microchip Technology/SST 98,423
Intuit 210,000 Biomarin Pharmaceutical 120,338 Guidewire 97,674
Twitter 205,903 Zazzle 119,730 Keker & Van Nest, LLP. 97,034
NanoSolar 203,807 Sun Edison 118,741 Qualcomm Inc. 96,780

Discover The State of Real Estate / 2012
Tech drove the bus in 2011
Top Office/R&D Leases in 2011
Tenant RSF Tenant RSF Tenant RSFBox.Net 96,562 NetSuite 79,589 C3 68,409
Sephora 91,666 Capital Region Financial 77,748 American Medical Systems 68,366
Apple, Inc. 91,195 Ebay, Inc. 75,432 Juniper Networks, Inc. 68,000
ST Microelectronics, Inc. 91,008 Huawei Technologies 75,000 Phillips 67,000
Sedgwick,Detert, etal 89,076 Siemens 75,000 Santa Clara Cty Valley Trans. 67,000
Ironport 88,412 Tellabs 74,453 Symantec Corp. 67,000
DropBox 87,500 AAA 73,696 Codexis Inc. 66,080
NXP Semiconductor USA 86,602 Sungevity 73,100 National Instruments 66,000
Ariba 86,000 Micron Technologies 72,486 Google, Inc. 65,856
Altierre Corp. 85,637 Enphase 72,000 Farallon Capital Mgmt 65,553
Evalve 84,643 Loral Space Systems 71,972 First Republic Bank 65,506
Quantum Corporation 83,877 Verizon 71,484 Pharmacyclics, Inc. 64,776
KPMG 82,771 Fluor 70,047 Ubiquiti Networks 64,512
Northrup Grumman 82,574 Epicor Software 70,000 Geometrics, Inc. 64,100
24 Hour Fitness 81,500 Pac-12 70,000 Dolby Laboratories 63,379
Comerica Bank 81,213 Intematix Corporation 69,752 Pisces Inc. 63,000
Goodby, Silverstein etal 81,065 Innovative Molding 69,000 Huawei Technologies 62,522
Financial Engines, Inc 80,995 SeaMicro 68,608 EBay 62,281
Good Technology Inc. 80,302 Sonic Mfg Technologies 68,600 Triple Ring Technologies 62,020
A-10 Networks 79,803 NovaSolar 68,441 Solution Set 61,980

Discover The State of Real Estate / 2012
Tech drove the bus in 2011
Top Office/R&D Leases in 2011
Tenant RSF Tenant RSFKovio 61,656 Cable Connection 55,138
MediaTek 61,518 Supracor, Inc. 55,124
Taleo Corp 61,089 Aecom Technology Corp 55,000
Stanford 61,081 Catholic Healthcare 55,000
Williams Sonoma 60,000 Palo Alto Medical Found. 55,000
Google, Inc. 59,617 Ascentool, Inc. 54,440
Apple, Inc. 59,075 AT&T 53,284
Apple, Inc. 58,979 Coverity 53,025
Zynga 58,728 Apple, Inc. 52,661
Responsys 58,388 Neuropace 52,528
Fish & Richardson 58,260 Gilead Sciences 52,416
Actuate 58,069 Nitinol Devices 52,200
Reel Solar 57,850 Goodby, Silverstein etal 51,931
MediVation 57,172 BioNovo 51,472
LinkedIn 57,120 Aptimus 51,429
Kabam 57,096 Zurich American Insurance 51,115
Wells Fargo Insurance 57,081 NIKU 51,063
Netflix 56,698 RIM 50,478
Finisar Corporation 56,156 Model N 50,473
John Wiley And Sons 55,770 Apple, Inc. 50,159

Discover The State of Real Estate / 2012
Rents surge…driven by tech
16%17%
-5% 0% 5% 10% 15% 20%
Sacramento, CA Phoenix, AZ
Oakland-East Bay, CASan Diego, CA Baltimore, MD
Atlanta, GA Dallas, TX
San Jose-Silicon Valley, CAUnited States
Denver, COWashington DC
Suburban VABoston-Cambridge, MA
Saint Louis, MONew York, NY
San Francisco, CA San Mateo County, CA
Office Rents, 2011 vs. 2010 % chg

Discover The State of Real Estate / 2012
Bay Area Office Market
Market Vacancy
Q4-10
Vacancy
Q4-11
Net
Absorption
Average
Asking
Rate
Rent YOY
%Change
Marin County 20.3% 13.7% 638K $2.46 1%
San Francisco 14.5% 11.0% 2.9M $3.18 16%
San Mateo County 16.7% 13.2% 1.1M $3.16 17%
Santa Clara County 18.2% 14.1% 2.5M $2.53 -3%
East Bay 17.0% 17.1% -152K $1.96 -4%
Bay Area Total 16.5% 13.8% 7.0M $2.59 5%
Full Service
Rates

Discover The State of Real Estate / 2012
Bay Area R&D Market
Market Vacancy
Q4-10
Vacancy
Q4-11
Net
Absorption
Average
Asking
Rate
Rent YOY
%Change
San Mateo County 14.5% 12.1% 474K $2.14 -3%
East Bay 23.5% 21.1% 780K $0.79 -9%
Santa Clara County 17.6% 14.6% 3.3M $1.24 15%
Bay Area Total 18.3% 15.4% 4.5M $1.20 7%
NNN Rates

Discover The State of Real Estate / 2012
Bay Area Warehouse Market
Market Vacancy
Q4-10
Vacancy
Q4-11
Net
Absorption
Average
Asking
Rate
Rent YOY
%Change
San Francisco 5.1% 5.1% 2K $0.75 -8%
San Mateo County 10.4% 10.0% 142K $0.72 -1%
East Bay 10.0% 9.9% 244K $0.37 2%
Santa Clara County 9.3% 9.1% -3K $0.44 -1%
Bay Area Total 9.3% 9.2% 384K $0.49 -2%
NNN Rates

Discover The State of Real Estate / 2012
Bay Area Retail Market
Shopping
Centers* Vacancy
Q4-10
Vacancy
Q4-11
Net
Absorption
Average
Asking
Rate
Rent YOY
%Change
San Francisco 7.1% 5.7% 51K $3.03 -7%
San Mateo County 3.4% 2.9% 106K $2.21 0%
East Bay 7.6% 6.5% 728K $1.74 -2%
North Bay 5.7% 4.7% 181K $1.67 -3%
Santa Clara County 7.2% 6.7% 346K $2.08 -6%
Bay Area Total 6.8% 5.9% 1.4 M $1.89 -5%
NNN Rates *Excluding Malls

Discover The State of Real Estate / 2012
Bay Area Office Net Absorption
-1.0
-0.5
0.0
0.5
1.0
1.5
2.0
2.5
Q1-1
0
Q2-1
0
Q3-1
0
Q4-1
0
Q1-1
1
Q2-1
1
Q3-1
1
Q4-1
1
Mil
lio
ns, s
.f.

Discover The State of Real Estate / 2012
Panelists
Office
Mike Moran Managing Partner
R&D
Erik Hallgrimson Partner
Industrial
Jeff Starkovich Managing Partner
Retail
Matt Kircher Managing Partner
Investments
Bob Gilley Managing Director
Discover The State of Real Estate / 2012
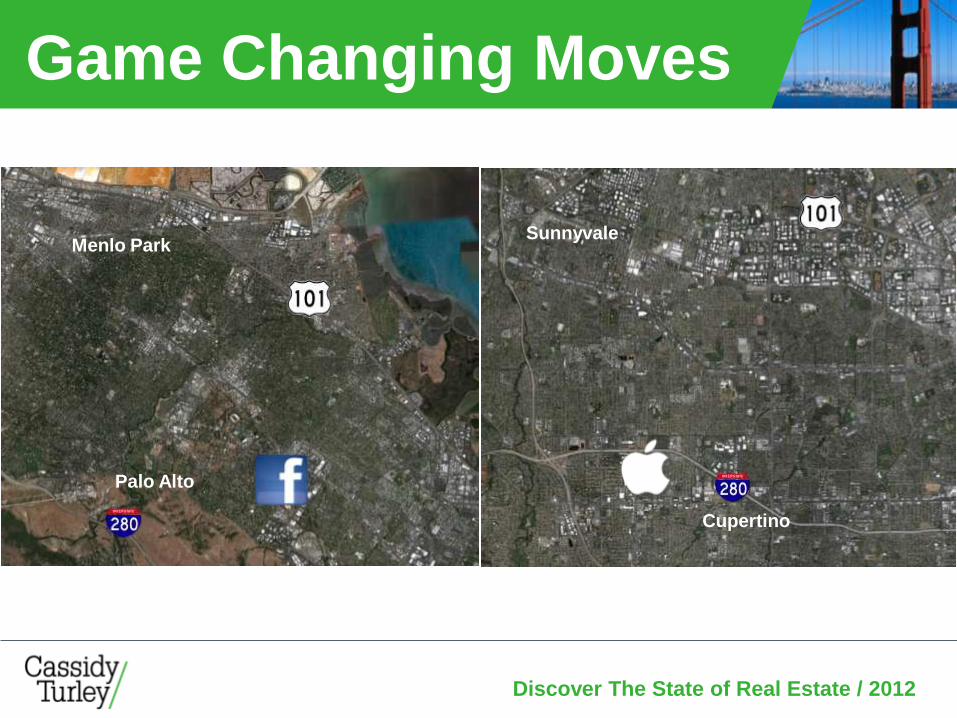
Game Changing Moves
Mountain View
Sunnyvale
Palo Alto
Menlo Park
Cupertino
Sunnyvale

Discover The State of Real Estate / 2012
Game Changing Moves
Mountain View
Sunnyvale
SoMa
Mid-Market

Discover The State of Real Estate / 2012
Pre-1996
±250SF/Employee
Circa 2007
±200SF/Employee
Circa 2011
±150SF/Employee
The Evolution of the Work Space

Discover The State of Real Estate / 2012
Everything has Changed Key Bay Area Industries/Companies
MEDIA
• Craigslist
• Wikipedia
• IDC
• Blogger
• Future Networks
• World Press
FINANCIAL
• Franklin
• Visa
• E-Trade
• Intuit
• Schwab
• Barclays
• JP Morgan
LEGAL
• Tech Legal
• Intellectual Capital
• IP Practice
• Patent Specialties
• IPO
• M&A Practice

Discover The State of Real Estate / 2012
Everything has Changed Key Bay Area Industries/Companies
TECHNOLOGY
• Media
• Cloud
• Social Networking
• Wireless
• Software Dev.
• Sales Subscription
LIFE SCIENCES
• Genentech
• Bayer
• Novartis
• Amgen
• Gilead
AUTO (Tech)
• GM (On-Star)
• Renault (Nissan)
• Ford (Palo Alto)
• Tesla
• VW-Audi-Bentley
• Google (autocars)

Discover The State of Real Estate / 2012
What is an R&D building?

Discover The State of Real Estate / 2012
What is an R&D building?

Discover The State of Real Estate / 2012
Recent Bankruptcies…

Discover The State of Real Estate / 2012
Tenants on the rise…

Discover The State of Real Estate / 2012
Bay Area Warehouse Landscape

Discover The State of Real Estate / 2012
Sublease Q3-Q4
Added 400K Added 400K Down No Impact Flat
East Bay Warehouse
Net Absorption Conundrum
Discover The State of Real Estate / 2012
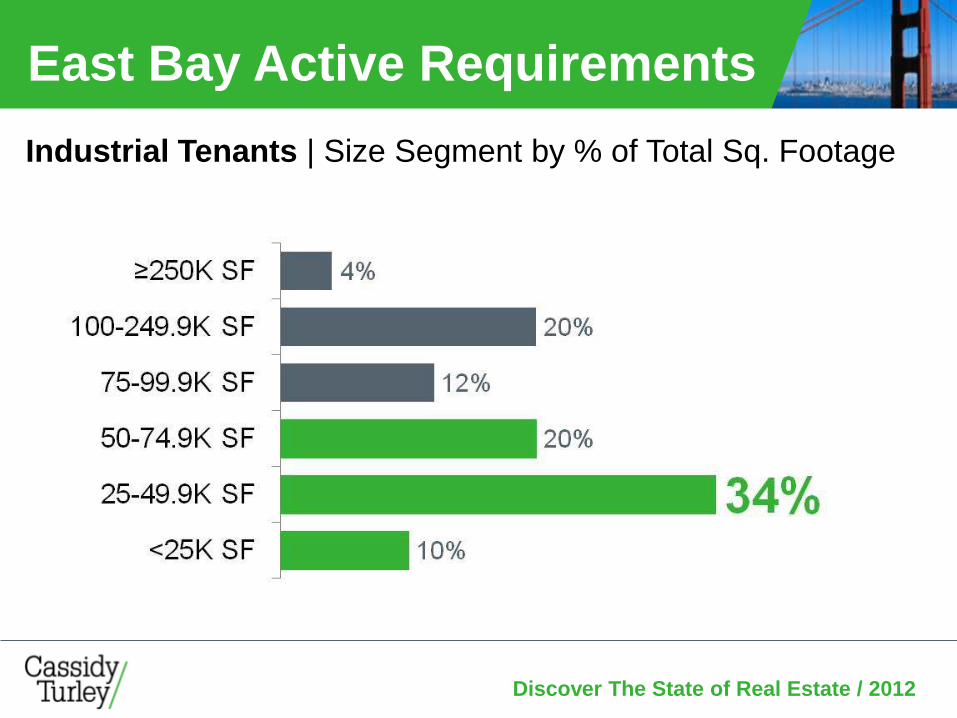
East Bay Active Requirements
Industrial Tenants | Size Segment by % of Total Sq. Footage

Discover The State of Real Estate / 2012
City Target Metreon

Discover The State of Real Estate / 2012
1 2
3 4
5 6 8
7
9 10
11
Mountain View
Fremont
Milpitas
North San Jose
Santa Clara
Sunnyvale
Tenant RSF Rate NNN
1 Motorola 80,669 $3.37
2 Rambus 30,963 $3.19
3 Financial Engines 80,995 $3.09
4 Microsoft 237,121 $2.59
5 Hewlett Packard 393,776 $2.86
6 Motorola 236,444 $2.74
7 Synopsys, 340,000 $3.80
8 Omnicell 99,880 $3.13
9 Micron Technologies 72,486 $0.72
10 NovaSolar 68,441 $0.65
11 Ascentool 54,440 $0.52
A Tale of Two Cities Silicon Valley Office/R&D Tenant Trends in 2011

Discover The State of Real Estate / 2012
Silicon Valley Tenant Tracking
By Search Area
Total Requirements
0 10 20 30 40
South SMC
Mt. View-Palo Alto-Menlo Park
Sunnyvale-Santa Clara
West Valley
San Jose
Milpitas-Fremont
Unknown
Square Footage (Millions)
0 1 2 3
South SMC
Mt. View-Palo Alto-Menlo Park
Sunnyvale-Santa Clara
West Valley
San Jose
Milpitas-Fremont
Unknown

Discover The State of Real Estate / 2012
Silicon Valley Tenant Tracking
By Size Segment
100,000 - 199,999 SF 17 2,210,000
60,000 - 79,999 SF
810,000 81,00010
20,000 - 39,999 SF 15 400,000 26,667
Location Requirements SF
Total 85 9,022,000 106,141≥200,000 SF 13 4,100,000 315,385
8 540,000 67,500
40,000 - 59,999 SF 21 945,000 45,000
130,000
80,000 - 99,999 SF
Avg Deal Size

Discover The State of Real Estate / 2012
$0.25
$0.30
$0.35
$0.40
$0.45
$0.50
$0.55
$0.60
0%
2%
4%
6%
8%
10%
12%
14%
2002 2003 2004 2005 2006 2007 2008 2009 2010 2011
Vacancy Avg Asking NNN
East Bay Warehouse Vacancy & Average Asking Rate (NNN) Trend
Vacancy Falls
Below 8%

Discover The State of Real Estate / 2012
Office Development Pipeline
2.4M
0.7
2.9
4.4
BTS
Spec.
BTO
Likely Development Next 24 Mos (Million SF)
8.1M Square Feet
3.9M
1.8M

Discover The State of Real Estate / 2012
Bay Area Warehouse Development Trend | Square Feet in Millions

Discover The State of Real Estate / 2012
2012 Major Shopping Centers
1
2
3
4
5
6
7
8
9
10

Discover The State of Real Estate / 2012
Bay Area Office Underwriting
San Francisco Silicon Valley Secondary Markets
Core Funds (7-10 Yr Hold)
Returns
Going-in Cap 5-6% 6-6.5% 7-8%
Unleveraged IRR 7-8% 8-10% 9-12%
Leveraged IRR 8-9.5% 10-12% 12-15%
Underwriting
Exit Cap 7-7.5% 7.5-8% 8-8.5%
Rent Growth
2012 10% 10% 3-4%
2013 10% 10% 3-4%
2014 5% 5% 3-4%
2015+ 3% 3% 3%
Institutional Investors

Discover The State of Real Estate / 2012
Bay Area Office Underwriting
Institutional Investors
San Francisco Silicon Valley Secondary Markets
Value-Add Funds (3-5 Yr Hold)
Returns
Leveraged IRR 13-15% 15-18% 17-20%
Underwriting
Exit Cap 6-7% 7-7.5% 8-8.5%
Rent Growth
2012 15% 15% 5-10%
2013 15% 15% 5-10%
2014 10% 10% 5-10%
2015+ 3% 3% 3%

Discover The State of Real Estate / 2012
Select Recent Institutional Deals
PROJECT SQ.FT. PRICE
• Central Research Park, Sunnyvale 468,953 $132M
• Sobrato Portfolio, Silicon Valley 789,033 $88.8M
• 360 Spear St, San Francisco 154,950 $85.0M
• Capmark Portfolio, Silicon Valley 539,095 $66.6M
• 625 Second St, San Francisco 136,906 $56.4M
• MachineWorks Bldg, Portland OR 114,396 $41.1M


Discover The State of Real Estate / 2012
2012 Forecast Book

Discover The State of Real Estate / 2012
Web Video Available Friday!

68
Northern California | 2012