Embed Size (px)
Citation preview
A Status Quo of Segregation: Northern and Central New Jersey Fact Sheet 10-11-13 Civil Rights Project/Proyecto Derechos Civiles
The Civil Rights Project/ Proyecto Derechos Civiles
1
Northern and Central New Jersey
Geography
The U.S. Census-based metropolitan area of Northern and Central New Jersey (North and Central Jersey) includes the counties of Ocean, Mercer, Middlesex, Monmouth, Somerset, Hunterdon, Warren, Sussex, Morris, Passaic, Bergen, Essex, Hudson, and Union. It is part of a greater Census-based metropolitan area that includes cities and suburbs in New York, Connecticut, and Pennsylvania as well, although only New Jersey municipalities were used for this analysis. The North and Central Jersey area in particular consists of a great many municipalities local to New York City. Examples of cities include Newark, Jersey City, Paterson, Elizabeth, New Brunswick, and Trenton, while large suburbs include Toms River, Clifton, and Edison. Suburbs stretch across the metropolitan area outside of these cities as well as New York City, with each distinct suburban municipality possessing its own school district.
Enrollment
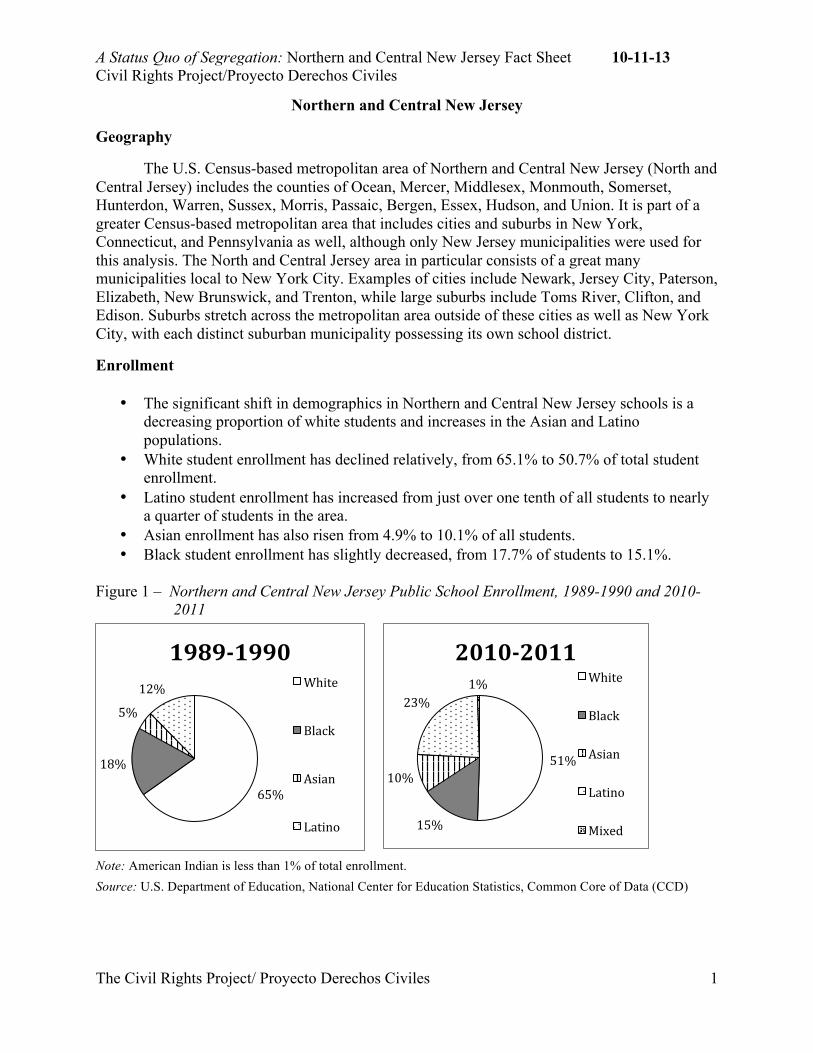
• The significant shift in demographics in Northern and Central New Jersey schools is a decreasing proportion of white students and increases in the Asian and Latino populations.
• White student enrollment has declined relatively, from 65.1% to 50.7% of total student enrollment.
• Latino student enrollment has increased from just over one tenth of all students to nearly a quarter of students in the area.
• Asian enrollment has also risen from 4.9% to 10.1% of all students. • Black student enrollment has slightly decreased, from 17.7% of students to 15.1%.
Figure 1 – Northern and Central New Jersey Public School Enrollment, 1989-1990 and 2010-
2011
Note: American Indian is less than 1% of total enrollment. Source: U.S. Department of Education, National Center for Education Statistics, Common Core of Data (CCD)
65%
18%
5%
12%
1989-‐1990 White
Black
Asian
Latino
51%
15%
10%
23% 1%
2010-‐2011 White
Black
Asian
Latino
Mixed
A Status Quo of Segregation: Northern and Central New Jersey Fact Sheet 10-11-13 Civil Rights Project/Proyecto Derechos Civiles
The Civil Rights Project/ Proyecto Derechos Civiles
2
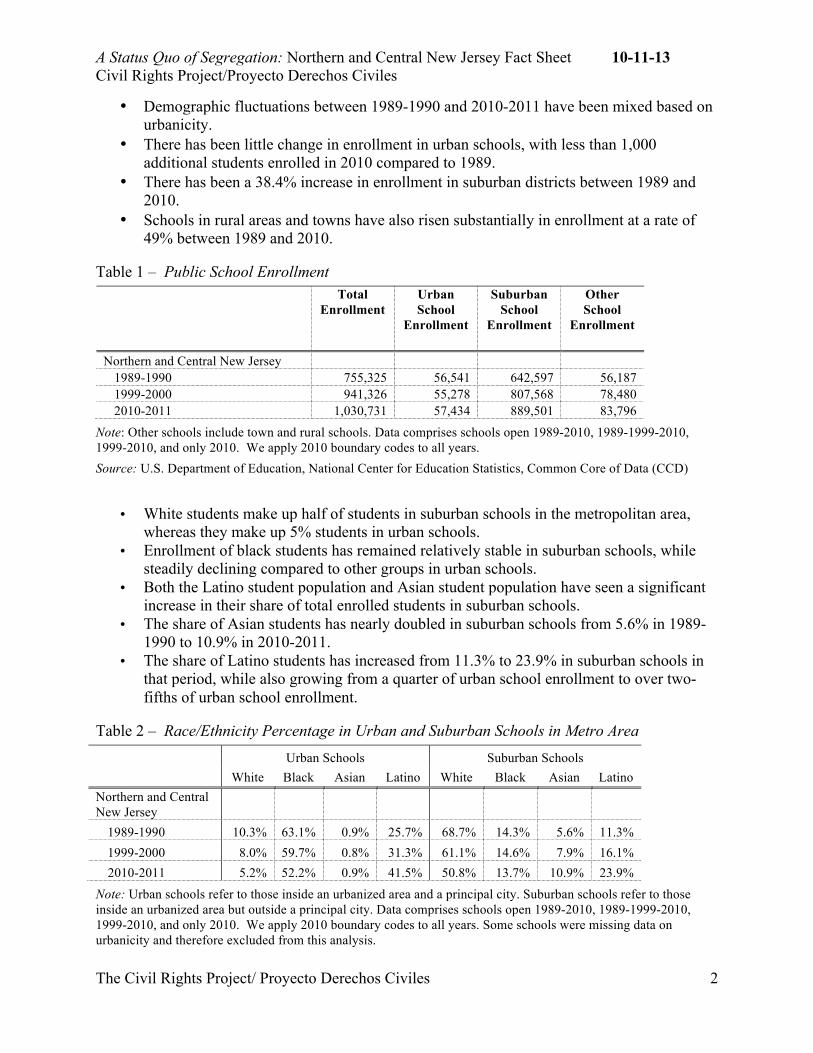
• Demographic fluctuations between 1989-1990 and 2010-2011 have been mixed based on urbanicity.
• There has been little change in enrollment in urban schools, with less than 1,000 additional students enrolled in 2010 compared to 1989.
• There has been a 38.4% increase in enrollment in suburban districts between 1989 and 2010.
• Schools in rural areas and towns have also risen substantially in enrollment at a rate of 49% between 1989 and 2010.
Table 1 – Public School Enrollment
Total Enrollment
Urban School
Enrollment
Suburban School
Enrollment
Other School
Enrollment
Northern and Central New Jersey 1989-1990 755,325 56,541 642,597 56,187 1999-2000 941,326 55,278 807,568 78,480 2010-2011 1,030,731 57,434 889,501 83,796
Note: Other schools include town and rural schools. Data comprises schools open 1989-2010, 1989-1999-2010, 1999-2010, and only 2010. We apply 2010 boundary codes to all years. Source: U.S. Department of Education, National Center for Education Statistics, Common Core of Data (CCD)
• White students make up half of students in suburban schools in the metropolitan area,
whereas they make up 5% students in urban schools. • Enrollment of black students has remained relatively stable in suburban schools, while
steadily declining compared to other groups in urban schools. • Both the Latino student population and Asian student population have seen a significant
increase in their share of total enrolled students in suburban schools. • The share of Asian students has nearly doubled in suburban schools from 5.6% in 1989-
1990 to 10.9% in 2010-2011. • The share of Latino students has increased from 11.3% to 23.9% in suburban schools in
that period, while also growing from a quarter of urban school enrollment to over two-fifths of urban school enrollment.
Table 2 – Race/Ethnicity Percentage in Urban and Suburban Schools in Metro Area
Urban Schools Suburban Schools White Black Asian Latino White Black Asian Latino
Northern and Central New Jersey
1989-1990 10.3% 63.1% 0.9% 25.7% 68.7% 14.3% 5.6% 11.3% 1999-2000 8.0% 59.7% 0.8% 31.3% 61.1% 14.6% 7.9% 16.1% 2010-2011 5.2% 52.2% 0.9% 41.5% 50.8% 13.7% 10.9% 23.9%
Note: Urban schools refer to those inside an urbanized area and a principal city. Suburban schools refer to those inside an urbanized area but outside a principal city. Data comprises schools open 1989-2010, 1989-1999-2010, 1999-2010, and only 2010. We apply 2010 boundary codes to all years. Some schools were missing data on urbanicity and therefore excluded from this analysis.
A Status Quo of Segregation: Northern and Central New Jersey Fact Sheet 10-11-13 Civil Rights Project/Proyecto Derechos Civiles
The Civil Rights Project/ Proyecto Derechos Civiles
3
Source: U.S. Department of Education, National Center for Education Statistics, Common Core of Data (CCD)
Concentration
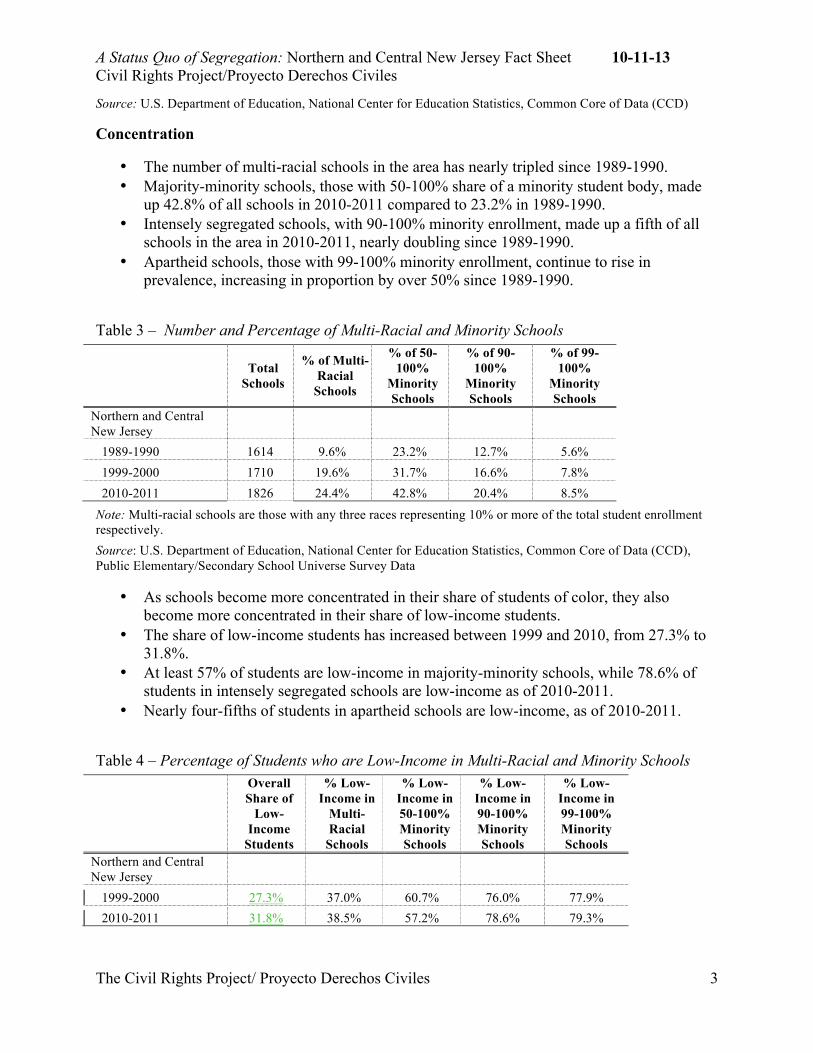
• The number of multi-racial schools in the area has nearly tripled since 1989-1990. • Majority-minority schools, those with 50-100% share of a minority student body, made
up 42.8% of all schools in 2010-2011 compared to 23.2% in 1989-1990. • Intensely segregated schools, with 90-100% minority enrollment, made up a fifth of all
schools in the area in 2010-2011, nearly doubling since 1989-1990. • Apartheid schools, those with 99-100% minority enrollment, continue to rise in
prevalence, increasing in proportion by over 50% since 1989-1990.
Table 3 – Number and Percentage of Multi-Racial and Minority Schools
Total Schools
% of Multi-Racial
Schools
% of 50-100%
Minority Schools
% of 90-100%
Minority Schools
% of 99-100%
Minority Schools
Northern and Central New Jersey
1989-1990 1614 9.6% 23.2% 12.7% 5.6% 1999-2000 1710 19.6% 31.7% 16.6% 7.8% 2010-2011 1826 24.4% 42.8% 20.4% 8.5%
Note: Multi-racial schools are those with any three races representing 10% or more of the total student enrollment respectively. Source: U.S. Department of Education, National Center for Education Statistics, Common Core of Data (CCD), Public Elementary/Secondary School Universe Survey Data
• As schools become more concentrated in their share of students of color, they also become more concentrated in their share of low-income students.
• The share of low-income students has increased between 1999 and 2010, from 27.3% to 31.8%.
• At least 57% of students are low-income in majority-minority schools, while 78.6% of students in intensely segregated schools are low-income as of 2010-2011.
• Nearly four-fifths of students in apartheid schools are low-income, as of 2010-2011.
Table 4 – Percentage of Students who are Low-Income in Multi-Racial and Minority Schools
Overall Share of
Low-Income
Students
% Low-Income in
Multi-Racial
Schools
% Low-Income in 50-100% Minority Schools
% Low-Income in 90-100% Minority Schools
% Low-Income in 99-100% Minority Schools
Northern and Central New Jersey
1999-2000 27.3% 37.0% 60.7% 76.0% 77.9% 2010-2011 31.8% 38.5% 57.2% 78.6% 79.3%
A Status Quo of Segregation: Northern and Central New Jersey Fact Sheet 10-11-13 Civil Rights Project/Proyecto Derechos Civiles
The Civil Rights Project/ Proyecto Derechos Civiles
4
Note: Multi-racial schools are those with any three races representing 10% or more of the total student enrollment respectively. Source: U.S. Department of Education, National Center for Education Statistics, Common Core of Data (CCD), Public Elementary/Secondary School Universe Survey Data
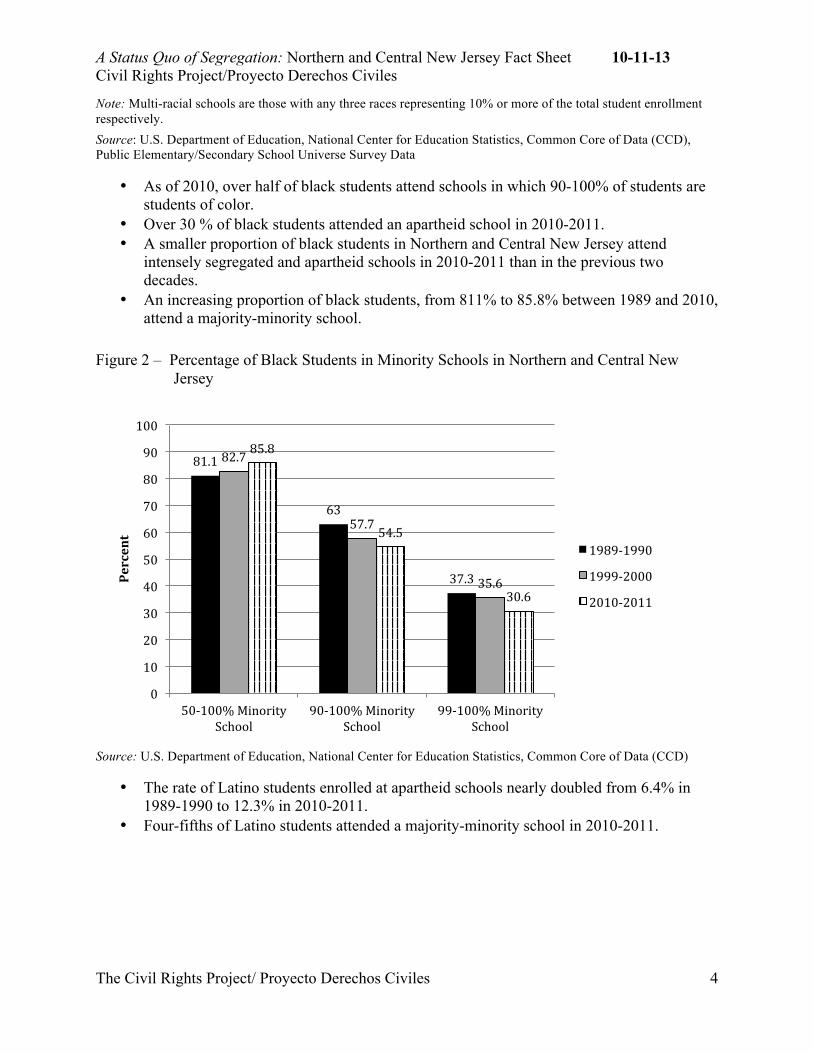
• As of 2010, over half of black students attend schools in which 90-100% of students are students of color.
• Over 30 % of black students attended an apartheid school in 2010-2011. • A smaller proportion of black students in Northern and Central New Jersey attend
intensely segregated and apartheid schools in 2010-2011 than in the previous two decades.
• An increasing proportion of black students, from 811% to 85.8% between 1989 and 2010, attend a majority-minority school.
Figure 2 – Percentage of Black Students in Minority Schools in Northern and Central New
Jersey
Source: U.S. Department of Education, National Center for Education Statistics, Common Core of Data (CCD)
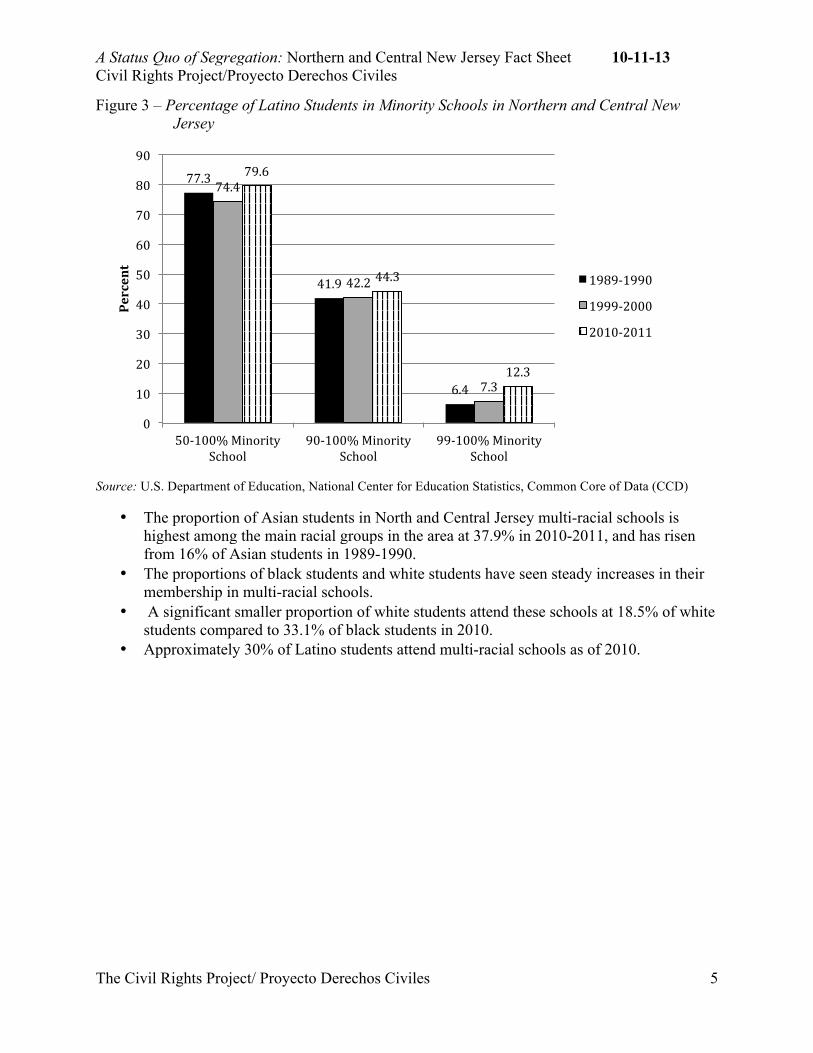
• The rate of Latino students enrolled at apartheid schools nearly doubled from 6.4% in 1989-1990 to 12.3% in 2010-2011.
• Four-fifths of Latino students attended a majority-minority school in 2010-2011.
81.1
63
37.3
82.7
57.7
35.6
85.8
54.5
30.6
0
10
20
30
40
50
60
70
80
90
100
50-‐100% Minority School
90-‐100% Minority School
99-‐100% Minority School
Percent
1989-‐1990
1999-‐2000
2010-‐2011
A Status Quo of Segregation: Northern and Central New Jersey Fact Sheet 10-11-13 Civil Rights Project/Proyecto Derechos Civiles
The Civil Rights Project/ Proyecto Derechos Civiles
5
Figure 3 – Percentage of Latino Students in Minority Schools in Northern and Central New Jersey
Source: U.S. Department of Education, National Center for Education Statistics, Common Core of Data (CCD)
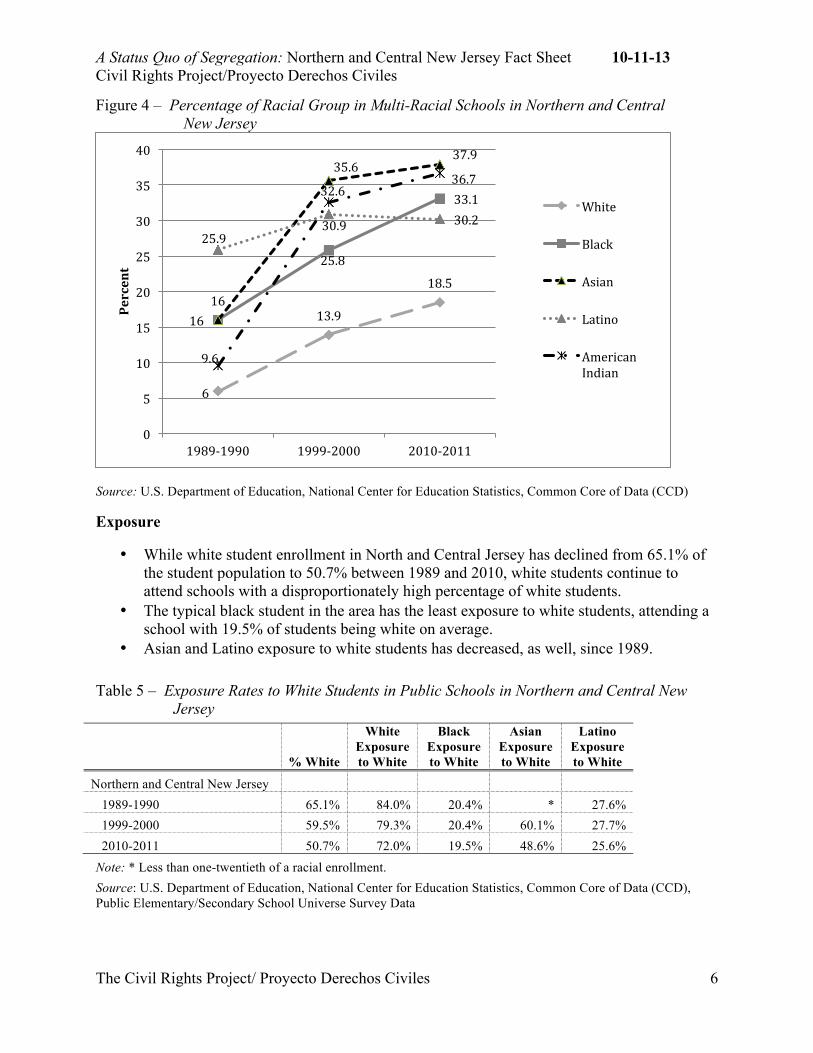
• The proportion of Asian students in North and Central Jersey multi-racial schools is highest among the main racial groups in the area at 37.9% in 2010-2011, and has risen from 16% of Asian students in 1989-1990.
• The proportions of black students and white students have seen steady increases in their membership in multi-racial schools.
• A significant smaller proportion of white students attend these schools at 18.5% of white students compared to 33.1% of black students in 2010.
• Approximately 30% of Latino students attend multi-racial schools as of 2010.
77.3
41.9
6.4
74.4
42.2
7.3
79.6
44.3
12.3
0
10
20
30
40
50
60
70
80
90
50-‐100% Minority School
90-‐100% Minority School
99-‐100% Minority School
Percent
1989-‐1990
1999-‐2000
2010-‐2011
A Status Quo of Segregation: Northern and Central New Jersey Fact Sheet 10-11-13 Civil Rights Project/Proyecto Derechos Civiles
The Civil Rights Project/ Proyecto Derechos Civiles
6
Figure 4 – Percentage of Racial Group in Multi-Racial Schools in Northern and Central New Jersey
Source: U.S. Department of Education, National Center for Education Statistics, Common Core of Data (CCD)
Exposure
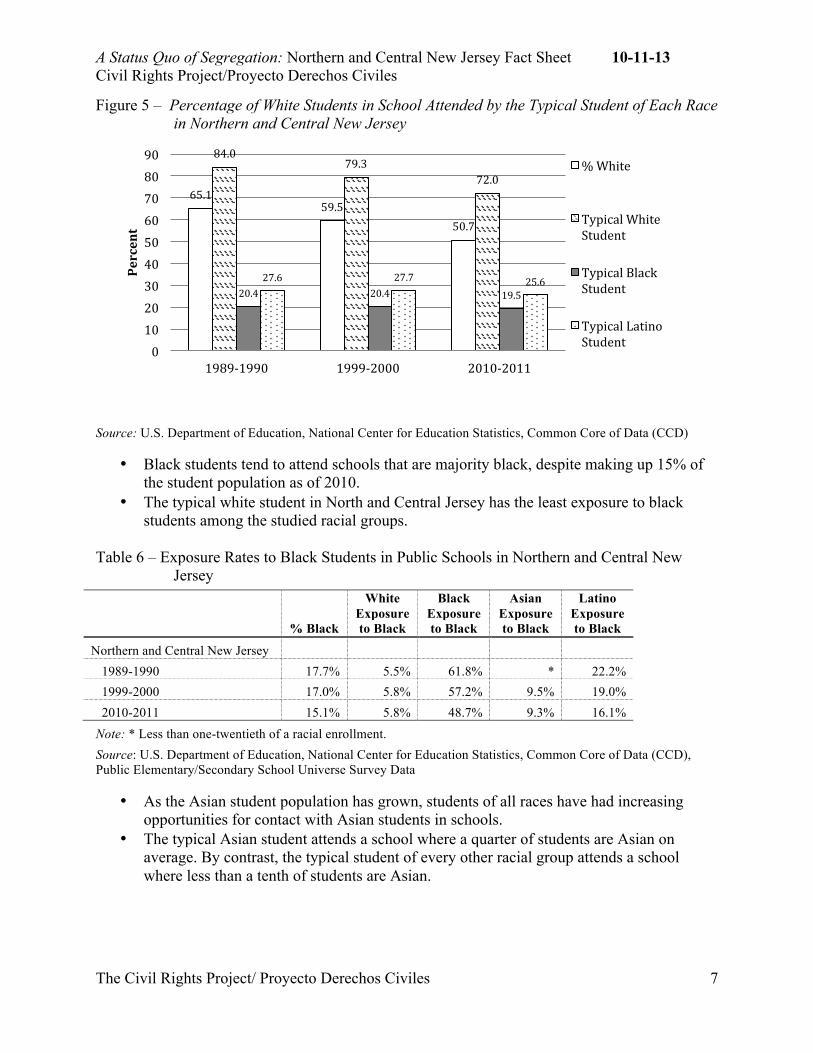
• While white student enrollment in North and Central Jersey has declined from 65.1% of the student population to 50.7% between 1989 and 2010, white students continue to attend schools with a disproportionately high percentage of white students.
• The typical black student in the area has the least exposure to white students, attending a school with 19.5% of students being white on average.
• Asian and Latino exposure to white students has decreased, as well, since 1989. Table 5 – Exposure Rates to White Students in Public Schools in Northern and Central New
Jersey
% White
White Exposure to White
Black Exposure to White
Asian Exposure to White
Latino Exposure to White
Northern and Central New Jersey 1989-1990 65.1% 84.0% 20.4% * 27.6% 1999-2000 59.5% 79.3% 20.4% 60.1% 27.7% 2010-2011 50.7% 72.0% 19.5% 48.6% 25.6%
Note: * Less than one-twentieth of a racial enrollment. Source: U.S. Department of Education, National Center for Education Statistics, Common Core of Data (CCD), Public Elementary/Secondary School Universe Survey Data
6
13.9
18.5 16
25.8
33.1
16
35.6 37.9
25.9 30.9 30.2
9.6
32.6 36.7
0
5
10
15
20
25
30
35
40
1989-‐1990 1999-‐2000 2010-‐2011
Percent
White
Black
Asian
Latino
American Indian
A Status Quo of Segregation: Northern and Central New Jersey Fact Sheet 10-11-13 Civil Rights Project/Proyecto Derechos Civiles
The Civil Rights Project/ Proyecto Derechos Civiles
7
Figure 5 – Percentage of White Students in School Attended by the Typical Student of Each Race in Northern and Central New Jersey
Source: U.S. Department of Education, National Center for Education Statistics, Common Core of Data (CCD)
• Black students tend to attend schools that are majority black, despite making up 15% of the student population as of 2010.
• The typical white student in North and Central Jersey has the least exposure to black students among the studied racial groups.
Table 6 – Exposure Rates to Black Students in Public Schools in Northern and Central New
Jersey
% Black
White Exposure to Black
Black Exposure to Black
Asian Exposure to Black
Latino Exposure to Black
Northern and Central New Jersey 1989-1990 17.7% 5.5% 61.8% * 22.2% 1999-2000 17.0% 5.8% 57.2% 9.5% 19.0% 2010-2011 15.1% 5.8% 48.7% 9.3% 16.1%
Note: * Less than one-twentieth of a racial enrollment. Source: U.S. Department of Education, National Center for Education Statistics, Common Core of Data (CCD), Public Elementary/Secondary School Universe Survey Data
• As the Asian student population has grown, students of all races have had increasing opportunities for contact with Asian students in schools.
• The typical Asian student attends a school where a quarter of students are Asian on average. By contrast, the typical student of every other racial group attends a school where less than a tenth of students are Asian.
65.1 59.5
50.7
84.0 79.3
72.0
20.4 20.4 19.5 27.6 27.7 25.6
0 10 20 30 40 50 60 70 80 90
1989-‐1990 1999-‐2000 2010-‐2011
Percent
% White
Typical White Student
Typical Black Student
Typical Latino Student
A Status Quo of Segregation: Northern and Central New Jersey Fact Sheet 10-11-13 Civil Rights Project/Proyecto Derechos Civiles
The Civil Rights Project/ Proyecto Derechos Civiles
8
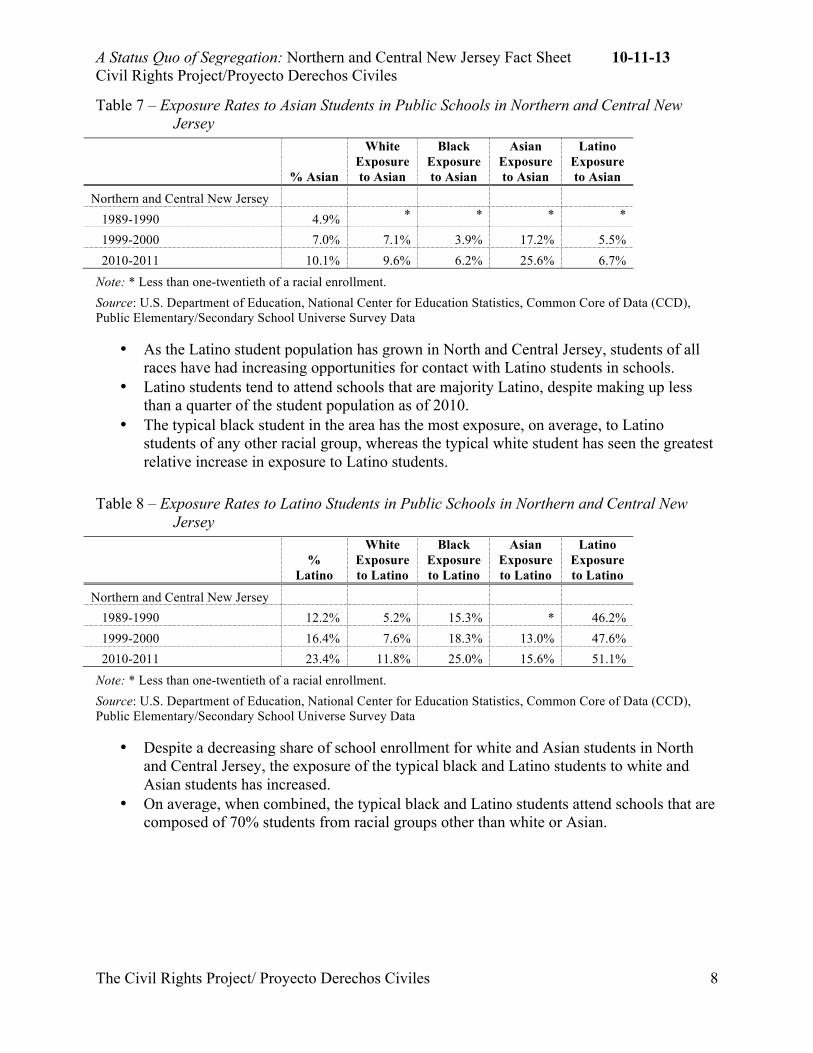
Table 7 – Exposure Rates to Asian Students in Public Schools in Northern and Central New Jersey
% Asian
White Exposure to Asian
Black Exposure to Asian
Asian Exposure to Asian
Latino Exposure to Asian
Northern and Central New Jersey 1989-1990 4.9% * * * *
1999-2000 7.0% 7.1% 3.9% 17.2% 5.5% 2010-2011 10.1% 9.6% 6.2% 25.6% 6.7%
Note: * Less than one-twentieth of a racial enrollment. Source: U.S. Department of Education, National Center for Education Statistics, Common Core of Data (CCD), Public Elementary/Secondary School Universe Survey Data
• As the Latino student population has grown in North and Central Jersey, students of all races have had increasing opportunities for contact with Latino students in schools.
• Latino students tend to attend schools that are majority Latino, despite making up less than a quarter of the student population as of 2010.
• The typical black student in the area has the most exposure, on average, to Latino students of any other racial group, whereas the typical white student has seen the greatest relative increase in exposure to Latino students.
Table 8 – Exposure Rates to Latino Students in Public Schools in Northern and Central New
Jersey
%
Latino
White Exposure to Latino
Black Exposure to Latino
Asian Exposure to Latino
Latino Exposure to Latino
Northern and Central New Jersey 1989-1990 12.2% 5.2% 15.3% * 46.2% 1999-2000 16.4% 7.6% 18.3% 13.0% 47.6% 2010-2011 23.4% 11.8% 25.0% 15.6% 51.1%
Note: * Less than one-twentieth of a racial enrollment. Source: U.S. Department of Education, National Center for Education Statistics, Common Core of Data (CCD), Public Elementary/Secondary School Universe Survey Data
• Despite a decreasing share of school enrollment for white and Asian students in North and Central Jersey, the exposure of the typical black and Latino students to white and Asian students has increased.
• On average, when combined, the typical black and Latino students attend schools that are composed of 70% students from racial groups other than white or Asian.
A Status Quo of Segregation: Northern and Central New Jersey Fact Sheet 10-11-13 Civil Rights Project/Proyecto Derechos Civiles
The Civil Rights Project/ Proyecto Derechos Civiles
9
Table 9 – Black and Latino Exposure Rates to White and Asian Students in Public Schools in Northern and Central New Jersey
White and Asian Share of School Enrollment
Black and Latino Exposure to White and Asian Students Difference
Northern and Central New Jersey
1989-1990 70.0% 26.4% -43.6% 1999-2000 66.4% 28.7% -37.7% 2010-2011 60.8% 29.7% -31.1%
Source: U.S. Department of Education, National Center for Education Statistics, Common Core of Data (CCD), Public Elementary/Secondary School Universe Survey Data
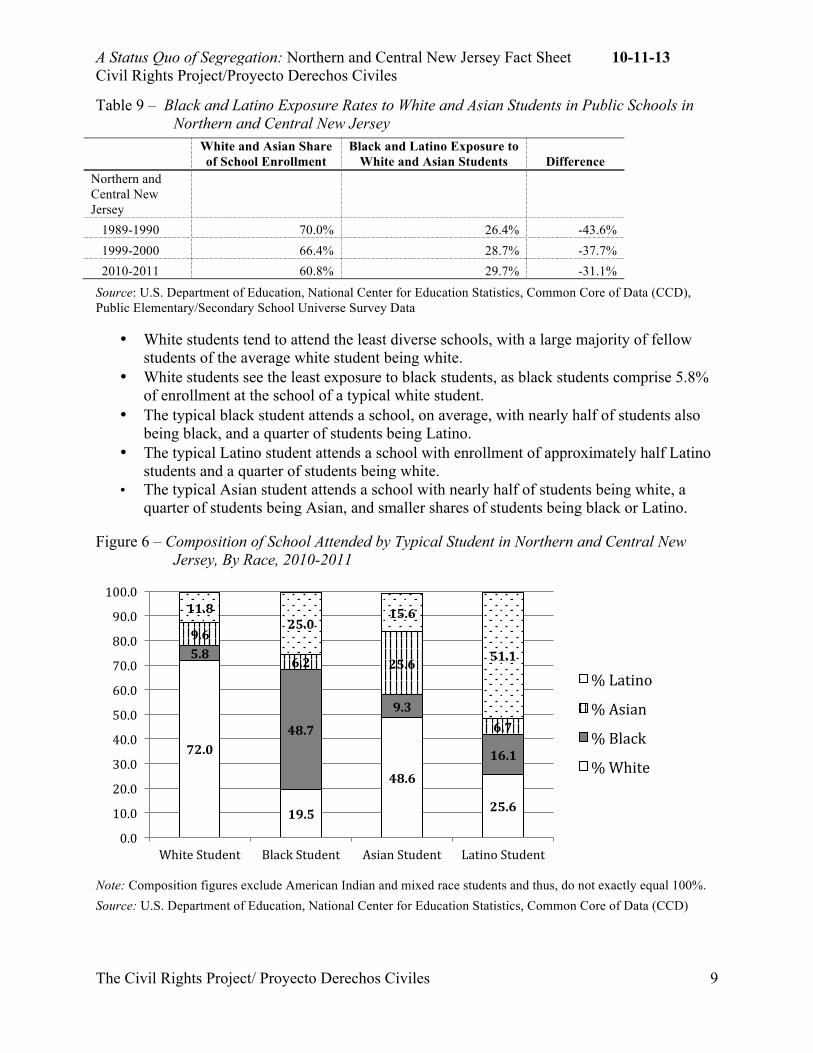
• White students tend to attend the least diverse schools, with a large majority of fellow students of the average white student being white.
• White students see the least exposure to black students, as black students comprise 5.8% of enrollment at the school of a typical white student.
• The typical black student attends a school, on average, with nearly half of students also being black, and a quarter of students being Latino.
• The typical Latino student attends a school with enrollment of approximately half Latino students and a quarter of students being white.
• The typical Asian student attends a school with nearly half of students being white, a quarter of students being Asian, and smaller shares of students being black or Latino.
Figure 6 – Composition of School Attended by Typical Student in Northern and Central New
Jersey, By Race, 2010-2011
Note: Composition figures exclude American Indian and mixed race students and thus, do not exactly equal 100%. Source: U.S. Department of Education, National Center for Education Statistics, Common Core of Data (CCD)
72.0
19.5
48.6
25.6
5.8
48.7
9.3
16.1
9.6
6.2 25.6
6.7
11.8 25.0
15.6
51.1
0.0
10.0
20.0
30.0
40.0
50.0
60.0
70.0
80.0
90.0
100.0
White Student Black Student Asian Student Latino Student
% Latino
% Asian
% Black
% White
A Status Quo of Segregation: Northern and Central New Jersey Fact Sheet 10-11-13 Civil Rights Project/Proyecto Derechos Civiles
The Civil Rights Project/ Proyecto Derechos Civiles
10
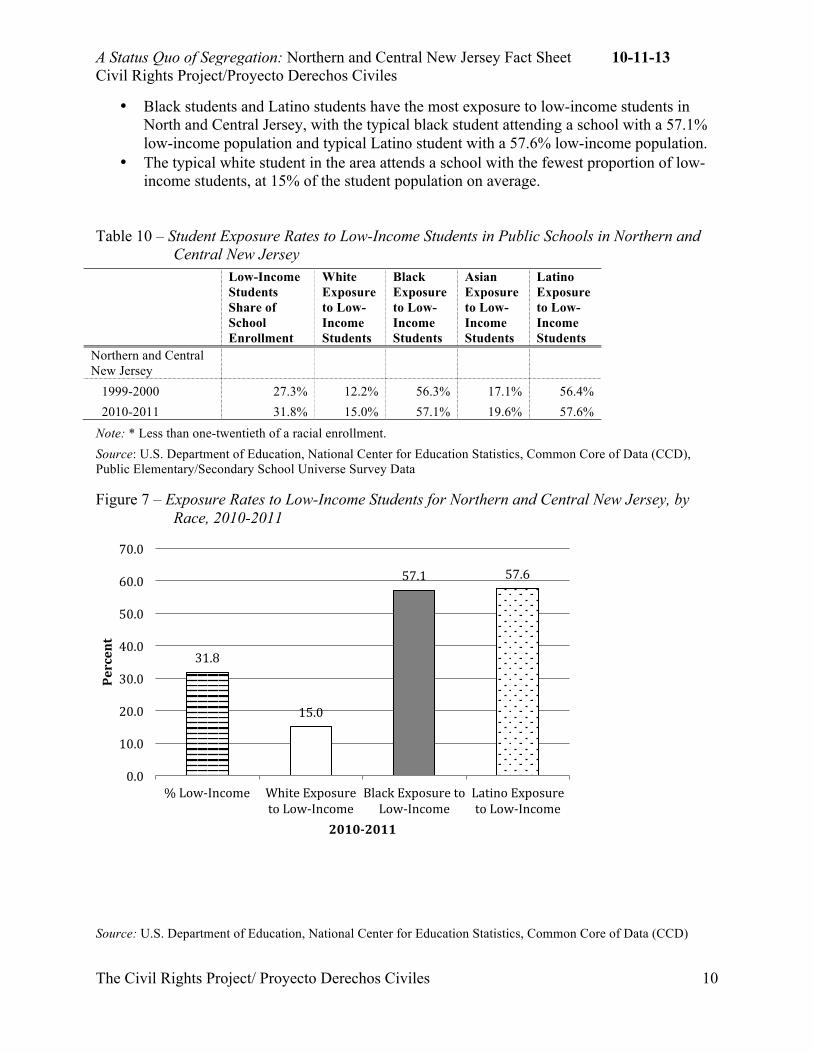
• Black students and Latino students have the most exposure to low-income students in North and Central Jersey, with the typical black student attending a school with a 57.1% low-income population and typical Latino student with a 57.6% low-income population.
• The typical white student in the area attends a school with the fewest proportion of low-income students, at 15% of the student population on average.
Table 10 – Student Exposure Rates to Low-Income Students in Public Schools in Northern and
Central New Jersey
Low-Income Students Share of School Enrollment
White Exposure to Low-Income Students
Black Exposure to Low-Income Students
Asian Exposure to Low-Income Students
Latino Exposure to Low-Income Students
Northern and Central New Jersey
1999-2000 27.3% 12.2% 56.3% 17.1% 56.4% 2010-2011 31.8% 15.0% 57.1% 19.6% 57.6%
Note: * Less than one-twentieth of a racial enrollment. Source: U.S. Department of Education, National Center for Education Statistics, Common Core of Data (CCD), Public Elementary/Secondary School Universe Survey Data
Figure 7 – Exposure Rates to Low-Income Students for Northern and Central New Jersey, by Race, 2010-2011
Source: U.S. Department of Education, National Center for Education Statistics, Common Core of Data (CCD)
31.8
15.0
57.1 57.6
0.0
10.0
20.0
30.0
40.0
50.0
60.0
70.0
% Low-‐Income White Exposure to Low-‐Income
Black Exposure to Low-‐Income
Latino Exposure to Low-‐Income
Percent
2010-‐2011
A Status Quo of Segregation: Northern and Central New Jersey Fact Sheet 10-11-13 Civil Rights Project/Proyecto Derechos Civiles
The Civil Rights Project/ Proyecto Derechos Civiles
11
Evenness
• A high degree of segregation exists in North and Central Jersey, as evidenced by the uneven distribution of students relative to the overall student population. Schools are 36% less diverse in the area compared to the overall population averages of the different racial groups.
• The large majority of this segregation takes place between school districts, rather than within. Nearly 92% of unevenness in the metropolitan area occurs between districts.
• The level of segregation, or unevenness, in the North and Central Jersey schools has declined since 1989.
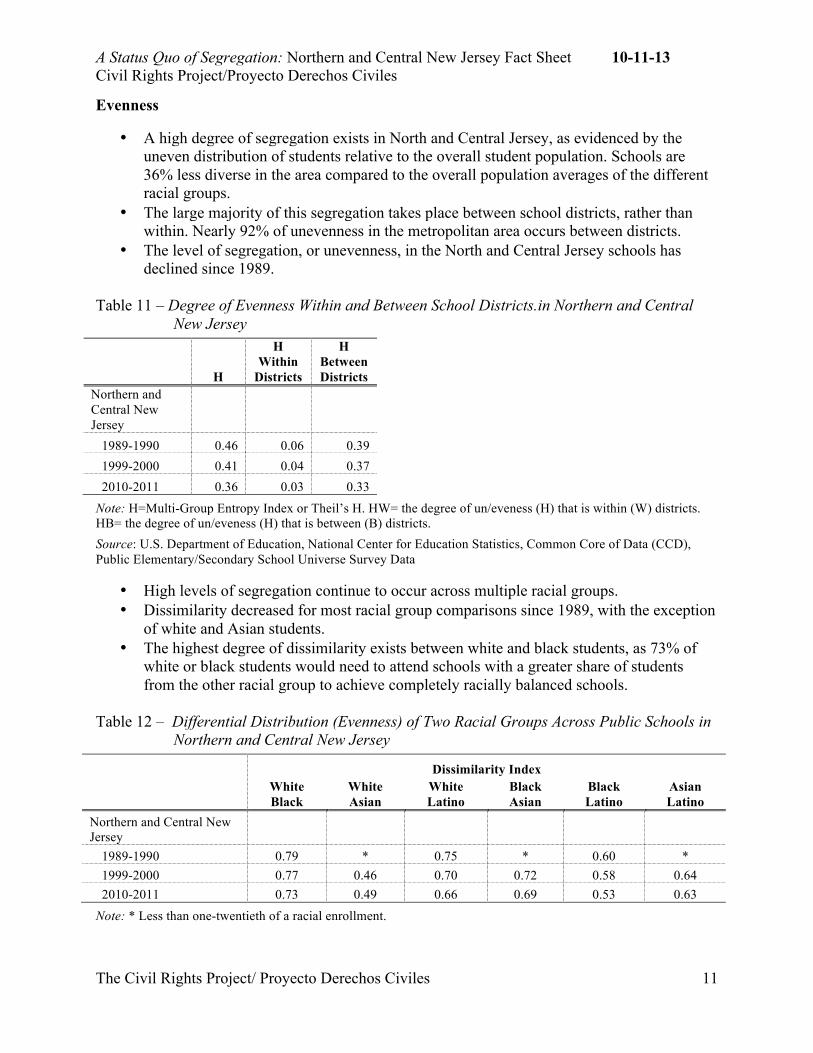
Table 11 – Degree of Evenness Within and Between School Districts.in Northern and Central
New Jersey
H
H Within
Districts
H Between Districts
Northern and Central New Jersey
1989-1990 0.46 0.06 0.39 1999-2000 0.41 0.04 0.37 2010-2011 0.36 0.03 0.33
Note: H=Multi-Group Entropy Index or Theil’s H. HW= the degree of un/eveness (H) that is within (W) districts. HB= the degree of un/eveness (H) that is between (B) districts. Source: U.S. Department of Education, National Center for Education Statistics, Common Core of Data (CCD), Public Elementary/Secondary School Universe Survey Data
• High levels of segregation continue to occur across multiple racial groups. • Dissimilarity decreased for most racial group comparisons since 1989, with the exception
of white and Asian students. • The highest degree of dissimilarity exists between white and black students, as 73% of
white or black students would need to attend schools with a greater share of students from the other racial group to achieve completely racially balanced schools.
Table 12 – Differential Distribution (Evenness) of Two Racial Groups Across Public Schools in
Northern and Central New Jersey
Dissimilarity Index White Black
White Asian
White Latino
Black Asian
Black Latino
Asian Latino
Northern and Central New Jersey
1989-1990 0.79 * 0.75 * 0.60 * 1999-2000 0.77 0.46 0.70 0.72 0.58 0.64 2010-2011 0.73 0.49 0.66 0.69 0.53 0.63
Note: * Less than one-twentieth of a racial enrollment.
A Status Quo of Segregation: Northern and Central New Jersey Fact Sheet 10-11-13 Civil Rights Project/Proyecto Derechos Civiles
The Civil Rights Project/ Proyecto Derechos Civiles
12
Source: U.S. Department of Education, National Center for Education Statistics, Common Core of Data (CCD), Public Elementary/Secondary School Universe Survey Data
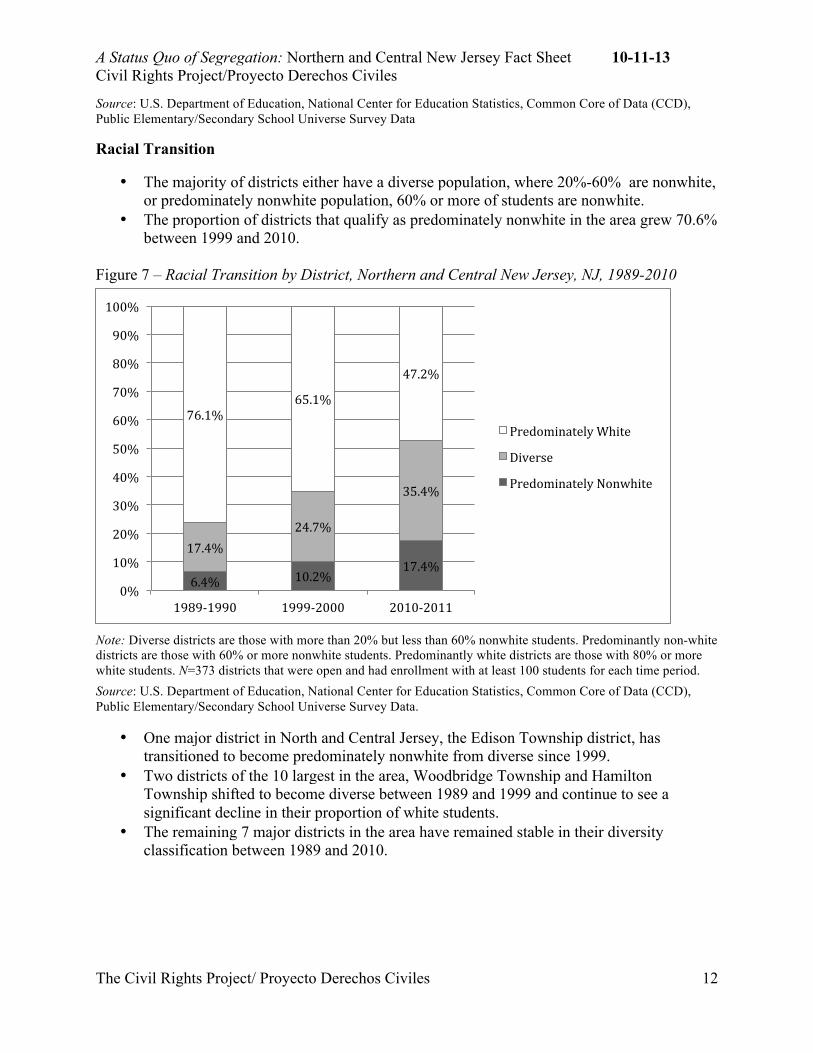
Racial Transition
• The majority of districts either have a diverse population, where 20%-60% are nonwhite, or predominately nonwhite population, 60% or more of students are nonwhite.
• The proportion of districts that qualify as predominately nonwhite in the area grew 70.6% between 1999 and 2010.
Figure 7 – Racial Transition by District, Northern and Central New Jersey, NJ, 1989-2010
Note: Diverse districts are those with more than 20% but less than 60% nonwhite students. Predominantly non-white districts are those with 60% or more nonwhite students. Predominantly white districts are those with 80% or more white students. N=373 districts that were open and had enrollment with at least 100 students for each time period. Source: U.S. Department of Education, National Center for Education Statistics, Common Core of Data (CCD), Public Elementary/Secondary School Universe Survey Data.
• One major district in North and Central Jersey, the Edison Township district, has transitioned to become predominately nonwhite from diverse since 1999.
• Two districts of the 10 largest in the area, Woodbridge Township and Hamilton Township shifted to become diverse between 1989 and 1999 and continue to see a significant decline in their proportion of white students.
• The remaining 7 major districts in the area have remained stable in their diversity classification between 1989 and 2010.
6.4% 10.2% 17.4%
17.4% 24.7%
35.4%
76.1% 65.1%
47.2%
0%
10%
20%
30%
40%
50%
60%
70%
80%
90%
100%
1989-‐1990 1999-‐2000 2010-‐2011
Predominately White
Diverse
Predominately Nonwhite
A Status Quo of Segregation: Northern and Central New Jersey Fact Sheet 10-11-13 Civil Rights Project/Proyecto Derechos Civiles
The Civil Rights Project/ Proyecto Derechos Civiles
13
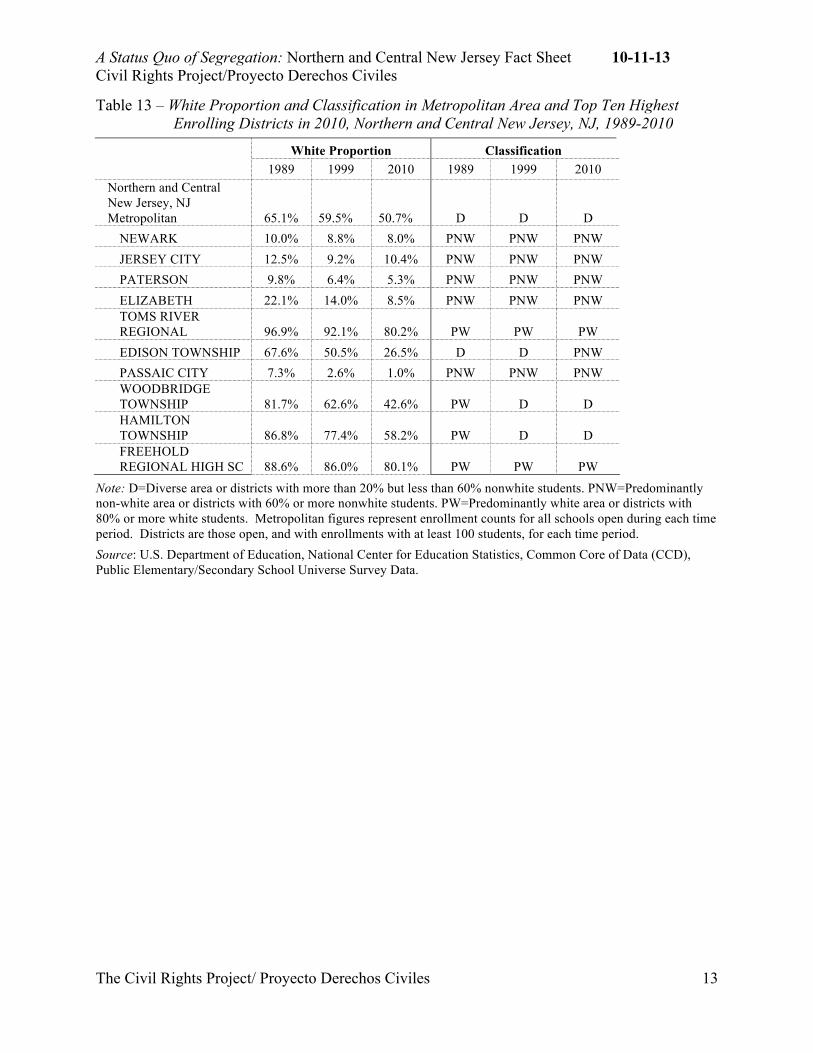
Table 13 – White Proportion and Classification in Metropolitan Area and Top Ten Highest Enrolling Districts in 2010, Northern and Central New Jersey, NJ, 1989-2010
White Proportion Classification
1989 1999 2010 1989 1999 2010 Northern and Central New Jersey, NJ Metropolitan 65.1% 59.5% 50.7% D D D
NEWARK 10.0% 8.8% 8.0% PNW PNW PNW JERSEY CITY 12.5% 9.2% 10.4% PNW PNW PNW PATERSON 9.8% 6.4% 5.3% PNW PNW PNW ELIZABETH 22.1% 14.0% 8.5% PNW PNW PNW TOMS RIVER REGIONAL 96.9% 92.1% 80.2% PW PW PW EDISON TOWNSHIP 67.6% 50.5% 26.5% D D PNW PASSAIC CITY 7.3% 2.6% 1.0% PNW PNW PNW WOODBRIDGE TOWNSHIP 81.7% 62.6% 42.6% PW D D HAMILTON TOWNSHIP 86.8% 77.4% 58.2% PW D D FREEHOLD REGIONAL HIGH SC 88.6% 86.0% 80.1% PW PW PW
Note: D=Diverse area or districts with more than 20% but less than 60% nonwhite students. PNW=Predominantly non-white area or districts with 60% or more nonwhite students. PW=Predominantly white area or districts with 80% or more white students. Metropolitan figures represent enrollment counts for all schools open during each time period. Districts are those open, and with enrollments with at least 100 students, for each time period. Source: U.S. Department of Education, National Center for Education Statistics, Common Core of Data (CCD), Public Elementary/Secondary School Universe Survey Data.