Embed Size (px)
Citation preview

NOAA Technical Memorandum NMFS-NE-188
U. S. DEPARTMENT OF COMMERCENational Oceanic and Atmospheric Administration
National Marine Fisheries ServiceNortheast Fisheries Science Center
Woods Hole, Massachusetts
April 2006
Northeast RegionCommercial FishingInput-Output Model

172. Variability of Temperature and Salinity in the Middle Atlantic Bight and Gulf of Maine Based on Data Collected asPart of the MARMAP Ships of Opportunity Program, 1978-2001. By Jack W. Jossi and Robert L. Benway. March 2003. vi + 92p., 74 figs., 5 tables. NTIS Access. No. PB2004-100835.
173. Essential Fish Habitat Source Document: Barndoor Skate, Dipturus laevis, Life History and Habitat Characteristics. ByDavid B. Packer, Christine A. Zetlin, and Joseph J. Vitaliano. March 2003. v + 23 p., 14 figs., 1 table. NTIS Access. No. PB2003-104257.
174. Essential Fish Habitat Source Document: Clearnose Skate, Raja eglanteria, Life History and Habitat Characteristics.By David B. Packer, Christine A. Zetlin, and Joseph J. Vitaliano. March 2003. v + 50 p., 25 figs., 2 tables. NTIS Access. No. PB2003-104260.
175. Essential Fish Habitat Source Document: Little Skate, Leucoraja erinacea, Life History and Habitat Characteristics. ByDavid B. Packer, Christine A. Zetlin, and Joseph J. Vitaliano. March 2003. v + 66 p., 27 figs., 2 tables. NTIS Access. No. PB2003-104259.
176. Essential Fish Habitat Source Document: Rosette Skate, Leucoraja garmani virginica, Life History and HabitatCharacteristics. By David B. Packer, Christine A. Zetlin, and Joseph J. Vitaliano. March 2003. v + 17 p., 11 figs., 1 table. NTIS Access.No. PB2003-104258.
177. Essential Fish Habitat Source Document: Smooth Skate, Malacoraja senta, Life History and Habitat Characteristics. ByDavid B. Packer, Christine A. Zetlin, and Joseph J. Vitaliano. March 2003. v + 26 p., 15 figs., 1 table. NTIS Access. No. PB2003-104256.
178. Essential Fish Habitat Source Document: Thorny Skate, Amblyraja radiata, Life History and Habitat Characteristics. ByDavid B. Packer, Christine A. Zetlin, and Joseph J. Vitaliano. March 2003. v + 39 p., 18 figs., 2 tables. NTIS Access. No. PB2003-104255.
179. Essential Fish Habitat Source Document: Winter Skate, Leucoraja ocellata, Life History and Habitat Characteristics.By David B. Packer, Christine A. Zetlin, and Joseph J. Vitaliano. March 2003. v + 57 p., 25 figs., 2 tables. NTIS Access. No. PB2003-104254.
180. Variability in Blood Chemistry of Yellowtail Flounder, Limanda ferruginea, with Regard to Sex, Season, and GeographicLocation. By Renee Mercaldo-Allen, Margaret A. Dawson, Catherine A. Kuropat, and Diane Kapareiko. September 2003. vi + 20 p., 1fig., 10 tables. NTIS Access. No. PB2004-107074.
181. Characterization of the Fishing Practices and Marine Benthic Ecosystems of the Northeast U.S. Shelf, and an Evaluationof the Potential Effects of Fishing on Essential Fish Habitat. By David Stevenson, Louis Chiarella, Dianne Stephan, Robert Reid, KurtWilhelm, John McCarthy, and Michael Pentony. January 2004. ix + 179 p., 34 figs., 83 tables. [Online publication only.]
182. U.S. Atlantic and Gulf of Mexico Marine Mammal Stock Assessments – 2003. By Gordon T. Waring, Richard M. Pace, JaneenM. Quintal, Carol P. Fairfield, and Katherine Maze-Foley, eds., Nicole Cabana, Phillip J. Clapham, Timothy V.N. Cole, Gregory L. Fulling,Lance P. Garrison, Aleta A. Hohn, Blair G. Maise, Wayne E. McFee, Keith D. Mullin, Debra L. Palka, Patricia E. Rosel, Marjorie C. Rossman,Frederick W. Wenzel, and Amy L. Whitingham, contribs. May 2004. vii + 287 p., 47 figs., 58 tables, 4 app., index. NTIS Access. No.PB2004-106431.
183. NOAA Fisheries Service's Large Marine Ecosystems Program: Status Report. By Kenneth Sherman, Peter Celone, and SallyAdams. July 2004. iv + 21 p., 11 figs., 4 tables. NTIS Access. No. PB2006-102420.
184. A Large Marine Ecosystem Approach to Fisheries Management and Sustainability. By Frank J. Gable. August 2004. v +84 p., 38 figs., 10 tables. NTIS Access. No. PB2005-101435. [Online publication only.]
185. Revised and Updated Edition of F. Bruce Sanford's 1957 "Planning Your Scientific Research Paper." By Jon A. Gibson.August 2004. x + 36 p., 5 figs., 12 tables.
186. Essential Fish Habitat Source Document: Silver Hake, Merluccius bilinearis, Life History and Habitat Characteristics.2nd ed. By Meredith C. Lock and David B. Packer. August 2004. v + 68 p., 28 figs., 6 tables. NTIS Access. No. PB2005-101436. [Onlinepublication only.]
187. Essential Fish Habitat Source Document: American Plaice, Hippoglossoides platessoides, Life History and HabitatCharacteristics. 2nd ed. By Donna L. Johnson. August 2004. vi + 72 p., 23 figs., 6 tables. [Online publication only.]
Recent Issues in This Series:

U. S. DEPARTMENT OF COMMERCECarlos M. Gutierrez, Secretary
National Oceanic and Atmospheric AdministrationVice Admiral Conrad C. Lautenbacher, Jr., USN (ret.), Administrator
National Marine Fisheries ServiceWilliam T. Hogarth, Assistant Administrator for Fisheries
Northeast Fisheries Science CenterWoods Hole, Massachusetts
April 2006
This series represents a secondary level of scientific publishing. All issues employthorough internal scientific review; some issues employ external scientific review.Reviews are -- by design -- transparent collegial reviews, not anonymous peerreviews. All issues may be cited in formal scientific communications.
NOAA Technical Memorandum NMFS-NE-188
Northeast Region Commercial FishingInput-Output Model
Scott R. Steinback1,2 and Eric M. Thunberg1,3
Postal Address: 1National Marine Fisheries Serv., 166 Water St., Woods Hole, MA 02543E-Mail Address: [email protected]; [email protected]

Notes on This Issue
Scientific Review and IQA Certification
This document has undergone scientific review and federal Information Quality Act certification throughthe Northeast Fisheries Science Center's "manuscript review system." The document was initiallysubmitted to the system on July 27, 2005, and ultimately cleared the system on September 30, 2005.
Editorial Production
This document has undergone light editing for format, but no editing for style.
Issue Number vs. Publication Date
This issue -- No. 188 -- would normally have a publication date of either August 2004 (when Issue No. 187 cameout) or September 2004 (when Issue No. 189 came out). However, due to the withdrawl of the report which had been targetedfor this slot in the series, this report was slipped into the slot, even though it has a April 2006 publication date.

iiiPage
Contents Summary........................................................................................................................................................................v 1. Introduction.........................................................................................................................................................1 2. Input-output modeling ........................................................................................................................................1 3. Components of the Northeast Region Input-Output Model (NERIOM).............................................................3 Fishing Regions in the Northeast U.S. ................................................................................................................3 IMPLAN Pro Adjustments .................................................................................................................................3 Product Flow Assumptions .................................................................................................................................4 4. Background Data ................................................................................................................................................4 Sales (Output) .....................................................................................................................................................4 Employment........................................................................................................................................................5 Cost-Earnings......................................................................................................................................................6 Inshore and Offshore Lobster...................................................................................................................6 Bottom Trawl ...........................................................................................................................................6 Scallop Dredge .........................................................................................................................................7 Surfclam, Ocean Quahog Dredge.............................................................................................................7 Sink Gillnet ..............................................................................................................................................7 Diving Gear..............................................................................................................................................7 Midwater Trawl........................................................................................................................................7 Fish Pots and Traps ..................................................................................................................................7 Bottom Longline ......................................................................................................................................7 Other Mobile Gear ...................................................................................................................................8 Other Fixed Gear......................................................................................................................................8 Hand Gear ................................................................................................................................................8 Small Dredge............................................................................................................................................8 Wholesale Seafood Dealers......................................................................................................................8 Fish Exchange/Auctions...........................................................................................................................8 Seafood Processors...................................................................................................................................8 Exports .....................................................................................................................................................8 5. Model Construction ............................................................................................................................................8 Model Construction Steps...................................................................................................................................9 IMPLAN Pro Table Adjustments .......................................................................................................................9 Industry/Commodity Codes .....................................................................................................................9 Type Codes ............................................................................................................................................10 US Absorption........................................................................................................................................10 US Absorption Totals.............................................................................................................................10 US Byproducts .......................................................................................................................................10 SACommodity Sales ..............................................................................................................................11 SAEmployment ......................................................................................................................................11 SAFinal Demands ..................................................................................................................................11 SAForeign Exports.................................................................................................................................11 SAOutput ...............................................................................................................................................12 SAValue Added .....................................................................................................................................12 Observed RPCs ......................................................................................................................................12 RPC Methods .........................................................................................................................................13 Deflator1 ................................................................................................................................................13 rptSAFinal Demands..............................................................................................................................13 rptSAIndustry Data ................................................................................................................................13 6. Impact Estimation .............................................................................................................................................13 Allocation of Indirect and Induced Impacts to Subregions...............................................................................14 Hypothetical Impact Assessment ......................................................................................................................15 7. Discussion.........................................................................................................................................................16 Endnotes ......................................................................................................................................................................18 References ................................................................................................................................................................18

Page iv
Figures
Figure 1. Fishing Regions in the Northeast U.S. ........................................................................................................21 Figure 2. NERIOM Product Flows.............................................................................................................................22
Tables Table 1. Fishing Regions in the Northeast U.S...........................................................................................................23 Table 2. Industry/Commodity Codes..........................................................................................................................24 Table 3. Cost-Earnings Data Sources ..........................................................................................................................30 Table 4. Commercial Fishing Production Functions ...............................................................................................31 Table 5. Seafood Wholesale and Fish Exchange/Auction House Production Functions ............................................33 Table 6. IMPLAN Pro Tables.....................................................................................................................................34 Table 7. Summary of IMPLAN Modification Procedure ...........................................................................................35 Table 8. Industry Sectors Purchasing from the Default Commercial Fishing Sector .................................................35 Table 9. Industry Sectors Purchasing from the Default Seafood Processing Sector...................................................36 Table 10. Total New England Coastal Region Sales Impacts.....................................................................................37 Table 11. Total Mid-Atlantic Coastal Region Sales Impacts......................................................................................38 Table 12. Total New England Coastal Region Income Impacts .................................................................................39 Table 13. Total Mid-Atlantic Coastal Region Income Impacts ..................................................................................40 Table 14. Total New England Coastal Region Employment Impacts.........................................................................41 Table 15. Total Mid-Atlantic Coastal Region Employment Impacts .........................................................................42
Appendices Appendix A. Bridge between Expenditures and IMPLAN Pro Sectors ......................................................................43
Acronyms NERIOM = Northeast Region Input-Output Model NEPA = National Environmental Policy Act SIA = Social Impact Assessment CGEM = Computable General Equilibrium Model NAICS = North American Industry Classification System NMFS = National Marine Fisheries Service VTR = NMFS’ Vessel Trip Reports URI = University of Rhode Island

vPage
Summary
This manuscript describes several years of work on improving input-output models for use in regulatory
analyses of fisheries management actions in the Northeast U.S. Its primary intent is to provide a description of the partial multiregional input-output modeling approach we developed and to inform peers in how to make the required adaptations to the widely distributed regional input-output modeling system known as IMPLAN Pro. A hypothetical impact assessment is also conducted to illustrate the types of impacts that can be generated with the model.


1Page
1. INTRODUCTION
The economic effects of fishery management policiesthat alter commercial harvesting levels in a regional economycan be far-reaching. As commercial harvest levels changeancillary industries that supply the commercial fishing in-dustry with inputs in turn adjust their production levelsand expenditure patterns, initiating further rounds of back-ward linked repercussions in the economy. Working up themarketing chain, industries such as wholesale seafood deal-ers and seafood processors may be required to adjust theirproduction levels when the availability of local seafoodchanges, thereby affecting input requirements from theirother suppliers, and triggering a whole series of additionalmultiplier effects as the economy adapts to the policy ac-tion.
The National Environmental Policy Act (NEPA), Execu-tive Order 12866, and National Standard 8 of the Sustain-able Fisheries Act require federal regulators to consider theimpacts on businesses that are directly and indirectly af-fected by proposed management actions. The scope of mosteconomic analyses of management actions in the North-east Region has been limited to analysis of impacts on di-rectly affected businesses and the preparation of benefit/cost analysis which have a national perspective. Whileassessments of distributional effects are generally includedin a Social Impact Assessment (SIA), the focus of an SIA ison the social implications of a management action on fish-ermen, fishing families, and social networks in a community.This means that much of the discussion of the implicationsof management actions on the larger fishing-related andregional economy is left for vetting in public hearings.
In an attempt to resolve this shortcoming, we have de-veloped a partial multiregional input-output model that iscapable of predicting the multiplier effects of proposed fish-ery management actions in the Northeast. The model isconstructed at the regional level, but it has been designedso that the multiplier effects, expressed in terms of sales bybusinesses, average annual employment (both full and part-time), and personal income (labor income) can be deter-mined for 24 specific sub-regions within the Northeast.While a full, disaggregated, multiregional model that explic-itly measures the economic connections between all busi-ness sectors in 24 different regions is beyond possibilitybecause of data availability, the approach developed herecan be described as a partial multiregional model because itexplicitly accounts for the interconnections between thefishing-related businesses (commercial harvesters, whole-sale seafood dealers, bait suppliers, and seafood proces-sors) in all 24 sub-regions in the Northeast. The intra andinter-regional seafood linkages are captured through theaddition of up to 21 new fishing-related industry sectors ineach of the coastal sub-regions. All of the remaining non-fishing business sectors in the model measure Northeastregion-level activity, but an allocation procedure is employedthat apportions the estimated region-wide effects for these
businesses to the appropriate sub-regions in the modelbased on the relative importance of a sub-region’s economyto the total Northeast region’s economy.
The model was constructed using a ready-made regionalinput-output system called IMPLAN Pro (MinnesotaIMPLAN Group, Inc.). The IMPLAN Pro system consistsof software and data that may be purchased from Minne-sota IMPLAN Group. The software provides the math-ematical algorithms to estimate I/O models and their result-ing multipliers, as well as providing a user interface thatmakes conducting impact assessments and organizing modeloutputs easier. Default data sets available for purchaseinclude county-level data for 509 economic sectors for ev-ery county in the U.S. Data sets for each coastal state fromMaine to North Carolina were acquired to construct the I/Omodel for the Northeast region.
The IMPLAN Pro system has considerable appeal dueto its extensive use in practical applications and its readilyavailable support literature. Further, since the conceptualbasis for input-output methodology is quite intuitive, theresults of impact assessments can be readily explained tofishery managers and the Public. This is important becauseit is our hope that the model’s multiplier effects will be usedby managers to compare and contrast the outcomes of pro-posed management strategies prior to deciding upon a pre-ferred alternative. The ability to determine how policy-in-duced changes in sales, income, and employment will bedistributed among businesses in 24 different sub-regionsin the Northeast should provide regional decision makerswith better information to make more informed policy deci-sions.
The primary purpose of this paper is to provide an over-view of the Northeast Region input-output model’s(NERIOM) operations and model outputs. This includes acomprehensive delineation of the adjustments that weremade to the default IMPLAN system, a description of theunderlying data, and the impact estimation approach wefollowed. A hypothetical impact assessment is also con-ducted to illustrate the types of impacts that can be gener-ated with the model. Finally, the advantages and limitationsof using the NERIOM approach for assessing the multipliereffects of fishery management actions are considered, alongwith a discussion of potential model improvements throughadditional research.
2. INPUT-OUTPUT MODELING
In addition to input-output analysis, there are a varietyof other methods available for analyzing the economic im-pacts of fishery management actions. These range fromsimplistic approaches such as economic-base models tosophisticated approaches such as computable general equi-librium models (CGEM) and models that link economic andecological or biological considerations. Although thesetypes of models produce total impact estimates that are

Page 2
similar to those generated from input-output models, theyeither lack the detail and complexity of those created withinput-output analysis (i.e., economic-base models) or aremore data intensive and generally necessitate even greatersectoral aggregation (i.e., CGEM and economic-ecologicalmodels).
In 1973, professor Wassily Leontief received the NobelPrize in Economic Science for developing the analyticalframework which came to be known as input-output analy-sis. Input-output analysis is generally described as a staticgeneral equilibrium approach to quantitative economicanalysis. The common fabric underlying all input-outputmodels is a comprehensive accounting system whichrecords the sales and purchases of goods and servicesamong industries (manufacturers), final consumers (house-holds, government, and exports), and resource owners (land,labor, and capital) in a regional economy during a specifiedtime period (usually one year). As such, input-output mod-els are generally employed to predict the backward linkedripple effects (i.e., multiplier effects) of changes in the eco-nomic activity of a particular industrial sector. For example,a decrease in the output of one industry decreases the de-mand for output in its supplying industries, and in indus-tries which support the suppliers, and so on. However,forward linked industries may also experience reductions inoutput through diminished supply of local production. Ifone is able to exogenously determine how these forwardlinked sectors might be impacted, the additional backwardlinked ripple effects associated with these changes couldalso be estimated with input-output analysis. This is dis-cussed further in Section 6 - Impact Estimation.
Mathematically, the Leontief input-output approachderives sectoral outputs from exogenously specified finaldemands as
(1)
where X is a n x 1 column vector denoting output; I is a n xn identity matrix; A is a n x n direct input coefficient matrix;and Y is a n x 1 column vector denoting exogenous finaldemand. The elements of A ( aij ) are called direct inputcoefficients and are denoted as
where zij is the level of sales from sector i to sector j; and Xjis the total output of sector j. The (I-A)-1 matrix is oftenreferred to as the Leontief inverse, comprised of the inter-dependence coefficients (�ij) alpha ij or what are commonlyreferred to as industry output multipliers. These multipliersindicate how much the output of each row sector wouldchange if the final demand for sector j’s output changed byone dollar. In a regional input-output model that treats
household income and spending as endogenous1, the col-umn sum of the industry specific output multipliers mea-sures the total direct, indirect, and induced backward linkedmultiplier effects from each sector of the economy requiredto satisfy a one dollar change in final demand for sector j’soutput. The direct industry multiplier measures the initialeffect of sector j’s one dollar final demand change on itself,which implies a multiplier value of 1. The total indirectmultiplier represents the additional region-wide outputchanges necessitated by the one dollar change in final de-mand, and the total induced multiplier measures theeconomy-wide output effects of changes in householdspending generated by the direct and indirect effects. Totaloutput multipliers are used to estimate the economy-widebackward linked output effect associated with exogenouslyspecified changes in final demand.2
The standard Leontief input-output approach must bemodified before it can be applied to fishery managementactions, however. From equation (1) it is clear that the modelis designed to ascertain the economy-wide effects ofchanges in the demand for a product at the final consump-tion level. However, fishery management policies act bycontrolling gross industry output at the point of produc-tion, rather than operating to control the sale of outputs infinal markets. For example, fisheries policies are generallyimplemented to control landings and thus directly affectthe production of seafood at the harvesting level. There-fore, the basic form of equation 1 must be modified to as-sess the effects of management policies that induce grosschanges in industry output.
To accommodate the problem of handling constraintson sectoral output within an input-output context, a proce-dure was developed that explicitly transforms the traditionalLeontief model into one that is capable of accepting grossoutput changes as entries as opposed to only final demandchanges (Johnson and Kulshreshtha 1982). This technique,now commonly referred to as a mixed exogenous/endog-enous variables model (Miller and Blair 1985, p. 325), wasused by Leung and Pooley (2002) in assessing the totaleconomic impacts of a reduction in output of the Hawaii-based longline fishery. Unfortunately, the number of sec-tors contained in mixed exogenous/endogenous variablesmodels is generally not sufficient to derive detailed esti-mates of indirect multiplier effects. In part, this is becauseall of the existing ready-made commercial regional input-output models, such as IMPLAN Pro, which provide con-siderable sectoral detail to trace backward linkages, arebased on traditional Leontief techniques and it is not pos-sible to incorporate the modified relationships embodied inthe mixed exogenous/endogenous variables approach intothese ready-made models (see Steinback 2004). As a con-sequence, mixed exogenous/endogenous variables modelsare usually derived from condensed versions of ready-mademodels and therefore offer rather limited evaluations of howtotal estimated impacts are dispersed throughout a particu-lar region.
azXij
ij
j�
X I A Y� � �( ) * �1

3Page
In an attempt to provide fishery policymakers with ahigher level of sectoral detail than that contained in a mixedexogenous/endogenous variables model, another modifi-cation technique which provides the same aggregate solu-tion as the mixed exogenous/endogenous variables modelwas adopted for this study. The procedure, first introducedby Tanjuakio, Hastings, and Tytus (1996), can accept grossoutput changes as entries within a traditional Leontief modelby setting the directly impacted sectors’ regional purchasecoefficients (RPCs) to zero and then by modeling thechanges “as if” they originated from final demand.3 In con-trast to the mixed exogenous/endogenous variables model,Tanjuakio, Hastings, and Tytus’ (1996) approach is basedon the traditional Leontief relationships shown in equation(1) so it can be incorporated into ready-made input-outputmodels such as IMPLAN Pro. This is important becauseready-made models reduce the cost and complexity of modelformulation and the time required to generate impact esti-mates.4
The ready-made IMPLAN Pro system that was used inthis study provides a user-friendly media for customizinginput-output models to a specific application, and offersthe capability to create custom sectors such as commercialfishing that are not well configured in the default IMPLANPro data base. In fact, constructing an IMPLAN Pro modelcapable of calculating the multiplier effects of proposedfishery management actions on businesses in 24 differentsub-regions in the Northeast required creating many addi-tional fishing-related sectors. These adjustments are ex-plained in detail in the next section.
3. COMPONENTS OF THENORTHEAST REGION
INPUT-OUTPUT MODEL (NERIOM)
FISHING REGIONS IN THE NORTHEAST U.S.
A distinguishing feature of the NERIOM is its ability toassess the impacts of management alternatives on the en-tire Northeast Region’s economy and on the economies of24 specific sub-regions. The 24 sub-regions represent semiself-sufficient fishing areas that have similar economic net-works and fishing-related attributes. The sub-regional des-ignations were based on several criteria. First, data on fish-ing and non-fishing industrial sectors were generally onlyavailable at a county-level. Therefore, the sub-regional im-pact area designations represent either individual countiesor groups of counties within each of the 11 Northeast Re-gion States. Data obtained from federal Northeast vesseltrip reports, Northeast dealer weigh-out slips, Northeastpermit applications, and County Business Patterns wereused to classify sub-regions that have similar economicnetworks and fishing-related attributes. These data pro-vide an indication of regional distribution channels of sea-food as it flows from harvesters through dealers and finally
on to processors in the Northeast. The sub-regional desig-nations consist mainly of a coastal county or groups ofcoastal counties, for these are the counties where the ma-jority of the impacts accrue and where the employees andowners of fishing businesses, seafood dealers, and proces-sors reside. However, if it were determined that fish areregularly being sold to dealers and processors in adjacentnon-coastal counties, the sub-regional designations wereexpanded to account for these transactions. There are 23coastal and one non-coastal sub-region contained in theNERIOM (see Figure 1 and Table 1).
IMPLAN PRO ADJUSTMENTS
The IMPLAN Pro sector classification system is basedon the U.S. Census Bureau’s North American Industry Clas-sification System (NAICS) and contains county-level esti-mates of business activity for up to 509 industry sectors.Included in the coding system are four industry sectorsthat either directly produce seafood or are directly involvedin the seafood marketing chain. These sectors are: animalproduction including aquaculture (sector 13), fishing (sec-tor 16), seafood product preparation and packaging (sector71), and wholesale trade (sector 390). These four sectors,however, are constructed from aggregate industrial sectorlevel data which do not distinguish businesses of differenttypes and sizes. For example, all commercial fishing har-vesters, regardless of gear type or size, are included in oneaggregate “catch-all” fishing sector (sector 16). This levelof aggregation is too gross for conducting impact assess-ments of fishery management actions on specific fisheriesor gear types. Furthermore, since businesses that producesimilar types of products or services are generally pooledinto a single IMPLAN Pro sector, the underlying data maynot accurately portray the establishments of interest. Forinstance, businesses engaged in the wholesale distributionof seafood comprise only a small portion of the wholesaleactivity included in the single default “wholesale trade sec-tor”. The production functions, tradeflows, and value-addedestimates associated with seafood wholesalers that dealwith a perishable product may be different from those ofwholesalers that distribute other durable or nondurablegoods. Therefore, the fishing-related sectoral designationsand underlying data must be refined before IMPLAN Procan be used to describe the economic activity associatedwith fishery management actions.
To the extent that the businesses most impacted byfishery management actions are commercial fishing, whole-sale distribution of seafood, and seafood processing, ourrefinements focused on improving on the aggregate infor-mation contained in IMPLAN Pro sectors 16 (fishing), 390,(wholesale trade), and 71 (seafood product preparation andpackaging). Since the National Marine Fisheries Service(NMFS) is not directly responsible for managing the activi-ties associated with aquaculture establishments no adjust-ments were made to sector 13 (animal production).

Page 4
We began by deleting IMPLAN Pro’s single commer-cial fishing sector and adding new harvesting sectors basedon gear type and vessel size class. Consideration was givento classifying sectors according to primary species landed,but since management regulations often target specific gearsectors or vessels of a given size class it was necessary toincorporate these characteristics into the NERIOM. Fur-ther, the number of modifications necessary to construct aspecies-specific model would have been much larger thanwas necessary to develop gear-based sectors. Commercialfishing businesses were grouped into 18 distinct gear sec-tors in 22 of the 23 coastal county sub-regions. No harvest-ing sectors were added for the North Carolina north sub-region or for inshore and offshore lobster vessels in theNorth Carolina central sub-region. An IMPLAN Pro modelis limited to 1,000 industry sectors and this constraint wouldhave been exceeded after adding all of the new harvestingsectors and the remaining fisheries-related sectors to bediscussed below. Therefore, since there were no recordinglandings in the North Carolina north sub-region in 2001 (thebase year of the NERIOM) nor for the North Carolina cen-tral inshore and offshore lobster harvesting sectors in 2001,these industries were excluded from the model. A total of394 new harvesting sectors were added to the NERIOM.Table 2 delineates all of the new sectors that were added tothe default IMPLAN Pro model. The data used in the con-struction of the fisheries-related sectors are discussed inthe next section. Additional modifications included sepa-rating the wholesale seafood dealer component from thedefault wholesale trade sector and adding 23 new whole-sale seafood dealer sectors (one for each coastal sub-re-gion). Since seafood also passes through fish exchanges/auctions in four sub-regions in New England a fish exchangesector was created in each of these sub-regions (LowerMid-Coast Maine, Massachusetts North Shore, Massachu-setts Boston Area, and Massachusetts New BedfordCoast).5 Purchases of bait by longline, hand gear, and lob-ster vessels were accounted for by assigning the purchasesdirectly to 23 new midwater trawl bait supplying sectorsand 23 medium bottom trawl bait supplying sectors (one ineach coastal sub-region). In the Northeast, midwater andbottom trawls land the majority of the species used as baitby the longline, handgear, and lobster sectors. Lastly, weremoved the default seafood processing sector (sector 71)and added a sub-regional processing sector in each of the23 coastal sub-regions.
PRODUCT FLOW ASSUMPTIONS
The distribution patterns of seafood among harvest-ers, wholesalers, processors, and final demand establish-ments in the Northeast U.S. are complex. Product flow pat-terns are influenced by product type, market demand (bothdomestic and foreign), location of buyers and sellers, sales
agreements/contracts between buyers and sellers, manage-ment regulations, and a host of other immeasurable factorsthat present challenges to modeling. In a regional input-output model each successive level of sale among seafoodindustry establishments adds value to the product, therebygenerating additional economic impacts. Thus, it is impor-tant to account for the origin and destination of purchasesand sales that will be impacted (either directly or indirectly)by management regulations.
Unfortunately, limited available data on this complicatedproduct flow within the Northeast region called for somesimplifying assumptions. In the NERIOM, harvesters areassumed to sell all of their output to wholesale dealers viadirect sales or through fish exchanges/auctions (see Figure2). Since federally permitted harvesters are required to sellto establishments that hold a valid federal dealer permit,this assumption is reasonable. For state water fisheries orwhere some vessels may engage in direct sales to final con-sumers this assumption is tenable. Wholesale dealers, inturn, are then assumed to sell their output to final consum-ers, intermediate demand industries (including seafood pro-cessors) and to businesses located outside of the North-east region. However, due to the number of available sea-food substitutes at the retail level, the impacts of most fish-ery management actions on final consumers and intermedi-ate demand industries other than seafood processors arelikely to be negligible. Therefore, impacts that may accruebeyond the processor level are not incorporated in theNERIOM (see Section 7 for more detail).
4. BACKGROUND DATA
SALES (OUTPUT)
Estimates of sales by the harvesting sectors (i.e., ex-vessel revenues) were derived from 2001 Northeast dealerweigh-out slips for each sub-region. In cases where thevalue of landings for a given state was not assigned to acounty, sales were prorated to each sub-region within thestate based on calculated revenue shares by gear sectorand sub-region for data that was assignable.
Total wholesale seafood dealer sales in each sub-re-gion were derived from 2002 Economic Census data (U.S.Census Bureau 2004), 2001 County Business Patterns data(U.S. Census Bureau 2003) and the average 2001 FultonMarket margin. The Economic Census estimates of Na-tional wholesale seafood dealer sales and employment wereused to calculate a value for average sales per employee.This value was then multiplied by the County BusinessPatterns estimates of number of employees in each sub-region to obtain sales estimates for the sub-regions. Notethat in the NERIOM the wholesale seafood dealer sectorsare treated as margin sectors. That is, the value of salesexcludes the “cost of goods sold.” In so doing, the sales

5Page
estimate for a margin sector includes only the value addedto the product being sold (i.e., total value of sales less thecost of the purchased raw material). Therefore, the sub-regional sales estimates were multiplied by the averageFulton Market mark-up (i.e., margin) in 2001 (40%).
Fish exchange/auction houses are also required to holda valid federal dealer permit so it was possible to obtainsales estimates for seafood that passed through these es-tablishments from the 2001 Northeast dealer weigh-out data.Fish exchange/auction houses were also treated as marginsectors in the NERIOM, however, so the weigh-out datahad to be refined so that it represented only the value addedby the auction houses. Value added by auction houses isgenerally associated with a small per-pound commission tounload, sort, ice, and display the seafood. The fees coveremployee expenses and operating costs, which, in turn,generate additional economic impacts in the Northeast re-gion. Average handling fees vary slightly across speciesand auction houses, but were assumed to be 11 cents perpound (7 cents paid by the boat and 4 cents by the buyer(R. Ciulla, co-manager Gloucester Seafood Display Auction,personal communication). Given handling fees, the salesestimates (i.e., the value of production) for the 4 fish ex-change sectors were calculated by first dividing the aver-age handling fee by the average annual price per pound ofseafood sold at each exchange in 2001, and then multiply-ing the result by the total annual value of seafood sold ateach exchange.
IMPLAN Pro default values for sector 17 (seafood prod-uct preparation and packaging) in each of the 23 coastalsub-regions were used to determine the value of the pro-cessing sectors’ sales. These values were obtained by con-structing separate default IMPLAN Pro models for each ofthe 23 coastal sub-regions and then incorporating the re-sulting 23 processor sales values into the NERIOM.
EMPLOYMENT
Employment estimates for fishermen are typically notcompiled according to type of harvesting gear. In fact,because self-employed fishermen are generally not includedin U.S. labor statistics, there is often a great deal of uncer-tainty even in aggregate estimates of commercial fishingemployment. However, all federally permitted harvesters inthe Northeast are required to fill out vessel trip reports inwhich they indicate the type of gear employed and thenumber of crew (including captain) that participated on eachtrip. This data provided the basis for calculating the major-ity of the harvesting sector employment estimates in eachsub-region. Limited Northeast vessel trip reports were avail-able for the hand gear trips, dive gear trips, and ocean qua-hog dredge gear trips, so another method for estimatingemployment was employed for those gear sectors. Employ-ment calculations for both methods are shown below.
The steps used to calculate employment from vesseltrip reports (VTR) were as follows:
(1) Identify a gear sector for all VTR trips in each sub-region;
(2) Calculate the average number of crew by vessel for allvessels that participated in a gear sector in each sub-region;
(3) Sum total annual value of landings by vessel for allvessels that participated in a gear sector in each sub-region;
(4) Sum total annual value by gear sector and sub-region;(5) Sum average crew by gear sector and sub-region;(6) Calculate the value/labor ratio by dividing the result
of step 4 by the result of step 5; and(7) Divide the value/labor ratio from step 6 into the total
value of production (i.e., sales values discussedabove) by gear sector and sub-region to obtain em-ployment estimates.
Employment numbers for the hand gear sectors, divegear sectors, and ocean quahog dredge gear sectors wereestimated by dividing the sectoral production values (salesvalues) by IMPLAN Pro’s default value/labor ratios for sec-tor 16 (Fishing) in each sub-region. The value/labor ratioswere obtained by creating 23 default sub-regional IMPLANPro models.
Wholesale seafood dealer employment estimates wereobtained from 2001 County Business Patterns Data (NAICSsector 42246; U.S. Census Bureau 2003). Employment val-ues for counties with suppressed seafood dealer data wereestimated by multiplying the average state-level employ-ment per establishment by the total establishments con-tained in the county (County Business Patterns providesestimates of number of establishments even if employmentdata is suppressed).
Employment estimates for the four fish exchange/auc-tion sectors were obtained by making several simplifyingassumptions as follows:
(1) Average earnings per employee in each of the foursub-regions where the fish exchange/auction sectorsare located were assumed to be equal to the wholesaleseafood dealer average earnings values in those sub-regions.
(2) Calculate total employee earnings for each fish ex-change/auction sector by multiplying the sectoral pro-duction values by the percent of total value that isused to pay employee earnings (the derivation of theseemployee compensation percentages is described inthe next section).
(3) Divide total employee earnings for each fish exchange/auction sector by the average earnings per employeefrom step 1 to obtain employment estimates.

Page 6
COST-EARNINGS
The validity of impact estimates generated by input-output models depends to a large degree on the underlyingindustry cost data, and in identifying which combination ofIMPLAN Pro sectors is most likely to represent the distri-bution of these costs. In the development of the NERIOM,a significant effort was made to incorporate the best avail-able cost and earnings data for harvesters, wholesale deal-ers, fish exchanges/auctions, and seafood processors. Costand earnings data are the heart of an input-output modelbecause they are used to construct production functionsthat link the purchasing activities of a particular sector to allother sectors in the model. This section describes the ori-gin of these data and explains how the production func-tions were created.
We also extended considerable effort in developing abridge that was used to allocate each industry expenditureitem to its appropriate IMPLAN Pro sector or sectors. Thedescription of this bridge is quite lengthy, however, so itwas placed in Appendix A. Nonetheless, readers are en-couraged to review the bridging process shown in Appen-dix A because input-output model results are particularlysensitive to how industry expenditures are distributedamong sectors.
Cost and earnings estimates for harvesters were de-rived from Northeast Observer data, Northeast Dealer data,and surveys of specific gear sectors in the Northeast. Adetailed description of these data sources by gear type isprovided below and a summary is shown in Table 3.
Inshore and Offshore Lobster Trap
As part of a larger project to develop a simulation modelof the lobster fishery researchers at the University of RhodeIsland conducted a series of focus groups with lobster ves-sel owners (Anonymous, 1995). These focus groups wereconducted in selected ports throughout New England andwere conducted with both inshore and offshore participants.In addition to gathering data on trap management and no-table changes in the fishery, the researchers collected infor-mation on operating costs, fixed costs, and crew remunera-tion. Since these data were originally collected in 1993-1994the cost estimates were adjusted to 2001 dollars usingIMPLAN Pro price deflators.
Linear production functions for offshore lobster, North-ern inshore lobster (Maine and New Hampshire) and South-ern inshore lobster (Massachusetts southward) were thendeveloped by calculating the proportion of total costs (in-cluding payments to crew and profits) each expenditureitem represented (Table 4). Before these production func-tions could be incorporated into the NERIOM, however,several of the proportions (i.e., absorption coefficients) hadto be adjusted for wholesale and retail trade margins. Com-modities and services purchased directly from manufactur-
ers (i.e., mooring fees, repair and maintenance services, per-mit fees, etc.) have no transportation, wholesale, or retailmarkups so no adjustments were made to these absorptioncoefficients (Table 4). However, expenditures for commodi-ties obtained from wholesalers or retailers (i.e., groceries,fuel, trip supplies, etc.) must be subdivided into the portiongoing to the retailer, wholesaler, transportation industries,and the manufacturer. The IMPLAN Pro system providesmargin tables for each manufactured commodity that is pur-chased at the wholesale and retail level, to determine how adollars worth of consumer expenditures is distributed amongthe manufacturing, wholesale, transportation, and retail in-dustries that contribute to its production and distribution.These margin tables were used to distribute the absorptioncoefficients in Table 4 that pertained to commodities pur-chased from wholesalers or retailers, into the amount paidto the retailer, wholesaler, transportation industries, and themanufacturer. The adjusted values were then incorporatedinto the production functions shown in Table 4 and enteredinto the NERIOM. The adjusted production functions weretoo large to present in this document, but the marginedproportions used to adjust the absorption coefficientsshown in Table 4 are contained in Appendix A.
Bottom Trawl
Cost and earnings data for the small (< 50 feet), medium(50 to 70 feet), and large (> 70 feet) bottom trawl vesselswere obtained from three sources. Average variable costestimates (e.g., ice, fuel, oil, water, food, bait, and supplies)were obtained through the Northeast Fisheries ScienceCenter’s sea sampling program. These data are collectedfor all commercial fishing trips that carry onboard observ-ers and represent the best available trip-level data for manyfisheries. Northeast observer data from 2003 were used toestimate average trip-level expenditures because the cover-age in 2003 was considerably higher than in 2001. IMPLANPro’s deflators, which are derived from the Bureau of LaborStatistics Growth Model, were used to adjust these averagevalues to their 2001 equivalent.
All fixed cost expenditures were derived from studiesconducted by researchers at the University of Rhode Is-land (URI). The data for the studies were collected frommail surveys of Northeast fishing vessels whose primarygear was an otter trawl. Results of the studies were pub-lished in two reports: one for small trawlers (Lallemand et al.1998) and one for large trawlers (Lallemand et al. 1999). Smalltrawlers were defined as vessels of 65 feet or less and largetrawlers consisted of all vessels greater than 65 feet. Theselength categories are different than those contained in theNERIOM, however, so we obtained access to the raw sur-vey data and recalculated average fixed cost estimates forthe three categories of vessels contained in our model (i.e.,small, medium, and large trawlers). All data were then ad-justed to their 2001 equivalent using IMPLAN Pro inflators.

7Page
Average gross stock estimates were derived from 2001Northeast dealer data and pertained only to those vesselsthat were surveyed in the URI reports. In combination withaverage crew and vessel remuneration percentages ob-tained from the raw URI survey data, the gross stock esti-mates were used to calculate the value of crew payments(employee compensation) and boat profits (proprietary in-come). Linear production functions for the three categoriesof bottom trawl vessels could then be developed by calcu-lating the proportion of total costs (including payments tocrew and profits) each expenditure item represented (Table4). Appendix A contains the adjustments made for com-modities purchased at the wholesale or retail level.
Scallop Dredge
The cost and earnings data for scallop dredge vesselswere obtained from a study conducted by researchers atthe University of Massachusetts Dartmouth (seeGeorgianna, Cass, and Amaral 1999). The study designinvolved a mail survey to all vessels that held a federal seascallop permit in the Northeast in 1997. The researcherscategorized the data by small (< 50 feet), medium (50 to 70feet), and large (> 70 feet) vessels, so the average variableand fixed cost estimates published in the report were di-rectly applicable to the vessel size classifications used forscallop vessels in the NERIOM. Average earnings esti-mates for crewmen, captains, and vessel owners were alsodetermined from the survey data for each of the vessel sizecategories. After all of the average expenditures were ob-tained (including payments to crew and profits) linear pro-duction functions were created to be incorporated into theNERIOM (Table 4). Appendix A contains the adjustmentsmade for commodities purchased at the wholesale or retaillevel.
Surfclam, Ocean Quahog Dredge
Cost and earnings data for this gear sector were un-available so the production function created for the me-dium scallop dredge sector was used a placeholder untilestimates for clam dredge vessels are obtained.
Sink Gillnet
Variable costs for sink gillnet vessels were derived from2003 Northeast observer data and adjusted to their 2001equivalent using IMPLAN Pro deflators. The availabilityof fixed costs and earnings data for these vessels was quitelimited, however, so values that pertained to bottom longlinevessels (described below) were used as placeholders untilthese data are collected. Fishing costs for bottom longlinevessels are likely to be similar to vessels fishing with sink
gillnets because they generally operate in the same manner.Nonetheless, the production function created for sink gillnetvessels was derived from a combination of observer dataand bottom longline proxy data (see Table 4). Appendix Acontains the adjustments made for commodities purchasedat the wholesale or retail level.
Diving Gear
The southern inshore lobster production function wasused as a proxy to describe the purchasing activities of thediving gear sectors until cost and earnings estimates forvessels fishing with this gear are obtained. Note that pur-chases unique to the lobster fishery such as bait and trapswere excluded from the dive gear production function. Ex-penditures for these items were reallocated to the remainingcost categories according to the relative shares containedin the production function.
Midwater Trawl
Northeast observer coverage for this fishery is quitelimited and information on fixed costs and earnings couldnot be found for vessels that fish with midwater trawls.Therefore, the production function created for the mediumbottom trawl fishery was used as a placeholder until thesedata become available.
Fish Pots and Traps
The operating characteristics of inshore lobster fishingare very similar to fishing with fish pots and traps. Sincespecific cost and earnings data for this gear sector couldnot be located, the production function created for south-ern inshore lobster fishing was used to represent the pur-chasing activities associated with the fish pots and trapssectors in the NERIOM.
Bottom Longline
Average variable cost estimates were generated withdata obtained from the Northeast observer program in 2003.IMPLAN Pro deflators were used to estimate 2001 equiva-lent values. Data collected by researchers at the Universityof Massachusetts Dartmouth, for a study of longline ves-sel owners in the Northeast in 1997, were used to calculateaverage fixed costs and value-added estimates (seeGeorgianna and Cass 1998). After these estimates wereadjusted to 2001 values, they were combined with the North-east observer variable cost data and linear production func-tions were created by calculating the proportion of totalcosts attributable to each expenditure item (Table 4). Ap-

Page 8
pendix A contains the adjustments made for commoditiespurchased at the wholesale or retail level.
Other Mobile Gear
This gear sector includes all mobile gear except trawlsand dredges. Vessels fishing with purse seines, scottishseines, danish seines, stop seines, bag nets, lift nets, shrimpbeam trawls, stop nets, runaround gillnets, and trammel netswere classified as other mobile gear in the NERIOM. Theproduction function created for medium bottom trawls wasused to represent the purchasing activities of these othermobile gear sectors.
Other Fixed Gear
Landings from fixed gears such as pound nets, weirs,harpoons, fyke nets, pelagic longlines, box traps, and drift/anchor gillnets were combined into an other fixed gear sec-tor. The sink gillnet production function was used to char-acterize industry purchases for these gear types.
Hand Gear
Cost and earnings data for vessels fishing with handgear were estimated from surveys of jig and pole vesselowners that fished for groundfish in New England in 1997(see Georgianna, Cass, and Brough 1998). IMPLAN Pro’sinflators were used to adjust mean expenditure values totheir 2001 equivalent. The predominant gear in this sectoris hand lines, but also includes dip nets, cast nets, tongsand grabs, oyster rakes, picks, shovels, forks, hoes, andcommon and long seines. Linear production functions werealso generated for these gears by calculating the propor-tion of total costs each expenditure item represented (Table4). Appendix A contains the adjustments made for com-modities purchased at the wholesale or retail level.
Small Dredge
This sector is comprised of oyster, clam, crab, conch,mussel, and urchin dredge gear. The production functioncreated for small scallop dredges was used to represent thepurchasing activities of these dredge sectors.
Wholesale Seafood Dealers
A production function developed for wholesale sea-food dealers in the Mid-Atlantic region by Kirkley, Ryan,and Duberg (2004) was used to characterize the purchasing
behavior of the 23 wholesale seafood sectors in the NERIOM(Table 5). As previously mentioned, the wholesale seafooddealer sectors are treated as margin sectors so the produc-tion function does not include the cost of purchasing sea-food from the commercial fishing sectors. Appendix A con-tains the adjustments made to the production function forcommodities purchased at the wholesale or retail level.
Fish Exchange/Auctions
Expenditures by the 4 fish exchange/auction sectorscontained in the NERIOM were modeled with a productionfunction developed by Kirkley, Ryan, and Duberg (2004) forFulton Fish Market in New York (Table 5). The data utilizedin their report were obtained from TechLaw, Inc. (2001) andrepresent the operating costs associated with the provi-sion of services offered by the Fulton Market. These ser-vices are similar to those offered by the fish exchange/auc-tion houses in the NERIOM. See Appendix A for the adjust-ments made to the production function for commoditiespurchased at the wholesale or retail level.
Seafood Processors
The default IMPLAN Pro production functions for Sec-tor 71 Seafood Product Preparation and Packaging, in the23 coastal sub-regions, were used to allocate purchases totheir appropriate IMPLAN Pro sectors in the NERIOM. Thedefault sub-regional production functions were too large toinclude in this document.
Exports
Foreign trade data by species and product type wereobtained from the Fisheries Statistics and Economics Divi-sion of the National Marine Fisheries Service (NMFS). Thesedata provide information on trade (value and pounds)through specific U.S. customs districts such as New En-gland and the Mid-Atlantic regions. The procedures usedto incorporate these trade data into the NERIOM are delin-eated in the next section.
5. MODEL CONSTRUCTION
An IMPLAN Pro model consists of more than 60 under-lying Microsoft Access tables (Table 6). These tables canbe grouped into four general categories. The tables in thefirst category contain unique code numbers for industries,commodities, margins, value-added sectors, household ex-penditure groups, institutions, transfer payments, and trade.Tables in the second category contain raw input data used

9Page
in the impact assessment portion of the program. Defaultmodel building information about the study area and modelspecs are contained in the third category of tables; and theremaining tables contain report data that are created duringthe model construction stage, the impact analysis stage,and for viewing final impact runs. In constructing theNERIOM, changes were made to the majority of the Accesstables in the first and second categories and a few of theAccess tables in the fourth category (modified Accesstables are indicated with an * in Table 6).
The modification procedure generally consisted of ex-porting the data contained in the relevant Microsoft Ac-cess tables to Microsoft Excel, adding new data, and thenimporting the modified tables back into Microsoft Access.A brief summary of the modification procedure is shown inTable 7, and the detailed steps involved in building theNortheast Region input-output model are presented below.This section also includes a description of the adjustmentsmade to each of the individual Microsoft Access tables.
MODEL CONSTRUCTION STEPS
Step 1 -- A default Northeast Region input-output modelwith a set of estimated multipliers was first created by open-ing the IMPLAN Pro software, importing the default 2001IMPLAN data for all of the counties in Table 1, and thenconstructing a default IMPLAN model along with a set ofestimated multipliers.
Step 2 -- The default model was then opened using MicrosoftAccess 2000. IMPLAN Pro data bases require this versionof Access.
Step 3 -- The three US tables and the Observed RPCs tablewere then deleted. This step was necessary because allIMPLAN Pro models share the following five tables (asindicated by black arrows to the left of the tables when themodel is opened in Access):
� US Absorption Table� US Absorption Totals� US Byproducts Table� Observed RPCs� Margin Codes
Deletion of these tables “breaks” the link so that any sub-sequent changes will not affect other IMPLAN models. Nochanges were made to the Margin Codes table so it was notnecessary to remove the link to this table.
Step 4 -- The deleted tables (the three US tables and theObserved RPCs table) were then replaced with the sametables contained in the 2001 IMPLAN Pro structural matrixfile 01NAT509.IMS through the import feature in Access.
Step 5 -- In Access, the default data in the 16 tables thatneeded to be modified were exported to Excel. Note thatsince the US Absorption table consisted of over 80,000 rowsof data, it was necessary to create two Excel tables to housethis information since Excel has a capacity of 65,536 rows.
Step 6 -- All of the default data in the 16 tables to be modi-fied were deleted. The table layout including column andtable names was not changed so that the updated data couldbe imported back into the original Access file structure.
Step 7 -- Data in these 16 tables were modified to betterreflect the sectoral linkages among fisheries-related indus-tries. Consistent with Step 6, the variable names and recordformats were maintained so that the files were compatiblewith the original Access file structure.
Step 8 -- Once all 16 data files had been modified they wereimported into Access. An append query in Access wasused to combine the two US Absorption Excel files into oneUS Absorption table.
Step 9 -- The modified model was then opened in IMPLANPro, the model was reconstructed and multipliers were re-estimated. This step was necessary because IMPLAN Prois not capable of recognizing the direct changes made tothe underlying Access tables, so the model must be recon-structed to use the updated data.
IMPLAN PRO TABLE ADJUSTMENTS
The following provides a more detailed discussion of modifications to certain Access tables.
Industry/Commodity Codes
This table contains unique code numbers for industriesand commodities. Industries and commodities share thesame name and number in an IMPLAN Pro model. Modifi-cations began by removing the default commercial fishingsector (IMPLAN sector number 16) and adding 394 newharvesting sectors to the model (sector’s 510-903 in Table2). These industry sectors designate different commercialfishing gear and vessel length categories in each of thesub-regions in the Northeast.
Additional changes included adding 23 wholesale sea-food dealer sectors (sector’s 904-926 in Table 2), 4 fish ex-change sectors (sector’s 927-930 in Table 2), 23 midwatertrawl bait supplying sectors, and 23 medium bottom trawlbait supplying sectors (sectors’s 931-976 in Table 2). Fi-nally, we removed the default seafood processing sector(IMPLAN sector number 71) and added 23 sub-regionalprocessing sectors (sector’s 977 - 999 in Table 2).

Page 10
Type Codes
The Type Codes table contains coding information onall transaction types in the data sets. For this table, weadded the 490 industry/commodity code designations asassigned above and the associated 490 SAM Commoditycodes. Transaction codes associated with Factors, House-holds, Institutions, Transfers, Employment, Output, andTrade remained the same.
US Absorption
This table contains the United States absorption matrixwhich, in input-output terminology, is the coefficient formof the use table. The default 2001 table contains 80,285rows of data that show the proportions of commodities eachindustry uses in its production process (i.e., its productionfunction). We removed the 213 rows of data contained inthe production functions for the default commercial fishingsector (sector 16) and the default seafood processing sec-tor (sector 71), and then added 55,425 rows of data thatcontained the production functions of each of the 490 fish-eries-related sectors that were added to the model.
Sectors that purchase commodities from the defaultcommercial fishing sector (i.e., seafood) and the default sea-food processing sector required adjustments to their pro-duction functions, since these two default sectors wereremoved from the Northeast Region input-output model.Adjustments were made by first identifying the industriesthat purchase seafood from these sectors. The commoditybalance sheet report option in IMPLAN Pro provides infor-mation on all industry sectors that purchase from a particu-lar sector. Using this option, we were able to identify the 11industry sectors that purchase seafood from the defaultcommercial fishing sector, and the 27 industries that pur-chase from the default seafood processing sector in the2001 data (Tables 8 and 9). However, in our NortheastRegion model wholesale seafood dealers are assumed topurchase 100% of the commercial fishing output. Thus, itwas necessary to change the assignment of seafood pur-chases for the 11 industry sectors that purchase commer-cial fishing output. We assumed that 7 of the 11 sectorswould purchase seafood from seafood processors and theremaining 4 would purchase from wholesale seafood deal-ers (see Table 8).
This reassignment strategy, however, entailed an addi-tional step because the Northeast Region model includes23 sub-regional wholesale seafood dealer sectors and 23sub-regional seafood processing sectors. A method had tobe developed to determine from whom of the sub-regionaldealers and processors the industries in Tables 8 and 9would purchase their seafood. At the suggestion of thesoftware vendor, we decided to allocate purchases accord-ing to output proportions in each sub-region. In otherwords, we used the sub-regional shares of total wholesaleseafood dealer output and seafood processing output in
the Northeast Region to allocate purchases. These shareswere then multiplied by the default commercial fishingsector’s and/or the default seafood processing sector’sgross absorption coefficient contained in the productionfunctions of each of the sectors shown in Tables 8 and 9.The resulting vector of absorption coefficients was theninserted into the US Absorption Table in place of the de-fault values for each of the sectors shown in Tables 8 and 9.Note that the sum of the values contained in the vector ofabsorption coefficients must sum exactly to the absorptioncoefficient contained in the default data or the model willnot build correctly.
US Absorption Totals
The US Absorption Totals table contains the sum of theabsorption coefficients for each industry sector. We re-moved the default commercial fishing sector’s total absorp-tion coefficient and the default seafood processing sector’stotal absorption coefficient, and then added the appropri-ate absorption coefficients for the 490 new sectors in theNortheast Region model. The sum of the coefficients fromeach sector in the US Absorption table must match the co-efficients in the US Absorption Totals table.
US Byproducts
This table contains US estimates of the proportions ofeach commodity an industry produces. In input-outputterminology it is the coefficient form of the “make” tablederived by dividing each element by the make table rowtotals. Industries often produce more than one commodity.Commodities other than primary commodities are called sec-ondary commodities or byproducts. For this table, we firstexamined if any of the 509 default industry sectors pro-duced commercial fishing seafood or processed seafood asa byproduct. The commodity balance sheet report optionin IMPLAN Pro provides information on commodity pro-duction by all industries. From this report we found that noother industries produced commercial fishing seafood as abyproduct in the 2001 data. However, there were three in-dustries (Frozen food manufacturing, Fruit and vegetablecanning and drying, and Meat processed from carcasses)that produced processed seafood as a byproduct. If weallowed these sectors to produce processed seafood as abyproduct, the model would not construct properly becausethe default seafood processing sector was removed fromthe model. Therefore, we removed the proportion associ-ated with processed seafood for these three sectors andadded it to their primary commodity share, so that the sumof each sector’s byproducts coefficients remained equal toone. The byproducts coefficients, which include the pri-mary commodity share coefficient, must sum to one for eachsector in the model in order for the model to construct prop-erly.

11Page
We also assumed that each of the 490 new sectors thatwere added to the model would produce only primary com-modities. Thus, we added a single record to the USByproducts table for each of the 490 new sectors and seteach sector’s primary commodity share coefficient to one.
SACommodity Sales
This table shows sales of commodities by householdsand institutions in the study area. There were no sales ofseafood by households in the default data so no changeswere made to the commodity sales rows for the nine house-hold expenditure sectors (i.e., Type Codes 10001 - 10009).There were also no institutional sales of raw harvested sea-food or processed seafood. However, zeros are entered intothe commodity sales field when no sales are present so wehad to remove the records that pointed to these commoditycodes in the default institutional sales data. In addition,since we assumed that there are no institutional sales ofcommodities produced by the 490 new industries that wereadded to the model, rows with zeros in the commodity salesfield were inserted into the table.
We also removed inventory additions (Type Code 14002)that existed in the default data for the seafood processingsector (Sector 71) because we eliminated this sector fromthe Northeast Region model. Sales estimates for the 23 newsub-regional seafood processing sectors in the model wereestimated by first constructing 23 separate sub-regionalIMPLAN Pro models to obtain the default inventory sea-food processing values in each sub-region, and then as-signing them to the 23 sub-regional seafood processingcommodity codes in the SA Commodity Sales table.
SAEmployment
The SAEmployment table delineates average annualjobs for each industry in the study area. Jobs are measuredin terms of both full-time and part-time workers combined.For this table, we removed the employment estimates forthe default commercial fishing sector (Sector 16) and thedefault seafood processing sector (Sector 71), and theninserted our employment estimates for the 490 new sectors.
SAFinal Demands
The final demand table consists of purchases of com-modities for final consumption by households and institu-tions. Several modifications were made to this table. Thefirst step entailed removing final demands associated withthe default commercial fishing sector and the default sea-food processing sector for all nine of the household expen-diture type codes and for all of the institution type codes.We then used these default values in combination with
output data and the dealer transaction matrix (see Section6) to estimate final demands by type codes for the newharvesting sectors, seafood dealer sectors, and seafoodprocessing sectors.
Final demands for each of the 394 new harvesting sec-tors were estimated by first calculating the proportion of asector’s output to the total output across all 394 sectors,and then multiplying this proportion by each default com-mercial fishing sector’s (Sector 16) final demand value con-tained in a Northeast Region-level model across type codes.
Final demands at the wholesale seafood dealer levelwere more difficult to calculate because the wholesale sea-food dealer sector is lumped into in an all-encompassingwholesale trade sector in an IMPLAN Pro model. Thus,there were no default final demand values specifically forseafood purchased at the wholesale level to use as a bench-mark in our new model. Therefore, we used the average2001 wholesale seafood mark-up from Fulton fish market(40%) in combination with the dealer transaction matrix todetermine final demands by type code for all 23 wholesaleseafood dealers in the model. Assuming that all commer-cially landed seafood flows through wholesale dealers, wefirst divided the commercial fishing final demand sales cal-culated above by 0.4 to calculate the wholesale dealer finaldemand sales associated with each of the 394 new harvest-ing sectors. We then multiplied these values by the propor-tions contained in the dealer transaction matrix to deter-mine final demand sales by wholesale dealer and type codeassociated with each new harvesting sector. Lastly, wesummed the final demand sales across harvesting sectorsfor each wholesale dealer by type code. The resulting finaldemand vector contained final demand sales for all 23 whole-sale seafood dealers by type code and was incorporatedinto the SAFinal Demands table. These final demands werealso subtracted from the default wholesale trade final de-mand values since they were reassigned to 23 new sectorsin our model.
Last, final demands for the 23 seafood processing sec-tors were calculated in the same manner as the harvestingsector’s final demands. The proportion of a sector’s outputto the total output across all 23 sectors was multiplied byeach default seafood processing sector’s (Sector 71) finaldemand value contained in a Northeast Region-level modelacross type codes.
SAForeign Exports
The SAForeign Exports table shows demands made forgoods and services by consumers and industries outsidethe US. For this table, we removed the foreign export esti-mates for the default commercial fishing sector (Sector 16),re-estimated foreign exports for raw seafood from new data(see below) and assumed that foreign exports of raw sea-food occur at the wholesale level and not the harvestinglevel. Additionally, foreign exports for the 23 new process-

Page 12
ing sectors added to the model were estimated by construct-ing 23 separate sub-regional IMPLAN Pro models to obtainthe default inventory seafood processing export values ineach sub-region.
Foreign exports of seafood produced at the wholesale-level in the Northeast Region were calculated according tothe following six steps.
Step 1 -- Northeast dealer reports were used to calculate thevalue of landings by species for the top three to five spe-cies landed (by value) for each harvesting sector gear typein the model.
Step 2 -- The proportion of total value by species and prod-uct type that is exported out of the US was calculated. NewEngland and Mid-Atlantic foreign trade data by speciesand product type is available from the Fisheries Statistics &Economics Division of the National Marine Fisheries Ser-vice (NMFS) at http://www.st.nmfs.gov/st1/trade/index.html.These data are purchased from the Foreign Trade Divisionof the U.S. Census Bureau and provide information on trade($s and lbs) through specific U.S. customs districts such asthe New England and the Mid-Atlantic regions. We di-vided the value exported by species and product type bythe region-wide export value of total landings (average ex-port price multiplied by total landings) to obtain the propor-tion of total sales exported out of the U.S. by product type.
Step 3 -- Fresh fillets and fresh and frozen whole fish wereassumed to be exported by wholesalers. The remaining prod-uct type categories (frozen fillets, salted, dried, minced fro-zen, smoked, and an other product type category) were as-sumed to be exported by seafood processors. We summedthe export proportions from Step 2 across the three whole-sale product type categories to estimate total NortheastRegion export proportions (in terms of value) by species.
Step 4 -- Weighted average wholesaler export proportionswere calculated from the harvesting gear types. The exportproportions from Step 3 were weighted by the proportionsof landed value by species (for the top three to five valuedspecies) to total landed value for each of the harvestinggear types. These species-level proportions for each geartype were then summed across species to obtain the pro-portions of wholesaler output that will be exported outof the U.S., originating from the 18 different gear types inthe model. Note that the export rates derived from eachgear type are assumed to be the same across the 23 sub-regions.
Step 5 -- The wholesale export rates from Step 4 were thenmultiplied by the output values contained in the dealer trans-action matrix (adjusted upward assuming a margin of 40%)to obtain the wholesale dealer export values across the 23wholesale sectors associated with each harvesting sectorin the model.
Step 6 -- We then summed the wholesale export values fromStep 5 across harvesting sectors for each of the 23 whole-salers and divided this value by the total sales from eachwholesale sector. The resulting values show the averageproportion of total seafood sales that is exported out of theU.S. by each wholesaler. The average amount exported byseafood dealers ranges from a low of 18% in the VA Northsub-region to 70% in the Southern ME sub-region. Theseproportions were then multiplied by the margined whole-sale output values contained in the SAOutput table (thewholesale sectors are treated as margin sectors in the model)to determine the value of foreign exports for each of the 23wholesale sectors in the model.
SAOutput
The SAOutput table is a vector of output values inmillions of dollars that represents an industries total pro-duction. There is a single value for each of the 997 sectorsin the model. We removed the default commercial fishingsector’s output value and the default seafood processingsector’s output value, and then added the appropriate pro-duction values for the 490 new sectors in the NortheastRegion model.
SAValue Added
This table details payments made/received by each in-dustry to employee compensation (wage and salary pay-ments, insurance, retirement, etc.), proprietary income (allincome received), other property type income (paymentsfrom interest, rents, royalties, dividends, corporate profits,etc.) and indirect business taxes (primarily excise and salestaxes). The value added transactions associated with thedefault commercial fishing and seafood processing sectorswere removed and the appropriate values for the 490 newsectors were added to the table.
Observed RPCs
The Observed RPCs table contains forced regional pur-chase coefficient values for all states in the model. Weremoved the values associated with the default commercialfishing and seafood processing sectors and added the ap-propriate RPC values by state FIPS codes for the 490 newsectors added to the model. We used the average RPCoption in IMPLAN Pro so the same RPC value was appliedacross states for each of the 490 new sectors. However,because of the way the model calculates impacts acrosssectors, virtually all of the RPC values for the new sectorswere set to zero: the RPCs for the bait sectors were set toone. The model-generated default RPC values were usedfor the other 507 sectors in the model.

13Page
RPC Methods
This table contains information for creation of the re-gional purchase coefficients. Similar to the modificationsmade for to many of the other tables, we removed the infor-mation associated with the default commercial fishing andseafood processing sectors and then added the relevantinformation for the 490 new sectors to the table.
Deflator1
The Deflator1 table contains deflators that account forrelative price changes during different time periods. TheIMPLAN Pro deflators are derived from the Bureau of La-bor Statistics Growth Model. The 2001 IMPLAN Pro database contains deflators from 1977 to 2010 for each commod-ity in the model. We eliminated the default commercial fish-ing sector deflators and applied these same values to the394 new harvesting sectors in the table. We also removedthe default seafood processing sector and applied thosedeflators to the 23 new sub-regional seafood processingsectors that we added to the table.
rptSAFinal Demands
This is a report table that is used by the IMPLAN Prosoftware to view final demand purchases of industry out-puts. Report tables are not used by the IMPLAN Pro soft-ware for model construction or impact analysis; they sim-ply provide a means to view data from within the IMPLANPro system. Therefore, modifications to this table are notabsolutely necessary, but are required in order to use theIMPLAN Pro reporting feature.
To keep the software fully functional we modified thefinal demand values in this table. We removed the finaldemand values associated with both the default commer-cial fishing and seafood processing sectors, and added theappropriate data from the SAFinal Demands and SAForeignExports table. Note that modifications in ACCESS are notacknowledged by the IMPLAN Pro software so the socialaccounts must be regenerated after changes are made inorder for the reporting features in IMPLAN Pro to workproperly.
rptSAIndustry Data
This is another report table that is used by the IMPLANPro software to show industry output, employment, andvalue added information by sector. Changes to this tablewill not effect model construction or impact analysis, butneed to be made in order to use the reporting feature in theIMPLAN Pro software. We eliminated the industry dataassociated with the default commercial fishing and process-ing sectors, and added the appropriate data from the
SAOutput table, SAEmployment table, and the SAValueAdded table.
6. IMPACT ESTIMATION
The NERIOM provides analysts with a tool for assess-ing how the impact of fishery management decisions maybe distributed across different sectors of regional and sub-regional economies. However, any impact assessment mustbegin with an externally derived estimate of how any suchaction would affect commercial fishing sales. The economy-wide backward-linked impacts of proposed fishery manage-ment actions are estimated by applying these exogenouslydetermined gross output changes to the appropriateNERIOM multipliers. As discussed in Section 2, an IMPLANPro model can accept exogenous gross output (i.e., sales)changes as entries if the RPCs of the directly impacted sec-tors are set to zero. In addition to deriving exogenous grossoutput changes for the harvesting sectors, however, theNERIOM also requires exogenous estimates of how the saleswill change for wholesale seafood dealers, fish exchange/auctions, and seafood processors. Thus, the RPCs for allof the fishing-related sectors in the NERIOM were set tozero. By simultaneously multiplying the estimated exog-enous gross output changes for the harvesting sectors,wholesale seafood dealer sectors, fish exchange/auctionsectors, and seafood processing sectors by their corre-sponding model-generated multipliers, the backward-linkedeffects associated with changes in commercial fishing salesand the additional backward-linked multiplier effects thatmay occur through changes in local supply to wholesalers,auction houses, and seafood processors can be measured.This modeling approach, however, requires not only an ex-ternal estimate of how management actions will impact har-vesting revenues, but also how the actions will impact therevenues of auction houses, wholesalers, and seafood pro-cessors.
In previous applications of this approach, we beganwith a mathematical programming model to estimate howex-vessel revenues for each of the commercial harvestinggear sectors in the NERIOM might change upon implemen-tation of the proposed regulations. Mathematical program-ming models are but one method that may be used to esti-mate potential changes in harvesting revenues. Other meth-ods may be appropriate depending upon the managementchanges that may be under consideration.
Once the exogenous ex-vessel revenue changes aredetermined, adjustments can be made to account for theadditional revenue changes that may occur to the auctionhouses, seafood wholesalers, and seafood processors. Toestimate these changes, we first constructed a dealer trans-action matrix from 2001 Northeast dealer weigh-out data.Northeast weigh-out slips record all transactions betweenfederally permitted harvesters and wholesale dealers. Thus,it was possible to create a transaction matrix that showedthe value of seafood sold by each of the 394 commercial

Page 14
fishing gear sectors in the NERIOM to each of the 23 whole-sale dealers and 4 fish exchange/auction houses in themodel. Fish/exchange auction houses are also required tohold a federal dealer permit. The transaction matrix couldthen be used to determine how changes in a particular har-vesting sector’s ex-vessel revenues would affect the valueof purchases associated with the 23 wholesale dealers andthe 4 fish exchange/auction houses. Wholesale seafooddealer gross revenue changes were then calculated by as-suming the mark-up on these purchases was 40% - the av-erage Fulton Market margin in 2001. The values of themark-ups were then entered as the change in direct sales foreach wholesale dealer sector in the NERIOM since thesesectors are treated as margin sectors by the model. The 4fish exchange/auction houses are also treated as marginsectors in the model. The values of these mark-ups werecalculated by dividing the average exchange fee per pound(11 cents) by the average price per pound of seafood soldat each exchange. The estimated gross revenue changesassociated with the 4 fish exchange/auction houses werethen multiplied by the mark-up values (approximately 9.7%)and entered as the change in direct sales for each fish ex-change/auction house. Gross revenue changes for sea-food processors are estimated following the steps describedbelow.
Step 1 -- Calculate the estimated value of seafood exportedby wholesale seafood dealers. Multiply the estimated grossrevenue changes for each wholesaler by the average pro-portion of total seafood sales that is exported out of theU.S. by each wholesaler (derivation of these proportionswere explained in Section 5).
Step 2 -- Calculate the value of seafood left in the Northeastthat is available to be purchased by Northeast seafood pro-cessors. This step simply requires removing the estimatedvalue of seafood exported by wholesale dealers. Thus, thesevalues are obtained by subtracting the export estimatescalculated in Step 1 for each wholesale dealer from the esti-mated wholesaler’s gross revenue change.
Step 3 -- Calculate the estimated value of wholesale sea-food that will actually be purchased by seafood processorsin the Northeast. As noted earlier IMPLAN Pro data for theNortheast shows seafood processors purchasing approxi-mately 48% of the sales produced by the commercial fish-ing sector in the Northeast in 2001. This value can be deter-mined by constructing a default Northeast IMPLAN Promodel and then viewing the commodity balance sheet forthe commercial fishing sector. As we have said, most of theseafood purchased by seafood processors generally flowsthrough wholesalers before reaching the processing leveland all federally permitted commercial harvesters are re-quired to sell to establishments that hold federal dealer per-mits. Thus, in the NERIOM it is assumed that seafoodprocessors will purchase product from wholesalers and not
directly from commercial harvesters. As such, 48% of North-east wholesale dealer sales – and not commercial harvestersales - are assumed to be purchased by seafood processorsin the region. The value of the purchases are then calcu-lated by multiplying the result of Step 2 by 0.48 for eachwholesale dealer in the model. The other 52% of wholesaleseafood sales are purchased by industries such as eatingand drinking establishments, hospitals, hotels, etc. and byfinal demand sectors other than exports (i.e., householdsand government entities; see Figure 2). These purchasesare assumed to remain constant in the NERIOM, however.
Step 4 -- Determine the value of purchases by seafood pro-cessors that will be derived from each wholesaler. In Step 3,the value of wholesale seafood dealer output that is pur-chased by seafood processors was calculated. In this step,we have to allocate the purchases to specific seafood pro-cessors. In states with more than one sub-region, seafoodprocessors are assumed to purchase from all in-state whole-sale dealers according to seafood processor output pro-portions contained in the NERIOM.
Step 5 -- Convert the impacts on purchases to gross rev-enue changes. To calculate estimated gross revenuechanges, margins are applied to the values estimated inStep 4. The margins were derived from each sub-regionalseafood processing sector’s production function and rep-resent the value of output less the cost of the seafoodpurchased. The margins varied from 62% to 67% acrosssub-regions, and since seafood processors are consideredproducing sectors in the NERIOM, the estimates calculatedin Step 4 were marked-up according to the appropriate sub-regional margin values. These producer values are thenentered as the change in direct sales for each seafood pro-cessing sector.
The estimated direct changes in gross revenues forharvesters, fish exchanges/auctions, wholesale seafooddealers, and seafood processors are then compiled into animpact vector and entered into a Microsoft Excel templatethat can be imported into IMPLAN Pro (see Appendix I inOlson and Lindall, 1999 for details about the template). Theimpact vector can then be applied to the multipliers in theNERIOM to arrive at the economy-wide impacts of the pro-posed regulation in the Northeast.6
Allocation of Indirect and Induced Impacts toSub-regions
The NERIOM explicitly addresses sub-regional impactsfor the seafood producing sectors that are estimated to bedirectly affected: the commercial harvesting gear sectors,the fish exchange/auction sectors, the wholesale seafooddealer sectors, and the seafood processing sectors. Thesum of the sub-regional impact estimates for these sectors

15Page
in the NERIOM equals the regional impact. The NERIOM, however, calculates only Northeast region-level impacts for the sectors that are estimated to be indirectly affected, therefore a method had to be developed that could apportion the estimated region-wide effects on indirectly affected sectors to the sub-regions contained in the NERIOM.
The allocation method we developed is based on the relative importance of each sub-region’s economy (determined to be directly affected) to the total Northeast region’s economy. We assumed that the indirect impacts would be distributed according to output, personal income, and employment shares in each of the sub-regions that were directly impacted. The shares were first determined by constructing separate default IMPLAN Pro models for each of the 24 sub-regions. Then the default output, personal income, and employment estimates contained in each sub-regional model were divided by the regional totals. Using output estimates as an example, if irT is equal to the total default output for each industry sector ( i ) in each sub-region ( r ), then the shares can be represented
as
�� R
rir
irir
T
TS . These shares are then adjusted three
times before they are applied to the IMPLAN-generated region-wide estimates of indirect impacts.
The first adjusted share calculation maintains the unadjusted shares ( irS s) for industries located in the directly impacted sub-regions and the non-maritime sub-region and sets the remaining shares to zero. If rD indicates the sub-regions that are directly impacted (i.e., revenue changes will occur for commercial harvesters, seafood dealers, fish exchange/auction houses, or seafood processors in that sub-region) and 1
irA equals the first
adjusted share then for all rD >0 1irA = irS . If rD = 0
then 1irA = 0. Additionally, if the subscript r equals the
non-maritime sub-region then let NMr � and 1irA = iNMS .
The shares are then adjusted a second time to capture the relative importance of industry output in each of the directly affected sub-regions to total industry output across all of the directly affected sub-regions. If irB is set equal
to �I
iirA1 and 2
irA equals the second adjusted share then
� �iNMir
iriNM
ir
iNM
ir
irir SB
AS
BS
BA
A��
�
�
� �
����
����
112 *
for iNMir SB � , otherwise if iNMir SB � then 02 �irA .
Finally, the non-maritime Northeast region shares for each industry i are then subdivided into non-maritime New England shares and non-maritime Mid-Atlantic shares. The adjusted shares are calculated based on the proportion of direct impacts that occur in each of the two aggregate sub-regions to the total direct impacts in the Northeast region. Mathematically, if 3
irA equals the third adjusted share and the subscripts NE and MA represent New England and Mid-Atlantic sub-regions, respectively,
then for NMr � , iNMR
rr
NE
rr
iNMNE SD
DA *3
�
�� and
iNMR
rr
MA
rr
iNMMA SD
DA *3
�
�� . For all NMr � ,
23irir AA � .
The region-wide IMPLAN-generated impact estimates for each of the indirectly affected sectors can then be apportioned across the directly impacted sub-regions by multiplying the estimates by the third adjusted shares. The shares sum to one which ensures that the sum of the resulting sub-regional impacts will equal the model-generated region-wide impacts.
Hypothetical Impact Assessment Hypothetical reductions in medium bottom trawl ex-
vessel revenues are used to illustrate the outputs produced by the NERIOM. If it is assumed that a reduction in landings is required to meet an annual rebuilding target, and the reduction in landings is predicted to cause a $500,000 decline in total ex-vessel revenues for medium bottom trawl vessels in each of the coastal sub-regions from Maine through New York, the NERIOM can be employed to assess the multiplier effects (sales, personal income, and employment) associated with the estimated decline in revenues. Tables 10 through 15 show the results of this hypothetical impact assessment.
The total exogenously determined direct loss in ex-vessel revenues for medium bottom trawl vessels across all the sub-regions in the Northeast sums to $5.5 million ($5.0 million across the sub-regions in New England and $500 thousand in the Mid-Atlantic sub-regions; Tables 10 and 11, respectively).7 Exogenously determined losses in wholesale dealer sales of seafood are estimated to approach $1.16 million in New England and $230 thousand in the Mid-Atlantic. Additionally, exogenously determined losses in sales by fish exchange/auction houses in New

Page 16
auction houses in New England are estimated to be $196thousand. Finally, exogenously estimated losses in sea-food processing revenues are estimated to be $5.56 millionin New England and $430 thousand in the Mid-Atlantic. Aspreviously mentioned, wholesale dealers and fish exchange/auction houses are treated as margin sectors so their salesestimates in the NERIOM reflect only the value added tothe seafood being sold (i.e., total gross sales less the costof the purchased seafood). The NERIOM then uses all ofthe exogenously determined estimates of revenue changesto the commercial harvesters, wholesale dealers, fish ex-change/auction houses, and seafood processors to calcu-late the indirect and induced multiplier effects of thosechanges. At the greatest level of detail, indirect and in-duced effects can be estimated for up to 507 sectors in eachof the 24 sub-regions. Thus, for presentation purposes, theresults have been aggregated into 15 summary categoriesfor each sub-region. Of the total sales impact in New En-gland, 68% is associated with direct gross revenue lossesto medium bottom trawlers, seafood dealers, fish exchange/auction houses, and seafood processors. The remaining32% of the losses in New England are the indirect and in-duced effects that occur among industries that providegoods and services in the production of seafood. The larg-est indirect revenue losses in New England are estimatedfor establishments classified as service industries ($1.83million). Across the Mid-Atlantic, however, the indirectand induced effects comprise nearly 84% of the total salesimpact. This seeming disproportionate effect is mainly afunction of the substantial industry-level infrastructure thatexists in the Mid-Atlantic sub-regions. Mid-Atlantic basedbusinesses produce a greater percentage of the goods andservices that are used in the production of seafood in theNortheast region. The largest indirect and induced rev-enue losses in the Mid-Atlantic are predicted to occur inservice industries ($1.83 million), finance, insurance, andreal estate ($947.36 thousand), and wholesale trade ($812.35thousand).
Important differences in impacts across the 23 sub-re-gions are also predicted to occur. Revenue losses are esti-mated to range from a high of $4.35 million in the New YorkSeacoast sub-region to no estimated losses in the 9 sub-regions south of New Jersey (excluding the non-maritimeMid-Atlantic sub-region). The comparatively large lossesshown for the New York Seacoast sub-region can generallybe traced to a greater reliance on goods and services pro-duced from within the New York Seacoast sub-region thanfrom any of the other sub-regions in the NERIOM. In the 9sub-regions south of New Jersey, there are no predicteddirect revenue losses for any of the seafood producing sec-tors (i.e., medium bottom trawlers, seafood dealers, fish ex-change/auctions, or seafood processors). It is assumed,therefore, that there will also be no indirect or induced ef-fects in these sub-regions. In the Downeast Maine sub-region and in the New Jersey North and New Jersey Southsub-regions there are no predicted direct revenue losses
associated with medium bottom trawlers, but there are di-rect losses associated with one or more of the other sea-food producing sectors. Indirect and induced effects are,therefore, predicted to occur as supporting businesses sup-ply fewer goods and services to seafood dealers, fish ex-changes/auctions, and seafood processors. It is also worthnoting that supporting businesses in the non-maritime sub-regions in New England and the Mid-Atlantic are predictedto incur substantial revenue losses even though there areno direct revenue losses associated with any of the sea-food producing sectors in these sub-regions. These lossesresult because as the revenues of businesses located in thecoastal sub-regions decline, they, in turn, purchase smallerquantities of goods and services from non-maritime busi-nesses (i.e., indirect effects). In addition, as employee earn-ings decline, household spending falls, initiating furtherrounds of revenue repercussions in the non-maritime sub-regions (i.e., induced effects).
Although losses in sales represent a loss in output,losses in personal income and jobs are a more telling indica-tor of economic impact. The total loss in personal income isestimated to range up to $1.67 million in the New York Sea-coast sub-region (Tables 12 and 13). In terms of jobs, theare no estimated impacts in the 9 sub-regions south of NewJersey while the New York Seacoast sub-region is predictedto incur the largest job impact (35; Tables 14 and 15). Aswas the case for changes in sales, a much larger proportionof the total income and employment impacts fall on the sea-food producing sectors in New England than in the Mid-Atlantic. Nearly 70% of the total income impact and totalemployment impact in New England can be traced to me-dium bottom trawlers, seafood dealers, fish exchange/auc-tions, and seafood processors. In the Mid-Atlantic, how-ever, only 18% of the total estimated income changes and23% of the total employment changes can be traced to theseafood producing businesses. As previously indicated,the disparity is generally due to the substantial industry-level infrastructure that supplies seafood establishments inthe Mid-Atlantic region.
7. DISCUSSION
The NERIOM has been designed to calculate the back-ward linked multiplier effects induced by exogenous changesin gross revenues for commercial harvesters, fish exchange/auction houses, seafood dealers, and seafood processors.Assessments such as this are essential to fishery manage-ment agencies that want to know how management actionswill impact regional economies.
One of the more useful features of the modeling ap-proach presented here is that it is based on traditionalLeontief input-output relationships, so it can be incorpo-rated into ready-made input-output systems such asIMPLAN Pro. Ready-made models reduce the cost andcomplexity of model formulation and the time required to

17Page
generate impact estimates. This is important, because theprimary reason for building the NERIOM is for use in rela-tive policy appraisals of alternative fishery managementactions. The ability to be able to predict the multiplier ef-fects of policy-induced changes in a timely manner, willallow regional decision makers in the Northeast to compareand contrast the outcomes of alternative management strat-egies prior to choosing the final measures.
Ready-made regional input-output models also offerconsiderable industry detail to trace backward linkages andto generate disaggregated estimates of indirect and inducedmultiplier effects. In contrast, the multiplier effects gener-ated from other types of input-output models (e.g., mixedexogenous/endogenous variables models and spreadsheet-type models based on limited input-output multipliers) areusually derived from aggregated or condensed versions ofthese same ready-made models. As a consequence, themodels lack the sectoral detail contained in the NERIOMand generally do not provide the multiplier effects neces-sary for fully informed decision making.
The multiplier effects generated by the NERIOM, how-ever, are static and should be viewed as the immediate/short-term impacts of the change being analyzed. There areseveral technological assumptions built into the model, suchas fixity of prices and zero-substitution elasticities in con-sumption and production that make it difficult to assesshow the seafood producing sectors will adjust over time.For example, vessels may be able to offset initial ex-vesselrevenue losses due to a cutback in a landings quota byswitching to other fisheries. In addition, direct revenuelosses to seafood dealers, auction houses, and seafoodprocessors may also decline over time as seafood flowsfrom other fisheries increase. The reduction in local supplymay also cause prices and/or imports to increase loweringthe estimated direct revenue losses even further. Unfortu-nately, these types of longer run adjustments are generallynot captured in input-output models. As harvesters, sea-food dealers, and seafood processors adapt to policy-in-duced reductions in supply over time, it is likely that at leastsome of the losses estimated with the NERIOM will beavoided through shifts to other fisheries, price increases,and additional imports.
The impacts estimated by the NERIOM also excludethe retail level. Although it is possible that restaurants andfood service establishments in the Northeast could experi-ence a reduction in local supply because of a restrictivefishery management action, we have assumed that consum-ers would simply choose from among the many other closesubstitutes (e.g., other fish species, chicken, turkey, etc.)such that retail level gross revenues would remain un-changed.
At present, the NERIOM can accept input data for theyears 2001 through 2010. Although the data contained inIMPLAN Pro are based on economic relationships in 2001,the impacts of management actions in succeeding years aredetermined by converting the estimated changes in gross
revenues to year 2001 dollars before the impacts are esti-mated. The NERIOM then automatically converts the im-pact estimates back to the year of the input data (through2010). This process accounts for the effects of inflation onthe impact estimates. However, the economic relationshipsthat existed in 2001 are only approximations of the ones thatmay exist in subsequent years. Technological change andprice variability may alter an industry’s production processover time, and hence the businesses that are impacted bychanges in fishery management actions. Technology andprices tend to change rather slowly, however, so the mis-match between the economic relationships in 2001 and nearsubsequent years is likely to be minimal. Nonetheless, sincethe NERIOM assumes these economic relationships remainconstant, an element of uncertainty is introduced into themodel’s estimates.
Product flow assumptions are another source of pos-sible uncertainty. The federal Northeast dealer data basetracks the flow of seafood from harvesters to seafood deal-ers and most fish exchange/auction houses (e.g., the flowof seafood to Fulton Market in New York is unknown), butdocumentation of successive levels of sales among sea-food industry establishments in the Northeast region arenot available. In particular, virtually no data is available tomeasure transactions between and among fish exchange/auction houses, seafood dealers, and seafood processors.Thus, the NERIOM assumes a linear flow of product salesfrom harvesters to fish exchange/auction houses and whole-sale seafood dealers, and then finally onto seafood proces-sors. To the extent that these simplifying assumptions un-derestimate the number of transactions between the sea-food producing establishments in the Northeast region, thevalue added by each successive level of sale will be under-estimated. If this is the case, the impacts generated by theNERIOM are also underestimated.
The allocation method used to translate region-wideindirect impacts into sub-regional impacts ensures that thatthe sum of the sub-regional impacts will equal the model-generated region-wide impacts, but the method is based onweighted ratios that may only approximate true economicrelationships in the Northeast region. For example, the totalNortheast region ice manufacturing sales impact in the hy-pothetical impact assessment shown above was $40.69 thou-sand (Tables 10 and 11). This model-generated indirectimpact was then distributed across sub-regions that werepredicted to be directly impacted based on the relative im-portance of ice manufacturing across each of the directlyimpacted subregions and the non-maritime sub-regions.Since ice manufacturing output (i.e., sales) in the BostonMassachusetts sub-region comprises 6.48% of the regionaltotal, 6.48% ($6,283) of model-generated regional total isallocated to the Boston Massachusetts sub-region. Whilethe proportional allocation method is computationally effi-cient and concise, it only distributes the model-generatedregion-wide indirect and induced impacts to sub-regionswhere direct impacts are predicted to occur. If businesses

Page 18
located in sub-regions that are not predicted to be directlyimpacted are affected the weighting method may misrepre-sent the distribution of impacts.
Consideration was given to allocating indirect and in-duced impacts across all 24 sub-regions according to thedefault fixed output, income, and employment shares in eachsub-region. This method would result in estimates of indi-rect and induced impacts in all 24 sub-regions, but it isinsensitive to the location of the direct impacts. The alloca-tion method we followed places more weight on indirectlyaffected businesses located in the sub-regions where thedirect effects take place. Construction of a full multi-re-gional model that explicitly measures the linkages betweenindirectly affected sectors in each of the sub-regions wouldlikely provide more accurate sub-regional estimates of indi-rect impacts. However, a model of this kind in the Northeastregion is computationally unworkable since it would re-quire over 12 thousand sectors to measure the economicrelationships that exist between the indirectly affected sec-tors in each of the 24 sub-regions (i.e., 507 possible indi-rectly affected sectors * 24 sub-regions = 12,168 sectors).
ENDNOTES
1. This is known as closing the model with respect to house-holds. In a closed input-output model, the householdsector is moved from the final-demand column and placedinside the A matrix, making it one of the endogenoussectors.
2. Employment and personal income multipliers can alsobe derived from input-output models by multiplying themodel-generated output changes by an industry’s em-ployment to output ratio, and an industry’s personalincome (employee compensation plus proprietor’s in-come) to output ratio, respectively.
3. An RPC measures the portion of the total regional de-mand for a particular industry sector’s output that issupplied by local producers.
4. For a derivation of the equivalence between the totalaggregate impact estimates generated from a mixed ex-ogenous/endogenous variables model and the approachdescribed in Tanjuakio, Hastings, and Tytus (1996) seeSteinback 2004.
5. The addition of fish exchanges/auctions could not be ex-tended to the New York sub-region where the largest whole-sale market in the Northeast operates – the Fulton Market,because specific data on the flow of seafood through thismarket, though formerly available is not now so.
6. Although the effects on the economy of direct changesin gross revenues for harvesters, fish exchanges/auc-
tions, wholesale seafood dealers, and seafood proces-sors are estimated simultaneously in the NERIOM, themodel avoids double counting because the RPC’s forthese sectors have been set to zero. Setting the RPCsof the outputs produced by the directly impacted sec-tors to zero prior to constructing the direct input coeffi-cient matrix (A matrix) effectively prevents other localindustries from buying these outputs and, thus, removesthe possibility of double counting impacts. In otherwords, the impacts associated with changes in seafooddealer revenues and fish exchange revenues excludethe impacts associated with changes in commercial har-vesting revenues, and revenue changes associated withseafood processors exclude those changes attributableto seafood dealers, fish exchanges, and commercial har-vesters. Thus, the impacts associated with revenuechanges to these sectors can be summed to obtain thetotal effect on sales, income, and employment withoutdouble counting impacts.
7. In 2001, there were no reported landings for mediumbottom trawl vessels in the Downeast Maine sub-re-gion. Thus, there are no losses in ex-vessel revenuesreported for the medium bottom trawl sector in this sub-region in Table 10.
REFERENCES CITED
Anonymous, 1995. “SIMLOB - The resource and harvest sec-tor components of the North American Lobster (Homarusamericanus) market model: final report,” Department ofEnvironmental and Natural Resource Economics, Univer-sity of Rhode Island, Kingston, RI.
Georgianna, D.; Cass A.; Amaral, P. 1999. “The cost of fishingfor sea scallops in Northeastern United States,” Univer-sity of Massachusetts Dartmouth, National Oceanic andAtmospheric Administration Cooperative Marine Educa-tion and Research Award, National Marine Fisheries Ser-vice, Contract Number NA67FEO420.
Georgianna, D.; Cass A.; Brough K. 1998. “The cost of hookfishing for groundfish in Northeastern United States,”University of Massachusetts Dartmouth, National Oce-anic and Atmospheric Administration Cooperative Ma-rine Education and Research Award, Contract NumberNA67FEO420.
Johnson, T.G.; Kulshreshtha, S.N. 1982. Exogenizing agricul-ture in an input-output model to estimate relative impactsof different farm types. Western Journal of AgriculturalEconomics 7(2):187-198.
Kirkley, J.E.; Ryan, W.; Duberg, J. 2004. “Assessing the eco-nomic importance of commercial fisheries in the Mid-At-lantic region: A user’s guide to the Mid-Atlantic input/output model,” Virginia Institute of Marine Science, Na-tional Oceanic and Atmospheric Administration Coop-erative Marine Education and Research Award.

19Page
Lallemand, P.; Gates, J.M.; Dirlam, J.; Cho, J. 1998. “The costsof small trawlers in the Northeast,” Department of Envi-ronmental and Natural Resource Economics, The Univer-sity of Rhode Island.
Lallemand, P.; Gates, J.M.; Dirlam, J.; Cho, J. 1999. “The costsof large trawlers in the Northeast,” Department of Envi-ronmental and Natural Resource Economics, The Univer-sity of Rhode Island.
Leung, P.; Pooley, S. 2002. Regional economic impacts of re-ductions in fisheries production: a supply-driven ap-proach. Marine Resource Economics 16(4), 251-262.
Miller, R.E.; Blair, P.D. 1985. Input-output Analysis: Founda-tions and Extensions. Prentice-Hall, London.
Minnesota IMPLAN Group, Inc., IMPLAN System (data andsoftware), 1725 Tower Drive West, Suite 140, Stillwater,MN 55082 www.implan.com.
Olson, D.; Lindall, S. 1999. IMPLAN Professional Software,Analysis, and Data Guide. Minnesota IMPLAN Group,
Inc., 1725 Tower Drive West, Suite 140, Stillwater, MN55082, www.implan.com.
Steinback, S.R. 2004. Using ready-made regional input-outputmodels to estimate backward-linkage effects of exogenousoutput shocks. The Review of Regional Studies 34(1):57-71.
Tanjuakio, R.V.; Hastings, S.E.; Tytus, P.J. 1996. The economiccontribution of agriculture in Delaware. Agricultural andResource Economics Review 25(1):46-53.
TechLaw, Inc. 2001. “The Economic Contribution of the SportFishing, Commercial Fishing, and Seafood Industries toNew York State,” Prepared for New York SeaGrant.
U.S. Census Bureau, 2004. “Groceries and Related Products:2002,” 2002 Economic Census, Wholesale Trade, Indus-try Series.
U.S. Census Bureau, 2003. 2001. County Business Patterns(NAICS) Summary Tables, http://censtats.census.gov/cbpnaic/cbpnaic.shtml, generated (7 October 2004)

Page 20
Blank page

21Page
Figure 1. Fishing Regions in the Northeast U.S.
Maine Downeast
Maine upper mid-coast
Maine lower mid-coast
Maine southern
New HampshireMassachusetts north shore
Massachusetts Boston area
Massachusetts Cape & Is lands
Massachusetts New Bedford coast
Rhode Is land
ConnecticutNew York
New Jersey north
New Jersey south
DelawareMaryland west
Maryland east
Virginia east
Virginia nor th
Virginia south
North Carolina north
North Carolina central
North Carolina southLegend
Fishing Regions
Near Coastal Northeast Region
Rest of the U.S.
Fishing Regions in the Northeast U.S.

Page 22
Figu
re 2
. N
ERIO
M P
rodu
ct F
low
s*
*
Prod
uct f
low
s illu
stra
ted
by so
lid li
nes a
re c
aptu
red
in th
e N
ERIO
M.
Prod
uct f
low
s illu
stra
ted
with
the
dash
ed li
nes a
re
excl
uded
in th
e N
ERIO
M.
Exp
orts
Exp
orts
Inte
rmed
iate
Dem
and
othe
r th
an
Proc
essi
ngFi
nal C
onsu
mer
s
Fish
Exc
hang
es a
nd
Auc
tions
Who
lesa
le D
eale
rs
Har
vest
ers
Proc
esso
rs
Fina
l Con
sum
ers
Inte
rmed
iate
Dem
and

23Page
Table 1. Fishing Regions in the Northeast U.S.
Northeast Region
Sub-region Counties
1. Maine Downeast Washington
2. Maine upper mid-coast Hancock, Knox, Waldo
3. Maine lower mid-coast Androscoggin, Cumberland, Kennebec, Lincoln, Sagadahoc
4. Maine southern York
5. New Hampshire Hillsborough, Rockingham, Strafford
6. Massachusetts north shore Essex
7. Massachusetts Boston area Norfolk, Middlesex, Plymouth, Suffolk
8. Massachusetts Cape & Islands Barnstable, Dukes, Nantucket
9. Massachusetts New Bedford coast Bristol
10. Rhode Island Bristol, Kent, Newport, Providence, Washington
11. Connecticut Fairfield, Middlesex, New Haven, New London
12. New York Bronx, Kings, Nassau, New York, Queens, Richmond, Rockland, Suffolk, Westchester
13. New Jersey north Bergen, Essex, Hudson, Morris, Passaic, Sussex, Union, Warren
14. New Jersey south Atlantic, Burlington, Camden, Cape May, Cumberland, Gloucester, Hunterdon, Mercer, Middlesex, Monmouth, Ocean, Salem, Somerset
15. Delaware Kent, New Castle, Sussex
16. Maryland west Anne Arundel, Baltimore, Baltimore City, Carroll, Cecil, Harford, Howard, Montgomery, Prince Georges
17. Maryland east Calvert, Caroline, Charles, Dorchester, Kent, Queen Anne’s, St. Mary’s, Somerset, Talbot, Wicomico, Worcester
18. Virginia north Essex, Fairfax, King and Queen, King George, King Williams, Lancaster, Middlesex, Monassas, Monassas Park, New Kent, Northumberland, Prince William, Richmond, Stafford, Westmoreland
19. Virginia east Accomack, Northampton
20. Virginia south Charles City, Chesapeake, Chesterfield, Colonial Heights, Gloucester, Hampton, Henrico, Hopewell, Isle of Wight, James City, Mathews, Newport News, Norfolk, Poquoson, Portsmouth, Prince George, Richmond City, Suffolk, Surry, Virginia Beach, Williamsburg, York
21. North Carolina north Bertie, Camden, Chowan, Currituck, Pasquotank, Perquimans, Tyrell, Washington
22. North Carolina central Beaufort, Carteret, Craven, Dare, Hyde, Pamlico, Pitt
23. North Carolina south Brunswick, New Hanover, Onslow, Pender
24. Near Coastal Northeast Remaining counties in the 11 coastal Northeast states

Page 24
Table 2. Industry/Commodity Codes
Industry Code Description
Industry Code Description
510 Downeast ME Inshore Lobster 558 Lower Mid-Coast ME Midwater Trawl 511 Downeast ME Offshore Lobster 559 Lower Mid-Coast ME Pots and Traps 512 Downeast ME Large Bottom Trawl 560 Lower Mid-Coast ME Bottom Longline 513 Downeast ME Medium Bottom Trawl 561 Lower Mid-Coast ME Other Mobile Gear 514 Downeast ME Small Bottom Trawl 562 Lower Mid-Coast ME Other Fixed Gear 515 Downeast ME Large Scallop Dredge 563 Lower Mid-Coast ME Hand Gears 516 Downeast ME Medium Scallop Dredge 564 Southern ME Inshore Lobster 517 Downeast ME Small Scallop Dredge 565 Southern ME Offshore Lobster 518 Downeast ME Surfclam, Ocean Quahog 566 Southern ME Large Bottom Trawl 519 Downeast ME Small Dredge 567 Southern ME Medium Bottom Trawl 520 Downeast ME Sink Gillnet 568 Southern ME Small Bottom Trawl 521 Downeast ME Diving Gear 569 Southern ME Large Scallop Dredge 522 Downeast ME Midwater Trawl 570 Southern ME Medium Scallop Dredge 523 Downeast ME Pots and Traps 571 Southern ME Small Scallop Dredge 524 Downeast ME Bottom Longline 572 Southern ME Surfclam, Ocean Quahog 525 Downeast ME Other Mobile Gear 573 Southern ME Small Dredge 526 Downeast ME Other Fixed Gear 574 Southern ME Sink Gillnet 527 Downeast ME Hand Gears 575 Southern ME Diving Gear 528 Upper Mid-Coast ME Inshore Lobster 576 Southern ME Midwater Trawl 529 Upper Mid-Coast ME Offshore Lobster 577 Southern ME Pots and Traps 530 Upper Mid-Coast ME Large Bottom Trawl 578 Southern ME Bottom Longline 531 Upper Mid-Coast ME Medium Bottom Trawl 579 Southern ME Other Mobile Gear 532 Upper Mid-Coast ME Small Bottom Trawl 580 Southern ME Other Fixed Gear 533 Upper Mid-Coast ME Large Scallop Dredge 581 Southern ME Hand Gears 534 Upper Mid-Coast ME Medium Scallop Dredge 582 NH Seacoast Inshore Lobster 535 Upper Mid-Coast ME Small Scallop Dredge 583 NH Seacoast Offshore Lobster 536 Upper Mid-Coast ME Surfclam, Ocean Quahog 584 NH Seacoast Large Bottom Trawl 537 Upper Mid-Coast ME Small Dredge 585 NH Seacoast Medium Bottom Trawl 538 Upper Mid-Coast ME Sink Gillnet 586 NH Seacoast Small Bottom Trawl 539 Upper Mid-Coast ME Diving Gear 587 NH Seacoast Large Scallop Dredge 540 Upper Mid-Coast ME Midwater Trawl 588 NH Seacoast Medium Scallop Dredge 541 Upper Mid-Coast ME Pots and Traps 589 NH Seacoast Small Scallop Dredge 542 Upper Mid-Coast ME Bottom Longline 590 NH Seacoast Surfclam, Ocean Quahog 543 Upper Mid-Coast ME Other Mobile Gear 591 NH Seacoast Small Dredge 544 Upper Mid-Coast ME Other Fixed Gear 592 NH Seacoast Sink Gillnet 545 Upper Mid-Coast ME Hand Gears 593 NH Seacoast Diving Gear 546 Lower Mid-Coast ME Inshore Lobster 594 NH Seacoast Midwater Trawl 547 Lower Mid-Coast ME Offshore Lobster 595 NH Seacoast Pots and Traps 548 Lower Mid-Coast ME Large Bottom Trawl 596 NH Seacoast Bottom Longline 549 Lower Mid-Coast ME Medium Bottom Trawl 597 NH Seacoast Other Mobile Gear 550 Lower Mid-Coast ME Small Bottom Trawl 598 NH Seacoast Other Fixed Gear 551 Lower Mid-Coast ME Large Scallop Dredge 599 NH Seacoast Hand Gears 552 Lower Mid-Coast ME Medium Scallop Dredge 600 Gloucester, North Shore Inshore Lobster 553 Lower Mid-Coast ME Small Scallop Dredge 601 Gloucester, North Shore Offshore Lobster 554 Lower Mid-Coast ME Surfclam, Ocean Quahog 602 Gloucester, North Shore Large Bottom Trawl 555 Lower Mid-Coast ME Small Dredge 603 Gloucester, North Shore Medium Bottom Trawl 556 Lower Mid-Coast ME Sink Gillnet 604 Gloucester, North Shore Small Bottom Trawl 557 Lower Mid-Coast ME Diving Gear 605 Gloucester, North Shore Large Scallop Dredge

25Page
Table 2. Industry/Commodity Codes - Continued Industry Code Description
Industry Code Description
606 Gloucester, North Shore Medium Scallop Dredge 654 New Bedford, South Shore Inshore Lobster 607 Gloucester, North Shore Small Scallop Dredge 655 New Bedford, South Shore Offshore Lobster 608 Gloucester, North Shore Surfclam, Ocean Quahog 656 New Bedford, South Shore Large Bottom Trawl 609 Gloucester, North Shore Small Dredge 657 New Bedford, South Shore Medium Bottom Trawl 610 Gloucester, North Shore Sink Gillnet 658 New Bedford, South Shore Small Bottom Trawl 611 Gloucester, North Shore Diving Gear 659 New Bedford, South Shore Large Scallop Dredge 612 Gloucester, North Shore Midwater Trawl 660 New Bedford, South Shore Medium Scallop Dredge 613 Gloucester, North Shore Pots and Traps 661 New Bedford, South Shore Small Scallop Dredge 614 Gloucester, North Shore Bottom Longline 662 New Bedford, South Shore Surfclam, Ocean Quahog 615 Gloucester, North Shore Other Mobile Gear 663 New Bedford, South Shore Small Dredge 616 Gloucester, North Shore Other Fixed Gear 664 New Bedford, South Shore Sink Gillnet 617 Gloucester, North Shore Hand Gears 665 New Bedford, South Shore Diving Gear 618 Boston Area Inshore Lobster 666 New Bedford, South Shore Midwater Trawl 619 Boston Area Offshore Lobster 667 New Bedford, South Shore Pots and Traps 620 Boston Area Large Bottom Trawl 668 New Bedford, South Shore Bottom Longline 621 Boston Area Medium Bottom Trawl 669 New Bedford, South Shore Other Mobile Gear 622 Boston Area Small Bottom Trawl 670 New Bedford, South Shore Other Fixed Gear 623 Boston Area Large Scallop Dredge 671 New Bedford, South Shore Hand Gears 624 Boston Area Medium Scallop Dredge 672 Rhode lsland Inshore Lobster 625 Boston Area Small Scallop Dredge 673 Rhode lsland Offshore Lobster 626 Boston Area Surfclam, Ocean Quahog 674 Rhode lsland Large Bottom Trawl 627 Boston Area Small Dredge 675 Rhode lsland Medium Bottom Trawl 628 Boston Area Sink Gillnet 676 Rhode lsland Small Bottom Trawl 629 Boston Area Diving Gear 677 Rhode lsland Large Scallop Dredge 630 Boston Area Midwater Trawl 678 Rhode lsland Medium Scallop Dredge 631 Boston Area Pots and Traps 679 Rhode lsland Small Scallop Dredge 632 Boston Area Bottom Longline 680 Rhode lsland Surfclam, Ocean Quahog 633 Boston Area Other Mobile Gear 681 Rhode lsland Small Dredge 634 Boston Area Other Fixed Gear 682 Rhode lsland Sink Gillnet 635 Boston Area Hand Gears 683 Rhode lsland Diving Gear 636 Cape and Islands Inshore Lobster 684 Rhode lsland Midwater Trawl 637 Cape and Islands Offshore Lobster 685 Rhode lsland Pots and Traps 638 Cape and Islands Large Bottom Trawl 686 Rhode lsland Bottom Longline 639 Cape and Islands Medium Bottom Trawl 687 Rhode lsland Other Mobile Gear 640 Cape and Islands Small Bottom Trawl 688 Rhode lsland Other Fixed Gear 641 Cape and Islands Large Scallop Dredge 689 Rhode lsland Hand Gears 642 Cape and Islands Medium Scallop Dredge 690 CT Sea Coast Inshore Lobster 643 Cape and Islands Small Scallop Dredge 691 CT Sea Coast Offshore Lobster 644 Cape and Islands Surfclam, Ocean Quahog 692 CT Sea Coast Large Bottom Trawl 645 Cape and Islands Small Dredge 693 CT Sea Coast Medium Bottom Trawl 646 Cape and Islands Sink Gillnet 694 CT Sea Coast Small Bottom Trawl 647 Cape and Islands Diving Gear 695 CT Sea Coast Large Scallop Dredge 648 Cape and Islands Midwater Trawl 696 CT Sea Coast Medium Scallop Dredge 649 Cape and Islands Pots and Traps 697 CT Sea Coast Small Scallop Dredge 650 Cape and Islands Bottom Longline 698 CT Sea Coast Surfclam, Ocean Quahog 651 Cape and Islands Other Mobile Gear 699 CT Sea Coast Small Dredge 652 Cape and Islands Other Fixed Gear 700 CT Sea Coast Sink Gillnet 653 Cape and Islands Hand Gears 701 CT Sea Coast Diving Gear

Page 26
Table 2. Industry/Commodity Codes - Continued Industry Code Description
Industry Code Description
701 CT Sea Coast Diving Gear 749 NJ South Large Scallop Dredge 702 CT Sea Coast Midwater Trawl 750 NJ South Medium Scallop Dredge 703 CT Sea Coast Pots and Traps 751 NJ South Small Scallop Dredge 704 CT Sea Coast Bottom Longline 752 NJ South Surfclam, Ocean Quahog 705 CT Sea Coast Other Mobile Gear 753 NJ South Small Dredge 706 CT Sea Coast Other Fixed Gear 754 NJ South Sink Gillnet 707 CT Sea Coast Hand Gears 755 NJ South Diving Gear 708 NY Inshore Lobster 756 NJ South Midwater Trawl 709 NY Offshore Lobster 757 NJ South Pots and Traps 710 NY Large Bottom Trawl 758 NJ South Bottom Longline 711 NY Medium Bottom Trawl 759 NJ South Other Mobile Gear 712 NY Small Bottom Trawl 760 NJ South Other Fixed Gear 713 NY Large Scallop Dredge 761 NJ South Hand Gears 714 NY Medium Scallop Dredge 762 DE Inshore Lobster 715 NY Small Scallop Dredge 763 DE Offshore Lobster 716 NY Surfclam, Ocean Quahog 764 DE Large Bottom Trawl 717 NY Small Dredge 765 DE Medium Bottom Trawl 718 NY Sink Gillnet 766 DE Small Bottom Trawl 719 NY Diving Gear 767 DE Large Scallop Dredge 720 NY Midwater Trawl 768 DE Medium Scallop Dredge 721 NY Pots and Traps 769 DE Small Scallop Dredge 722 NY Bottom Longline 770 DE Surfclam, Ocean Quahog 723 NY Other Mobile Gear 771 DE Small Dredge 724 NY Other Fixed Gear 772 DE Sink Gillnet 725 NY Hand Gears 773 DE Diving Gear 726 NJ North Inshore Lobster 774 DE Midwater Trawl 727 NJ North Offshore Lobster 775 DE Pots and Traps 728 NJ North Large Bottom Trawl 776 DE Bottom Longline 729 NJ North Medium Bottom Trawl 777 DE Other Mobile Gear 730 NJ North Small Bottom Trawl 778 DE Other Fixed Gear 731 NJ North Large Scallop Dredge 779 DE Hand Gears 732 NJ North Medium Scallop Dredge 780 MD West Inshore Lobster 733 NJ North Small Scallop Dredge 781 MD West Offshore Lobster 734 NJ North Surfclam, Ocean Quahog 782 MD West Large Bottom Trawl 735 NJ North Small Dredge 783 MD West Medium Bottom Trawl 736 NJ North Sink Gillnet 784 MD West Small Bottom Trawl 737 NJ North Diving Gear 785 MD West Large Scallop Dredge 738 NJ North Midwater Trawl 786 MD West Medium Scallop Dredge 739 NJ North Pots and Traps 787 MD West Small Scallop Dredge 740 NJ North Bottom Longline 788 MD West Surfclam, Ocean Quahog 741 NJ North Other Mobile Gear 789 MD West Small Dredge 742 NJ North Other Fixed Gear 790 MD West Sink Gillnet 743 NJ North Hand Gears 791 MD West Diving Gear 744 NJ South Inshore Lobster 792 MD West Midwater Trawl 745 NJ South Offshore Lobster 793 MD West Pots and Traps 746 NJ South Large Bottom Trawl 794 MD West Bottom Longline 747 NJ South Medium Bottom Trawl 795 MD West Other Mobile Gear 748 NJ South Small Bottom Trawl 796 MD West Other Fixed Gear

27Page
Table 2. Industry/Commodity Codes - Continued Industry Code Description
Industry Code Description
797 MD West Hand Gears 845 VA South Diving Gear 798 MD East Inshore Lobster 846 VA South Midwater Trawl 799 MD East Offshore Lobster 847 VA South Pots and Traps 800 MD East Large Bottom Trawl 848 VA South Bottom Longline 801 MD East Medium Bottom Trawl 849 VA South Other Mobile Gear 802 MD East Small Bottom Trawl 850 VA South Other Fixed Gear 803 MD East Large Scallop Dredge 851 VA South Hand Gears 804 MD East Medium Scallop Dredge 852 VA East Inshore Lobster 805 MD East Small Scallop Dredge 853 VA East Offshore Lobster 806 MD East Surfclam, Ocean Quahog 854 VA East Large Bottom Trawl 807 MD East Small Dredge 855 VA East Medium Bottom Trawl 808 MD East Sink Gillnet 856 VA East Small Bottom Trawl 809 MD East Diving Gear 857 VA East Large Scallop Dredge 810 MD East Midwater Trawl 858 VA East Medium Scallop Dredge 811 MD East Pots and Traps 859 VA East Small Scallop Dredge 812 MD East Bottom Longline 860 VA East Surfclam, Ocean Quahog 813 MD East Other Mobile Gear 861 VA East Small Dredge 814 MD East Other Fixed Gear 862 VA East Sink Gillnet 815 MD East Hand Gears 863 VA East Diving Gear 816 VA North Inshore Lobster 864 VA East Midwater Trawl 817 VA North Offshore Lobster 865 VA East Pots and Traps 818 VA North Large Bottom Trawl 866 VA East Bottom Longline 819 VA North Medium Bottom Trawl 867 VA East Other Mobile Gear 820 VA North Small Bottom Trawl 868 VA East Other Fixed Gear 821 VA North Large Scallop Dredge 869 VA East Hand Gears 822 VA North Medium Scallop Dredge 870 NC Central Large Bottom Trawl 823 VA North Small Scallop Dredge 871 NC Central Medium Bottom Trawl 824 VA North Surfclam, Ocean Quahog 872 NC Cental Small Bottom Trawl 825 VA North Small Dredge 873 NC Cental Large Scallop Dredge 826 VA North Sink Gillnet 874 NC Central Medium Scallop Dredge 827 VA North Diving Gear 875 NC Central Small Scallop Dredge 828 VA North Midwater Trawl 876 NC Central Surfclam, Ocean Quahog 829 VA North Pots and Traps 877 NC Central Small Dredge 830 VA North Bottom Longline 878 NC Central Sink Gillnet 831 VA North Other Mobile Gear 879 NC Central Diving Gear 832 VA North Other Fixed Gear 880 NC Central Midwater Trawl 833 VA North Hand Gears 881 NC Central Pots and Traps 834 VA South Inshore Lobster 882 NC Central Bottom Longline 835 VA South Offshore Lobster 883 NC Central Other Mobile Gear 836 VA South Large Bottom Trawl 884 NC Central Other Fixed Gear 837 VA South Medium Bottom Trawl 885 NC Central Hand Gears 838 VA South Small Bottom Trawl 886 NC South Inshore Lobster 839 VA South Large Scallop Dredge 887 NC South Offshore Lobster 840 VA South Medium Scallop Dredge 888 NC South Large Bottom Trawl 841 VA South Small Scallop Dredge 889 NC South Medium Bottom Trawl 842 VA South Surfclam, Ocean Quahog 890 NC South Small Bottom Trawl 843 VA South Small Dredge 891 NC South Large Scallop Dredge 844 VA South Sink Gillnet 892 NC South Medium Scallop Dredge

Page 28
Table 2. Industry/Commodity Codes - Continued Industry Code Description
Industry Code Description
893 NC South Small Scallop Dredge 941 CT Sea Coast Midwater Trawl, Bait 894 NC South Surfclam, Ocean Quahog 942 NY Midwater Trawl, Bait 895 NC South Small Dredge 943 NJ North Midwater Trawl, Bait 896 NC South Sink Gillnet 944 NJ South Midwater Trawl, Bait 897 NC South Diving Gear 945 DE Midwater Trawl, Bait 898 NC South Midwater Trawl 946 MD West Midwater Trawl, Bait 899 NC South Pots and Traps 947 MD East Midwater Trawl, Bait 900 NC South Bottom Longline 948 VA North Midwater Trawl, Bait 901 NC South Other Mobile Gear 949 VA South Midwater Trawl, Bait 902 NC South Other Fixed Gear 950 VA East Midwater Trawl, Bait 903 NC South Hand Gears 951 NC North Midwater Trawl, Bait 904 Downeast ME Seafood Dealer 952 NC Central Midwater Trawl, Bait 905 Upper Mid-Coast ME Seafood Dealer 953 NC South Midwater Trawl, Bait 906 Lower Mid-Coast ME Seafood Dealer 954 Downeast ME Medium Bottom Trawl, Bait 907 Southern ME Seafood Dealer 955 Upper Mid-Coast ME Medium Bottom Trawl, Bait 908 NH Seacoast Seafood Dealer 956 Lower Mid-Coast ME Medium Bottom Trawl, Bait 909 Gloucester, North Shore Seafood Dealer 957 Southern ME Medium Bottom Trawl, Bait 910 Boston Seafood Dealer 958 NH Seacoast Medium Bottom Trawl, Bait 911 Cape and Islands Seafood Dealer 959 Gloucester, North Shore Medium Bottom Trawl, Bait 912 New Beford, South Shore Seafood Dealer 960 Boston Medium Bottom Trawl, Bait 913 Rhode Island Seafood Dealer 961 Cape and Islands Medium Bottom Trawl, Bait 914 CT Sea Coast Seafood Dealer 962 New Beford, South Shore Medium Bottom Trawl, Bait 915 NY Seafood Dealer 963 Rhode Island Medium Bottom Trawl, Bait 916 NJ North Seafood Dealer 964 CT Sea Coast Medium Bottom Trawl, Bait 917 NJ South Seafood Dealer 965 NY Medium Bottom Trawl, Bait 918 DE Seafood Dealer 966 NJ North Medium Bottom Trawl, Bait 919 MD West Seafood Dealer 967 NJ South Medium Bottom Trawl, Bait 920 MD East Seafood Dealer 968 DE Medium Bottom Trawl, Bait 921 VA North Seafood Dealer 969 MD West Medium Bottom Trawl, Bait 922 VA South Seafood Dealer 970 MD East Medium Bottom Trawl, Bait 923 VA East Seafood Dealer 971 VA North Medium Bottom Trawl, Bait 924 NC North Seafood Dealer 972 VA South Medium Bottom Trawl, Bait 925 NC Central Seafood Dealer 973 VA East Medium Bottom Trawl, Bait 926 NC South Seafood Dealer 974 NC North Medium Bottom Trawl, Bait 927 Lower Mid-Coast ME Fish Exchange (Portland) 975 NC Central Medium Bottom Trawl, Bait 928 Gloucester Fish Exchange 976 NC South Medium Bottom Trawl, Bait 929 Boston Fish Exchange 977 Downeast ME Seafood Processing 930 New Bedford Fish Exchange 978 Upper Mid-Coast ME Seafood Processing 931 Downeast ME Midwater Trawl, Bait 979 Lower Mid-Coast ME Seafood Processing 932 Upper Mid-Coast ME Midwater Trawl, Bait 980 Southern ME Seafood Processing 933 Lower Mid-Coast ME Midwater Trawl, Bait 981 NH Seacoast Seafood Processing 934 Southern ME Midwater Trawl, Bait 982 Gloucester, North Shore Seafood Processing 935 NH Seacoast Midwater Trawl, Bait 983 Boston Seafood Processing 936 Gloucester, North Shore Midwater Trawl, Bait 984 Cape and Islands Seafood Processing 937 Boston Midwater Trawl, Bait 985 New Beford, South Shore Seafood Processing 938 Cape and Islands Midwater Trawl, Bait 986 Rhode Island Seafood Processing 939 New Beford, South Shore Midwater Trawl, Bait 987 CT Sea Coast Seafood Processing 940 Rhode Island Midwater Trawl, Bait 988 NY Seafood Processing

29Page
Table 2. Industry/Commodity Codes - Continued Industry Code Description
Industry Code Description
989 NJ North Seafood Processing 990 NJ South Seafood Processing 991 DE Seafood Processing 992 MD West Seafood Processing 993 MD East Seafood Processing 994 VA North Seafood Processing 995 VA South Seafood Processing 996 VA East Seafood Processing 997 NC North Seafood Processing 998 NC Central Seafood Processing 999 NC South Seafood Processing

Page 30
Table 3. Cost-Earnings Data Sources Harvesting Sectors Data Sources 1. Inshore Lobster Variable costs, fixed costs, and crew payments from focus group
surveys conducted by URI study (see Anonymous, 1995). 2. Offshore Lobster Variable costs, fixed costs, and crew payments from focus group
surveys conducted by URI study (see Anonymous, 1995). 3. Large Bottom Trawl 4. Medium Bottom Trawl 5. Small Bottom Trawl
Variable costs from Northeast observer data, 2001 adjusted fixed costs from raw URI CMER study data (see Lallemand et. al. 1998 and Lallemand et. al. 1999), and gross stock estimates from Northeast dealer data that pertained only to those vessels that were surveyed by the CMER study
6. Large Scallop Dredge 7. Medium Scallop Dredge 8. Small Scallop Dredge
All cost and earnings data obtained from UMASS Dartmouth study (see Georgianna, Cass, and Amaral 1999).
9. Surfclam, Ocean Quahog Dredge
Medium scallop dredge cost-earnings data as proxy
10. Sink Gillnet Variable costs from Northeast observer data, fixed costs and value-added proportions from bottom longline data
11. Diving Gear Southern inshore lobster as proxy 12. Midwater Trawl Medium bottom trawl as proxy 13. Fish Pots and Traps Southern inshore lobster as proxy 14. Bottom Longline Variable costs from Northeast observer data, 2001 adjusted fixed
costs from raw UMASS CMER study data (see Georgianna et. al. 1998), and gross stock estimates from Northeast dealer data that pertained only to those vessels that were surveyed by the CMER study
15. Other Mobile Gear Medium bottom trawl as proxy 16. Other Fixed Gear Sink gillnet as proxy 17. Hand Gear All cost and earnings data obtained from raw UMASS CMER study
data (see Georgianna et. al. 1998) 18. Small Dredge Small scallop dredge as proxy Wholesale Seafood Dealers Production function obtained from VIMS CMER study (see Kirkley,
Ryan, and Duberg 2004) Fish Exchanges/Auctions 2001 adjusted variable costs, fixed costs, and value-added
proportions estimated for Fulton Market in the VIMS CMER study (see Kirkley, Ryan, and Duberg 2004)
Seafood Processors 2001 sub-regional defaults for IMPLAN sector 71 (seafood product preparation and packaging)

31Page
Ta
ble
4. C
omm
erci
al F
ishi
ng P
rodu
ctio
n Fu
nctio
ns
Exp
endi
ture
Cat
egor
ies
Nor
ther
n In
shor
e L
obst
er
Sout
hern
In
shor
e L
obst
er
Off
shor
eL
obst
er
Lar
geB
otto
mT
raw
l
Med
ium
B
otto
mT
raw
l
Smal
lB
otto
mT
raw
l
Lar
geSc
allo
p D
redg
e
Med
ium
Sc
allo
p D
redg
e
Smal
lSc
allo
p D
redg
e
Surf
clam
Oce
an
Qua
hog
Dre
dgeb
Perc
enta
ge D
istr
ibut
ion
Mis
cella
neou
s trip
supp
lies
1.72
%
3.95
%
1.26
%
0.95
%
2.02
%
1.57
%
0.70
%
0.52
%
0.52
%
0.52
%
Rep
air &
mai
nten
ance
: fis
hing
gea
r 5.
66%
4.
34%
4.
41%
3.
03%
2.
27%
3.
93%
8.
41%
5.
76%
4.
91%
5.
76%
R
epai
r & m
aint
enan
ce: v
esse
l & e
ngin
e
By
Yar
d 1.
69%
0.
40%
4.
20%
3.
17%
4.
06%
3.
50%
3.
43%
3.
35%
3.
14%
3.
35%
B
y O
wne
r 3.
04%
4.
17%
2.
10%
0.
00%
0.
00%
0.
00%
0.
00%
0.
00%
0.
00%
0.
00%
R
epai
r & m
aint
enan
ce: e
lect
roni
cs
0.00
%
0.00
%
0.00
%
0.56
%
0.61
%
1.13
%
1.04
%
0.72
%
0.79
%
0.72
%
Gro
cerie
s 0.
21%
0.
41%
3.78
%2.
12%
2.69
%
2.52
%
2.64
%
1.56
%
0.84
%
1.56
%
Fuel
& lu
bric
ants
4.
87%
6.
44%
7.
35%
11
.32%
10
.16%
9.
84%
15
.57%
27
.74%
6.
12%
27
.74%
Ic
e 0.
00%
0.
00%
0.00
%2.
48%
2.29
%
3.29
%
1.90
%
8.32
%
1.36
%
8.32
%
Load
ing,
unl
oadi
ng
0.00
%
0.00
%
0.00
%
1.11
%
0.72
%
1.39
%
1.81
%
0.78
%
1.99
%
0.78
%
Moo
rage
, doc
kage
, hau
lout
1.
03%
2.
48%
0.
53%
3.
00%
3.
12%
4.
41%
2.
60%
1.
24%
1.
70%
1.
24%
Li
cens
es, p
erm
its
0.29
%
0.35
%
0.11
%
0.26
%
0.27
%
0.60
%
0.30
%
0.18
%
1.26
%
0.18
%
Bus
ines
s ass
ocia
tions
0.
00%
0.00
%
0.00
%
0.19
%
0.22
%
0.69
%
0.21
%
0.14
%
1.41
%
0.14
%
Con
sign
men
t 0.
00%
0.
00%
0.00
%0.
27%
0.86
%
0.72
%
0.45
%
0.95
%
1.02
%
0.95
%
Prof
essi
onal
fees
0.
00%
0.
00%
0.
00%
0.
76%
0.
73%
1.
20%
1.
08%
0.
67%
0.
00%
0.
67%
B
oat i
nsur
ance
2.
29%
2.
09%
3.
15%
4.
29%
3.
77%
1.
59%
6.
32%
5.
50%
2.
53%
5.
50%
C
rew
insu
ranc
e (lo
bste
r ves
sels
) 0.
49%
0.
28%
4.
10%
0.
00%
0.
00%
0.
00%
0.
00%
0.
00%
0.
00%
0.
00%
In
tere
st p
aym
ent:
shor
t ter
m lo
an
0.09
%
2.15
%
0.11
%
0.00
%
0.00
%
0.00
%
0.00
%
0.00
%
0.00
%
0.00
%
Inte
rest
pay
men
t: ve
ssel
1.
81%
0.
37%
2.
84%
1.
03%
1.
92%
1.
13%
2.
09%
0.
42%
0.
77%
0.
42%
Sh
oref
ront
pro
perty
exp
ense
s R
ent (
40%
) 0.
35%
0.
79%
0.
00%
0.
18%
0.
33%
0.
54%
0.
11%
0.
30%
0.
24%
0.
30%
U
tiliti
es (2
0%)
0.18
%
0.40
%
0.00
%
0.09
%
0.17
%
0.27
%
0.05
%
0.15
%
0.12
%
0.15
%
Supp
lies (
30%
) 0.
26%
0.
60%
0.
00%
0.
13%
0.
25%
0.
41%
0.
08%
0.
23%
0.
18%
0.
23%
A
dver
tisin
g (1
0%)
0.09
%
0.20
%
0.00
%
0.04
%
0.08
%
0.14
%
0.03
%
0.08
%
0.06
%
0.08
%
Veh
icle
3.28
%
3.41
%
1.26
%
0.73
%
1.02
%
2.23
%
0.82
%
0.68
%
4.75
%
0.68
%
Boa
t prin
cipa
l pay
men
t 5.
43%
1.
26%
3.
66%
2.
48%
2.
81%
3.
56%
5.
12%
1.
02%
1.
35%
1.
02%
Sh
ort t
erm
loan
prin
cipa
l pay
men
t 0.
28%
7.
53%
0.
13%
0.
00%
0.
00%
0.
00%
0.
00%
0.
00%
0.
00%
0.
00%
B
ank
serv
ice
char
ge
0.11
%
0.33
%
0.07
%
0.07
%
0.09
%
0.09
%
0.10
%
0.02
%
0.03
%
0.02
%
Gea
r rep
lace
men
t (lo
bste
r ves
sels
) 7.
93%
7.
95%
3.
85%
0.
00%
0.
00%
0.
00%
0.
00%
0.
00%
0.
00%
0.
00%
B
ait
12.1
1%
11.9
6%10
.54%
0.00
%0.
00%
0.
00%
0.
00%
0.
00%
0.
00%
0.
00%
M
isce
llane
ous e
xpen
ses
0.00
%
0.00
%
0.00
%
0.52
%
1.76
%
3.16
%
0.00
%
0.00
%
0.00
%
0.00
%
Taxe
s 0.
59%
0.
04%
0.09
%0.
25%
0.26
%
0.47
%
0.88
%
0.97
%
5.05
%
0.97
%
Empl
oyee
com
pens
atio
na 14
.00%
16
.00%
37.8
7%54
.88%
46.7
9%35
.87%
38
.91%
32
.28%
38
.33%
32
.28%
Pr
oprie
tary
inco
me
32.2
1%
22.1
1%
8.59
%
6.09
%
10.7
1%
15.7
6%
5.34
%
6.40
%
21.5
3%
6.40
%
Tota
l10
0.00
%
100.
00%
10
0.00
%
100.
00%
10
0.00
%
100.
00%
10
0.00
%
100.
00%
10
0.00
%
100.
00%
aIn
clud
es c
apta
in a
nd c
rew
insu
ranc
e pa
ymen
ts m
ade
by a
ll ve
ssel
ow
ners
exc
ept l
obst
er v
esse
l ow
ners
. C
rew
insu
ranc
e pa
id b
y lo
bste
r ves
sel o
wne
rs is
incl
uded
in th
e ca
tego
ry
crew
insu
ranc
e (lo
bste
r ves
sels
). b
The
perc
enta
ge d
istri
butio
n of
exp
endi
ture
s for
the
med
ium
scal
lop
dred
ge se
ctor
was
use
d to
repr
esen
t the
pur
chas
ing
activ
ities
of t
he su
rfcl
am, o
cean
qua
hog
dred
ge se
ctor
.

Page 32
Tabl
e 4.
Com
mer
cial
Fis
hing
Pro
duct
ion
Func
tions
- C
ontin
ued
Exp
endi
ture
Cat
egor
ies
Sink
Gill
net
Div
ing
Gea
rcM
idw
ater
T
raw
ld
Fish
Pot
s an
dT
raps
eB
otto
mL
ongl
ine
Oth
er
Mob
ileG
earf
Oth
er
Fixe
d G
earg
Han
dG
ear
Smal
lD
redg
eh
Perc
enta
ge D
istr
ibut
ion
Mis
cella
neou
s trip
supp
lies
0.82
%5.
85%
2.02
%
3.95
%
1.65
%
2.02
%
0.82
%
0.98
%
0.52
%
Rep
air &
mai
nten
ance
: fis
hing
gea
r 8.
44%
4.
86%
2.27
%
4.34
%
7.30
%
2.27
%
8.44
%
3.87
%
4.91
%
Rep
air &
mai
nten
ance
: ves
sel &
eng
ine
0.
00%
By
Yar
d 8.
47%
0.44
%4.
06%
0.
40%
6.
02%
4.
06%
8.
47%
11
.13%
3.
14%
B
y O
wne
r 0.
00%
4.66
%0.
00%
4.
17%
0.
00%
0.
00%
0.
00%
0.
00%
0.
00%
R
epai
r & m
aint
enan
ce: e
lect
roni
cs
1.49
%0.
00%
0.61
%
0.00
%
1.69
%
0.61
%
1.49
%
2.34
%
0.79
%
Gro
cerie
s 0.
94%
0.
46%
2.69
%
0.41
%
0.56
%
2.69
%
0.94
%
2.04
%
0.84
%
Fuel
& lu
bric
ants
2.
59%
7.21
%10
.16%
6.
44%
3.
39%
10
.16%
2.
59%
8.
07%
6.
12%
Ic
e 1.
21%
0.
00%
2.29
%
0.00
%
1.21
%
2.29
%
1.21
%
0.98
%
1.36
%
Load
ing,
unl
oadi
ng
0.39
%0.
00%
0.72
%
0.00
%
0.17
%
0.72
%
0.39
%
0.71
%
1.99
%
Moo
rage
, doc
kage
, hau
lout
5.
36%
2.77
%3.
12%
2.
48%
5.
53%
3.
12%
5.
36%
6.
88%
1.
70%
Li
cens
es, p
erm
its
0.60
%0.
39%
0.27
%
0.35
%
0.62
%
0.27
%
0.60
%
2.11
%
1.26
%
Bus
ines
s ass
ocia
tions
0.
33%
0.00
%0.
22%
0.
00%
0.
34%
0.
22%
0.
33%
0.
50%
1.
41%
C
onsi
gnm
ent
0.00
%
0.00
%0.
86%
0.
00%
0.
14%
0.
86%
0.
00%
0.
00%
1.
02%
Pr
ofes
sion
al fe
es
0.95
%0.
00%
0.73
%
0.00
%
0.98
%
0.73
%
0.95
%
1.38
%
0.00
%
Boa
t ins
uran
ce
5.61
%2.
34%
3.77
%
2.09
%
4.06
%
3.77
%
5.61
%
5.12
%
2.53
%
Cre
w in
sura
nce
(lobs
ter v
esse
ls)
0.00
%0.
32%
0.00
%
0.28
%
0.00
%
0.00
%
0.00
%
0.00
%
0.00
%
Inte
rest
pay
men
t: sh
ort t
erm
loan
0.
00%
2.40
%0.
00%
2.
15%
0.
00%
0.
00%
0.
00%
0.
00%
0.
00%
In
tere
st p
aym
ent:
vess
el
3.58
%0.
42%
1.92
%
0.37
%
2.82
%
1.92
%
3.58
%
5.13
%
0.77
%
Shor
efro
nt p
rope
rty e
xpen
ses
0.00
%
R
ent (
40%
) 0.
32%
0.89
%0.
33%
0.
79%
0.
33%
0.
33%
0.
32%
0.
56%
0.
24%
U
tiliti
es (2
0%)
0.16
%0.
44%
0.17
%
0.40
%
0.16
%
0.17
%
0.16
%
0.28
%
0.12
%
Supp
lies (
30%
) 0.
24%
0.67
%0.
25%
0.
60%
0.
25%
0.
25%
0.
24%
0.
42%
0.
18%
A
dver
tisin
g (1
0%)
0.08
%0.
22%
0.08
%
0.20
%
0.08
%
0.08
%
0.08
%
0.14
%
0.06
%
Veh
icle
3.14
%3.
82%
1.02
%
3.41
%
3.23
%
1.02
%
3.14
%
6.42
%
4.75
%
Boa
t prin
cipa
l pay
men
t 9.
12%
1.41
%2.
81%
1.
26%
6.
57%
2.
81%
9.
12%
11
.97%
1.
35%
Sh
ort t
erm
loan
prin
cipa
l pay
men
t 0.
00%
8.43
%0.
00%
7.
53%
0.
00%
0.
00%
0.
00%
0.
00%
0.
00%
B
ank
serv
ice
char
ge
0.18
%0.
37%
0.09
%
0.33
%
0.13
%
0.09
%
0.18
%
0.24
%
0.03
%
Gea
r rep
lace
men
t (lo
bste
r ves
sels
) 0.
00%
8.90
%0.
00%
7.
95%
0.
00%
0.
00%
0.
00%
0.
00%
0.
00%
B
ait
0.00
%
0.00
%0.
00%
11
.96%
4.
86%
0.
00%
0.
00%
2.
22%
0.
00%
M
isce
llane
ous e
xpen
ses
0.00
%0.
00%
1.76
%
0.00
%
1.46
%
1.76
%
0.00
%
0.00
%
0.00
%
Taxe
s 9.
58%
0.
05%
0.26
%
0.04
%
9.86
%
0.26
%
9.58
%
4.47
%
5.05
%
Empl
oyee
com
pens
atio
n 30
.01%
17.9
1%
46.7
9%
16.0
0%
30.4
7%
46.7
9%
30.0
1%
18.2
2%
38.3
3%
Prop
rieta
ry in
com
e 6.
38%
24.7
6%
10.7
1%
22.1
1%
6.11
%
10.7
1%
6.38
%
3.83
%
21.5
3%
Tota
l10
0.00
%10
0.00
%
100.
00%
10
0.00
%
100.
00%
10
0.00
%
100.
00%
10
0.00
%
100.
00%
cTh
e di
strib
utio
n of
exp
endi
ture
s for
the
sout
hern
insh
ore
lobs
ter s
ecto
r wer
e us
ed a
s pro
xy v
alue
s for
the
divi
ng g
ear s
ecto
r. d
The
perc
enta
ge d
istri
butio
n of
exp
endi
ture
s for
med
ium
bot
tom
traw
ls w
as u
sed
to re
pres
ent t
he p
urch
asin
g ac
tiviti
es o
f the
mid
wat
er tr
awl s
ecto
r. e
The
dist
ribut
ion
of e
xpen
ditu
res a
ssoc
iate
d w
ith th
e so
uthe
rn in
shor
e lo
bste
r sec
tor w
as u
sed
to re
pres
ent t
he e
xpen
ditu
res o
f the
fish
pot
s and
trap
s sec
tor.
fTh
e pe
rcen
tage
dis
tribu
tion
of e
xpen
ditu
res f
or m
ediu
m b
otto
m tr
awls
was
use
d to
repr
esen
t the
pur
chas
ing
activ
ities
of t
he o
ther
mob
ile g
ear s
ecto
r. g
The
dist
ribut
ion
of e
xpen
ditu
res f
or th
e si
nk g
illne
t sec
tor w
as u
sed
to c
hara
cter
ize
the
indu
stry
pur
chas
es fo
r the
oth
er fi
xed
gear
sect
or.
h T
he p
erce
ntag
e di
strib
utio
n of
exp
endi
ture
s for
the
smal
l sca
llop
dred
ge se
ctor
was
use
d to
repr
esen
t the
exp
endi
ture
s of t
he sm
all d
redg
e se
ctor
.

33Page
Table 5. Seafood Wholesale and Fish Exchange/Auction House Production Functions
Seafood Fish Wholesale Exchange/Expenditure Categories Dealer Auction Percentage DistributionIce 2.80% 3.00%Packaging: boxes 2.70% 2.94%Shipping 4.10% 0.00% Storage 14.70% 22.88%Advertising 4.00% 4.40%Rent 6.80% 0.00%Repair & Maintenance: building 6.90% 5.30%Vehicle 4.10% 0.00%Utilities: electric 1.37% 1.49%Utilities: gas 1.37% 1.49%Utilities: telephone 1.37% 1.49%Insurance 4.10% 6.64%Professional fees 0.70% 0.76%Building principal payment 4.00% 7.41% Interest payment: building 1.40% 1.20%Bank service charge 0.08% 0.30%Taxes 2.12% 0.00%Employee compensation 33.35% 40.70%Proprietary income 4.05% 0.00%Total 100.00% 100.00%

Page 34
Table 6. IMPLAN Pro Tables Table Name Description Category
*Industry/Commodity Codes Codes (Modified)
*Type Codes Codes (Modified)
Margins Codes Codes
1
*US Absorption Table *US Absorption Totals *US Byproducts Table
Raw input data (Modified)
*SACommodity Sales *SAEmployment *SAFinal Demands *SAForeign Exports *SAOutput *SAValue Added
Raw input study area data (Modified)
SATransfers Raw input study area data
*Observed RPCs Raw input data (Modified)
*RPC Methods Raw input data (Modified)
Margins Raw input data
*Deflators Raw input data (Modified)
2
General Information Model-building information
Model Specs Multiplier Specs
Model-building information
SARatios Ratios for impact and multiplier calculations
3
IMCommodity Transactions IMEvents IMFactor Transactions IMGroups IMIndustry Transactions IMInstitutions Transactions IMMargins IMProjects
Impact report data (Empty before impact analysis)
Regional Absorption Regional Byproducts Regional Commodity Balances Regional Direct Institutional Requirements Regional Factor Balances Regional Industry Balances Regional Institution Balances Regional Institution Demand Regional IxI Regional Market Shares Regional Multipliers Induced Regional Multipliers Type I Regional SAM Balances Regional SAM Balances Aggregated Regional SAM Balances Industry Detail Regional SAM Balances IxI Regional SAM Balances IxI Industry Detail Regional Sam Distribution Regional Value Added Coefficients
Output/report data for regional I-O model (Empty before ‘Construct Model’)
rptEC Multipliers rptEmployment Multipliers rptIBT Multipliers rptOPTI Multipliers rptOutput Multipliers rptPersonal Income Multipliers rptPropInc Multipliers rptTotal VA Multipliers
Output reports
*rptSAFinal Demands Data from SAFinal Demands and SAForeign Exports (Modified)
*rptSAIndustry Data Data from SAOutput, SAEmployment & SAValue Added (Modified)
SAM Rollup SAM report data
Tax Impacts Tax report data
Type Code Rollup Type code report data
CGE Account Output data for computable general equilibrium models
4

35Page
Table 7. Summary of IMPLAN Modification Procedure
General Steps forModel Construction
General Instruction
1 In IMPLAN, select new model, name the new model, locate the relevant regional data, build study area
2 Open the new model in ACCESS 3 Delete the three US tables and the Observed RPCs table 4 Import the three US tables and the Observed RPCs table from 01NAT509 5 Export the default data in the 16 ACCESS tables that will be modified to EXCEL 6 Delete all default data in the 16 ACCESS tables 7 Create 16 new tables with modified data in Excel 8 Import the 16 updated tables from EXCEL into ACCESS 9 In IMPLAN, reconstruct the model and multipliers
Table 8. Industry Sectors Purchasing from the Default Commercial Fishing Sector (Sector 16)
Industry Sector Description IMPLAN Sector Purchases Reassigned to
Rendering and meat byproduct processing 69 Seafood processing
Seafood product preparation and packaging 71 Wholesale seafood dealers
Water Transportation 393 Wholesale seafood dealers
Hospitals 467 Seafood processing
Nursing and residential care facilities 468 Seafood processing
Other amusement- gambling- and recreation industries 478 Seafood processing
Hotels and motels- including casinos 479 Wholesale seafood dealers
Other accommodations 480 Seafood processing
Food services and drinking places 481 Wholesale seafood dealers
Civic- social- professional and similar organizations 493 Seafood processing
Other Federal government enterprises 496 Seafood processing

Page 36
Table 9. Industry Sectors Purchasing from the Default Seafood Processing Sector (Sector 71)
Industry Sector Description IMPLAN Sector
Dog and cat food manufacturing 46
Other animal food manufacturing 47
Fats and oils refining and blending 54
Frozen food manufacturing 60
Meat processed from carcasses 68
Frozen cakes and other pastries manufacturing 72
Bread and bakery product- except frozen- manufacturing 73
Cookie and cracker manufacturing 74
Soft drink and ice manufacturing 85
Leather and hide tanning and finishing 109
Petroleum refineries 142
Petroleum lubricating oil and grease manufacturing 145
Water transportation 393
Scenic and sightseeing transportation and support 397
Advertising and related services 447
Hospitals 467
Nursing and residential care facilities 468
Social assistance- except child day care services 470
Museums- historical sites- zoos- and parks 475
Fitness and recreational sports centers 476
Other amusement- gambling- and recreation industries 478
Hotels and motels- including casinos 479
Other accommodations 480
Food services and drinking places 481
Civic- social- professional and similar organizations 493
Other Federal government enterprises 496

37Page
Tabl
e 10
. To
tal N
ew E
ngla
nd C
oast
al R
egio
n Sa
les I
mpa
cts (
2003
$'s)
D
owne
ast
Upp
er M
id-C
oast
Low
er M
id-C
oast
Sout
hern
NH
Sea
coas
tG
louc
este
r
Bos
ton
C
ape
& Is
land
s
New
Bed
ford
R
hode
Isla
nd
CT
Seac
oast
N
on-M
ariti
me
To
tal
Sect
or
M
E
M
EM
E
M
E
N
H
MA
MA
M
A
M
A
R
I
C
T
New
Eng
land
N
ew E
ngla
ndC
omm
erci
al F
ishi
ngIn
shor
e Lo
bste
r Tra
ps0
00
00
00
00
00
00
Offs
hore
Lob
ster
Tra
ps0
00
00
00
00
00
00
Larg
e Bo
ttom
Tra
wl
00
00
00
00
00
00
0M
ediu
m B
otto
m T
raw
l0
-500
,000
-500
,000
-500
,000
-500
,000
-500
,000
-500
,000
-500
,000
-500
,000
-500
,000
-500
,000
0-5
,000
,000
Smal
l Bot
tom
Tra
wl
00
00
00
00
00
00
0La
rge
Scal
lop
Dre
dge
00
00
00
00
00
00
0M
ediu
m S
callo
p D
redg
e0
00
00
00
00
00
00
Smal
l Sca
llop
Dre
dge
00
00
00
00
00
00
0Su
rf C
lam
, Oce
an Q
uaho
g D
redg
e0
00
00
00
00
00
00
Smal
l Dre
dge
00
00
00
00
00
00
0Si
nk G
illne
t0
00
00
00
00
00
00
Div
ing
Gea
r0
00
00
00
00
00
00
Mid
wat
er T
raw
l0
00
00
00
00
00
00
Fish
Pot
s an
d Tr
aps
00
00
00
00
00
00
0Bo
ttom
Lon
glin
e0
00
00
00
00
00
00
Oth
er M
obile
Gea
r0
00
00
00
00
00
00
Oth
er F
ixed
Gea
r0
00
00
00
00
00
00
Han
d G
ears
00
00
00
00
00
00
0Ag
ricul
ture
-8,6
49-1
,665
-3,3
84-1
,070
-1,2
90-6
60-1
,658
-538
-605
-1,8
18-5
,162
-197
,059
-223
,557
Min
ing
0-1
-2-1
-2-1
29-5
97-4
1-9
5-4
-1,1
85-1
4,22
6-1
6,28
5Tr
ansp
orta
tion,
Com
mun
icat
ions
and
Pub
lic U
tiliti
es-7
08-1
,475
-12,
365
-1,4
03-1
5,20
3-1
0,00
9-8
9,56
2-3
,876
-9,4
13-2
1,87
5-5
5,70
6-3
54,3
69-5
75,9
64W
ater
Tra
nspo
rtatio
n0
-2,7
56-1
,859
-1,6
92-1
,136
-433
-20,
688
-9,0
18-1
,473
-4,3
90-3
7,58
7-2
8,73
8-1
09,7
70W
areh
ousi
ng a
nd s
tora
ge-8
-13
-1,6
66-1
52-2
,027
-714
-6,0
66-1
0-1
,116
-869
-2,2
20-2
4,33
1-3
9,19
0C
onst
ruct
ion
-117
-808
-2,9
96-8
08-3
,046
-2,2
66-1
5,61
5-1
,456
-1,5
24-2
,901
-8,5
78-4
7,51
2-8
7,62
7M
anuf
actu
ring
-235
-1,0
09-1
1,64
6-3
,500
-17,
517
-15,
736
-52,
163
-1,2
07-8
,214
-16,
211
-47,
971
-363
,503
-538
,911
Seaf
ood
Proc
essi
ng-1
15,9
66-4
97,7
79-1
93,3
63-7
7,48
4-7
07,7
40-1
,483
,438
-997
,031
-2,5
86-7
25,6
66-4
08,5
14-3
46,8
270
-5,5
56,3
95Ic
e0
-73
-952
-12
-961
-323
-6,2
83-2
77-1
,081
-2,7
47-8
24-1
3,56
4-2
7,09
8Bo
at B
uild
ing
-67
-2,2
95-9
09-2
8-1
94-6
4-1
,298
-77
-151
-13,
343
-479
-5,4
66-2
4,37
0Pa
perb
oard
Con
tain
ers
00
-131
-25
-212
-493
-1,1
200
-440
-591
-1,1
48-9
,009
-13,
170
Trad
e-4
91-2
,641
-13,
129
-3,1
15-1
9,85
7-1
2,74
9-6
0,75
1-6
,413
-10,
399
-15,
259
-44,
757
-237
,818
-427
,381
Seaf
ood
Dea
lers
0-2
2,71
8-2
7,44
2-5
27-2
60,1
31-3
8,10
4-1
81,6
36-8
5,78
4-1
43,0
17-1
98,8
03-2
00,0
000
-1,1
58,1
61Fi
sh E
xcha
nges
/ Au
ctio
ns0
0-1
16,7
680
0-3
5,59
1-8
,496
0-3
5,21
80
00
-196
,072
Who
lesa
le T
rade
-239
-1,8
76-1
4,22
3-1
,440
-31,
376
-20,
737
-158
,932
-2,6
57-1
2,45
7-2
0,34
4-7
6,00
7-3
35,6
32-6
75,9
19Fi
nanc
e, In
sura
nce
and
Rea
l Est
ate
-129
-1,5
61-1
7,49
1-1
,164
-19,
360
-11,
383
-167
,205
-4,5
23-4
,719
-25,
443
-85,
495
-323
,129
-661
,602
Serv
ices
-1,4
62-8
,073
-48,
618
-9,9
50-6
1,76
2-4
8,75
1-3
83,1
48-2
0,04
9-2
9,62
3-7
2,71
2-1
99,5
51-9
44,6
07-1
,828
,306
Gov
ernm
ent
-347
-1,6
54-7
,407
-4,5
88-1
2,23
6-1
1,23
3-6
1,99
0-4
,259
-6,9
49-1
3,78
8-3
7,74
7-1
92,3
25-3
54,5
23To
tal
-128
,418
-1,0
46,3
97-9
74,3
50-6
06,9
59-1
,654
,050
-2,1
92,8
12-2
,714
,238
-642
,772
-1,4
92,1
61-1
,319
,611
-1,6
51,2
45-3
,091
,288
-17,
514,
301
Sale
s ($
's)

Page 38
Tabl
e 11
. To
tal M
id-A
tlant
ic C
oast
al R
egio
n Sa
les I
mpa
cts (
2003
$'s)
N
Y Se
acoa
st
NJ
Nor
thN
J So
uth
DE
Stat
eM
D W
est
MD
Eas
tVA
Nor
thVA
Sou
thVA
Eas
tN
C N
orth
NC
Cen
tral
NC
Sou
thN
on-M
ariti
me
Tota
lSe
ctor
NY
N
J
NJ
D
E
M
D
M
D
VA
VA
VA
N
C
N
C
N
C
M
id-A
tlant
ic
M
id-A
tlant
icC
omm
erci
al F
ishi
ngIn
shor
e Lo
bste
r Tra
ps0
00
00
00
00
00
00
0O
ffsho
re L
obst
er T
raps
00
00
00
00
00
00
00
Larg
e Bo
ttom
Tra
wl
00
00
00
00
00
00
00
Med
ium
Bot
tom
Tra
wl
-500
,000
00
00
00
00
00
00
-500
,000
Smal
l Bot
tom
Tra
wl
00
00
00
00
00
00
00
Larg
e Sc
allo
p D
redg
e0
00
00
00
00
00
00
0M
ediu
m S
callo
p D
redg
e0
00
00
00
00
00
00
0Sm
all S
callo
p D
redg
e0
00
00
00
00
00
00
0Su
rf C
lam
, Oce
an Q
uaho
g D
redg
e0
00
00
00
00
00
00
0Sm
all D
redg
e0
00
00
00
00
00
00
0Si
nk G
illne
t0
00
00
00
00
00
00
0D
ivin
g G
ear
00
00
00
00
00
00
00
Mid
wat
er T
raw
l0
00
00
00
00
00
00
0Fi
sh P
ots
and
Trap
s0
00
00
00
00
00
00
0Bo
ttom
Lon
glin
e0
00
00
00
00
00
00
0O
ther
Mob
ile G
ear
00
00
00
00
00
00
00
Oth
er F
ixed
Gea
r0
00
00
00
00
00
00
0H
and
Gea
rs0
00
00
00
00
00
00
0Ag
ricul
ture
-2,9
97-2
,930
-20,
829
00
00
00
00
0-1
9,17
7-4
5,93
3M
inin
g-9
,610
-1,6
39-2
110
00
00
00
00
-1,3
84-1
2,84
4Tr
ansp
orta
tion,
Com
mun
icat
ions
and
Pub
lic U
tiliti
es-3
92,8
66-1
67,9
51-1
29,8
290
00
00
00
00
-34,
486
-725
,131
Wat
er T
rans
porta
tion
-96,
893
-49,
461
-18,
195
00
00
00
00
0-2
,797
-167
,346
War
ehou
sing
and
sto
rage
-9,2
86-1
8,79
3-1
0,87
80
00
00
00
00
-2,3
68-4
1,32
4C
onst
ruct
ion
-38,
615
-12,
555
-15,
388
00
00
00
00
0-4
,624
-71,
181
Man
ufac
turin
g-1
30,4
88-1
70,2
94-1
49,2
170
00
00
00
00
-35,
375
-485
,374
Seaf
ood
Proc
essi
ng-4
22,8
59-2
,868
-4,1
600
00
00
00
00
0-4
29,8
86Ic
e-7
,613
-1,3
81-3
,278
00
00
00
00
0-1
,320
-13,
592
Boat
Bui
ldin
g-5
5-1
5-9
,345
00
00
00
00
0-5
32-9
,948
Pape
rboa
rd C
onta
iner
s-2
,019
-2,9
63-1
,649
00
00
00
00
0-8
77-7
,508
Trad
e-1
65,4
15-7
5,63
1-8
6,90
90
00
00
00
00
-23,
143
-351
,098
Seaf
ood
Dea
lers
-225
,697
-3,2
56-2
520
00
00
00
00
0-2
29,2
04Fi
sh E
xcha
nges
/ Au
ctio
ns0
00
00
00
00
00
00
0W
hole
sale
Tra
de-4
07,0
85-2
06,2
30-1
66,3
710
00
00
00
00
-32,
662
-812
,348
Fina
nce,
Insu
ranc
e an
d R
eal E
stat
e-6
52,4
62-1
61,7
66-1
01,6
840
00
00
00
00
-31,
446
-947
,358
Serv
ices
-1,0
61,5
22-3
35,5
26-3
44,9
640
00
00
00
00
-91,
925
-1,8
33,9
38G
over
nmen
t-2
19,9
39-6
9,44
0-6
8,12
60
00
00
00
00
-18,
716
-376
,222
Tota
l-4
,345
,419
-1,2
82,7
01-1
,131
,286
00
00
00
00
0-3
00,8
31-7
,060
,237
Sale
s ($
's)

39Page
Tabl
e 12
. To
tal N
ew E
ngla
nd C
oast
al R
egio
n In
com
e Im
pact
s (20
03 $
's)
D
owne
ast
Upp
er M
id-C
oast
Low
er M
id-C
oast
S
outh
ern
N
H S
eaco
ast
Glo
uces
ter
Bos
ton
C
ape
& Is
land
s
New
Bed
ford
Rho
de Is
land
C
T Se
acoa
st
N
on-M
ariti
me
Tot
alSe
ctor
M
E
M
EM
E
M
E
N
H
MA
M
A
MA
MA
RI
CT
N
ew E
ngla
nd
New
Eng
land
Com
mer
cial
Fis
hing
Insh
ore
Lobs
ter T
raps
00
00
00
00
00
00
0O
ffsho
re L
obst
er T
raps
00
00
00
00
00
00
0La
rge
Botto
m T
raw
l0
00
00
00
00
00
00
Med
ium
Bot
tom
Tra
wl
0-2
75,9
47-2
75,9
47-2
69,8
46-2
87,4
97-2
81,3
96-2
70,2
97-2
83,0
47-2
83,0
47-2
87,4
97-2
87,4
960
-2,8
02,0
15Sm
all B
otto
m T
raw
l0
00
00
00
00
00
00
Larg
e Sc
allo
p D
redg
e0
00
00
00
00
00
00
Med
ium
Sca
llop
Dre
dge
00
00
00
00
00
00
0Sm
all S
callo
p D
redg
e0
00
00
00
00
00
00
Surf
Cla
m, O
cean
Qua
hog
Dre
dge
00
00
00
00
00
00
0Sm
all D
redg
e0
00
00
00
00
00
00
Sink
Gill
net
00
00
00
00
00
00
0D
ivin
g G
ear
00
00
00
00
00
00
0M
idw
ater
Tra
wl
00
00
00
00
00
00
0Fi
sh P
ots
and
Trap
s0
00
00
00
00
00
00
Botto
m L
ongl
ine
00
00
00
00
00
00
0O
ther
Mob
ile G
ear
00
00
00
00
00
00
0O
ther
Fix
ed G
ear
00
00
00
00
00
00
0H
and
Gea
rs0
00
00
00
00
00
00
Agric
ultu
re-2
,673
-412
-833
-159
-144
-83
-358
-69
-101
-245
-1,2
90-4
3,59
6-4
9,96
3M
inin
g0
0-1
-1-1
0-8
00
-1-5
-2,9
95-3
,014
Tran
spor
tatio
n, C
omm
unic
atio
ns a
nd P
ublic
Util
ities
-194
-435
-4,0
49-4
35-4
,747
-2,9
57-3
0,13
3-1
,075
-2,6
93-6
,777
-18,
046
-112
,922
-184
,464
Wat
er T
rans
porta
tion
0-1
54-1
25-8
8-2
62-1
11-2
,420
-545
-169
-315
-5,9
99-3
,781
-13,
969
War
ehou
sing
and
sto
rage
-5-7
-966
-86
-1,1
86-4
19-3
,557
-6-6
36-5
00-1
,394
-14,
370
-23,
132
Con
stru
ctio
n-4
0-3
06-1
,314
-336
-1,5
74-1
,189
-9,3
88-6
98-7
39-1
,477
-4,7
48-2
2,62
6-4
4,43
3M
anuf
actu
ring
-42
-188
-2,5
46-7
45-4
,435
-3,3
01-1
3,75
2-2
54-1
,858
-3,5
14-1
1,00
4-7
7,11
7-1
18,7
58Se
afoo
d Pr
oces
sing
-11,
641
-66,
123
-31,
118
-8,8
17-1
22,1
06-3
85,8
07-2
46,8
82-3
06-1
21,5
05-7
6,90
8-7
9,35
80
-1,1
50,5
70Ic
e0
-22
-182
-1-1
36-4
4-1
,084
-42
-187
-464
-143
-1,9
88-4
,292
Boat
Bui
ldin
g-1
4-5
93-2
17-7
-50
-16
-431
-21
-22
-4,1
66-1
70-1
,493
-7,1
99Pa
perb
oard
Con
tain
ers
00
-25
-6-3
8-8
2-2
510
-91
-108
-255
-1,9
51-2
,807
Trad
e-2
00-1
,095
-5,6
69-1
,331
-9,3
48-5
,863
-28,
895
-2,8
71-4
,734
-6,9
25-2
1,27
1-1
06,5
21-1
94,7
24Se
afoo
d D
eale
rs0
-8,4
97-1
0,26
3-1
97-9
7,28
9-1
4,25
1-6
7,93
2-3
2,08
3-5
3,48
8-7
4,35
2-7
4,80
00
-433
,152
Fish
Exc
hang
es /
Auct
ions
00
-47,
527
00
-14,
486
-3,4
580
-14,
334
00
0-7
9,80
5W
hole
sale
Tra
de-8
8-7
09-5
,434
-547
-12,
132
-8,0
10-6
1,61
2-1
,011
-4,7
42-7
,792
-29,
467
-129
,163
-260
,706
Fina
nce,
Insu
ranc
e an
d R
eal E
stat
e-2
6-4
04-4
,617
-269
-5,1
45-2
,542
-46,
945
-972
-1,1
49-6
,308
-26,
069
-85,
563
-180
,008
Serv
ices
-507
-3,1
12-2
0,68
9-3
,919
-27,
543
-22,
247
-195
,283
-8,4
23-1
2,47
9-3
2,20
4-9
9,28
5-4
23,9
63-8
49,6
55G
over
nmen
t-1
7-1
43-4
67-2
,408
-1,0
43-5
60-6
,263
-548
-431
-753
-1,5
15-1
2,11
5-2
6,26
3To
tal
-15,
447
-358
,146
-411
,988
-289
,198
-574
,675
-743
,366
-988
,949
-331
,972
-502
,407
-510
,307
-662
,314
-1,0
40,1
62-6
,428
,930
Inco
me
($'s
)

Page 40
Tabl
e 13
. To
tal M
id-A
tlant
ic C
oast
al R
egio
n In
com
e Im
pact
s (20
03 $
's)
N
Y Se
acoa
st
NJ
Nor
th N
J So
uth
D
E St
ate
M
D W
est
M
D E
ast
VA
Nor
th
VA
Sou
th
VA
Eas
t
NC
Nor
th
NC
Cen
tral
NC
Sou
th
Non
-Mar
itim
e
To
tal
Sect
or
N
Y
NJ
N
J
D
E
MD
M
D
V
A
VA
VA
NC
NC
NC
M
id-A
tlant
ic
Mid
-Atla
ntic
Com
mer
cial
Fis
hing
Insh
ore
Lobs
ter T
raps
00
00
00
00
00
00
00
Offs
hore
Lob
ster
Tra
ps0
00
00
00
00
00
00
0La
rge
Botto
m T
raw
l0
00
00
00
00
00
00
0M
ediu
m B
otto
m T
raw
l-2
83,0
460
00
00
00
00
00
0-2
83,0
46Sm
all B
otto
m T
raw
l0
00
00
00
00
00
00
0La
rge
Scal
lop
Dre
dge
00
00
00
00
00
00
00
Med
ium
Sca
llop
Dre
dge
00
00
00
00
00
00
00
Smal
l Sca
llop
Dre
dge
00
00
00
00
00
00
00
Surf
Cla
m, O
cean
Qua
hog
Dre
dge
00
00
00
00
00
00
00
Smal
l Dre
dge
00
00
00
00
00
00
00
Sink
Gill
net
00
00
00
00
00
00
00
Div
ing
Gea
r0
00
00
00
00
00
00
0M
idw
ater
Tra
wl
00
00
00
00
00
00
00
Fish
Pot
s an
d Tr
aps
00
00
00
00
00
00
00
Botto
m L
ongl
ine
00
00
00
00
00
00
00
Oth
er M
obile
Gea
r0
00
00
00
00
00
00
0O
ther
Fix
ed G
ear
00
00
00
00
00
00
00
Han
d G
ears
00
00
00
00
00
00
00
Agric
ultu
re-6
13-3
76-3
,723
00
00
00
00
0-4
,243
-8,9
55M
inin
g-2
,231
-261
-18
00
00
00
00
0-2
91-2
,802
Tran
spor
tatio
n, C
omm
unic
atio
ns a
nd P
ublic
Util
ities
-130
,824
-59,
437
-42,
630
00
00
00
00
0-1
0,98
9-2
43,8
80W
ater
Tra
nspo
rtatio
n-1
0,87
1-6
,487
-2,7
180
00
00
00
00
-368
-20,
444
War
ehou
sing
and
sto
rage
-5,7
27-1
1,80
5-6
,776
00
00
00
00
0-1
,398
-25,
706
Con
stru
ctio
n-2
1,95
1-7
,194
-8,5
140
00
00
00
00
-2,2
02-3
9,86
0M
anuf
actu
ring
-26,
436
-29,
289
-22,
748
00
00
00
00
0-7
,505
-85,
978
Seaf
ood
Proc
essi
ng-1
03,6
41-5
04-6
830
00
00
00
00
0-1
04,8
28Ic
e-1
,386
-241
-541
00
00
00
00
0-1
93-2
,362
Boat
Bui
ldin
g-7
-3-2
,825
00
00
00
00
0-1
45-2
,980
Pape
rboa
rd C
onta
iner
s-4
83-6
80-3
620
00
00
00
00
-190
-1,7
14Tr
ade
-79,
241
-36,
859
-41,
000
00
00
00
00
0-1
0,36
6-1
67,4
66Se
afoo
d D
eale
rs-8
4,41
1-1
,218
-94
00
00
00
00
00
-85,
722
Fish
Exc
hang
es /
Auct
ions
00
00
00
00
00
00
00
Who
lesa
le T
rade
-156
,921
-79,
680
-64,
215
00
00
00
00
0-1
2,57
0-3
13,3
86Fi
nanc
e, In
sura
nce
and
Rea
l Est
ate
-193
,467
-41,
994
-28,
334
00
00
00
00
0-8
,327
-272
,121
Serv
ices
-550
,348
-162
,366
-161
,934
00
00
00
00
0-4
1,25
8-9
15,9
06G
over
nmen
t-2
1,08
8-5
,781
-4,6
030
00
00
00
00
-1,1
79-3
2,65
1To
tal
-1,6
72,6
93-4
44,1
74-3
91,7
190
00
00
00
00
-101
,224
-2,6
09,8
10
Inco
me
($'s
)

41Page
Tabl
e 14
. To
tal N
ew E
ngla
nd C
oast
al R
egio
n Em
ploy
men
t Im
pact
s (20
03)
D
owne
ast
Upp
er M
id-C
oast
Low
er M
id-C
oast
S
outh
ern
NH
Sea
coas
t G
louc
este
r
B
osto
n
Cap
e &
Isla
nds
N
ew B
edfo
rd
Rho
de Is
land
C
T Se
acoa
st
Non
-Mar
itim
e
Tot
alSe
ctor
ME
M
E
ME
ME
NH
M
A
MA
M
A
M
A
R
I
C
T
New
Eng
land
N
ew E
ngla
ndC
omm
erci
al F
ishi
ngIn
shor
e Lo
bste
r Tra
ps0
00
00
00
00
00
00
Offs
hore
Lob
ster
Tra
ps0
00
00
00
00
00
00
Larg
e Bo
ttom
Tra
wl
00
00
00
00
00
00
0M
ediu
m B
otto
m T
raw
l0
-8-8
-8-8
-8-8
-8-8
-8-8
0-8
0Sm
all B
otto
m T
raw
l0
00
00
00
00
00
00
Larg
e Sc
allo
p D
redg
e0
00
00
00
00
00
00
Med
ium
Sca
llop
Dre
dge
00
00
00
00
00
00
0Sm
all S
callo
p D
redg
e0
00
00
00
00
00
00
Surf
Cla
m, O
cean
Qua
hog
Dre
dge
00
00
00
00
00
00
0Sm
all D
redg
e0
00
00
00
00
00
00
Sink
Gill
net
00
00
00
00
00
00
0D
ivin
g G
ear
00
00
00
00
00
00
0M
idw
ater
Tra
wl
00
00
00
00
00
00
0Fi
sh P
ots
and
Trap
s0
00
00
00
00
00
00
Botto
m L
ongl
ine
00
00
00
00
00
00
0O
ther
Mob
ile G
ear
00
00
00
00
00
00
0O
ther
Fix
ed G
ear
00
00
00
00
00
00
0H
and
Gea
rs0
00
00
00
00
00
00
Agric
ultu
re0
00
00
00
00
00
-3-3
Min
ing
00
00
00
00
00
00
0Tr
ansp
orta
tion,
Com
mun
icat
ions
and
Pub
lic U
tiliti
es0
00
00
0-1
00
00
-2-4
Wat
er T
rans
porta
tion
00
00
00
00
00
00
0W
areh
ousi
ng a
nd s
tora
ge0
00
00
00
00
00
0-1
Con
stru
ctio
n0
00
00
00
00
00
-1-1
Man
ufac
turin
g0
00
00
00
00
00
-2-2
Seaf
ood
Proc
essi
ng-1
-3-1
0-4
-7-5
0-4
-2-2
0-2
7Ic
e0
00
00
00
00
00
00
Boat
Bui
ldin
g0
00
00
00
00
00
00
Pape
rboa
rd C
onta
iner
s0
00
00
00
00
00
00
Trad
e0
00
00
0-1
00
0-1
-5-8
Seaf
ood
Dea
lers
00
00
-10
-10
-1-1
-10
-6Fi
sh E
xcha
nges
/ Au
ctio
ns0
0-2
00
00
00
00
0-3
Who
lesa
le T
rade
00
00
00
-10
00
0-3
-4Fi
nanc
e, In
sura
nce
and
Rea
l Est
ate
00
00
00
-10
00
0-2
-4Se
rvic
es0
0-1
0-1
-1-4
00
-1-2
-14
-25
Gov
ernm
ent
00
00
00
00
00
00
0To
tal
-1-1
1-1
2-9
-15
-17
-22
-9-1
4-1
3-1
5-3
1-1
68
Empl
oym
ent (
Jobs
)

Page 42
Tabl
e 15
. To
tal M
id-A
tlant
ic C
oast
al R
egio
n Em
ploy
men
t Im
pact
s (20
03)
N
Y Se
acoa
st
NJ
Nor
th N
J So
uth
D
E St
ate
M
D W
est
M
D E
ast
VA
Nor
th
VA
Sout
h
VA
East
NC
Nor
th
NC
Cen
tral
NC
Sou
th
N
on-M
ariti
me
T
otal
Sect
or
N
Y
NJ
N
J
D
E
MD
M
D
VA
VA
VA
NC
NC
NC
M
id-A
tlant
ic
M
id-A
tlant
icC
omm
erci
al F
ishi
ngIn
shor
e Lo
bste
r Tra
ps0
00
00
00
00
00
00
0O
ffsho
re L
obst
er T
raps
00
00
00
00
00
00
00
Larg
e Bo
ttom
Tra
wl
00
00
00
00
00
00
00
Med
ium
Bot
tom
Tra
wl
-90
00
00
00
00
00
0-9
Smal
l Bot
tom
Tra
wl
00
00
00
00
00
00
00
Larg
e Sc
allo
p D
redg
e0
00
00
00
00
00
00
0M
ediu
m S
callo
p D
redg
e0
00
00
00
00
00
00
0Sm
all S
callo
p D
redg
e0
00
00
00
00
00
00
0Su
rf C
lam
, Oce
an Q
uaho
g D
redg
e0
00
00
00
00
00
00
0Sm
all D
redg
e0
00
00
00
00
00
00
0Si
nk G
illne
t0
00
00
00
00
00
00
0D
ivin
g G
ear
00
00
00
00
00
00
00
Mid
wat
er T
raw
l0
00
00
00
00
00
00
0Fi
sh P
ots
and
Trap
s0
00
00
00
00
00
00
0Bo
ttom
Lon
glin
e0
00
00
00
00
00
00
0O
ther
Mob
ile G
ear
00
00
00
00
00
00
00
Oth
er F
ixed
Gea
r0
00
00
00
00
00
00
0H
and
Gea
rs0
00
00
00
00
00
00
0Ag
ricul
ture
00
00
00
00
00
00
0-1
Min
ing
00
00
00
00
00
00
00
Tran
spor
tatio
n, C
omm
unic
atio
ns a
nd P
ublic
Util
ities
-2-1
-10
00
00
00
00
0-4
Wat
er T
rans
porta
tion
00
00
00
00
00
00
00
War
ehou
sing
and
sto
rage
00
00
00
00
00
00
0-1
Con
stru
ctio
n0
00
00
00
00
00
00
-1M
anuf
actu
ring
-10
00
00
00
00
00
0-2
Seaf
ood
Proc
essi
ng-2
00
00
00
00
00
00
-2Ic
e0
00
00
00
00
00
00
0Bo
at B
uild
ing
00
00
00
00
00
00
00
Pape
rboa
rd C
onta
iner
s0
00
00
00
00
00
00
0Tr
ade
-3-1
-20
00
00
00
00
0-6
Seaf
ood
Dea
lers
-10
00
00
00
00
00
0-1
Fish
Exc
hang
es /
Auct
ions
00
00
00
00
00
00
00
Who
lesa
le T
rade
-2-1
-10
00
00
00
00
0-5
Fina
nce,
Insu
ranc
e an
d R
eal E
stat
e-2
-1-1
00
00
00
00
00
-4Se
rvic
es-1
2-4
-40
00
00
00
00
-1-2
1G
over
nmen
t0
00
00
00
00
00
00
-1To
tal
-35
-9-9
00
00
00
00
0-3
-56
Empl
oym
ent (
Jobs
)

43Page
APPENDIX A Bridge between Expenditures and IMPLAN Pro Sectors
The expenditures by harvesters, seafood wholesalers, fish exchanges/auctions, and seafood processors were allocated across a number of industry sectors contained in the NERIOM. If an expense was assumed to occur at the retail level, transportation, wholesale, and retail margins were also included. This Appendix shows the bridge that we created to allocate each industry expenditure item to its appropriate IMPLAN Pro sector or sectors.
Harvester Expenditures
Association FeesIMPLAN Sector Sector Title Proportion
493 Civic, Social, Professional and Similar Organizations 1 Total 1
Association fees were allocated to establishments primarily engaged in promoting the business interests of their
members. These establishments conduct research on new products and services, develop market statistics, lobby public officials, or publish newsletters, books, or periodicals for distribution to their members.
Bait: Hand Gear VesselsIMPLAN Sector Sector Title Proportion
394 Truck Transportation .0012400 Warehousing and Storage .0002390 Wholesale Trade .1641393 Water Transportation .0190
954-976 Medium Bottom Trawl, Bait .8155 Total 1
For the most part, a large portion of the bait used by hand gear vessels in the Northeast is locally landed squid. Since
the bulk of squid landings in the Northeast generally occur aboard otter trawl vessels, bait purchases were allocated to medium bottom trawl bait sectors. However, it was assumed that the purchases occurred at the wholesale level so transportation and storage margins were included. Squid purchases by hand gear vessels in a particular sub-region were allocated across medium bottom trawl bait sectors in the state where the sub-region was located. The relative importance of each sub-region’s medium bottom trawl bait sector’s output value to total state-level output was used to allocate bait purchases across sub-regions within a state.
Bait: Lobster VesselsIMPLAN Sector Sector Title Proportion
394 Truck Transportation .0012400 Warehousing and Storage .0002390 Wholesale Trade .1641393 Water Transportation .0190
931-953 Mid-Water Trawl, Bait .8155 Total 1
In the NERIOM it was assumed that the bait used by lobster vessels is locally landed herring or mackerel. Since the
bulk of herring and mackerel landings generally occur aboard midwater trawl vessels, bait purchases were allocated to midwater trawl bait sectors. However, it was assumed that the purchases occurred at the wholesale level so transportation and storage margins were included. Herring and mackerel purchases by hand gear vessels in a particular sub-region were allocated across midwater trawl bait sectors in the state where the sub-region was located. The relative importance of each sub-region’s midwater trawl bait sector’s output value to total state-level output was used to allocate bait purchases across sub-regions within a state.

Page 44
Bait: Longline Vessels IMPLAN Sector Sector Title Proportion
394 Truck Transportation .0012 400 Warehousing and Storage .0002 390 Wholesale Trade .1641 393 Water Transportation .0190
931-976 Mid-Water Trawl, Bait and Medium Bottom Trawl, Bait .8155 Total 1
Commonly used bait in the Northeast longline industry is frozen squid, mackerel, and herring. Since the bulk of these landings in the Northeast occur aboard otter trawl vessels and midwater trawl vessels, bait purchases were allocated to both medium bottom trawl bait sectors and midwater trawl bait sectors. However, it was assumed that the purchases occurred at the wholesale level so transportation and storage margins were included. Bait purchases by longline vessels in a particular sub-region were allocated across medium bottom trawl bait sectors and midwater trawl bait sectors in the state where the sub-region was located. The relative importance of each sub-region’s medium bottom trawl bait sector’s output value and midwater trawl bait sector to total state-level output was used to allocate bait purchases across sub-regions within a state.
Bank Service ChargeIMPLAN Sector Sector Title Proportion
430 Monetary Authorities and Depository Credit Institutions 1 Total 1
Bank service charges, both real (fees, points) and imputed (services for which no fee is charged), occur every time a loan is dispersed. These charges make up the output of financial institutions. The annual fee for these services in 2001 was calculated by assuming the average charge was 2% of the principle divided by the average life of the loan.
ConsignmentIMPLAN Sector Sector Title Proportion
459 Other Support Services 1 Total 1
Consignment costs are fees paid to an independent agent or broker that sells harvesters’ seafood. These services may also include bartering, packaging, and labeling. Sales of seafood by harvesters through actual fish exchanges/auctions, however, were not classified as consignment expenditures. As previously indicated, 23 fish exchange/auction sectors were added to the model to account for those types of transactions.
Fish Exchange/AuctionIMPLAN Sector Sector Title Proportion
927-930 Fish Exchange/Auction 1 Total 1
Commercial harvesters that use fish exchange/auction houses to sell their landings are generally charged about 7 cents per pound. Thus, fees for utilizing this service were allocated to the 4 fish exchange sectors in the NERIOM. The relative ex-vessel value of landings that was sold through a fish exchange sector, by each harvesting sector in the NERIOM, was used to allocate expenditures across the four fish exchange sectors. The 2001 Northeast Dealer data base provided this information.

45Page
Fuel and Lubricants
IMPLAN Sector Sector Title Proportion
142 Petroleum Refineries 0.393794390 Wholesale Trade 0.361077392 Rail Transportation 0.006754393 Water Transportation 0.005192394 Truck Transportation 0.008658396 Pipeline Transportation 0.004953407 Gasoline Stations 0.219571
Total 1
The default margin table for Sector 142 in IMPLAN Pro was used to allocate purchases of fuel and lubricants.
Gear Replacement: Lobster VesselsIMPLAN Sector Sector Title Proportion
103 Other Miscellaneous textile product mills 0.09669242 Spring and wire product manufacturing 0.406902390 Wholesale Trade 0.019952391 Air Transportation 0.007183392 Rail Transportation 0.007981394 Truck Transportation 0.034318404 Building material and garden supply stores 0.426975
Total 1
Gear replacement expenditures were assumed to be for replacement of pots and lines. Replacement of pots was allocated to Sector 242 which encompasses the construction of fabricated wire products. Replacement of lines was allocated to sector 103 which includes the production of cordage and twine. It was assumed that 80% of purchase price was for replacement of pots and 20% for replacement of lines. These items are usually purchased at the wholesale level so the default IMPLAN Pro margins associated with Sector 242 were also included.
GroceriesIMPLAN Sector Sector Title Proportion
1 Oilseed farming 6.36E-05 2 Grain farming 0.000379 3 Vegetable and melon farming 0.022642 4 Tree nut farming 0.000749 5 Fruit farming 0.014302 6 Greenhouse and nursery production 0.000652
10 All other crop farming 0.000203 12 Poultry and egg production 0.006205 15 Forest nurseries, forest products, and timber 0.000137 26 Other nonmetallic mineral mining 1E-05 46 Dog and cat food manufacturing 0.016556 47 Other animal food manufacturing 0.002251 48 Flour milling 0.00234 49 Rice milling 0.001427 51 Wet corn milling 0.002738 52 Soybean processing 7.65E-05 54 Fats and oils refining and blending 0.004478 55 Breakfast cereal manufacturing 0.016116 56 Sugar manufacturing 0.005154 57 Confectionery manufacturing from cacao beans 0.003429 58 Confectionery manufacturing from purchased chocolate 0.015461

Page 46
59 Nonchocolate confectionery manufacturing 0.01315 60 Frozen food manufacturing 0.035386 61 Fruit and vegetable canning and drying 0.051314 62 Fluid milk manufacturing 0.040036 63 Creamery butter manufacturing 0.002148 64 Cheese manufacturing 0.014711 65 Dry, condensed, and evaporated dairy products 0.008433 66 Ice cream and frozen dessert manufacturing 0.005012 67 Animal, except poultry, slaughtering 0.057514 68 Meat processed from carcasses 0.054934 70 Poultry processing 0.027721 72 Frozen cakes and other pastries manufacturing 0.005509 73 Bread and bakery product, except frozen, manufacturing 0.046437 74 Cookie and cracker manufacturing 0.016265 75 Mixes and dough made from purchased flour 0.009065 76 Dry pasta manufacturing 0.003576 77 Tortilla manufacturing 0.002269 78 Roasted nuts and peanut butter manufacturing 0.004765 79 Other snack food manufacturing 0.01767 80 Coffee and tea manufacturing 0.012974 81 Flavoring syrup and concentrate manufacturing 0.005455 82 Mayonnaise, dressing, and sauce manufacturing 0.00848 83 Spice and extract manufacturing 0.007112 84 All other food manufacturing 0.018899 85 Soft drink and ice manufacturing 0.06019
171 Other miscellaneous chemical product manufacturing 0.000167 390 Wholesale trade 0.098877 391 Air transportation 0.000487 392 Rail transportation 0.002832 393 Water transportation 0.001729 394 Truck transportation 0.013268 399 Couriers and messengers 0.001554 400 Warehousing and storage 0.000889 402 Furniture and home furnishings stores 9.66E-05 404 Building material and garden supply stores 0.001584 405 Food and beverage stores 0.196583 407 Gasoline stations 0.016591 410 General merchandise stores 0.006296 411 Miscellaneous store retailers 0.00834 500 Noncomparable imports 0.006314
Total 1
IMPLAN Pro’s Personal Consumption Expenditure (PCE) vector 1111 was chosen to approximate the industries involved in the manufacturing of groceries purchased by commercial fishermen. The Bureau of Economic Analysis creates this expenditure vector for their work on national average benchmark input-output tables. The PCE vector represents the national average expenditure pattern for groceries. At the time of this writing, IMPLAN Pro’s PCE vector 1111 was developed from SIC coded sectors. The NERIOM, however, is based on IMPLAN Pro’s new NAICS coding system that was implemented in conjunction with the release of the 2001 data. Thus, it was necessary to convert the old SIC-based IMPLAN Pro codes into the new NAICS-based IMPLAN Pro codes. The developers of the IMPLAN Pro system provided the bridge from which these conversions were made. The majority of the default conversions were maintained in the NERIOM. However, purchases associated with the two default seafood sectors (i.e., commercial fishing and seafood product preparation and packaging) were reallocated to Sector 60 (frozen food manufacturing) to better reflect likely consumption habits aboard commercial fishing vessels.

47Page
IceIMPLAN Sector Sector Title Proportion
85 Soft drink and ice manufacturing 0.628331390 Wholesale trade 0.10275392 Rail transportation 0.000222393 Water transportation 3.14E-05394 Truck transportation 0.006453405 Food and beverage stores 0.193154407 Gasoline stations 0.069058
Total 1
The default margin table for Sector 85 (Soft drink and ice manufacturing) in IMPLAN Pro was used to allocate purchases of ice.
Insurance: BoatIMPLAN Sector Sector Title Proportion
427 Insurance Carriers 1 Total 1
Fees for insurance were applied to IMPLAN Pro sector 427 (Insurance carriers). This sector includes establishments primarily engaged in underwriting and assuming the risk of insurance policies. Another insurance sector is included in IMPLAN Pro that contains businesses that act as agents or brokers in selling insurance policies, but this sector is similar to a margin sector and its production function does not account for the actual cost of the insurance policy. Sector 427 accounts for the underwriting cost and includes reimbursement to agents and brokers for their fees.
Insurance: Captain and SternmanIMPLAN Sector Sector Title Proportion
Value-Added Employee Compensation 1 Total 1
Employee compensation in IMPLAN Pro includes all payroll costs, including benefits such as health and life insurance.
Interest Payment: Short term Operating LoansIMPLAN Sector Sector Title Proportion
Value-Added Other Property Type Income 1 Total 1
In most input-output models, such as IMPLAN Pro, interest payments are not paid directly to an industry, they are included in the value-added sector Other Property Type Income.
Interest Payment: VesselIMPLAN Sector Sector Title Proportion
Value-Added Other Property Type Income 1 Total 1
Interest payments were allocated to the value-added sector Other Property Type Income.
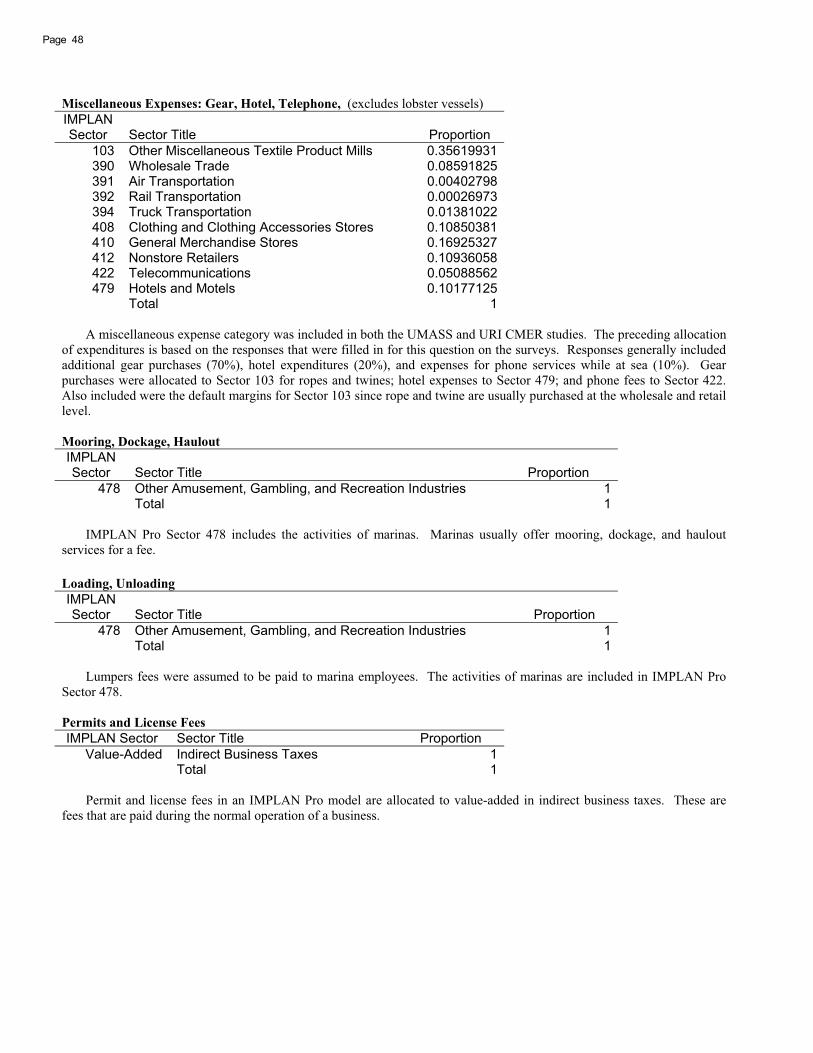
Page 48
Miscellaneous Expenses: Gear, Hotel, Telephone, (excludes lobster vessels) IMPLAN Sector Sector Title Proportion
103 Other Miscellaneous Textile Product Mills 0.35619931390 Wholesale Trade 0.08591825391 Air Transportation 0.00402798392 Rail Transportation 0.00026973394 Truck Transportation 0.01381022408 Clothing and Clothing Accessories Stores 0.10850381410 General Merchandise Stores 0.16925327412 Nonstore Retailers 0.10936058422 Telecommunications 0.05088562479 Hotels and Motels 0.10177125
Total 1
A miscellaneous expense category was included in both the UMASS and URI CMER studies. The preceding allocation of expenditures is based on the responses that were filled in for this question on the surveys. Responses generally included additional gear purchases (70%), hotel expenditures (20%), and expenses for phone services while at sea (10%). Gear purchases were allocated to Sector 103 for ropes and twines; hotel expenses to Sector 479; and phone fees to Sector 422. Also included were the default margins for Sector 103 since rope and twine are usually purchased at the wholesale and retail level.
Mooring, Dockage, HauloutIMPLAN Sector Sector Title Proportion
478 Other Amusement, Gambling, and Recreation Industries 1 Total 1
IMPLAN Pro Sector 478 includes the activities of marinas. Marinas usually offer mooring, dockage, and haulout services for a fee. Loading, UnloadingIMPLAN Sector Sector Title Proportion
478 Other Amusement, Gambling, and Recreation Industries 1 Total 1
Lumpers fees were assumed to be paid to marina employees. The activities of marinas are included in IMPLAN Pro Sector 478.
Permits and License Fees IMPLAN Sector Sector Title Proportion
Value-Added Indirect Business Taxes 1 Total 1
Permit and license fees in an IMPLAN Pro model are allocated to value-added in indirect business taxes. These are fees that are paid during the normal operation of a business.

49Page
Principal Payment: Short term Operating Loans for Lobster VesselsIMPLAN Sector Sector Title Proportion
103 Other Miscellaneous textile product mills 0.09669242 Spring and wire product manufacturing 0.406902390 Wholesale Trade 0.019952391 Air Transportation 0.007183392 Rail Transportation 0.007981394 Truck Transportation 0.034318404 Building material and garden supply stores 0.426975
Total 1
Short term operating loans for lobster vessels were assumed to cover gear replacement costs for pots and lines. Following the same expenditure pattern delineated above for gear replacement costs, replacement of pots was allocated to Sector 242 and replacement of lines to sector 103. It was assumed that 80% of the purchase price was for replacement of pots and 20% for replacement of lines. These items are usually purchased at the wholesale level so the default IMPLAN Pro margins associated with Sector 242 were also included.
Principal Payment: Vessel IMPLAN Sector Sector Title Proportion
357 Ship Building and Repairing 1 Total 1
Principal payments for vessels were allocated to Sector 357 Ship Building and Repairing. This sector includes establishments engaged in the construction and repair of fishing boats.
Professional FeesIMPLAN Sector Sector Title Proportion
438 Accounting and Bookkeeping Services 1 Total 1
Businesses engaged in accounting and bookkeeping services are classified in IMPLAN Pro Sector 438 Accounting and Bookkeeping Services.
Profits: OwnerIMPLAN Sector Sector Title Proportion
Value-Added Proprietary Income 1 Total 1
Payments received by vessel owners as income are known as value-added payments and are classified as proprietary income in an IMPLAN Pro model.
Repair & Maintenance: Electronics IMPLAN Sector Sector Title Proportion
484 Electronic Equipment Repair and Maintenance 1 Total 1
Expenditures for electronic repairs aboard commercial fishing vessels were allocated to Sector 484 Electronic Equipment Repair and Maintenance.

Page 50
Repair & Maintenance: Fishing Gear, Equipment IMPLAN Sector Sector Title Proportion
485 Commercial Machinery Repair and Maintenance 1 Total 1
Establishments engaged in commercial equipment repair, including hydraulic equipment repair and freezer repair are classified in IMPLAN Pro Sector 485 Commercial Machinery Repair and Maintenance.
Repair & Maintenance: Vessel and Engine at Boat YardIMPLAN Sector Sector Title Proportion
357 Ship Building and Repairing 1 Total 1
Vessel and engine repairs conducted at the boat yard were allocated to IMPLAN Pro Sector 357 Ship Building and Repairing.
Repair & Maintenance: Vessel and Engine by OwnerIMPLAN Sector Sector Title Proportion
244 Turned Product and Screw, Nut, and Bolt Manufacturing 0.451699 390 Wholesale Trade 0.160032 391 Air Transportation 0.00345 394 Truck Transportation 0.011146 404 Building Material and Garden Supply Stores 0.373673
Total 1
Vessel and engine repairs conducted by the owner were allocated to establishments primarily engaged in manufacturing metal bolts, nuts, screws, rivets, and washers, and other industrial fasteners. These establishments are classified in IMPLAN Pro Sector 244.
Shorefront Expenses: Rent, Utilities, Supplies, AdvertisingIMPLAN Sector Sector Title Proportion
30 Power Generation and Supply 0.2133 Stationery and Related Product Manufacturing 0.3431 Real Estate 0.4447 Advertising and Related Services 0.1
Total 1
Onshore expenses, generally due to the ownership of storage facilities or office space, were allocated to four IMPLAN Pro sectors. Average rents comprised 40% of the shorefront expenses and were allocated to the Real Estate Sector. Utilities were assumed to be for electricity and were allocated to IMPLAN Pro Sector 30 Power Generation and Supply (20%). Supplies averaged 30% of onshore expenses and were assumed to be for stationery and related products (Sector 133). Finally, advertising expenses comprised 10%, on average, of onshore expenses and were allocated to IMPLAN Pro Sector 447.
TaxesIMPLAN Sector Sector Title Proportion
Value-Added Indirect Business Taxes 1 Total 1
Tax expenditures included in this sector consist of excise taxes, property taxes, and sales taxes, but exclude income
taxes paid by businesses. These fees were allocated to IMPLAN Pro’s Value-Added Sector Indirect Business Taxes.

51Page
Miscellaneous Trip SuppliesIMPLAN Sector Sector Title Proportion
100 Curtain and Linen Mills 0.00856 103 Other Miscellaneous Textiles 0.007716 125 Paper and Paperboard Mills 0.040025 126 Paperboard Container Manufacturing 0.180838 130 Coated and Uncoated Paper Bag Manufacturing 0.02375 163 Soap and Other Detergent Manufacturing 0.047259 164 Polish and other Sanitation Good Manufacturing 0.040146 172 Plastics Packaging Materials 0.054372 177 Plastic Plumbing Fixtures and all other Plastics 0.008319 179 Tire Manufacturing 0.006631 278 Ac, Refrigeration 0.007234 286 Other Engine Equipment Manufacturing 0.074987 289 Air and Gas Compressor Manufacturing 0.004581 321 Watch, Clock, and Other Measuring and Controlling Devices 0.007475 325 Electric Lamp Bulb and Part Manufacturing 0.012176 333 Electric Power and Specialty Transformer Manufacturing 0.005184 338 Primary Battery Manufacturing 0.010247 350 Motor Vehicle Parts Manufacturing 0.0475 392 Rail Transportation 0.001 390 Wholesale Trade 0.161 404 Building Material & Gardening Supplies 0.001 405 Food and Beverage Stores 0.185 407 Gasoline Stations 0.013 410 General Merchandise Stores 0.014 411 Miscellaneous Store Retail 0.038
Total 1
Trip supplies consist of expenditures for chemical cleaning products, brooms, mops, soaps and detergents, boxes, plastic packaging materials, bulbs, furnishings, plumbing accessories, and miscellaneous machine parts. Expenditures for these items were allocated to manufacturing sectors according to proportions contained the default IMPLAN Pro commercial fishing sector’s production function. Specifically, we summed the absorption coefficients associated with the manufacturing sectors that produce the aforementioned items and then determined the proportion that each sector represented. These proportions were used to allocate miscellaneous trip expenditure estimates to the correct IMPLAN Pro manufacturing sector. Average wholesale, transportation, and retail margins across all of the manufacturing sectors were calculated and included in the expenditure estimates since the majority of these purchases occur at the retail level. Vehicles (20% Repair, 80% Fuel and Lubricants)IMPLAN Sector Sector Title Proportion
483 Automotive Repair and Maintenance 0.2142 Petroleum Refineries 0.315036390 Wholesale Trade 0.288862392 Rail Transportation 0.005403393 Water Transportation 0.004154394 Truck Transportation 0.006926396 Pipeline Transportation 0.003962407 Gasoline Stations 0.175657
Total 1
Vehicle expenses were assumed to cover repair (20%) and fuel (80%) costs. Automotive repair services were allocated to IMPLAN Pro Sector Automotive Repair and Maintenance, and the default margin table for Petroleum Refineries was used to allocate expenses for fuel and lubricants.

Page 52
Wages: Captain and CrewIMPLAN Sector Sector Title Proportion
Value-Added Employee Compensation 1 Total 1
The wages and salaries of employees were allocated to the Value-Added Sector Employee Compensation.
Seafood Wholesale Dealer Expenditures
Many of the commodities and services purchased by commercial harvesters are also purchased by wholesale seafood dealers. Therefore, to avoid duplication, detailed descriptions of wholesale dealer expenditures are only provided for products and services that were not purchased by commercial harvesters. Please see the Commercial Harvester Expenditure section for descriptions of the following expenses that were also incurred by wholesale seafood dealers: bank service charges, ice, insurance, interest expense, professional fees, profits, vehicles, taxes, and wages.
AdvertisingIMPLAN Sector Sector Title Proportion
447 Advertising and Related Services 1 Total 1
Advertising fees were allocated to IMPLAN Pro Sector 447 Advertising and Related Services.
Packaging: BoxesIMPLAN Sector Sector Title Proportion
126 Paperboard Container Manufacturing 0.581083390 Wholesale Trade 0.016356391 Air Transportation 0.000463392 Rail Transportation 0.026539394 Truck Transportation 0.130381411 Miscellaneous Store Retailers 0.245178
Total 1
The default IMPLAN Pro margin table for Sector 126 Paperboard Container Manufacturing was used to allocate packaging expenses. RentIMPLAN Sector Sector Title Proportion
431 Real Estate 1 Total 1
Industries in the Real Estate Sector include establishments that are primarily engaged in the renting or leasing real estate to others, including the leasing of mini warehouses and storage buildings. Repair & Maintenance: BuildingIMPLAN Sector Sector Title Proportion
458 Services to Buildings and Dwellings 1 Total 1

53Page
Establishments contained in Sector 458 Services to Buildings and Dwellings are primarily engaged in cleaning and maintaining building interiors, and providing landscape care and maintenance. ShippingIMPLAN Sector Sector Title Proportion
394 Truck Transportation 1 Total 1
The majority of seafood landings in the Northeast are shipped by truck to Northeast wholesale dealers. Therefore, IMPLAN Pro Sector 394 Truck Transportation was chosen to represent the costs associated with shipping. The Truck Transportation Sector comprises establishments primarily engaged in providing general freight trucking. StorageIMPLAN Sector Sector Title Proportion
400 Warehousing and Storage 1 Total 1
Industries in IMPLAN Pro’s Warehousing and Storage Sector are primarily engaged in operating warehousing and
storage facilities for general merchandise. Utilities: ElectricIMPLAN Sector Sector Title Proportion
30 Power Generation and Supply 1 Total 1
IMPLAN Pro’s Power Generation and Supply Sector comprises establishments primarily engaged in generating,
transmitting, and/or distributing electric power. Utilities: GasIMPLAN Sector Sector Title Proportion
31 Natural Gas Distribution 1 Total 1
Establishments in IMPLAN Pro’s Natural Gas Distribution Sector are primarily engaged in transmitting and
distributing gas to final consumers.
Utilities: TelephoneIMPLAN Sector Sector Title Proportion
422 Telecommunications 1 Total 1
The Telecommunications Sector in IMPLAN Pro contains businesses that are primarily engaged in operating, maintaining, and/or providing access to facilities for the transmission of voice, data, text, sound, and video. Fish Exchange/Auction Expenditures
Commodities and services purchased by fish exchange/auction establishments in the NERIOM were assumed to be identical to those purchased by wholesale seafood dealers, with the exception of shipping fees, profits, and truck maintenance. Harvesters who sell their product through auction houses are assumed to pay for the transportation fees in the NERIOM, and owner profits were assumed to be zero since these establishments generally operate as nonprofit entities.

Page 54
Expenditures included in the fish exchange/auction production function consisted of fees for advertising, bank service charges, ice, insurance, interest, mortgage payments, packaging supplies, professional fees, rent, building maintenance, storage, taxes, utilities, and employee wages. The IMPLAN Pro sectors associated with these expenses were discussed in the preceding two sections. Seafood Processor Expenditures
The IMPLAN Pro default production function for Sector 71 Seafood Product Preparation and Packaging was used to allocate purchases by seafood processors in all 23 coastal sub-regions in the NERIOM to their appropriate IMPLAN Pro sector. This production function includes over 140 industry sectors that sell commodities and services to the 23 seafood processing sectors in the NERIOM.

Publishing in NOAA Technical Memorandum NMFS-NE
Manuscript Qualification
This series represents a secondary level of scientificpublishing in the National Marine Fisheries Service (NMFS).For all issues, the series employs thorough internal scientificreview, but not necessarily external scientific review. For mostissues, the series employs rigorous technical and copy editing.Manuscripts that may warrant a primary level of scientificpublishing should be initially submitted to one of NMFS'sprimary series (i.e., Fishery Bulletin, NOAA Professional PaperNMFS, or Marine Fisheries Review).
Identical, or fundamentally identical, manuscripts shouldnot be concurrently submitted to this and any other publicationseries. Manuscripts which have been rejected by any primaryseries strictly because of geographic or temporal limitationsmay be submitted to this series.
Manuscripts by Northeast Fisheries Science Center(NEFSC) authors will be published in this series upon approvalby the NEFSC's Deputy Science & Research Director. Manu-scripts by non-NEFSC authors may be published in this seriesif: 1) the manuscript serves the NEFSC's mission; 2) themanuscript meets the Deputy Science & Research Director'sapproval; and 3) the author arranges for the printing and bindingfunds to be transferred to the NEFSC's Research Communica-tions Branch account from another federal account. For allmanuscripts submitted by non-NEFSC authors and publishedin this series, the NEFSC will disavow all responsibility for themanuscripts' contents; authors must accept such responsibil-ity.
The ethics of scientific research and scientific publishingare a serious matter. All manuscripts submitted to this seriesare expected to adhere -- at a minimum -- to the ethical guidelinescontained in Chapter 1 ("Ethical Conduct in Authorship andPublication") of the CBE Style Manual, fifth edition (Chicago,IL: Council of Biology Editors). Copies of the manual areavailable at virtually all scientific libraries.
edition of the United States Government Printing Office StyleManual. That style manual is silent on many aspects of scientificmanuscripts. NEFSC publication and report series rely more on theCBE Style Manual, fifth edition.
For in-text citations, use the name-date system. A specialeffort should be made to ensure that the list of cited works containsall necessary bibliographic information. For abbreviating serialtitles in such lists, use the guidance of the International StandardsOrganization; such guidance is easily accessed through the variousCambridge Scientific Abstracts’ serials source lists (see http://www.public.iastate.edu/~CYBERSTACKS/JAS.htm). Personal com-munications must include date of contact and full name and mailingaddress of source.
For spelling of scientific and common names of fishes, mol-lusks, and decapod crustaceans from the United States and Canada,use Special Publications No. 29 (fishes), 26 (mollusks), and 17(decapod crustaceans) of the American Fisheries Society (Bethesda,MD). For spelling of scientific and common names of marinemammals, use Special Publication No. 4 of the Society for MarineMammalogy (Lawrence, KS). For spelling in general, use the mostrecent edition of Webster’s Third New International Dictionary ofthe English Language Unabridged (Springfield, MA: G.&C.Merriam).
Typing text, tables, and figure captions: Text, tables, andfigure captions should be converted to Word. In general, keep textsimple (e.g., don't switch fonts and type sizes, don't use hardreturns within paragraphs, don't indent except to begin paragraphs).Also, don't use an automatic footnoting function; all notes shouldbe indicated in the text by simple numerical superscripts, and listedtogether in an "Endnotes" section prior to the "References Cited"section. Especially, don't use a graphics function for embeddingtables and figures in text.
Tables should be prepared with a table formatting function.Each figure should be supplied both on paper and on disk, unlessthere is no digital file of a given figure. Except under extraordinarycircumstances, color will not be used in illustrations.
Manuscript Preparation
Organization: Manuscripts must have an abstract, tableof contents, and -- if applicable -- lists of tables, figures, andacronyms. As much as possible, use traditional scientificmanuscript organization for sections: "Introduction," "StudyArea," "Methods & Materials," "Results," "Discussion" and/or "Conclusions," "Acknowledgments," and "References Cited."
Style: All NEFSC publication and report series areobligated to conform to the style contained in the most recent
Northeast Fisheries Science CenterOperations, Management & Information Division
Research Communications BranchEditorial Office
Manuscript Submission
Authors must submit one paper copy of the double-spacedmanuscript, one disk copy, and original figures (if applicable).NEFSC authors must include a completely signed-off "NEFSCManuscript/Abstract/Webpage Review Form." Non-NEFSC au-thors who are not federal employees will be required to sign a"Release of Copyright" form.
Send all materials and address all correspondence to: EditorialOffice, NMFS Northeast Fisheries Science Center, 166 WaterStreet, Woods Hole, MA 02543-1026.

National Marine Fisheries Service, NOAA166 Water St.
Woods Hole, MA 02543-1026
Publications and Reportsof the
Northeast Fisheries Science CenterThe mission of NOAA's National Marine Fisheries Service (NMFS) is "stewardship of living marine resourcesfor the benefit of the nation through their science-based conservation and management and promotion of the healthof their environment." As the research arm of the NMFS's Northeast Region, the Northeast Fisheries ScienceCenter (NEFSC) supports the NMFS mission by "conducting ecosystem-based research and assessments of livingmarine resources, with a focus on the Northeast Shelf, to promote the recovery and long-term sustainability of theseresources and to generate social and economic opportunities and benefits from their use." Results of NEFSCresearch are largely reported in primary scientific media (e.g., anonymously-peer-reviewed scientific journals).However, to assist itself in providing data, information, and advice to its constituents, the NEFSC occasionallyreleases its results in its own media. Currently, there are three such media:
NOAA Technical Memorandum NMFS-NE -- This series is issued irregularly. The series typically includes: data reports of long-term field or lab studies of important species or habitats; synthesis reports for important species or habitats; annual reports of overallassessment or monitoring programs; manuals describing program-wide surveying or experimental techniques; literature surveys ofimportant species or habitat topics; proceedings and collected papers of scientific meetings; and indexed and/or annotated bibliographies.All issues receive internal scientific review and most issues receive technical and copy editing.
Northeast Fisheries Science Center Reference Document -- This series is issued irregularly. The series typically includes: data reportson field and lab studies; progress reports on experiments, monitoring, and assessments; background papers for, collected abstracts of,and/or summary reports of scientific meetings; and simple bibliographies. Issues receive internal scientific review, but no technicalor copy editing.
Resource Survey Report (formerly Fishermen's Report) -- This information report is a quick-turnaround report on the distributionand relative abundance of selected living marine resources as derived from each of the NEFSC's periodic research vessel surveys of theNortheast's continental shelf. There is no scientific review, nor any technical or copy editing, of this report.
OBTAINING A COPY: To obtain a copy of a NOAA Technical Memorandum NMFS-NE or a Northeast Fisheries Science CenterReference Document, or to subscribe to the Resource Survey Report, either contact the NEFSC Editorial Office (166 Water St., WoodsHole, MA 02543-1026; 508-495-2228) or consult the NEFSC webpage on "Reports and Publications" (http://www.nefsc.noaa.gov/nefsc/publications/).
ANY USE OF TRADE OR BRAND NAMES IN ANY NEFSC PUBLICATION OR REPORT DOES NOT IMPLY ENDORSE-MENT.
MEDIA MAIL