Embed Size (px)
Citation preview
Northeast Avalon ACAP’s Wetland Survey Project
Final Report for 2012-2013
April 2013
Prepared By:
Phoebe Metcalfe (B.Sc., ADWQ)
NAACAP Environmental Technologist
With Insight From:
The Science and Technical Committee of the Northeast Avalon ACAP’s Board of
Directors

i
Executive Summary
In 2011- 2012 the Northeast Avalon ACAP (NAACAP) began wetland surveys
throughout the Northeast Avalon Peninsula of Newfoundland and Labrador. During the 2012-
2013 project year, NAACAP visited an additional 14 wetlands and 12 barachois ponds as part of
its Wetlands Survey Project. This report gives details on the 14 wetlands; the information from
the barachois ponds is given in a separate report titled An Examination of the Barachois Pond
Ecosystems on the Northeast Avalon Peninsula of Newfoundland and Labrador.
This project obtained baseline data from the visited wetlands including information
pertaining to: flora located in each, including the presence of non- native species; benthic
macroinvertebrate types found in each and their classification as water quality indicators, and
various water quality readings. With the use of the Stress Evaluation Rubric, developed in 2011-
2012, each wetland was assigned a number based on surrounding developments and the potential
for stress to the wetland from them.
Overall, the wetlands visited contained a variety of flora and invertebrates. For the most
part, water quality parameter levels were within guidelines suggested for the protection of
aquatic life. The wetlands also illustrated varying potential stress from surroundings.
Acknowledgments
Principle funding for this project came from Environment Canada’s Atlantic Ecosystem
Initiative program. NAACAP board members provided advice and provided assistance to staff
through all aspects of this project. A Conservation Corps Newfoundland and Labrador Green
Team collected field data from the wetland sites. Credit is given to Green Team 2012 members
Julia Collins, Aaron Wiseman and Catherine Hooper for their hard work. Bob Helleur at of the
Department of Chemistry at Memorial University helped with disposal of waste generated from
the Hach Stream Survey kits. Suggestions for wetland sites to visit were supplied by the Town of
Portugal Cove St. Philip’s, the Town of Flatrock, and the Town of Wabana, all of whom had
staff members who met with the Green Team to discuss wetlands within municipal boundaries
and provided assistance with finding the sites. The Topsail Beach wetland site was
recommended by a resident of the area that was concerned that the wetland would be lost to
development pressures. Aare Voitk and Claudia Hanel kindly provided botanist expertise with
the identification of plants collected and dried during the plant surveys.

ii
Table of Contents: Executive Summary ............................................................................................................................. i
Acknowledgements............................................................................................................................. i
1.0 Introduction ................................................................................................................................. 1
1.1 What is a Wetland? ............................................................................................................................. 1
1.2 Functions and Benefits of Wetlands ................................................................................................... 1
1.3 Wetland Threats and Pressures .......................................................................................................... 2
2.0 Methods ...................................................................................................................................... 2
2.1 Plant Sampling..................................................................................................................................... 2
2.2 Benthic Macroinvertebrate Sampling ................................................................................................. 3
2.3 Water Quality ...................................................................................................................................... 4
2.4 Determination of Wetland Boundaries ............................................................................................... 4
2.4.1 Forest Borders .............................................................................................................................. 4
2.4.2 Topographic Borders .................................................................................................................... 5
2.4.3 Deep Water Pond Boundaries ..................................................................................................... 5
2.4.4 Developed Borders ...................................................................................................................... 5
2.4.5 Wetland Complexes ..................................................................................................................... 5
2.5 Ranking of Wetlands’ Stressors ........................................................................................................... 5
3.0 Results ......................................................................................................................................... 6
3.1 Plant Sampling..................................................................................................................................... 7
3.2 Macroinvertebrate Sampling .............................................................................................................. 8
3.3 Water Quality .................................................................................................................................... 10
3.4 Stress Evaluation Rubric Scores ........................................................................................................ 11
4.0 Discussion .................................................................................................................................. 12
5.0 Recommendations ..................................................................................................................... 13
References ....................................................................................................................................... 14
Appendix A Wetland Delineations and Sample Site Locations ............................................................ 15
Appendix B- Stress Evaluation Rubric Template ................................................................................ 29
Appendix C- Wetland Site Data ......................................................................................................... 31
iii
List of Figures and Tables
Figure 1. : The locations of the 14 wetlands surveyed during the 2012- 2013 project year throughout the
Northeast Avalon Peninsula of Newfoundland and Labrador represented by yellow markers .................. 6
Table 1. Richness data obtained for each plant transect within the surveyed wetlands .......................... 7
Table 2. Macro-invertebrate richness values, representing the number of different orders identified, at
each location where invertebrate sampling occurred during the summer of 2012 .................................. 8
Table 3. The macroinvertebrates identified at each surveyed wetland site, classified based on their
pollution tolerance. Those organisms that did not clearly fit into one of the classifications were placed
under the category Other. ................................................................................................................... 9
Table 4. Water quality parameters, temperature, pH, dissolved oxygen (DO), nitrate, total phosphate,
un-ionized ammonia, and ammonium ion obtained from each the wetland study sites. Values in red text
exceed the Canadian Water Quality Guidelines for the Protection of Aquatic Life ................................. 10
Table 5. Stress Evaluation Rubric Scores for the Wetland Sites surveyed during 2012. ......................... 11

1
1.0 Introduction
In 2011, the Northeast Avalon ACAP (NAACAP) started to collect baseline data from
the wetlands on the Northeast Avalon Peninsula. This project was initiated because of the
pressure that rapid increase in development in the region is having on wetlands; in terms of
numbers and quality. This project was continued in 2012, as the amount of wetlands in the
region was too extensive for one year.
1.1 What is a Wetland?
Wetlands, as defined by Environment Canada (2012), are:
“Lands that are seasonally or permanently covered by shallow water, including
lands where the water table is at or close to the surface. The presence of abundant
water causes the formation of hydric soils and favours the dominance of either
hydrophytic or water-tolerant plants. The five major types of wetlands are: marshes,
swamps, bogs, fens, and shallow open waters”
Each of the five types of wetlands given in the above definition can also be further
classified, but will not be mentioned here.
1.2 Functions and Benefits of Wetlands
In the past, wetlands were sometimes viewed as wasteland areas that served no important
function and actually hindered important land uses. In some cases, wetlands were even viewed as
areas that were dangerous or carried disease (Moore, 2008). However, wetlands carry out critical
ecological functions and provide ecosystem services within watersheds and offer numerous
natural benefits to human society.
Wetland ecosystems are very diverse. They provide habitat for many species of flora and
fauna, some of which are found only in wetlands, and some of which are at risk or endangered.
Some species rely on wetlands for their whole lifecycle, and others only for a part of it, for
example for reproduction. Wetlands serve as vital ecosystems for sustaining a wide variety of
flora and fauna populations.
Wetlands are an important component of a watershed, and interact with nearby ponds,
rivers and ground water. They are often referred to as nature’s kidneys because of their ability to
filter various pollutants. This filter ability becomes increasingly important as deforestation and
the presence of impermeable surfaces occur as a result of increased anthropogenic land use.
Wetlands intercept the direct path of pollutant laden surface waters to local ponds and rivers
from impermeable and bare surfaces.
Wetlands can also be viewed as sponges, retaining water during wet periods and releasing
it during dry periods (Environment Canada, 2012). In this regard, wetlands can be a natural
defense against flash floods of water bodies by retaining water and releasing it slowly into

2
nearby rivers and ponds. This also minimizes erosion of stream banks, reducing the threat of
water siltation and its possible negative effects on water quality and aquatic life. A decrease in
the flood potential of waterways means that human development and infrastructure are at a
decreased risk of flood damage, minimizing the significant costs related to damage repair.
Wetlands also serve as recreational and educational venues. Their high ecological
diversity makes them ideal locations for outdoor education activities. They are also common bird
watching locations, and are attractive natural locations for walking trails.
1.3 Wetland Threats and Pressures
There are multiple factors that can negatively affect wetland health and place pressure on
the wetland ecosystem, many of which are directly human induced. As noted above, wetlands
were, and can often still be, seen as valueless lands that can be put to better usage. Oftentimes,
these better uses include urban development and agriculture.
Toxic inputs resulting from surface water runoff have the potential to alter the water
quality of a wetland and damage its overall health. Non-native aquatic and plant species can also
threaten the biodiversity of wetlands, by out-competing native species and altering hydrology
patterns and nutrient regimes.
Built infrastructure such as roads that allow access to various types of human
development also pose threats to wetland ecosystem health. Research has shown that the density
of roads impact the biodiversity of wetlands, and not only when the road runs directly through or
alongside a wetland (Forman et al., 2003). Roads interrupt natural connectivity between water
flows and habitat and provide a direct passageway for contaminants that are related to ice
control, road construction, and automobile function (Forman et al., 2003).
2.0 Methods
2.1 Plant Sampling
Plant inventory data were collected using a belt transect survey method. The length of
each transect varied depending on the size and accessibility of the wetland, with a goal of a 50m
transect; if this was not possible, the transect length was always a multiple of five. A one meter
squared quadrat was centered on the transect line at five meter intervals. The number of transects
surveyed varied between wetlands, as they were based on relative wetland size (wetland area was
not calculated), but generally each surveyed wetland had two plant transects.
Plants found within each quadrat were counted and percent cover estimated. Plants were
identified to species name where possible. In most cases, grasses, sedges, rushes and ferns were
not identified to species level due to difficulty in correctly identifying species. Plant
identification was determined on site using identification field guide booklets including: A Field
Guide to Wildflowers Northeastern and North-Central North America by Roger Tory Peterson
and Margaret McKenny; Trees and Shrubs Newfoundland and Labrador by Tod Boland; A
Travellers’ Guide to Wild Flowers of Newfoundland Canada by Bill and June Titford; and
3
Native Trees and Shrubs of Newfoundland and Labrador by A. Glen Ryan. Plants that could not
be identified in the field were noted, sketched or photographed and a sample taken and dried in a
plant press so that they could be later identified with the help of botanists. Data obtained during
the field visits were later transferred to digital format.
Using the plant survey data collected, a richness value was obtained that was indicative
of the number of different plants or plant groups identified at each site. The values would be
under estimates of the true richness, as some species were grouped by plant type, as described
above.
The number of non- native plant type at each site was also determined. Non-native plants
were identified based on correspondence with local authorities during the 2011 – 2012 Wetland
Survey Project (J. Maunder, personal communication, August 15, 2011) and lists of non- native
plant species developed by the Memorial University of Newfoundland Botanical Gardens and the
Newfoundland and Labrador Invasive Species Council.
2.2 Benthic Macroinvertebrate Sampling
Sampling for benthic macroinvertebrates was performed at two sites for each wetland site
surveyed; these two sites corresponded with the inflow and outflow of the wetland where
possible. Depending on substrate type at each sample location, one of two methods was used for
benthic macroinvertebrate sampling. A kick net was used at locations of sandy or fine sediment
substrates, and a serber sampler methodology, involving turning over rocks and scrubbing them
to obtain invertebrates, was used to investigate invertebrates in areas with a rocky substrate.
When a kick net was used, sample effort was kept consistent through the use of a timed
sample collection. Substrate was disturbed for thirty seconds and collected in the net by moving
the net in a zig-zag motion through the disturbed material. The collected material was then
transferred to a white dish pan where macroinvertebrates were identified and returned to the
environment. In areas with rocky substrates a dish pan was partially filled with water from the
sample location. An area of approximately 30 square centimetres was selected and rocks within
that space were removed from their location and scrubbed into the dish pan to loosen
macroinvertebrates for identification.
Invertebrates were identified in the field where possible; specimens that could not be
identified in the field were kept in ethanol and later observed with a microscope to aid in
identification. Resources used for identification included Charlotte E. Holmes’ guidebook
Common Insects of Oxen Pond Botanic Park and Insects- Their Natural History and Diversity:
With a Photographic Guide to Insects of North America by Stephen A. Marshall. While
identifying to species was not possible, all organisms were identified to order. Invertebrate
richness was calculated for each invertebrate sample location as an indication of the number of
different macroinvertebrate types found there.
Macroinvertebrates can be utilized to determine water quality, as some types are more
sensitive to pollutants than others. For this study, identified macroinvertebrates were assigned a

4
value of 1, 2 or 3, based on their tolerance to pollution. The assigning of these values was based
on the Biotic Index for Water Quality taken from the teacher’s resource Finding the Balance:
For Earth’s Sake by Dennis Minty, Heather Griffin and Dan Murphy. This Index assigned a
value of 1 to invertebrates with a high tolerance of pollution, a value of 2 to those invertebrates
that had a moderate tolerance of pollution, and a value of 3 to those invertebrates that have a low
tolerance of pollution. Another reference was used to assign values based on pollution tolerance
if an organism was not found in this index. This was taken from the guidebook Volunteer Water
Quality Monitoring Part of the Missouri Stream Team Program, which is a partnership between
the Missouri Department of Natural Resources, the Missouri Department of Conservation, and
the Conservation Federation of Missouri. The invertebrate scoring was found in Chapter 4,
Biological Monitoring and is available online at http://www.dnr.mo.gov/env/wpp/vmqmp/vwqm-
intro04.pdf. The scoring located there was opposite to that used in index found in Finding the
Balance: For Earth’s Sake, so it was altered so that scores were assigned the same as the index, a
value of 1 to invertebrates with a high tolerance of pollution, a value of 2 to those invertebrates
that had a moderate tolerance of pollution, and a value of 3 to those invertebrates that have a low
tolerance of pollution. This assigning of scores was slightly challenging, as the above mentioned
two references used common names, which can sometimes vary amongst people and geographic
area.
2.3 Water Quality
Water quality parameters were measured for each wetland site using Hach Stream Survey
kits. Temperature and pH were recorded in the field. The other parameters tested using the
Hach kits were more difficult to perform in the field due to safety reasons, mainly the hazardous
nature of some of the reagents used and because of the need to boil the sample for the phosphate
test. It was thought that safety could be maintained indoors rather than outdoors. A water
sample collected for the dissolved oxygen test had to be tested in the field because of the
unstable nature of dissolved oxygen. However, testing for total phosphates, nitrates, ammonia
and ammonium ion was performed after returning from the field with a chilled water sample.
2.4 Determination of Wetland Boundaries
The wetland boundaries were identified using Google Earth satellite imagery. Many
wetland boundaries were distinct and evident from visual inspection while other wetland areas
were difficult to delineate due to unclear transition zones. A consistent set of criteria was
required to identify the boundaries of wetland areas. This study used forest borders, topographic
borders, deep-water pond boundaries, developed borders, and wetland complexes to delineate the
wetland sites.
2.4.1 Forest Borders
A well-defined tree line indicates a wetland boundary. There may be a transition zone of
stunted, chlorotic (i.e. lacking green color due to chlorophyll deficiency) trees. This transition
zone was included within the wetland boundary when the trees are sparse, and excluded when
the tree line is dense and defined as per Buchanan & Ringius (1993).
5
2.4.2 Topographic Borders
Wetlands occur where the land slopes into a depression. Slopes may be abrupt or gradual
in nature. The boundary was chosen where the topography clearly showed a visible
depression(Buchanan & Ringius 1993).
2.4.3 Deep Water Pond Boundaries
A wetland bordering a lake or pond is arbitrarily chosen to coincide with water greater
than two meters in depth (Buchanan & Ringius, 1993). Information regarding water depth was
unavailable at the time of analysis. Therefore, wetland boundaries around deep water ponds were
delineated at the shoreline.
2.4.4 Developed Borders
Development contiguous to the wetland area indicated a boundary for this study.
Development was defined to include roadways, building lots, and farm fields; development does
not include walkways, foot bridges, or other similar small developmental features (Buchanan
&Ringius, 1993).
2.4.5 Wetland Complexes
Wetland areas that are close in proximity to each other or hydrologically connected were
treated as a single unit (Buchanan & Ringius 1993).
2.5 Ranking of Wetlands’ Stressors
The wetlands studied during the summer of 2012 were ranked based primarily on the
threats surrounding them to give a score that represents the potential for stress to the wetland
ecosystem to occur. These threats were recorded in field notes taken during site visits and were
further identified using satellite imagery.
During NAACAP’s 2011- 2012 Wetlands Survey project, a Stress Evaluation Rubric was
designed to assign a number based on potential stressors located near the wetland boundary.
This same rubric was used for this project (Appendix B). A different value was assigned in each
stressor category based on the distance of the stressor from the wetland boundary. The size of the
stressor was also a factor in the case of agriculture, impermeable surfaces, residential building
lots and roads. Pasture lands and farm fields fall under the agriculture category. Areas of
continuous asphalt, concrete, roofs, or other similar impermeable surfaces, were considered an
impervious surface feature. Sparsely developed areas, those with no more than one building lot
within 100 meters of roadway, were given a lower value than those building lots more densely
developed (more than one building lot within 100 meters of roadway). Larger roadways had a
higher stress value. If the stressors were located at a higher elevation than the wetland, the value
assigned for that stressor was multiplied by two, as there could be a greater potential for negative
6
impact on the wetland as runoff that flows down slope to the wetland area could carry
contaminants with it. A change in elevation of 3% over 100m or greater was considered to be a
higher elevation.
Features identified as stressors were quantified where necessary using ArcGIS. The
features were located on the Bing Map basemap available from Esri and traced to give a polygon
whose approximate area could be calculated. A 15m, 30m, and 50m buffer was drawn around the
wetland boundary to determine what range the feature was located within. The slope between the
wetland and the feature was estimated using 1m contour interval data where available, or the
elevation profile tool in Google Maps where the contour data was not available.
The values given to each stressor category in the Stress Evaluation Rubric were summed
to give a total value for a wetland. A higher score indicates a higher level of stress the wetland is
facing due to development near its boundaries
3.0 Results
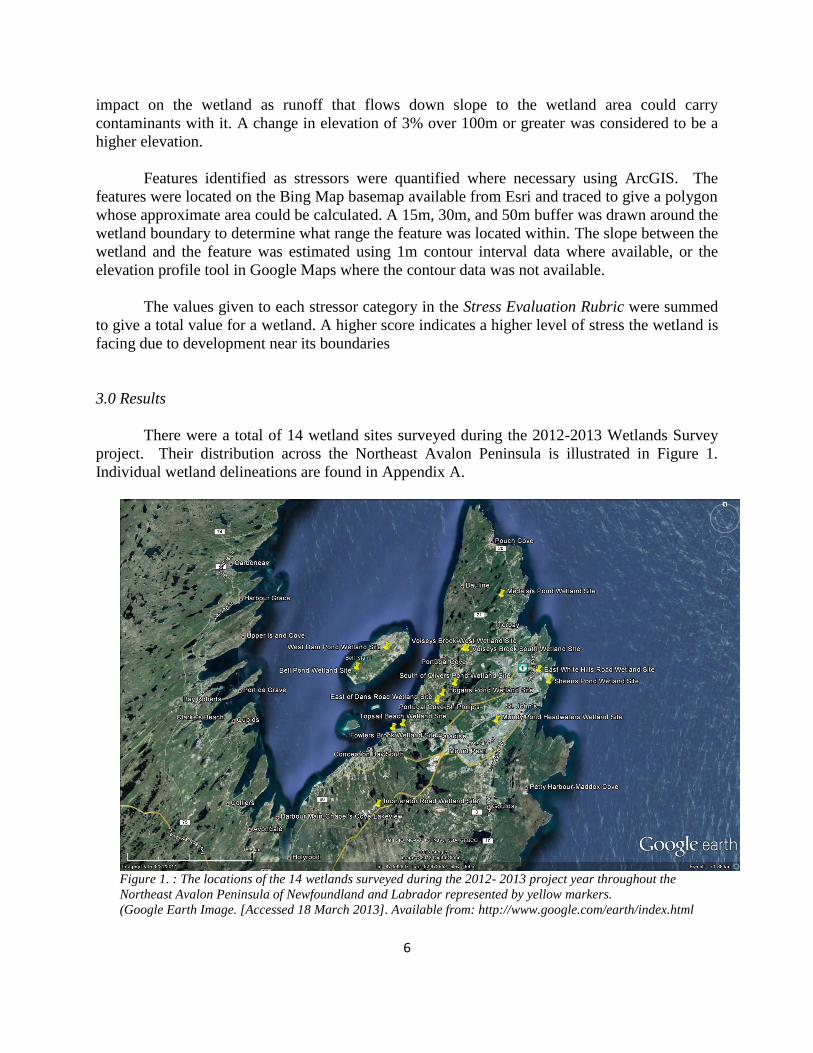
There were a total of 14 wetland sites surveyed during the 2012-2013 Wetlands Survey
project. Their distribution across the Northeast Avalon Peninsula is illustrated in Figure 1.
Individual wetland delineations are found in Appendix A.
Figure 1. : The locations of the 14 wetlands surveyed during the 2012- 2013 project year throughout the
Northeast Avalon Peninsula of Newfoundland and Labrador represented by yellow markers.
(Google Earth Image. [Accessed 18 March 2013]. Available from: http://www.google.com/earth/index.html

7
3.1 Plant Sampling
Table 1 details the richness information obtained from each sample transect within each
surveyed wetland.
Table 1. Richness data obtained for each plant transect within the surveyed wetlands
Sample Site Location Transect
Length
GPS Location of Transect
Start
Plant
Richness
Number
of Non-
native
Species
Bell Pond Transect 1 50m 47.60806°N, 3.0073oW 27 0
Bell Pond Transect 2 50m 47.6077 oN, 53.008
oW 17 0
East of Dans Road Transect 1 50m 47.56816 oN, 52.8643
oW 24 0
East of Dans Road Transect 2 50m 47.56853 oN, 52.8649
oW 22 0
Fowlers Brook Transect 1 50m 47.53602 oN, 52.9444
oW 21 2
Fowlers Brook Transect 2 25m 47.53549 oN, 52.9442
oW 19 1
Hogans Pond Transect 1 50m 47.57629 oN, 52.8567
oW 18 0
Hogans Pond Transect 2 50m 47.5762 oN, 52.856
oW 22 0
Incinerator Road Transect 1 50m 47.44529 oN, 52.9694
oW 24 0
Incinerator Road Transect 2 50m 47.44537 oN, 52.9698
oW 28 0
Medalsis Pond Transect 1 50m 47.69515 oN, 52.7513
oW 30 0
Medalsis Pond Transect 2 50m 47.69471 oN, 52.7514
oW 27 0
Mundy Pond Headwaters Transect 1 50m 47.5442 oN, 52.7598
oW 11 1
Sheens Pond Transect 1 50m 47.59258 oN, 52.6671
oW 11 1
Sheens Pond Transect 2 25m 47.59258 oN, 52.6671
oW 11 1
South of Olivers Pond Transect 1 50m 47.58977 oN, 52.8351
oW 12 0
South of Olivers Pond Transect 2 50m 47.58876 oN, 52.8339
oW 18 0
Topsail Beach Transect 1 50m 47.5409oN, 52.9265
oW 11 1
Topsail Beach Transect 2 50m 47.54082 oN, 52.9269
oW 20 2
Voiseys Brook South Transect 1 50m 47.62823 oN, 52.8152
oW 25 0
Voiseys Brook West Transect 1 50m 47.62985oN, 52.8176
oW 22 0
Voiseys Brook West Transect 2 50m 47.63029 oN, 52.8184
oW 21 0
West Dam Pond Transect 1 50m 47.63158 oN, 52.9572
oW 17 0
West Dam Pond Transect 2 50m 47.63213 oN, 52.9554
oW 15 0
East White Hills Road Transect 1 50m 47.60385 oN, 52.6878
oW 15 0
East White Hills Road Transect 2 50m 47.60388 oN, 52.6865
oW 20 1
East White Hills Road Transect 3 50m 47.60514 oN, 52.6819
oW 20 1
8
The plant richness for the identified plant species for each transect varied from 11
(Mundy Pond Headwaters Transect 1, Sheens Pond Transect 1 and 2, and Topsail Beach
Transect 2) to 30 (Medalsis Pond Transect 1) different species identified. Fowlers Brook
wetland was found to contain two non-native species, common reed (Phragmites australis) and
common St. John’s wort (Hypericum perforatum). Mundy Pond Headwaters wetland and
Sheen’s Pond wetland had one non-native plant species, cattail (Typha latifolia). There were two
non-native species identified in the Topsail Beach wetland site, common reed (Phragmites
australis) and rough mannagrass (Glyceria maxima). Rough mannagrass (Glyceria maxima) was
also found in the East White Hills Road wetland site. Further details on plant species/ type found
and abundance in sample areas can be found in Appendix C.
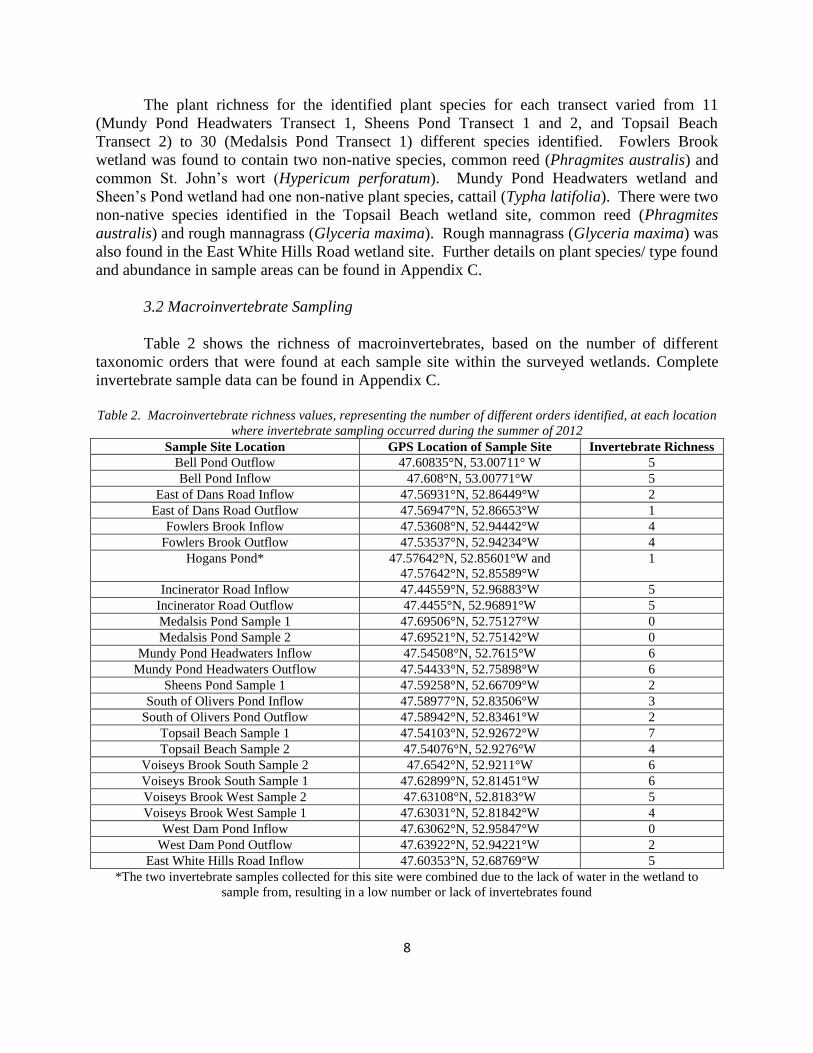
3.2 Macroinvertebrate Sampling
Table 2 shows the richness of macroinvertebrates, based on the number of different
taxonomic orders that were found at each sample site within the surveyed wetlands. Complete
invertebrate sample data can be found in Appendix C.
Table 2. Macroinvertebrate richness values, representing the number of different orders identified, at each location
where invertebrate sampling occurred during the summer of 2012
Sample Site Location GPS Location of Sample Site Invertebrate Richness
Bell Pond Outflow 47.60835°N, 53.00711° W 5
Bell Pond Inflow 47.608°N, 53.00771°W 5
East of Dans Road Inflow 47.56931°N, 52.86449°W 2
East of Dans Road Outflow 47.56947°N, 52.86653°W 1
Fowlers Brook Inflow 47.53608°N, 52.94442°W 4
Fowlers Brook Outflow 47.53537°N, 52.94234°W 4
Hogans Pond* 47.57642°N, 52.85601°W and
47.57642°N, 52.85589°W
1
Incinerator Road Inflow 47.44559°N, 52.96883°W 5
Incinerator Road Outflow 47.4455°N, 52.96891°W 5
Medalsis Pond Sample 1 47.69506°N, 52.75127°W 0
Medalsis Pond Sample 2 47.69521°N, 52.75142°W 0
Mundy Pond Headwaters Inflow 47.54508°N, 52.7615°W 6
Mundy Pond Headwaters Outflow 47.54433°N, 52.75898°W 6
Sheens Pond Sample 1 47.59258°N, 52.66709°W 2
South of Olivers Pond Inflow 47.58977°N, 52.83506°W 3
South of Olivers Pond Outflow 47.58942°N, 52.83461°W 2
Topsail Beach Sample 1 47.54103°N, 52.92672°W 7
Topsail Beach Sample 2 47.54076°N, 52.9276°W 4
Voiseys Brook South Sample 2 47.6542°N, 52.9211°W 6
Voiseys Brook South Sample 1 47.62899°N, 52.81451°W 6
Voiseys Brook West Sample 2 47.63108°N, 52.8183°W 5
Voiseys Brook West Sample 1 47.63031°N, 52.81842°W 4
West Dam Pond Inflow 47.63062°N, 52.95847°W 0
West Dam Pond Outflow 47.63922°N, 52.94221°W 2
East White Hills Road Inflow 47.60353°N, 52.68769°W 5
*The two invertebrate samples collected for this site were combined due to the lack of water in the wetland to
sample from, resulting in a low number or lack of invertebrates found

9
The macroinvertebrate richness ranged from zero at the West Dam Pond Inflow and the
Medalsis Pond Sample 1 and 2 sites to 7 at the Topsail Beach Sample 1 site.
The macroinvertebrates found at each wetland site classified based on their pollution
tolerance are given in Table 3
Table 3. The macroinvertebrates identified at each surveyed wetland site, classified based on their pollution
tolerance. Those organisms that did not clearly fit into one of the classifications were placed under the category
Other.
Wetland Site
Name
High Tolerance of
Pollution (1 point)
Moderate Tolerance of
Pollution (2 points)
Low Tolerance of
Pollution (3 points)
Other
Bell Pond Midge larvae
Amphipod (scud)
Predaceous Diving Beetle
Dragonfly nymph
Giant Water Bug (Order Hemiptera)
East of Dans Road Midge larvae Dragonfly nymph Water boatmen (Family Corixidae)
Fowlers Brook Leech
Water Worm
Damselfly nymph
Crane Fly larvae
Crawling Water Beetle
Stonefly nymph
Hogans Pond Dragonfly nymph
Incinerator Road Midge larvae
Dragonfly nymph
Predaceous Diving Beetle
Beetle larvae
Caddis Fly larvae
Unknown (Order Plecoptera)
Weevil
Adult Mosquito
Water Mite
Medalsis Pond (No
macroinvertebrates
found)
Mundy Pond
Headwaters
Leech
Midge larvae
Dragonfly nymph
Amphipod (scud)
Caddis Fly larvae
Stonefly nymph
Marsh Beetle
Sheens Pond Water Beetle Mosquito larvae
South of Olivers
Pond
Predaceous Diving Beetle
Beetle larvae (type
unknown)
Dragonfly Nymph
Pill Clam
Whirligig Beetle
Water boatmen
Topsail Beach Midge larvae
Leech
Aquatic Earthworm
Amphipod (scud)
Mayfly adult
Seed Shrimp
Flatworm
Water boatmen
Water Strider
Voiseys Brook
South
Midge larvae
Leech
Amphipod (scud)
Aquatic sowbug
Caddis fly larvae
Northern Caddisfly (Family
Limnephilidae)
Order Diptera, Family Psychodidae Larvae
Aquatic Mite
Flatworm
Order Coleoptera, Family Polycenropidae
(life stage not given)
Voiseys Brook
West
Midge Larvae
Predacious Diving Beetle
Marsh Beetle Larvae
Dragonfly nymph
Common Pillbug (Order Isopoda, Family
Armadelididae)
Blade Fly (Order Diptera, Family
Simuliidae)
Water boatmen
West Dam Pond Pill/ Fingernail Clam Water boatmen
East White Hills
Road
Leech
Dragonfly nymph
Damselfly nymph
Amphipod (Scud)
Diving Beetle (family Noteridae)

10
Organisms with a low tolerance of pollution were identified in the Fowlers Brook,
Incinerator Road, Mundy Pond Headwaters, Topsail Beach and Voiseys Brook South wetland
sites. All of the wetland sites had organisms that were classified as having a high or a low
tolerance to pollution.
3.3 Water Quality
The results of water quality testing of samples collected from the surveyed wetlands are
given in Table 4.
Table 4. Water quality parameters, temperature, pH, dissolved oxygen (DO), nitrate, total phosphate, un-ionized
ammonia, and ammonium ion obtained from each the wetland study sites. Values in red text exceed the Canadian
Water Quality Guidelines for the Protection of Aquatic Life.
Wetland Site Name
GPS Location
of Water
Sample
Temp.
(°C) pH
Dissolved
Oxygen
(mg/L)
Nitrate
(mg/L)
Total
Phosphate
(mg/L)
Ammonia
(mg/L)
Ammonium
Ion (mg/L)
Bell Pond 47.60800°N,
53.00771°W 22.2 7.2 6 0 0 0.001968 0.257868
East of Dans Road 47.56931°N,
52.86449° W 22 8.3 7 0 0.04 0.007012 0.12212
Mundy Pond
Headwaters
47.54433°N,
52.75898°W 22 7.8 9 0 0 0.001686 6.31735
Fowlers Brook 47.53608°N,
52.94442°W 19.9 7.8 9 0 0 0.002928 0.126826
Hogans Pond 47.57642°N,
52.85601°W 25 7.2 3 0.44 0 0.024192 2.703792
Incinerator Road 47.44550°N,
52.96891°W 16.1 5.7 4 0 0 0 0
Medalsis Pond 47.69521°N,
52.75142°W 18.3 6.5 5 0 0.52 0 0
Sheens Pond 47.59258°N,
52.66709°W 20 6.1 0.8 0 0 0 0
South of Olivers Pond 47.58977°N,
52.83506°W 29 8.2 5 0 0.03 0.035928 0.260988
Topsail Beach 47.54103°N,
52.92672°W 20.1 7.4 9 0 0.04 0.001176 0.128726
Voiseys Brook South NA 22 8.5 7 0 0.08 0.01849 0.10997
Voiseys Brook West NA 23 7.6 7 0 0 0.017184 1.021384
West Dam Pond 47.63062°N,
52.95847°W 20 6.5 8 0 0.04 0 0
East White Hills Road 47.60353°N,
52.68769°W 17.7 6.8 4 0 0.12 0 0
The CCME Water Quality Guidelines for the Protection of Aquatic Life have
recommendations for pH, dissolved oxygen, nitrate nitrogen, nitrate and unionized ammonia.
There are no guidelines for ammonium ion, as the unionized form (NH3) is believed to be the
better indicator of ammonia toxicity (Environment Canada, 1999; Frias-Espericueta et al., 1999;
EPA, 1998 as cited in CCME, 2010), or phosphate, as phosphorus is essential for life and the
levels that cause problems can vary amongst different ecosystems (CCME, 2004). The CCME

11
Canadian Water Quality Guidelines for the Protection of Aquatic Life present a framework for
phosphorus levels, where it is recommended that values not exceed “trigger ranges” or increase
more than 50% over baseline values (CCME, 2004). The values of ammonium ion data
collected here is valuable as baseline data to compare with any future readings, as it is a
component of the nitrogen cycle and may be useful if looking at nitrogen supply.
The pH values recorded at the Incinerator Road and Sheens Pond sample sites were
outside of the 6.5- 9 range suggested in the CCME Canadian Water Quality Guidelines for the
Protection of Aquatic Life (CCME, 2006). All of the other samples had values within the
recommended range for pH. The dissolved oxygen values for the Hogans Pond (3 mg/L),
Incinerator Road (4mg/L), Medalsis Pond (5mg/L), Sheens Pond (0.8mg/L), South of Olivers
Pond (5mg/L), and East White Hills Road (4mg/L) wetland sites were below the lowest
acceptable level in warm water of 6.0mg/L for early life stages and 5.5mg/L for other life stages
suggested in the CCME Water Quality Guidelines for the Protection of Aquatic Life (CCME,
1999). The maximum recommended level of nitrates of 13mg/L (CCME, 2012) was not
exceeded at any of the wetland sites. The Hogans Pond (0.024192 mg/L) and South of Olivers
Pond (0.035928 mg/L) wetland sites had ammonia values that exceeded the 0.019mg/L
recommended for ammonia (CCME, 2010).
The total phosphate values ranged recorded ranged from zero to 0.52 mg/L, while the
ammonium ion values ranged from zero to 2.703792 mg/L.
3.4 Stress Evaluation Rubric Values
The Stress Evaluation Rubrics for each wetland site are available in Appendix C. Table 5
contains the final rubric score for each wetland site. Differences in wetland size and data
outcomes meant that they could not be compared directly to one another. However, a general
sense of what an area with a high level of potential stress would score compared to a low level
was possible.
Table 5. Stress Evaluation Rubric Scores for the Wetland Sites surveyed during 2012.
Wetland Site Name
Total Stress Evaluation
Rubric Score
Bell Pond 0
East of Dans Road 10
Mundy Pond Headwaters 42
Fowlers Brook 27
Hogans Pond 18
Incinerator Road 3
Medalsis Pond 3
Sheens Pond 6
South of Oliver's Pond 21
Topsail Beach 7
Voiseys Brook South 19
Voiseys Brook West 24
West Dam Pond 7
East White Hills Road 26
12
As shown in Table 5, the Stress Evaluation Rubric scores ranged from zero to 42. The
Bell Pond wetland site received a score of zero, while the Mundy Pond Headwaters wetland site
received a score of 42. The median value of all the scores was 14.
4.0 Discussion
The wetland sites visited during the 2012-2013 project year were found to contain
varying flora and fauna. There were also variations in the amount of potential stress from
surrounding anthropogenic pressures.
There appears to be a connection between the presence of non- native plants and higher
scores in the Stress Evaluation Rubric. The Mundy Pond Headwaters, East White Hills Road
and Fowlers Brook wetland sites all contained non-native plant species, and all scored within the
top 5 values in the rubric. This supports the suggestion that anthropogenic influence allows the
introduction of non-native species into an area. At the Topsail Beach and Mundy Pond
Headwaters wetland sites, there were non- native plant species identified and these two sites both
had plant richness values that were at the lowest end of the range of values for all the sites
surveyed. This could be because the non-native species are outcompeting the native species, the
ultimate result with time being a decreased biodiversity.
There are also some connections between water quality and invertebrate richness. The
Sheens Pond wetland site had a low pH and low levels of dissolved oxygen. It also had a low
recorded invertebrate richness, which could be related to the low dissolved oxygen levels, as
inverts need oxygen to live. However, there were other wetland sites that had a lower
invertebrate richness than the Sheens Pond site. The Medalsis Pond wetland site was found to
contain no aquatic invertebrates, and had a pH that was lower than water quality guidelines. As
the pH in Newfoundland waters is sometimes naturally low, it is not likely that pH was the cause
of the lack of inverts. One of the samples from the West Dam Pond wetland site also was found
to contain no aquatic invertebrates, but the other invert sample from that wetland did contain
inverts. It was observed in field notes that there were a number of flying insects, frogs, fish, and
what appeared to be rabbits present in the wetland. This suggests that that wetland does support
a variety of faunal life forms, although one invertebrate sample yielded poor results.
The distribution of invertebrate types labelled as having a low tolerance of pollution was
in most cases correlated with water quality values that met guidelines. This was true at the
Fowlers Brook, Mundy Pond Headwaters, Topsail Beach, and Voiseys Brook South wetland
sites. However, the Incinerator Road wetland site contained organisms with a low tolerance of
pollution, but also had dissolved oxygen and pH values that were lower than recommended.
The weather during the summer of 2012 was very dry, and therefore water levels in the
wetlands were naturally lower than they would be at times of greater precipitation levels. This
lack of precipitation would surely place pressure on the wetland ecosystems, and could be
responsible for lower plant richness, invert richness and water quality measurements that are
outside of guidelines. A comparison to past data would be necessary to confirm this. The dead

13
grass found in some of the wetlands (Appendix C) is an indicator that the low precipitation
caused stress to the plant communities in the wetlands.
Regardless of the lack of precipitation, all of the wetland sites were found to contain
some water, or evidence of water being present in the near past. As such, they can be considered
to serve some level of water retention function. The wetlands also serve as habitat, with
sightings of frogs, birds, small mammals and flying insects within them.
5.0 Recommendations:
Continued monitoring of the wetland sites would be needed to determine if there are any
negative changes to them with changes to the landscape and variations in any development
located adjacent to the wetlands. These changes would take time, so it would be beneficial to
perform future monitoring at five year intervals.
Increased awareness of wetland locations, functions and biodiversity is necessary to
conserve remaining wetlands on the Northeast Avalon Peninsula. Wetland destruction and
alteration is often done without the realization of the ecosystems and their natural functions as
water retention reservoirs and habitat, services that are expensive to effectively create
anthropogenically.

14
References:
Buchanan, Robert A., Ringius, Gordon. (1993). Significant waterways and wetlands in
St. John’s, Newfoundland. City of St. John’s: Planning Department.
Canadian Council of Ministers of the Environment. (1999). Canadian Water Quality
Guidelines for the Protection of Aquatic Life: Dissolved Oxygen (freshwater). In: Canadian
environmental quality guidelines, 1999, Canadian Council of Ministers of the
Environment, Winnipeg.
Canadian Council of Ministers of the Environment. 2004. Canadian water quality
guidelines for the protection of aquatic life: Phosphorus: Canadian Guidance Framework for the
Management of Freshwater Systems. In: Canadian environmental quality guidelines, 2004,
Canadian Council of Ministers of the Environment, Winnipeg.
CCME Canadian Council of Ministers of the Environment (2006). Canadian Water
Quality Guidelines for the Protection of Aquatic Life Summary Table. In: Canadian
environmental quality guidelines, 1999. Winnipeg, MN: Canadian Council of Ministers
of the Environment.
Canadian Council of Ministers of the Environment. 2010. Canadian water quality
guidelines for the protection of aquatic life: Ammonia. In: Canadian environmental quality
guidelines, 1999, Canadian Council of Ministers of the Environment, Winnipeg.
Canadian Council of Ministers of the Environment. 2012. Canadian water quality
guidelines for the protection of aquatic life: Nitrate. In: Canadian environmental quality
guidelines, Canadian Council of Ministers of the Environment, Winnipeg.
Environment Canada (2012). About Wetlands. Retrieved March 14, 2012 from
http://www.ec.gc.ca/tho-wlo/default.asp?lang=En&n=B4669525-1#definitions
Forman, R.T.T., Sperling, D., Bissonette, J.A., Clevenger, A.P., Cutshall, C.D., Dale,
V.H.; Fahrig, L., France, R., Goldman, C.R., Heanue, K., Jones,J.A., Swanson, F. J.,
Turrentine, T., Winter, T.C. (2003). Road Ecology Science and Solutions. (pp.179-180,
229-230, 238-239) Washington: Island Press.
Moore, P. D. (2008). Wetlands. (pp.197-199, 213-214) New York: Facts on File Inc.

15
Appendix A Wetland Delineations and Sample Site Locations
16
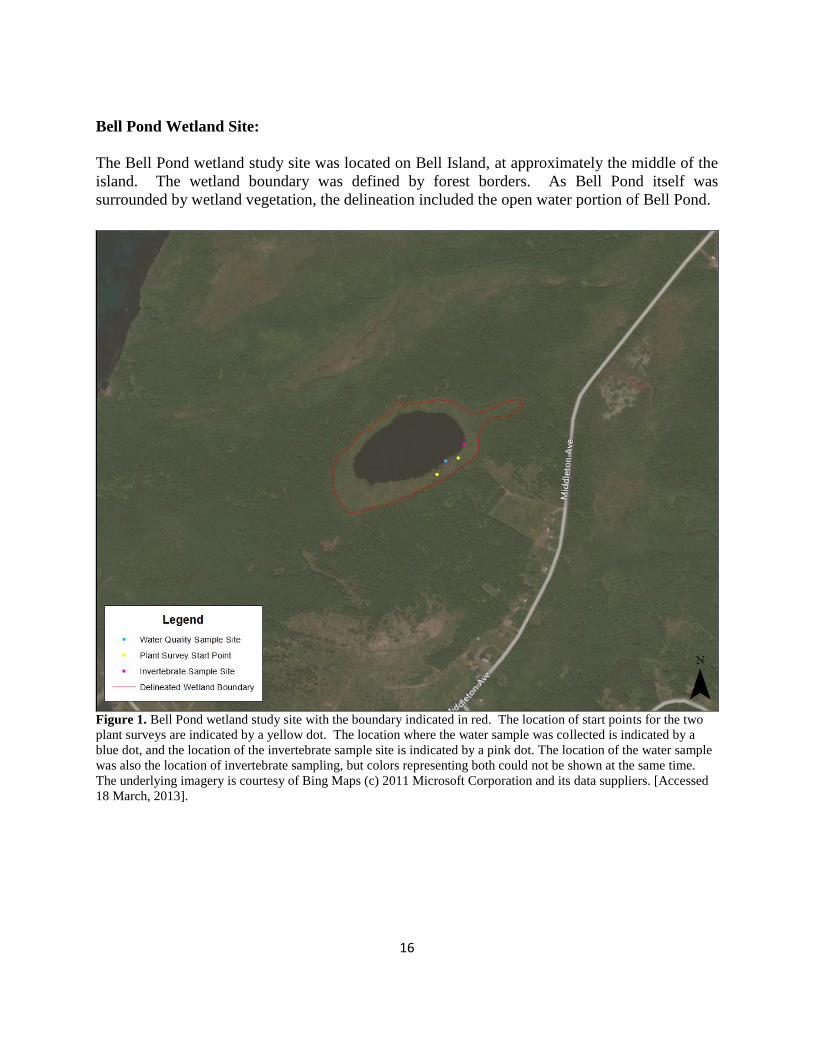
Bell Pond Wetland Site:
The Bell Pond wetland study site was located on Bell Island, at approximately the middle of the
island. The wetland boundary was defined by forest borders. As Bell Pond itself was
surrounded by wetland vegetation, the delineation included the open water portion of Bell Pond.
Figure 1. Bell Pond wetland study site with the boundary indicated in red. The location of start points for the two
plant surveys are indicated by a yellow dot. The location where the water sample was collected is indicated by a
blue dot, and the location of the invertebrate sample site is indicated by a pink dot. The location of the water sample
was also the location of invertebrate sampling, but colors representing both could not be shown at the same time.
The underlying imagery is courtesy of Bing Maps (c) 2011 Microsoft Corporation and its data suppliers. [Accessed
18 March, 2013].

17
East of Dan’s Road Wetland Site:
The East of Dan’s Road Wetland study site was located in Portugal Cove – St. Philip’s. It was
accessed via Rainbow Gully Road. The wetland boundary was defined by forest borders.
Figure 2. East of Dans Road wetland study site with the boundary indicated in red. The location of start points for
the two plant surveys are indicated by a yellow dot. The location where the water sample was collected is indicated
by a blue dot, and the location of the invertebrate sample site is indicated by a pink dot. The location of the water
sample was also the location of invertebrate sampling, but colors representing both could not be shown at the same
time. The underlying imagery is courtesy of Bing Maps (c) 2011 Microsoft Corporation and its data suppliers.
[Accessed 18 March, 2013].
18
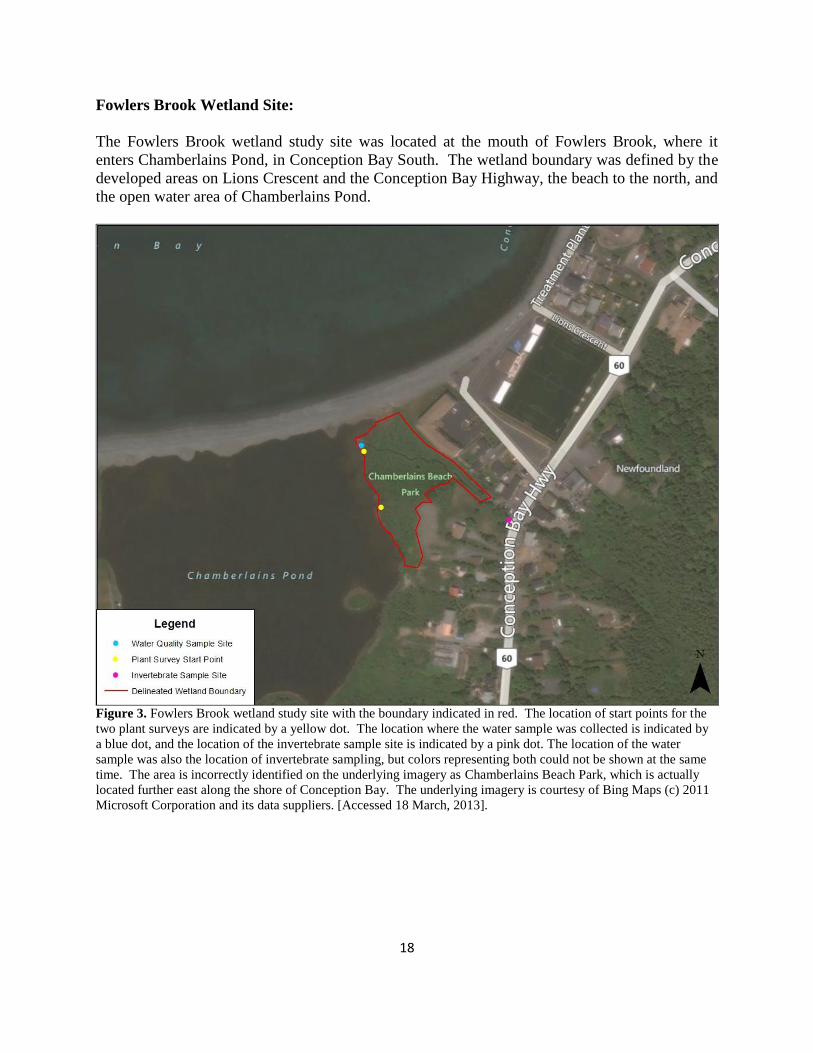
Fowlers Brook Wetland Site:
The Fowlers Brook wetland study site was located at the mouth of Fowlers Brook, where it
enters Chamberlains Pond, in Conception Bay South. The wetland boundary was defined by the
developed areas on Lions Crescent and the Conception Bay Highway, the beach to the north, and
the open water area of Chamberlains Pond.
Figure 3. Fowlers Brook wetland study site with the boundary indicated in red. The location of start points for the
two plant surveys are indicated by a yellow dot. The location where the water sample was collected is indicated by
a blue dot, and the location of the invertebrate sample site is indicated by a pink dot. The location of the water
sample was also the location of invertebrate sampling, but colors representing both could not be shown at the same
time. The area is incorrectly identified on the underlying imagery as Chamberlains Beach Park, which is actually
located further east along the shore of Conception Bay. The underlying imagery is courtesy of Bing Maps (c) 2011
Microsoft Corporation and its data suppliers. [Accessed 18 March, 2013].
19
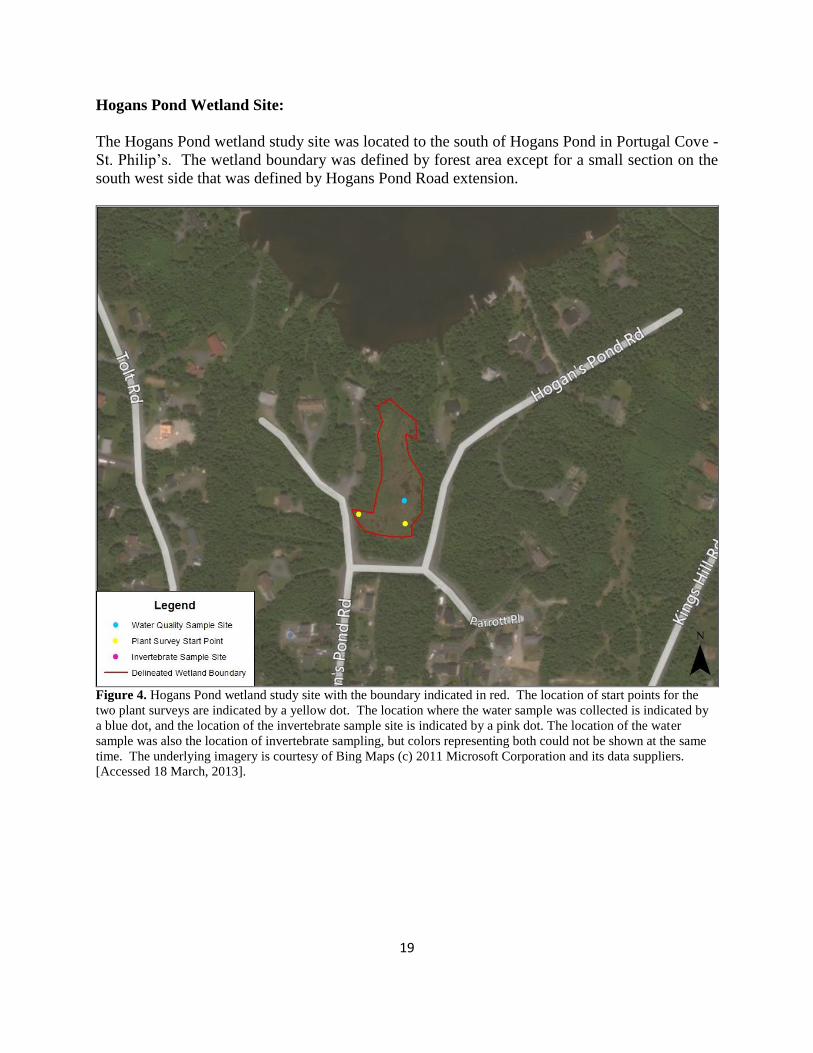
Hogans Pond Wetland Site:
The Hogans Pond wetland study site was located to the south of Hogans Pond in Portugal Cove -
St. Philip’s. The wetland boundary was defined by forest area except for a small section on the
south west side that was defined by Hogans Pond Road extension.
Figure 4. Hogans Pond wetland study site with the boundary indicated in red. The location of start points for the
two plant surveys are indicated by a yellow dot. The location where the water sample was collected is indicated by
a blue dot, and the location of the invertebrate sample site is indicated by a pink dot. The location of the water
sample was also the location of invertebrate sampling, but colors representing both could not be shown at the same
time. The underlying imagery is courtesy of Bing Maps (c) 2011 Microsoft Corporation and its data suppliers.
[Accessed 18 March, 2013].

20
Incinerator Road Wetland Site:
The Incinerator Road wetland study site was located adjacent to Incinerator Road, within the St.
John’s municipal border. The wetland boundary was defined by forest border and by Incinerator
Road to the east. While there was another wetland area on the other side of Incinerator Road
from the delineated wetland, it was not included in the delineation because it was separated by
Incinerator Road.
Figure 5. The Incinerator Road wetland study site with the boundary indicated in red. The location of start points
for the two plant surveys are indicated by a yellow dot. The location where the water sample was collected is
indicated by a blue dot, and the location of the invertebrate sample site is indicated by a pink dot. The location of the
water sample was also the location of invertebrate sampling, but colors representing both could not be shown at the
same time. The underlying imagery is courtesy of Bing Maps (c) 2011 Microsoft Corporation and its data suppliers.
[Accessed 18 March, 2013].

21
Medalsis Pond Wetland Site:
The Medalsis Pond wetland study site was located in the municipality of Flatrock. It was
accessed via Medalsis Pond Road which led into Middle Pond. The wetland boundary was
defined by forest border.
Figure 6. Medalsis Pond wetland study site with the boundary indicated in red. The location of start points for the
two plant surveys are indicated by a yellow dot. The location where the water sample was collected is indicated by
a blue dot, and the location of the invertebrate sample site is indicated by a pink dot. The location of the water
sample was also the location of invertebrate sampling, but colors representing both could not be shown at the same
time. The underlying imagery is courtesy of Bing Maps (c) 2011 Microsoft Corporation and its data suppliers.
[Accessed 18 March, 2013].
22
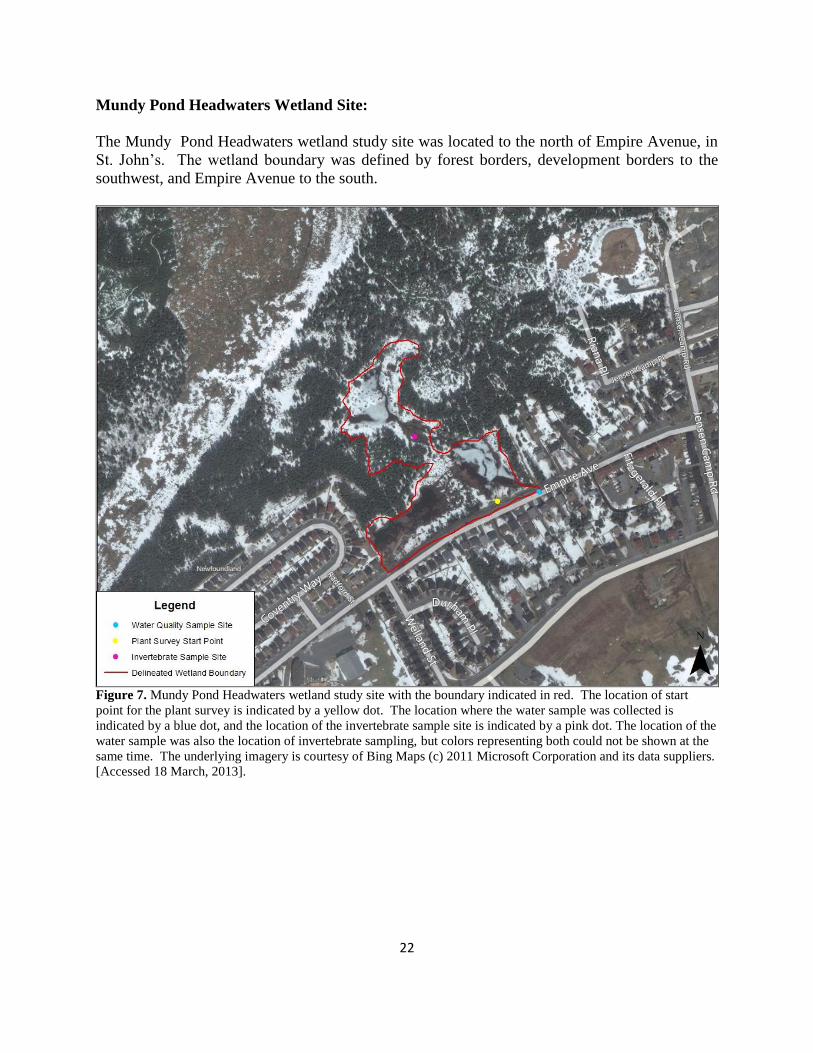
Mundy Pond Headwaters Wetland Site:
The Mundy Pond Headwaters wetland study site was located to the north of Empire Avenue, in
St. John’s. The wetland boundary was defined by forest borders, development borders to the
southwest, and Empire Avenue to the south.
Figure 7. Mundy Pond Headwaters wetland study site with the boundary indicated in red. The location of start
point for the plant survey is indicated by a yellow dot. The location where the water sample was collected is
indicated by a blue dot, and the location of the invertebrate sample site is indicated by a pink dot. The location of the
water sample was also the location of invertebrate sampling, but colors representing both could not be shown at the
same time. The underlying imagery is courtesy of Bing Maps (c) 2011 Microsoft Corporation and its data suppliers.
[Accessed 18 March, 2013].

23
Sheens Pond Wetland Site:
The Sheens Pond wetland study site was located in St. John’s. It was accessed via a small dirt
road located behind the Northwest Atlantic Fisheries Centre building on East White Hills Road.
The wetland boundary was determined mainly by forest borders and the dirt road for a short
section to the northwest.
Figure 8. Sheens Pond wetland study site with the boundary indicated in red. The location of start points for the
plant surveys are indicated by a yellow dot. The water quality sample site, the plant survey transect start point and
the invertebrate sample were all located at the same place, but colors representing all of them could not be shown at
the same time. There were actually two plant survey transects, but the start point was the same for each of them.
The underlying imagery is courtesy of Bing Maps (c) 2011 Microsoft Corporation and its data suppliers. [Accessed
18 March, 2013].
24
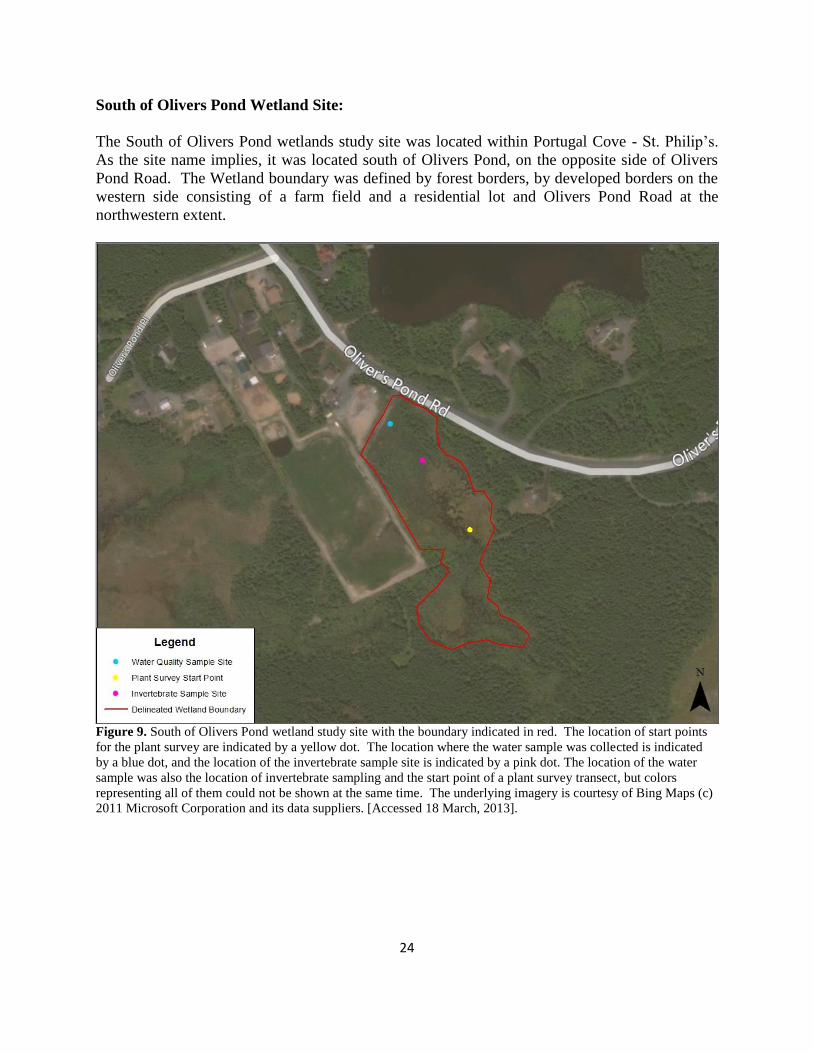
South of Olivers Pond Wetland Site:
The South of Olivers Pond wetlands study site was located within Portugal Cove - St. Philip’s.
As the site name implies, it was located south of Olivers Pond, on the opposite side of Olivers
Pond Road. The Wetland boundary was defined by forest borders, by developed borders on the
western side consisting of a farm field and a residential lot and Olivers Pond Road at the
northwestern extent.
Figure 9. South of Olivers Pond wetland study site with the boundary indicated in red. The location of start points
for the plant survey are indicated by a yellow dot. The location where the water sample was collected is indicated
by a blue dot, and the location of the invertebrate sample site is indicated by a pink dot. The location of the water
sample was also the location of invertebrate sampling and the start point of a plant survey transect, but colors
representing all of them could not be shown at the same time. The underlying imagery is courtesy of Bing Maps (c)
2011 Microsoft Corporation and its data suppliers. [Accessed 18 March, 2013].
25
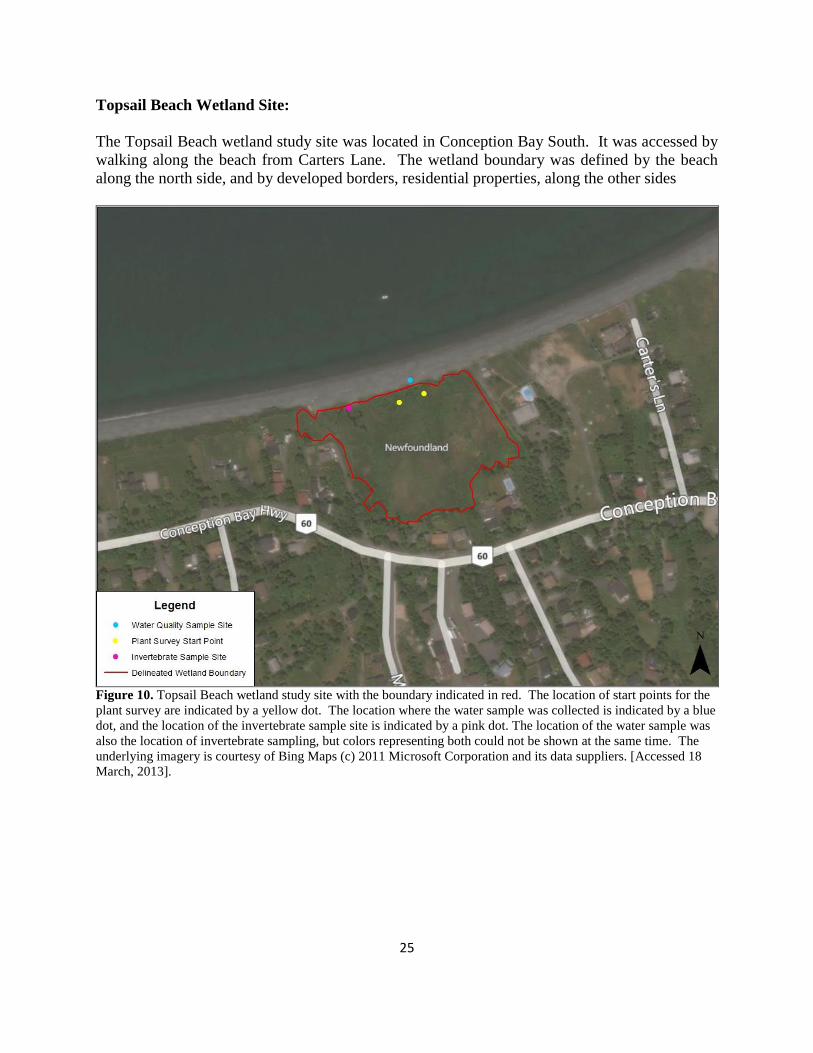
Topsail Beach Wetland Site:
The Topsail Beach wetland study site was located in Conception Bay South. It was accessed by
walking along the beach from Carters Lane. The wetland boundary was defined by the beach
along the north side, and by developed borders, residential properties, along the other sides
Figure 10. Topsail Beach wetland study site with the boundary indicated in red. The location of start points for the
plant survey are indicated by a yellow dot. The location where the water sample was collected is indicated by a blue
dot, and the location of the invertebrate sample site is indicated by a pink dot. The location of the water sample was
also the location of invertebrate sampling, but colors representing both could not be shown at the same time. The
underlying imagery is courtesy of Bing Maps (c) 2011 Microsoft Corporation and its data suppliers. [Accessed 18
March, 2013].
26
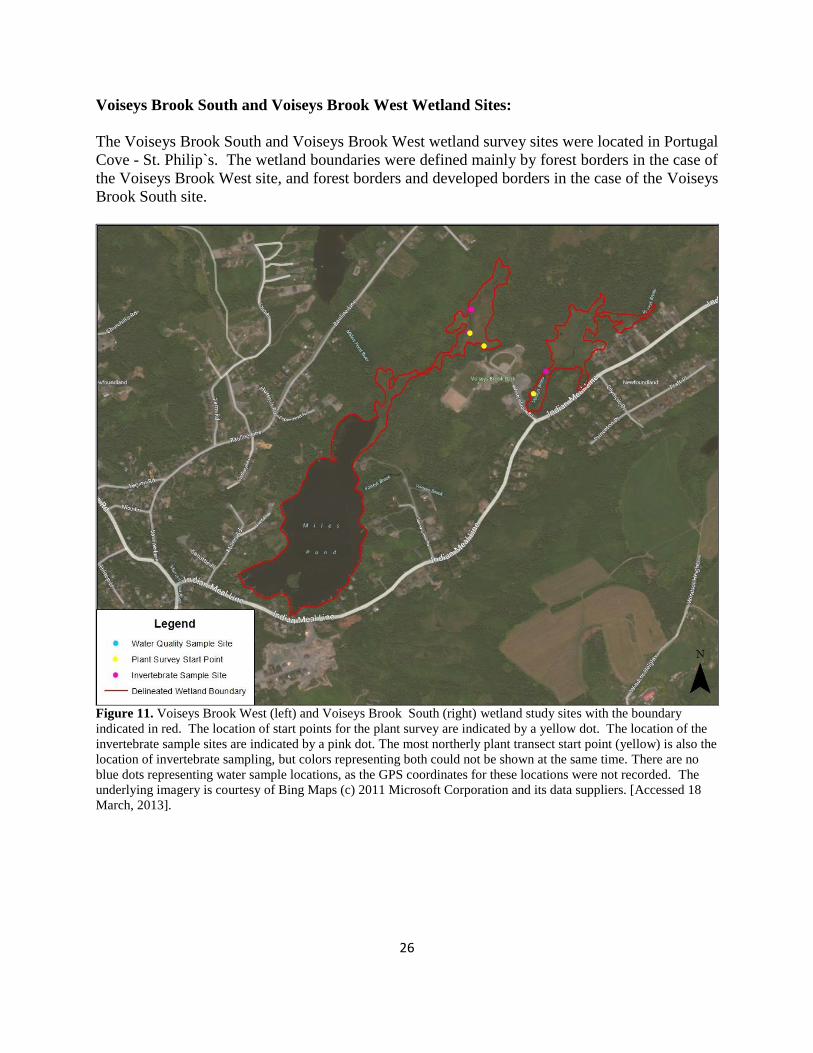
Voiseys Brook South and Voiseys Brook West Wetland Sites:
The Voiseys Brook South and Voiseys Brook West wetland survey sites were located in Portugal
Cove - St. Philip`s. The wetland boundaries were defined mainly by forest borders in the case of
the Voiseys Brook West site, and forest borders and developed borders in the case of the Voiseys
Brook South site.
Figure 11. Voiseys Brook West (left) and Voiseys Brook South (right) wetland study sites with the boundary
indicated in red. The location of start points for the plant survey are indicated by a yellow dot. The location of the
invertebrate sample sites are indicated by a pink dot. The most northerly plant transect start point (yellow) is also the
location of invertebrate sampling, but colors representing both could not be shown at the same time. There are no
blue dots representing water sample locations, as the GPS coordinates for these locations were not recorded. The
underlying imagery is courtesy of Bing Maps (c) 2011 Microsoft Corporation and its data suppliers. [Accessed 18
March, 2013].

27
West Dam Pond Wetland Site:
The West Dam Pond wetland study site was located on the western portion of Bell Island. The
wetland boundary was defined by forest borders and developed borders, being the dirt roads.
The wetland was split in half by West Track Road, but is treated as one continuous wetland for
this study, as plant transects were sampled on both sides of the road.
Figure 12. West Dam Pond wetland study site with the boundary indicated in red. The location of start points for
the plant survey are indicated by a yellow dot. The location where the water sample was collected is indicated by a
blue dot, and the location of the invertebrate sample site is indicated by a pink dot. The location of the water sample
was also the location of invertebrate sampling, but colors representing both could not be shown at the same time.
The underlying imagery is courtesy of Bing Maps (c) 2011 Microsoft Corporation and its data suppliers. [Accessed
18 March, 2013].

28
East White Hills Road Wetland Site:
The East White Hills Road wetland study site was located in St. John`s. It was the wetland
known as Lundrigan’s Marsh. The wetland boundaries were defined by developed borders, as
the wetland is located in the middle of industrial commercial areas.
Figure 13. East White Hills Road wetland study site with the boundary indicated in red. The location of start points
for the plant survey are indicated by a yellow dot. The location where the water sample was collected is indicated
by a blue dot, and the location of the invertebrate sample site is indicated by a pink dot. The location of the water
sample was also the location of invertebrate sampling, but colors representing both could not be shown at the same
time. The underlying imagery is courtesy of Bing Maps (c) 2011 Microsoft Corporation and its data suppliers.
[Accessed 18 March, 2013].

29
Appendix B- Stress Evaluation Rubric Template

30
Wetland Study Site Stress Evaluation Rubric
Value 3 2 1 X 2
1 < 1000 m2
2 1000 - 10,000
3 > 10,000 m2
1 < 1000 m2
2 1000 - 10,000 m2
3 > 10,000 m2
2 Dense
1 Sparse
2 Dense
1 Sparse
2 Dense
1 Sparse
Value 3 2 1
Culvert
Dam
Table 1
Table 2
Table 3
Score
TOTALS
Part 3: Culverts and Dams
# Present Comment TOTALS
4 Lane Road 3
30 m - 50 m Elevation
of ConcernTOTALS
Dirt Road 1
15 m - 30 m
2 Lane Road 2
Part 2: Roadways
Feature<15m
Industrial
Commercial /
Institutional
Residential
Impervious Surfaces
Agriculture
15 m - 30 m 30 m - 50 m Elevation of
Concern TOTALS<15m
Part 1: Area Features
FeatureArea

31
Appendix C- Wetland Site Data

32
Bell Pond Wetland Site – Plant Data
Site Name: Bell Pond
GPS Coordinates of Start of Transect: N 47.60806 W 053.00731 Ele: 75m
Date: August 7th, 2012
Transect 1 of 2
Common Name Species Name Quad 1 Quad 2 Quad 3 Quad 4 Quad 5 Quad 6 Quad 7 Quad 8 Quad 9 Quad10
Labrador Tea Rhododendron groenlandicum 8 14 3 6 3
Leatherleaf Chamaedaphne calyculata 20 20 20 40 65 66 40 29 22 15
Cinnamon fern Osmundastrum cinnamomeum 5 5
Bog Aster Oclemena nemoralis 27 25 41 30 1
Northeastern Rose Rosa natida 3
Bunchberry Cornus canadensis 5 1
Purple Goldenrod Solidago spp. 5
White Spruce Picea glauca 1
Sweet Gale Myrica gale 6 15 7 14 5 22 9 4 1 8
Colonial Bent/Rhode Island Bent Agostis capillaris 6 7
Canada Rush Juncus canadensis 3
Bog Buckbean Menyanthes trifoliata 18 5 14 12
Marsh Bedstraw Galium Palustre 27
Estuary Sedge Carex vacillans 8 1
Bog Laurel Kalmia Polifolia 2 1 4
Cloudberry Rubus chamaemorus 5
Sheep Laurel Kalmia Angustifolia 45 20 26
Tawny Cottongrass Eriophorum virginicum 4 5
Sweet gale Myrica gale 1
Undergrowth (% Cover) Species Name Quad 1 Quad 2 Quad 3 Quad 4 Quad 5 Quad 6 Quad 7 Quad 8 Quad 9 Quad 10
Twinflower Linnaea borealis 5% <5% <5% <5%
Small Cranberry Vaccinium oxycoccus <5% 5% <5% 5% 5% 5% 5% 5% 5% 5%
3 Leaved False Solomons Seal Smilacina trifolia <5% 25% <5% <5% <5% <5%
Sweetflag Aconus americana 10% 10% 5% 30% <10%
Normal Grass N/A 60% 60% 70% 60% 50% 20% 20% 20% 35%
Peat Moss Sphagnum sp. 10% 20% 10% 30% 50% 70% 50% 70% 40%
Viola sp. Viola spp. <5%
White Beakrush Rhynchospora alba 10% <1% <1%
Black Crowberry Empetrum negrum <5% <5%
Dead Grass N/A 10% 25% 10% 15% 15% 15%
Mud N/A 10%
Total # Standing Counts
% Cover
Site Name: Bell Pond
GPS Coordinates of Start of Transect: N 47.60770 W 53.00799 Ele: 80m
Date: August 7th, 2012
Transect 2 of 2
Common Name Species Name Quad 1 Quad 2 Quad 3 Quad 4 Quad 5 Quad 6 Quad 7 Quad 8 Quad 9 Quad10
Leatherleaf Chamaedaphne calyculata 12 20 16 15 4 15 41 15 32 21
Labrador Tea Rhododendron groenlandicum 8 3 3 3 21 8
White Spruce Picea glauca 1 1 1
Sheep Laurel Kalmia angustifolia 12 11 4 2 3 15 15
lowbush blueberry Vaccinium angustifolium 3
Sweet Gale Myrica gale 3 21 23 17 24 26 3 7
Bog Buckbean Menyanthes trifoliata 18 6
Bog Aster Oclemena nemoralis 22 21 21 2 3 3
Northeastern Rose Rosa natida 1
Cloudberry Rubus chamaemorus 6
Undergrowth (% Cover) Species Name Quad 1 Quad 2 Quad 3 Quad 4 Quad 5 Quad 6 Quad 7 Quad 8 Quad 9 Quad 10
Normal Grass N/A 20% 15% 25% 40% 40% 30% 20% 10% 25%
Peat Moss Sphagnum spp. 60% 70% 50% 40% 30% 50% 70% 70%
Small Cranberry Vaccinium oxycoccus <5% 5% <5% <5% 5% <5% <5% <5%
Thee Leaves Solomons Seal Smilacina trifolia <5% <5% <5% <5% <5%
White Beakrush Rhyncospora alba 5% 10% 10% 10% 10%
Sweetflag Aconus americana 10% 10% 10%
Twinflower Linnaea borealis 5%
Dead Grass N/A 10% 10%
Mud N/A 20% 20% 50% 10% 60%
Total # Standing Counts
% Cover
33
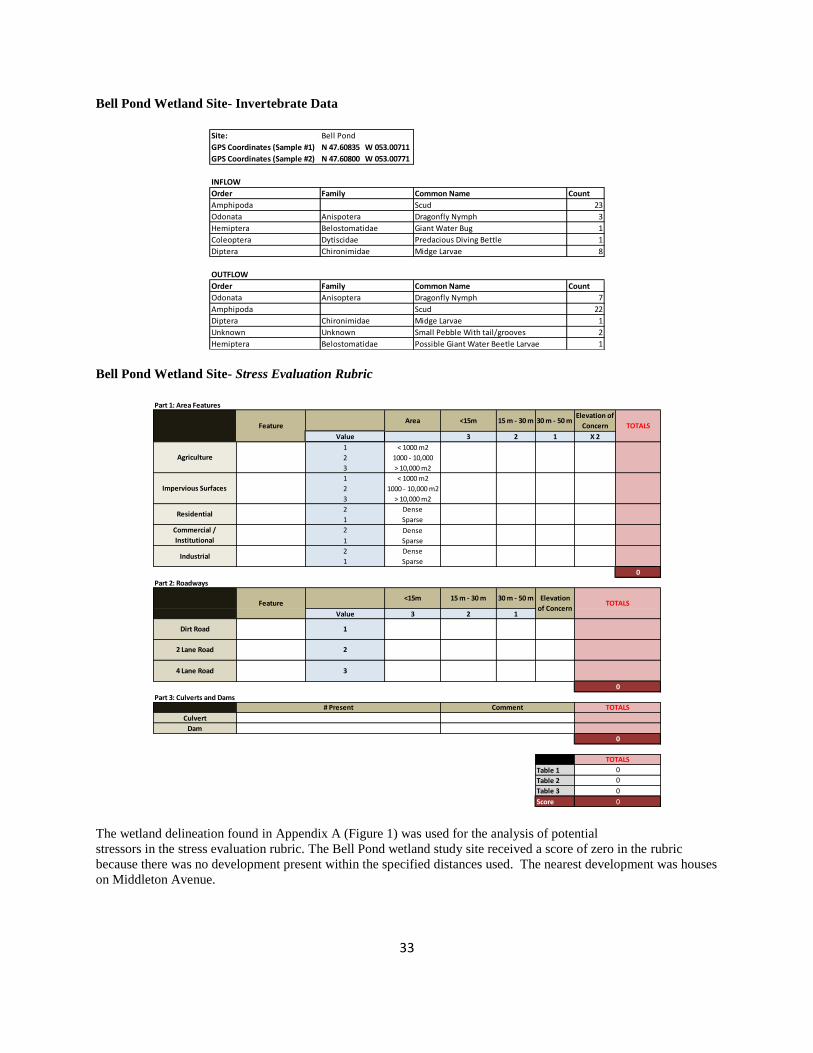
Bell Pond Wetland Site- Invertebrate Data
Site: Bell Pond
GPS Coordinates (Sample #1) N 47.60835 W 053.00711
GPS Coordinates (Sample #2) N 47.60800 W 053.00771
INFLOW
Order Family Common Name Count
Amphipoda Scud 23
Odonata Anispotera Dragonfly Nymph 3
Hemiptera Belostomatidae Giant Water Bug 1
Coleoptera Dytiscidae Predacious Diving Bettle 1
Diptera Chironimidae Midge Larvae 8
OUTFLOW
Order Family Common Name Count
Odonata Anisoptera Dragonfly Nymph 7
Amphipoda Scud 22
Diptera Chironimidae Midge Larvae 1
Unknown Unknown Small Pebble With tail/grooves 2
Hemiptera Belostomatidae Possible Giant Water Beetle Larvae 1 Bell Pond Wetland Site- Stress Evaluation Rubric
Value 3 2 1 X 2
1 < 1000 m2
2 1000 - 10,000
3 > 10,000 m2
1 < 1000 m2
2 1000 - 10,000 m2
3 > 10,000 m2
2 Dense
1 Sparse
2 Dense
1 Sparse
2 Dense
1 Sparse
0
Value 3 2 1
Culvert
Dam
Table 1
Table 2
Table 3
Score
Part 1: Area Features
FeatureArea 15 m - 30 m 30 m - 50 m
Elevation of
Concern TOTALS
Agriculture
<15m
Impervious Surfaces
Residential
15 m - 30 m
Commercial /
Institutional
Industrial
Part 2: Roadways
Feature<15m
Dirt Road 1
30 m - 50 m Elevation
of ConcernTOTALS
2 Lane Road 2
0
Part 3: Culverts and Dams
# Present Comment TOTALS
4 Lane Road 3
0
0
0
TOTALS
0
0
The wetland delineation found in Appendix A (Figure 1) was used for the analysis of potential
stressors in the stress evaluation rubric. The Bell Pond wetland study site received a score of zero in the rubric
because there was no development present within the specified distances used. The nearest development was houses
on Middleton Avenue.

34
East of Dans Road Wetland Site- Plant Data
Site Name: East of Dan's Road
GPS Coordinates of Start of Transect: N 47.56816 W 052.86429
Date: 23-Jul-12
Transect 1 of 2
Common Name Species Name Quad 1 Quad 2 Quad 3 Quad 4 Quad 5 Quad 6 Quad 7 Quad 8 Quad 9 Quad10
Tall cottongrass Eriophorum angustifolium 1
Common Juniper Juniperus communis 1 3 1 3
White Spruce Picea glauca 5 1 1
North-eastern Rose Rosa nitida 5 3 2 2 5 3 1
Bog Aster Oclemena nemoralis 8 3 11 4 3 15 26 36
Club Spur Orchid Platanthera clavellata 6 2 10 3 4 2 10 2 8
Sedge spp. Carex spp. 15 19 12 13 9 10
Sundew Drosera spp. 10 10 10 15 14
Sheep Laurel Kalmia angustifolia 25 4 7 8 4 10 7 10 5
Bog Laurel Kalmia polifolia 2 2 1 1
Labrador Tea Rhododendron groenlandicum 7 39 12 1 3 16 12 13 11
Sweet Gale Myrica gale 19 7 3 6 4 13 8
Tamarack Larix laricinia 1 2 4
Bog Goldenrod Solidago uliginosa 4 1 2 2 3 4
Thee Leaved False Solomons Seal Smilacina trifolia 1 8 8 12
Canada Rush Juncus canadensis 10 20
Twinflower Linnaea borealis 12
Violet Species Viola spp. 23
Purple Pitcher Plant Sarracenia Purpurea 3
Purple Chokeberry Aronia X punifolia 2
Undergrowth (% Cover) Species Name Quad 1 Quad 2 Quad 3 Quad 4 Quad 5 Quad 6 Quad 7 Quad 8 Quad 9 Quad 10
Sedge spp. Carex spp. 10%
Peat Moss Sphagnum spp. 30% 25% 40% 70% 40% 40% 30% 30% 40% 40%
Grass N/A 40% 30% 10% 15% 40% 40% 40% 30% 30% 15%
Twinflower Linnaea borealis 5% 2% 2% 3% 3% 2% 1%
Small Cranberry/Marshberry Vaccinium oxycoccus 10% 5% 5% 5% 5% 5% 5% 5% 5% 4%
Total # Standing Counts
% Cover
Site Name: East of Dan's Road
GPS Coordinates of Start of Transect: N 47.56853 W 052.86488
Date: July 23rd, 2012
Transect 2 of 2
Common Name Species Name Quad 1 Quad 2 Quad 3 Quad 4 Quad 5 Quad 6 Quad 7 Quad 8 Quad 9 Quad10
Common Juniper Junipus communis 1
White Spruce Picea glauca 3
North-Eastern Rose Rosa nitida 4 3
Bog Aster Oclemena nemoralis 11 30 30 32 20 28
Club Spur Orchid Platanthera clavellata 9 2 2
Sheep Laurel Kalmia angustifolia 4 16 6
Bog Laurel Kalmia polifolia 2
Labrador Tea Rhododendron groenlandicum 17 5
Sweetgale Myrica gale 5 19 17 11 8
Tamarack Larix laricinia 1 2
Bog Goldenrod Solidago uliginosa 2 3 2 2 6
Three Leaved Flase Solomons Seal Smilacina trifolia 3 5 1 3 3
Canada Rush Juncus canadensis 20
Violet Species Viola spp. 6
Purple Pitcher Plant Sarracenia purpurea 8 2 1 1
Tall Meadow-rue Thalictrum pubescens 3 1 1 1
Goldenrod Goldenrod spp. 1
Undergrowth (% Cover) Species Name Quad 1 Quad 2 Quad 3 Quad 4 Quad 5 Quad 6 Quad 7 Quad 8 Quad 9 Quad 10
Bog Aster Oclemena nemoralis 10% 20%
Three Leaved False Solomons Seal Smilacina trifolia 10%
White beakrush Rhynchospora alba 30%
Peat Moss Sphagnum spp. 40% 75% 60% 70% 10% 70% 60% 70% 80% 60%
Grass N/A 20% 5% 15% 15% 40% 10% 20% <5% 5% 15%
Small Cranberry/Marshberry Vaccinium oxycoccus 5% 5% 10%
Total # Standing Counts
% Cover

35
East of Dans Road Wetland Site- Invertebrate Data
Site: East of Dan's Road
GPS Coordinates (Possible Inflow) N 47.56931 W 052.86449
GPS Coordinates (Possible Outflow) N 47.56947 W 052.86653
INFLOW (Site #1)
Order Family Common Name Count
Odonata Anisoptera Dragonfly Nymph 5
Coleoptera Corixidae Water Boatmen 1
OUTFLOW (Site #2)
Order Family Common Name Count
Diptera Chironimidae Midge Larvae 1 East of Dans Road- Stress Evaluation Rubric
Value 3 2 1 X 2
1 < 1000 m2
2 1000 - 10,000
3 > 10,000 m2
1 < 1000 m2
2 1000 - 10,000 m2
3 > 10,000 m2
Residences on Little
Powers Pond Road2 Dense 6
Building at end of
Rainbow Gully Road1 Sparse 3
2 Dense
1 Sparse
2 Dense
1 Sparse
9
Value 3 2 1
Culvert
Dam
Table 1
Table 2
Table 3
Score
Part 1: Area Features
FeatureArea 15 m - 30 m 30 m - 50 m
Elevation of
Concern TOTALS
Agriculture
<15m
Impervious Surfaces
Residential 9
Commercial /
Institutional
Industrial
Part 2: Roadways
Feature<15m 30 m - 50 m Elevation
of ConcernTOTALS
Dirt Road Rainbow Gully Road 1 1
15 m - 30 m
1
2 Lane Road 2
0
10
0
TOTALS
9
1
1
Part 3: Culverts and Dams
# Present Comment TOTALS
4 Lane Road 3
The wetland delineation found in Appendix A (Figure 2) was used for the analysis of potential
stressors in the stress evaluation rubric. Rainbow Gully Road, a building on Rainbow Gully Road, and residences on
Little Powers Pond Road were determined to be within 50m of the wetland boundary. None of these features were
considered to be at an elevation significantly higher than the wetland. While not mentioned within the rubric, it was
observed in field notes that there were a number of ATV tracks throughout the wetland. There is potential for
wetland damage from ATV use.
36
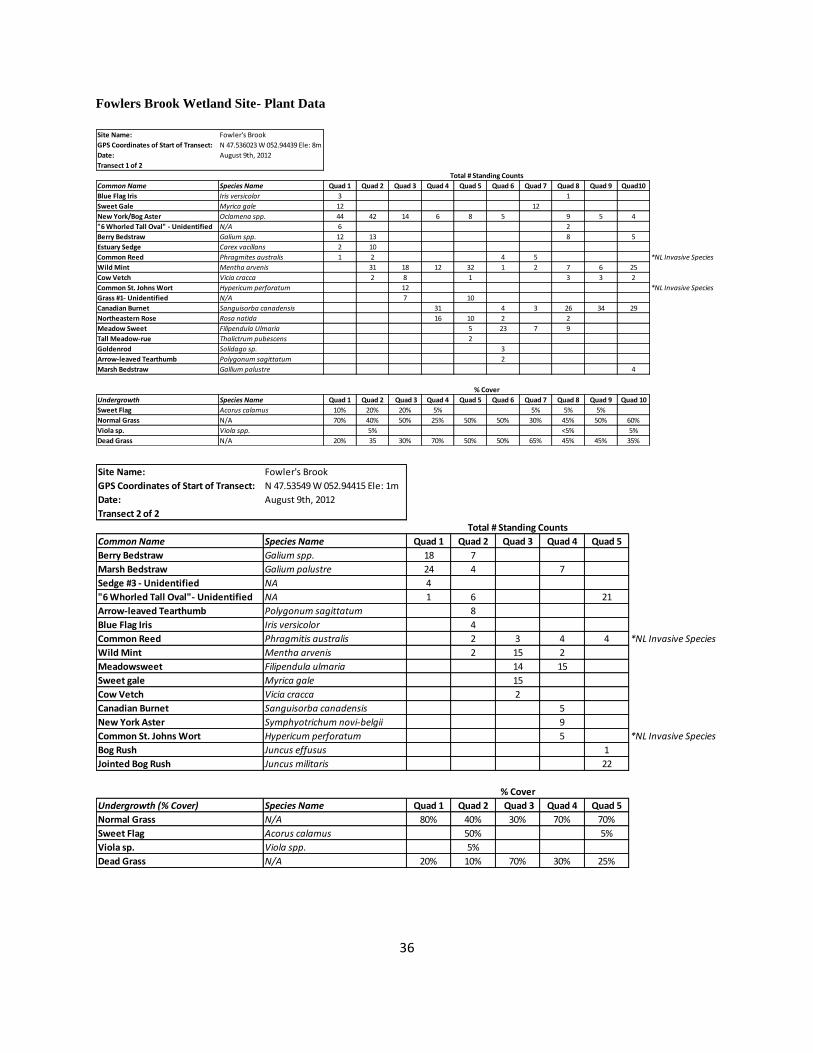
Fowlers Brook Wetland Site- Plant Data Site Name: Fowler's Brook
GPS Coordinates of Start of Transect: N 47.536023 W 052.94439 Ele: 8m
Date: August 9th, 2012
Transect 1 of 2
Common Name Species Name Quad 1 Quad 2 Quad 3 Quad 4 Quad 5 Quad 6 Quad 7 Quad 8 Quad 9 Quad10
Blue Flag Iris Iris versicolor 3 1
Sweet Gale Myrica gale 12 12
New York/Bog Aster Oclamena spp. 44 42 14 6 8 5 9 5 4
"6 Whorled Tall Oval" - Unidentified N/A 6 2
Berry Bedstraw Galium spp. 12 13 8 5
Estuary Sedge Carex vacillans 2 10
Common Reed Phragmites australis 1 2 4 5 *NL Invasive Species
Wild Mint Mentha arvenis 31 18 12 32 1 2 7 6 25
Cow Vetch Vicia cracca 2 8 1 3 3 2
Common St. Johns Wort Hypericum perforatum 12 *NL Invasive Species
Grass #1- Unidentified N/A 7 10
Canadian Burnet Sanguisorba canadensis 31 4 3 26 34 29
Northeastern Rose Rosa natida 16 10 2 2
Meadow Sweet Filipendula Ulmaria 5 23 7 9
Tall Meadow-rue Thalictrum pubescens 2
Goldenrod Solidago sp. 3
Arrow-leaved Tearthumb Polygonum sagittatum 2
Marsh Bedstraw Gallium palustre 4
Undergrowth Species Name Quad 1 Quad 2 Quad 3 Quad 4 Quad 5 Quad 6 Quad 7 Quad 8 Quad 9 Quad 10
Sweet Flag Acorus calamus 10% 20% 20% 5% 5% 5% 5%
Normal Grass N/A 70% 40% 50% 25% 50% 50% 30% 45% 50% 60%
Viola sp. Viola spp. 5% <5% 5%
Dead Grass N/A 20% 35 30% 70% 50% 50% 65% 45% 45% 35%
Total # Standing Counts
% Cover
Site Name: Fowler's Brook
GPS Coordinates of Start of Transect: N 47.53549 W 052.94415 Ele: 1m
Date: August 9th, 2012
Transect 2 of 2
Common Name Species Name Quad 1 Quad 2 Quad 3 Quad 4 Quad 5
Berry Bedstraw Galium spp. 18 7
Marsh Bedstraw Galium palustre 24 4 7
Sedge #3 - Unidentified NA 4
"6 Whorled Tall Oval"- Unidentified NA 1 6 21
Arrow-leaved Tearthumb Polygonum sagittatum 8
Blue Flag Iris Iris versicolor 4
Common Reed Phragmitis australis 2 3 4 4
Wild Mint Mentha arvenis 2 15 2
Meadowsweet Filipendula ulmaria 14 15
Sweet gale Myrica gale 15
Cow Vetch Vicia cracca 2
Canadian Burnet Sanguisorba canadensis 5
New York Aster Symphyotrichum novi-belgii 9
Common St. Johns Wort Hypericum perforatum 5
Bog Rush Juncus effusus 1
Jointed Bog Rush Juncus militaris 22
Undergrowth (% Cover) Species Name Quad 1 Quad 2 Quad 3 Quad 4 Quad 5
Normal Grass N/A 80% 40% 30% 70% 70%
Sweet Flag Acorus calamus 50% 5%
Viola sp. Viola spp. 5%
Dead Grass N/A 20% 10% 70% 30% 25%
Total # Standing Counts
*NL Invasive Species
*NL Invasive Species
% Cover

37
Fowlers Brook Wetland Site- Invertebrate Data
Site: Fowlers Brook
GPS Coordinates (Inflow) N 47.53608 W 052.94442
GPS Coordinates (Outflow) N 47.53537 W 052.94234
INFLOW
Order Family Common Name Count
Hirudinae Leech 2
Annelida Waterworm 1
Coleoptera Halipidae Crawling Water Beetle 1
Odonata Zygoptera Damselfly Nymph 1
OUTFLOW
Order Family Common Name Count
Plecoptera Leuctridae Stonefly Larvae 1
Diptera Tipulidae Cranefly Larvae 4
Hirudinae Leech 1
Annelida Waterworm 1
Fowlers Brook Wetland Site- Stress Evaluation Rubric
Value 3 2 1 X 2
1 < 1000 m2
2 1000 - 10,000
3 > 10,000 m2
Condos on Lions
Crescent1
< 1000 m26
2 1000 - 10,000 m2
3 > 10,000 m2
Residences on Lions
Crescent2 Dense 6
Residences on Route
601 Sparse 6
2 Dense
1 Sparse
2 Dense
1 Sparse
21
Value 3 2 1
Lions Crescent 2
Route 60 2 x2
Culvert
Dam
Table 1
Table 2
Table 3
Score
Part 1: Area Features
FeatureArea
TOTALS
Agriculture
<15m 15 m - 30 m 30 m - 50 m Elevation of
Concern
9
Residential 12
Commercial /
Institutional
Impervious SurfacesAutomotive repair
shop3
Industrial
Part 2: Roadways
30 m - 50 m Elevation
of ConcernTOTALS
Dirt Road 1
Feature<15m 15 m - 30 m
2 Lane Road 2 6
6
0
27
0
TOTALS
21
6
Part 3: Culverts and Dams
# Present Comment TOTALS
4 Lane Road 3
The wetland delineation found in Appendix A(Figure 3) was used for the analysis of potential
stressors in the stress evaluation rubric. Features determined to be within 50m of the wetland boundary included
Route 60 (Conception Bay Highway) and the residences located along it, Lions Crescent and its residences, the

38
condos on Lions Crescent, the paved parking area for the soccer field, and the garage at the corner of Lions Crescent
and Route 60. Of these, only Route 60 was determined to be at an elevation such that there was potential for a
greater impact of runoff from it. Although not a component of the rubric, as Fowlers Brook runs through the
wetland, there is also potential for upstream runoff containing contaminants to be carried to the wetland, and
ultimately into Chamberlains Pond.

39
Hogans Pond Wetland Site- Plant Data
Site Name: Hogan's Pond
GPS Coordinates of Start of Transect: N 47.57629 W 052.85666 Ele: 141m
Date: July 24th 2012
Transect 1 of 2
Common Name Species Name Quad 1 Quad 2 Quad 3 Quad 4 Quad 5 Quad 6 Quad 7 Quad 8 Quad 9 Quad10
Sundew Drosera spp. 11
Leatherleaf Chamaedaphne calyculata 38 23 21 19 4 7 7 23 15 41
Sweet Gale Myrica gale 12 2 13 16
Bog Aster Oclemena nemoralis 7 27 9 22 6 1
Sheep Laurel Kalmia angustifolia 7 7 4 15 5 6
Bog Laurel Kalmia polifolia 1 3 11 6 6 7 22 12 12 38
Labrador Tea Rhododendron groenlandicum 11 10 1 2 7 37
Canada Rush Juncus canadensis 5 2
Balsam Fir Abies balsamea 1 1 3 1
Northeastern Rose Rosa nitida 1 4 1
Tamarack Larix laricinia 1 1 2 3 1 1
White Spruce Picea glauca 2 2 3
Two eyed Berry/ partridge berry Mitchella repens 3 3
Goldenrod Solidago spp. 1
Undergrowth (% Cover) Species Name Quad 1 Quad 2 Quad 3 Quad 4 Quad 5 Quad 6 Quad 7 Quad 8 Quad 9 Quad 10
Sundew Drosera spp. <5% <5% <5% <5% <5% <5% <5%
Small Cranberry Vaccinium oxycoccus 10% <5% 5% 5% <5% <5% <5% 5% 5% 5%
Peat Moss Sphagnum spp. 35% 25% 35% 30% 20% 30% 30% 40% 15% 20%
Grass (White Flower) N/A 35% 10% 15% 20% 20% 15% 40% 25% 15% 10%
Sweet Gale Myrica gale 30% 5%
3 Leaved False Solomons Seal Smilacinia trifolia <5% 45% 50% <5% <5%
Mud N/A <5%
Total # Standing Counts
% Cover
Site Name: Hogan's Pond
GPS Coordinates of Start of Transect: N 47.57620 W 052.85600 Ele: 140m
Date: July 24th 2012
Transect 2 of 2
Common Name Species Name Quad 1 Quad 2 Quad 3 Quad 4 Quad 5 Quad 6 Quad 7 Quad 8 Quad 9 Quad10
Sheep Laurel Kalmia angustifolia 18 17 7 4 18
Bog Laurel Kalmia polifolia 26 10 16 5 7 12 2 3
Leatherleaf Chamaedaphne calyculata 28 25 7 19 8 5 12 4 6
White Spruce Picea glauca 10 8 3 8 5 3
Northeastern Rose Rosa nitida 2 1
Labrador Tea Rhododendron groenlandicum 4 4 1 11 10
Sweet Gale Myrica gale 1
Meadow Sweet Filipendula ulmaria 1
Tamarack Larix laricinia 7 2
Bog Aster Oclemena nemoralis 5 5 9 10 6 4
Horned Bladderwort Utricularia cornuta 4 6
Purple Chokeberry Aronia X prunifolia 2 8 6
Goldthread Coptis trifolia 32
Violet spp. Viola spp. 6 1
Goldenrod Solidago spp. 2 1
Common Juniper Juniperus communis 6
Undergrowth (% Cover) Species Name Quad 1 Quad 2 Quad 3 Quad 4 Quad 5 Quad 6 Quad 7 Quad 8 Quad 9 Quad 10
Black Crowberry Empetrum nigrum <5% <5% <5%
Small Cranberry/Marshberry Vaccinium oxycoccus 5% 5% 5% <5% <5% <5% <5%
Peat Moss Sphagnum spp. 40% 30% 40% 20% 40% 20% 50% 5% 20%
Grass N/A 20% 15% 30% 20% 20% 10% 10% 20% 30% 50%
Sundew Drosera spp. <5% <5% <5% <5% <5% <5% <5% <1%
3 Leaved False Solomons Seal Smilacinia trifolia <5% <5%
Mud N/A 35% 15% 80% 40%
Total # Standing Counts
% Cover
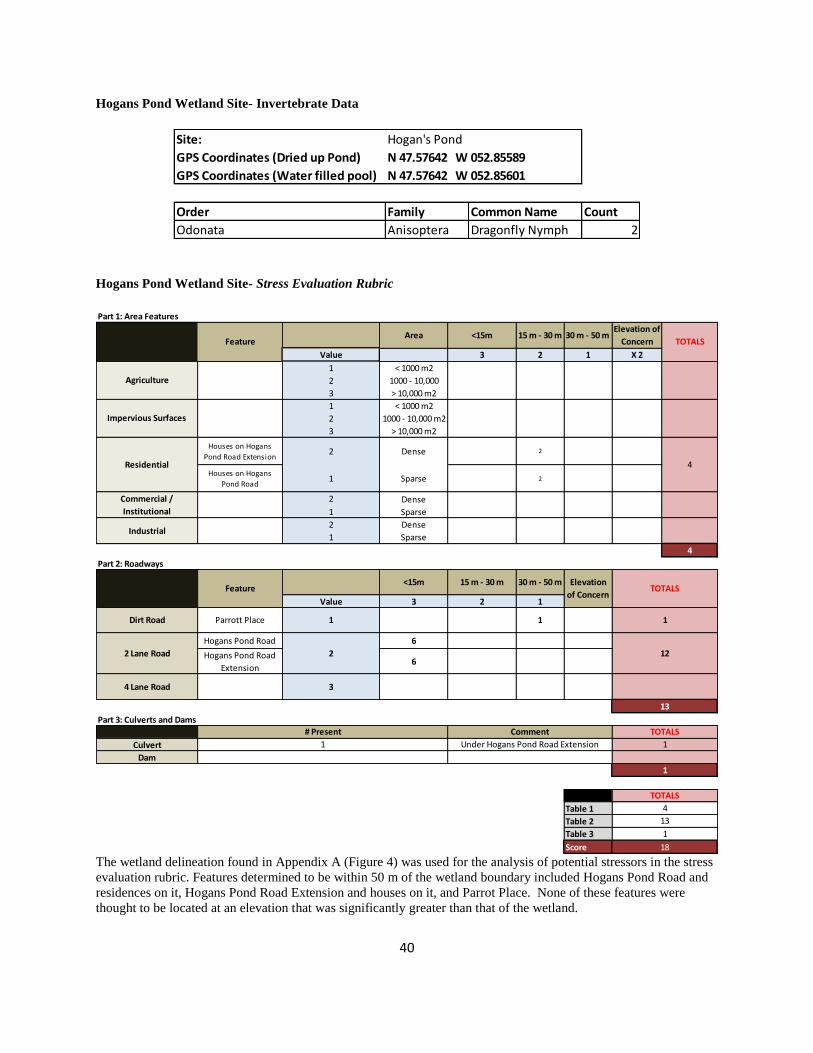
40
Hogans Pond Wetland Site- Invertebrate Data
Site: Hogan's Pond
GPS Coordinates (Dried up Pond) N 47.57642 W 052.85589
GPS Coordinates (Water filled pool) N 47.57642 W 052.85601
Order Family Common Name Count
Odonata Anisoptera Dragonfly Nymph 2
Hogans Pond Wetland Site- Stress Evaluation Rubric
Value 3 2 1 X 2
1 < 1000 m2
2 1000 - 10,000
3 > 10,000 m2
1 < 1000 m2
2 1000 - 10,000 m2
3 > 10,000 m2
Houses on Hogans
Pond Road Extension2 Dense 2
Houses on Hogans
Pond Road1 Sparse 2
2 Dense
1 Sparse
2 Dense
1 Sparse
4
Value 3 2 1
Hogans Pond Road 6
Hogans Pond Road
Extension6
Culvert
Dam
Table 1
Table 2
Table 3
Score
Part 1: Area Features
FeatureArea
Agriculture
15 m - 30 m 30 m - 50 m Elevation of
Concern TOTALS<15m
Residential 4
Impervious Surfaces
12
1 1
Industrial
Commercial /
Institutional
2 Lane Road 2
Part 2: Roadways
Feature<15m 30 m - 50 m Elevation
of ConcernTOTALS
Dirt Road 1
15 m - 30 m
Parrott Place
# Present Comment TOTALS
4 Lane Road 3
13
1
18
1 Under Hogans Pond Road Extension
4
13
1
1
TOTALS
Part 3: Culverts and Dams
The wetland delineation found in Appendix A (Figure 4) was used for the analysis of potential stressors in the stress
evaluation rubric. Features determined to be within 50 m of the wetland boundary included Hogans Pond Road and
residences on it, Hogans Pond Road Extension and houses on it, and Parrot Place. None of these features were
thought to be located at an elevation that was significantly greater than that of the wetland.

41
Incinerator Road Wetland Site – Plant Data Site Name: Incinerator Road
GPS Coordinates of Start of Transect: N 47.44529 W 052.96942
Date: July 30th 2012
Transect 1 of 2
Common Name Species Name Quad 1 Quad 2 Quad 3 Quad 4 Quad 5 Quad 6 Quad 7 Quad 8 Quad 9 Quad10
Bog Laurel Kalmia Polifolia 44 34 15 23 20 34 25 25 25 15
Bog Rosemary Andromeda Polifolia 8 6 1 5 40 24
Labrador Tea Rhododendron Groenlandicum 11 19 13 4 22 17 15 20
Purple Chokeberry Aronia X prunifolia 19 16 8 6 7 10 7 4 4 5
Leatherleaf Chamaedaphne sp. 27 33 25 15 31 41 33 35 32 35
Northern Wild Raisin Viburnum nudum 12 2
Sweet Gale Myrica Gale 10 3 7 10 7 10
Sheep Laurel Kalmia Angustifolia 8 51 44 65 32 12 26 32 3
Tamarack Larix laricina 4 4 1 2 2
Sweet Gale Myrica gale 1 2 3 4
Common Juniper Juniperus Communis 5 1 9
Wild Sasparilla Aralia nudicaulis 5 4
Purple Pitcher Plant Sarracenia purpurea 1 2 7 7 5
Mountain Holly Ilex mucronata 6 7
New York Aster Symphyotrichum novi-belgii 3
Northeastern Rose Rosa natida 1
Undergrowth (% Cover) Species Name Quad 1 Quad 2 Quad 3 Quad 4 Quad 5 Quad 6 Quad 7 Quad 8 Quad 9 Quad 10
Bunchberry Cornus canadensis 5% <5% <5% <5% <5% <5% <5% <5%
Peat Moss Sphagnum spp. 40% 30% 55% 30% 30% 55% 40% 30% 35% 50%
Grass N/A 20% 30% 15% 20% 10% 15% 30% 20% 20% 15%
Twinflower Linnaea borealis <5%
Violet sp. Viola spp. <5% <5% <5% <5% <1% <5% <5% <5%
Goldthread Coptis trifolia <5% 10% <5% <5% <5% <5% <5%
Small Cranberry Vaccinium oxycoccos <5% 5% 10% <5% 5% <5% <5% 10% 5%
Moss #2 N/A 15% 30% 15%
White Moss N/A 5% 20% 10%
Total # Standing Counts
% Cover
Site Name: Incinerator Road
GPS Coordinates of Start of Transect: N 47.44537 W 052.96978
Date: July 30th 2012
Transect 2 of 2
Common Name Species Name Quad 1 Quad 2 Quad 3 Quad 4 Quad 5 Quad 6 Quad 7 Quad 8 Quad 9 Quad10
Labrador Tea Rhododendron groenlandicum 13 5 20 3 14 11 13 5 14 9
Sheep Laurel Kalmia angustifolia 36 16 14 20 4 22 3 2 22
Bog Laurel Kalmia polifolia 30 24 18 7 14 20 43 17 36 12
Sweet Gale Myrica gale 4 3 4
Leatherleaf Chamaedaphne calyculata 31 108 43 62 48 37 11 12 27 33
Bog Rosemary Andromeda polifolia 9 7 4 2 13 10 8 2 2
Purple Pitcher Plant Sarracenia purpurea 1 1 1
Purple Chokeberry Aronia X prunifolia 6 8 32 16 28 15 7 4 14 5
Tamarack Larix laricina 1 1 2 1 2 1 4 2 3
White Spruce Picea Glauca 1 1 1
Rhodora Rhododendron canadense 7 2
Bog Aster Oclemena nemoralis 8 4
Wild Sasparilla Aralia nudicaulis 1 6 4
Northern Wild Raisin Viburnum nudum 1
Common Juniper Juniperus communis 5
Sundew Drosera sp. 3
New York Aster Symphyotrichum novi-belgii 2
Twinflower Linnaea borealis 15
Mountain Holly Ilex mucronata 1
Undergrowth (% Cover) Species Name Quad 1 Quad 2 Quad 3 Quad 4 Quad 5 Quad 6 Quad 7 Quad 8 Quad 9 Quad 10
Peat Moss Sphagnum spp. 40% 30% 20% 40% 25% 20% 70% 50% 40% 30%
Grass N/A 15% 20% 10% 20% 15% 10% 15% 30% 20% 10%
"Moss #2" N/A 10% 5% 40%
Goldthread Coptis trifolia <5% 5% <5% <5% <5% <5% <5% <5%
Violet sp. Viola spp. <5% <5% 5% <5% <5% <5% <5% <5%
Bunchberry Cornus canadensis 5% <5% 5% <5% <5%
Small Cranberry Vaccinium oxyoccos 5% <5% 5% 5% 5% 5% 5% 5% 5% 5%
White Moss N/A 20% 30% 25% 20%
Black Crowberry Empetrum nigrum <5% 5%
Total # Standing Counts
% Cover

42
Incinerator Road Wetland Site – Invertebrate Data
Site: Incinerator Road
GPS Coordinates (Inflow, culvert) N47.44559 W 052.96883
GPS Coordinates (Outflow, culvert) N 47.44550 W 052.96891
INFLOW (Into culvert)
Order Family Common Name Count
Odonata Anisoptera Dragonfly Nymph 3
Trichoptera Chironimidae Midge Larvae 9
Plecoptera Leuctridae Unknown 4
Coeloptera Curculionidae Weevil 1
Trichoptera Polycentropidae Caddisfly Larvae-No case 3
Diptera Culicidae Mosquito Adult 1
OUTFLOW (Out of culvert)
Order Family Common Name Count
Trichoptera Chironimidae Midge Larvae 12
Odonata Anisoptera Dragonfly Nymph 1
Plecoptera Leuctridae Unknown 38
Coleoptera Dytiscidae Predacious Diving Beetle 2
Trichoptera Polycentropidae Caddislfy Larvae 5
Arachnida Hydracaraina Water Mite 4
Coleoptera Dytiscidae Beetle Larvae 3 Incinerator Road Wetland Site – Stress Evaluation Rubric
Value 3 2 1 X 2
1 < 1000 m2
2 1000 - 10,000
3 > 10,000 m2
1 < 1000 m2
2 1000 - 10,000 m2
3 > 10,000 m2
2 Dense
1 Sparse
2 Dense
1 Sparse
2 Dense
1 Sparse
0
Value 3 2 1
Culvert
Dam
Table 1
Table 2
Table 3
Score
0
TOTALS
0
3
3
0
3
3
Part 3: Culverts and Dams
# Present Comment TOTALS
4 Lane Road 3
2 Lane Road 2
30 m - 50 m Elevation
of ConcernTOTALS
Dirt Road Incinerator Road 1 3
15 m - 30 m
Commercial /
Institutional
Industrial
Part 2: Roadways
Feature<15m
Impervious Surfaces
Residential
15 m - 30 m 30 m - 50 m Elevation of
Concern TOTALS
Agriculture
<15m
Part 1: Area Features
FeatureArea
The wetland delineation found in Appendix A (Figure 5) was used for the analysis of potential stressors in the stress
evaluation rubric. The only feature found to be located within 50m of the wetland boundary was Incinerator Road.
However, some of the industries on the paved portion of Incinerator Road and the Trans Canada Highway are
adjacent to the wetland, but outside of the 50m used in this study.
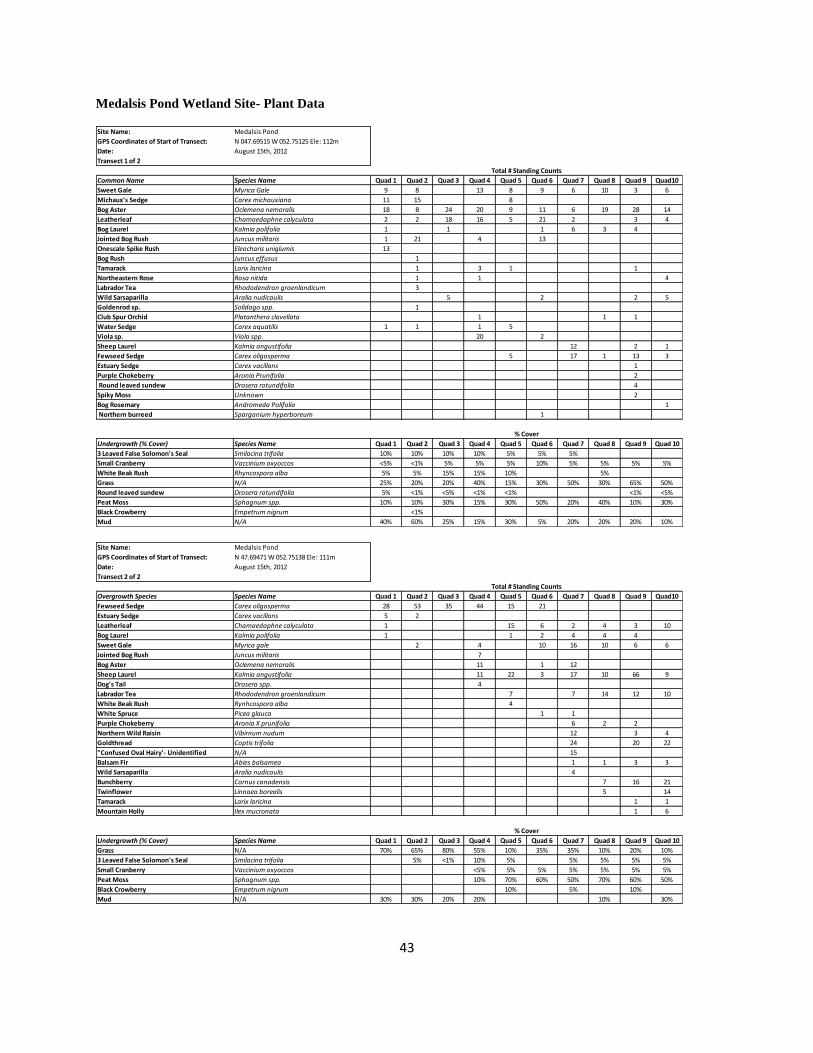
43
Medalsis Pond Wetland Site- Plant Data
Site Name: Medalsis Pond
GPS Coordinates of Start of Transect: N 047.69515 W 052.75125 Ele: 112m
Date: August 15th, 2012
Transect 1 of 2
Common Name Species Name Quad 1 Quad 2 Quad 3 Quad 4 Quad 5 Quad 6 Quad 7 Quad 8 Quad 9 Quad10
Sweet Gale Myrica Gale 9 8 13 8 9 6 10 3 6
Michaux's Sedge Carex michauxiana 11 15 8
Bog Aster Oclemena nemoralis 18 8 24 20 9 11 6 19 28 14
Leatherleaf Chamaedaphne calyculata 2 2 18 16 5 21 2 3 4
Bog Laurel Kalmia polifolia 1 1 1 6 3 4
Jointed Bog Rush Juncus militaris 1 21 4 13
Onescale Spike Rush Eleocharis uniglumis 13
Bog Rush Juncus effusus 1
Tamarack Larix laricina 1 3 1 1
Northeastern Rose Rosa nitida 1 1 4
Labrador Tea Rhododendron groenlandicum 3
Wild Sarsaparilla Aralia nudicaulis 5 2 2 5
Goldenrod sp. Solidago spp. 1
Club Spur Orchid Platanthera clavellata 1 1 1
Water Sedge Carex aquatilis 1 1 1 5
Viola sp. Viola spp. 20 2
Sheep Laurel Kalmia angustifolia 12 2 1
Fewseed Sedge Carex oligosperma 5 17 1 13 3
Estuary Sedge Carex vacillans 1
Purple Chokeberry Aronia Prunifolia 2
Round leaved sundew Drosera rotundifolia 4
Spiky Moss Unknown 2
Bog Rosemary Andromeda Polifolia 1
Northern burreed Sparganium hyperboreum 1
Undergrowth (% Cover) Species Name Quad 1 Quad 2 Quad 3 Quad 4 Quad 5 Quad 6 Quad 7 Quad 8 Quad 9 Quad 10
3 Leaved False Solomon's Seal Smilacina trifolia 10% 10% 10% 10% 5% 5% 5%
Small Cranberry Vaccinium oxyoccos <5% <1% 5% 5% 5% 10% 5% 5% 5% 5%
White Beak Rush Rhyncospora alba 5% 5% 15% 15% 10% 5%
Grass N/A 25% 20% 20% 40% 15% 30% 50% 30% 65% 50%
Round leaved sundew Drosera rotundifolia 5% <1% <5% <1% <1% <1% <5%
Peat Moss Sphagnum spp. 10% 10% 30% 15% 30% 50% 20% 40% 10% 30%
Black Crowberry Empetrum nigrum <1%
Mud N/A 40% 60% 25% 15% 30% 5% 20% 20% 20% 10%
Total # Standing Counts
% Cover
Site Name: Medalsis Pond
GPS Coordinates of Start of Transect: N 47.69471 W 052.75138 Ele: 111m
Date: August 15th, 2012
Transect 2 of 2
Overgrowth Species Species Name Quad 1 Quad 2 Quad 3 Quad 4 Quad 5 Quad 6 Quad 7 Quad 8 Quad 9 Quad10
Fewseed Sedge Carex oligosperma 28 53 35 44 15 21
Estuary Sedge Carex vacillans 5 2
Leatherleaf Chamaedaphne calyculata 1 15 6 2 4 3 10
Bog Laurel Kalmia polifolia 1 1 2 4 4 4
Sweet Gale Myrica gale 2 4 10 16 10 6 6
Jointed Bog Rush Juncus militaris 7
Bog Aster Oclemena nemoralis 11 1 12
Sheep Laurel Kalmia angustifolia 11 22 3 17 10 66 9
Dog's Tail Drosera spp. 4
Labrador Tea Rhododendron groenlandicum 7 7 14 12 10
White Beak Rush Rynhcospora alba 4
White Spruce Picea glauca 1 1
Purple Chokeberry Aronia X prunifolia 6 2 2
Northern Wild Raisin Vibirnum nudum 12 3 4
Goldthread Coptis trifolia 24 20 22
"Confused Oval Hairy'- Unidentified N/A 15
Balsam Fir Abies balsamea 1 1 3 3
Wild Sarsaparilla Aralia nudicaulis 4
Bunchberry Cornus canadensis 7 16 21
Twinflower Linnaea borealis 5 14
Tamarack Larix laricina 1 1
Mountain Holly Ilex mucronata 1 6
Undergrowth (% Cover) Species Name Quad 1 Quad 2 Quad 3 Quad 4 Quad 5 Quad 6 Quad 7 Quad 8 Quad 9 Quad 10
Grass N/A 70% 65% 80% 55% 10% 35% 35% 10% 20% 10%
3 Leaved False Solomon's Seal Smilacina trifolia 5% <1% 10% 5% 5% 5% 5% 5%
Small Cranberry Vaccinium oxyoccos <5% 5% 5% 5% 5% 5% 5%
Peat Moss Sphagnum spp. 10% 70% 60% 50% 70% 60% 50%
Black Crowberry Empetrum nigrum 10% 5% 10%
Mud N/A 30% 30% 20% 20% 10% 30%
Total # Standing Counts
% Cover

44
Medalsis Pond Wetland Site- Invertebrate Data
Site: Medalsis Pond
GPS Coordinates (Sample 1) N 47.69506 W 052.75127
GPS Coordinates (Sample #2) N 47.69521 W 052.75142
Order Family Common Name Count
No Inverts Found
2 Small Arachnids Found on net
however, small size - around a
couple of millimetres.
Medalsis Pond Wetland Site- Stress Evaluation Rubric
Value 3 2 1 X 2
1 < 1000 m2
2 1000 - 10,000
3 > 10,000 m2
1 < 1000 m2
2 1000 - 10,000 m2
3 > 10,000 m2
2 Dense
1 Sparse
2 Dense
1 Sparse
2 Dense
1 Sparse
0
Value 3 2 1
Culvert
Dam
Table 1
Table 2
Table 3
Score
0
TOTALS
0
3
Part 3: Culverts and Dams
# Present Comment TOTALS
4 Lane Road 3
3
0
3
3
2 Lane Road 2
30 m - 50 m Elevation
of ConcernTOTALS
Dirt Road Medalsis Pond Road 1 3
15 m - 30 m
Part 2: Roadways
Feature<15m
Commercial /
Institutional
Industrial
Impervious Surfaces
Residential
15 m - 30 m 30 m - 50 m Elevation of
Concern TOTALS
Agriculture
<15m
Part 1: Area Features
FeatureArea
The wetland delineation found in Appendix A (Figure 6) was used for the analysis of potential stressors in the stress
evaluation rubric. The only feature located within 50m of the wetland boundary was Medalsis Pond Road, which
was a small dirt road. There was agricultural area located to the south of the wetland, but they were outside the 50m
used in this study.
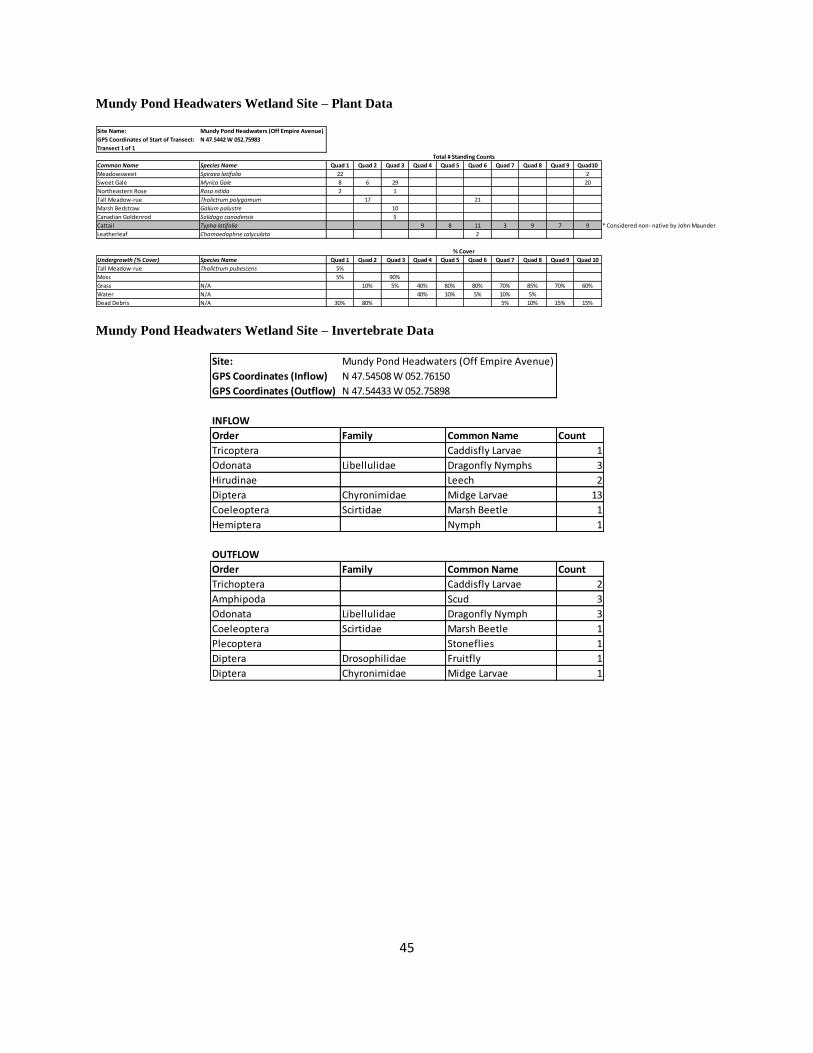
45
Mundy Pond Headwaters Wetland Site – Plant Data
Site Name: Mundy Pond Headwaters (Off Empire Avenue)
GPS Coordinates of Start of Transect: N 47.5442 W 052.75983
Transect 1 of 1
Common Name Species Name Quad 1 Quad 2 Quad 3 Quad 4 Quad 5 Quad 6 Quad 7 Quad 8 Quad 9 Quad10
Meadowsweet Spiraea latifolia 22 2
Sweet Gale Myrica Gale 8 6 29 20
Northeastern Rose Rosa nitida 2 1
Tall Meadow-rue Thalictrum polygamum 17 21
Marsh Bedstraw Galium palustre 10
Canadian Goldenrod Solidago canadensis 5
Cattail Typha latifolia 9 8 11 3 9 7 9 * Considered non- native by John Maunder
Leatherleaf Chamaedaphne calyculata 2
Undergrowth (% Cover) Species Name Quad 1 Quad 2 Quad 3 Quad 4 Quad 5 Quad 6 Quad 7 Quad 8 Quad 9 Quad 10
Tall Meadow-rue Thalictrum pubescens 5%
Moss 5% 90%
Grass N/A 10% 5% 40% 80% 80% 70% 85% 70% 60%
Water N/A 40% 10% 5% 10% 5%
Dead Debris N/A 30% 80% 5% 10% 15% 15%
Total # Standing Counts
% Cover
Mundy Pond Headwaters Wetland Site – Invertebrate Data
Site:
GPS Coordinates (Inflow) N 47.54508 W 052.76150
GPS Coordinates (Outflow) N 47.54433 W 052.75898
INFLOW
Order Family Common Name Count
Tricoptera Caddisfly Larvae 1
Odonata Libellulidae Dragonfly Nymphs 3
Hirudinae Leech 2
Diptera Chyronimidae Midge Larvae 13
Coeleoptera Scirtidae Marsh Beetle 1
Hemiptera Nymph 1
OUTFLOW
Order Family Common Name Count
Trichoptera Caddisfly Larvae 2
Amphipoda Scud 3
Odonata Libellulidae Dragonfly Nymph 3
Coeleoptera Scirtidae Marsh Beetle 1
Plecoptera Stoneflies 1
Diptera Drosophilidae Fruitfly 1
Diptera Chyronimidae Midge Larvae 1
Mundy Pond Headwaters (Off Empire Avenue)
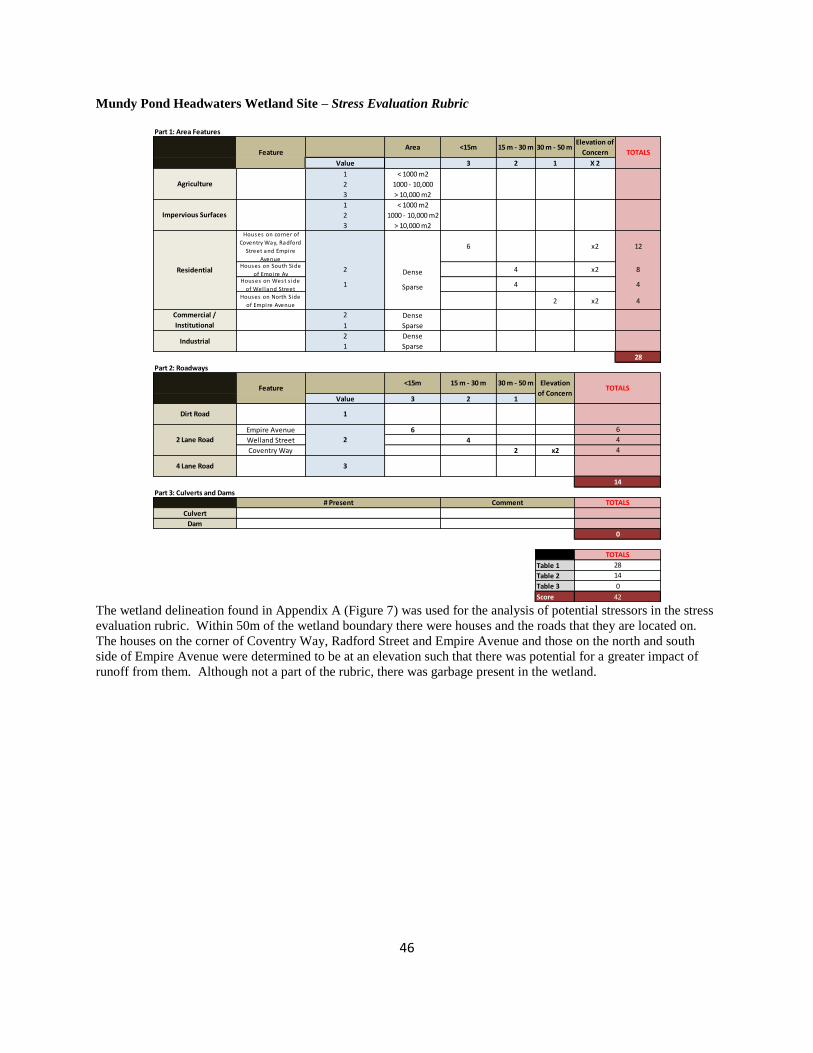
46
Mundy Pond Headwaters Wetland Site – Stress Evaluation Rubric
Value 3 2 1 X 2
1 < 1000 m2
2 1000 - 10,000
3 > 10,000 m2
1 < 1000 m2
2 1000 - 10,000 m2
3 > 10,000 m2 Houses on corner of
Coventry Way, Radford
Street and Empire
Avenue
6 x2 12
Houses on South Side
of Empire Av2 Dense 4 x2 8
Houses on West s ide
of Wel land Street1 Sparse 4 4
Houses on North Side
of Empire Avenue2 x2 4
2 Dense
1 Sparse
2 Dense
1 Sparse
28
Value 3 2 1
Empire Avenue 6
Welland Street 4
Coventry Way 2 x2
Culvert
Dam
Table 1
Table 2
Table 3
Score
Part 1: Area Features
FeatureArea 15 m - 30 m 30 m - 50 m
Elevation of
Concern TOTALS
Agriculture
<15m
Impervious Surfaces
Residential
Commercial /
Institutional
Industrial
Part 2: Roadways
Elevation
of ConcernTOTALS
Dirt Road 1
15 m - 30 mFeature
<15m 30 m - 50 m
2 Lane Road 2
6
4
4
0
42
0
TOTALS
28
14
14
Part 3: Culverts and Dams
# Present Comment TOTALS
4 Lane Road 3
The wetland delineation found in Appendix A (Figure 7) was used for the analysis of potential stressors in the stress
evaluation rubric. Within 50m of the wetland boundary there were houses and the roads that they are located on.
The houses on the corner of Coventry Way, Radford Street and Empire Avenue and those on the north and south
side of Empire Avenue were determined to be at an elevation such that there was potential for a greater impact of
runoff from them. Although not a part of the rubric, there was garbage present in the wetland.

47
Sheens Pond Wetland Site- Plant Data
Site Name: Sheen's Pond
GPS Coordinates of Start of Transect: N 47.59258 W 052.66709
Transect 1 of 2
Common Name Species Name Quad 1 Quad 2 Quad 3 Quad 4 Quad 5 Quad 6 Quad 7 Quad 8 Quad 9 Quad10
White Spruce Picea glauca 1 2
Sweet Gale Myrica gale 10 13 10 30 18 16 17 8 7 4
Sheep Laurel Kalmia angustifolia 12 3 20 23 33 40 47
Common Labrador Tea Rhododendron groenlandicum 4 4
Pale Bog Laurel Kalmia polyfolia 1 1 9 1 1
Sweet gale Myrica gale 3 4 3 5 6 3 9
Catttail Typha latifolia 5 6 7 5 * Considered non- native by John Maunder
Balsam Fir Abies balosamia 2
Leatherleaf Chamaedaphne calyculata 3 4 4 3 7
Undergrowth (% Cover) Species Name Quad 1 Quad 2 Quad 3 Quad 4 Quad 5 Quad 6 Quad 7 Quad 8 Quad 9 Quad 10
Peat Moss Sphagnum spp. 70% <5% <5% 50% 65% <5% 50% 60% 75%
Grass N/A 60% 5% <5% <5% 10% 15% 20% <5% <5%
Open Water N/A <5% <5% 80% 80% 15% 15% 15% 10%
Total # Standing Counts
% Cover
Site Name: Sheen's Pond
GPS Coordinates of Start of Transect: N 47.59258 W 052.66709
Transect 2 of 2
Common Name Species Name Quad 1 Quad 2 Quad 3 Quad 4 Quad 5
White Spruce Picea glauca 1 1
Sweet Gale Myrica gale 19 12 10 3
Sheep Laurel Kalmia angustifolia 31 25 21 17 3
Common Labrador Tea Rhododendron groenlandicum 2 2
Pale Bog Laurel Kalmia polyfolia 3
Cattail Typha latifolia 3 * Considered non- native by John Maunder
Mountain Fly Honeysuckle Lonicera villosa 2
Leatherleaf Chamaedaphne calyculata 3 10
Dead Tree NA 1
Undergrowth (% Cover) Species Name Quad 1 Quad 2 Quad 3 Quad 4 Quad 5
Peat Moss Sphagnum spp. <5% 30% 20 30 30%
Grass N/A 10% 50% 40% <5%
Open Water N/A 20% <5%
Total # Standing Counts
% Cover
Sheens Pond Wetland Site- Invertebrate Data
Site: Sheens Pond (No defined inflow or outflow)
GPS Coordinates (Sample 1) N 47.59258 W 052.66709
GPS Coordinates (Sample 2) N 47.59258 W 052.66709
Both samples
Order Family Common Name Count
Coleoptera Helodidae Water Beetle 2
Diptera Culicidae Mosquito Larvae 1
Diptera Adult 1
(no organsims recorded for this location)

48
Sheens Pond Wetland Site- Stress Evaluation Rubric
Value 3 2 1 X 2
1 < 1000 m2
2 1000 - 10,000
3 > 10,000 m2
1 < 1000 m2
2 1000 - 10,000 m2
3 > 10,000 m2
2 Dense
1 Sparse
2 Dense
1 Sparse
2 Dense
1 Sparse
0
Value 3 2 1
Culvert
Dam
Table 1
Table 2
Table 3
Score
Part 1: Area Features
FeatureArea 15 m - 30 m 30 m - 50 m
Elevation of
Concern TOTALS
Agriculture
<15m
Impervious Surfaces
Residential
Commercial /
Institutional
Industrial
Part 2: Roadways
Feature<15m 30 m - 50 m Elevation
of ConcernTOTALS
Dirt Road Gravel Access Road 1 3 x2
15 m - 30 m
6
2 Lane Road 2
6
Part 3: Culverts and Dams
# Present Comment TOTALS
4 Lane Road 3
6
0
TOTALS
0
6
0
The wetland delineation found in Appendix A (Figure 8) was used for the analysis of potential stressors in the stress
evaluation rubric. The only feature found to be located within 50m of the wetland boundary was the dirt road that
ran alongside of it, which was determined to be at an elevation such that there was potential for a greater impact of
runoff from it.
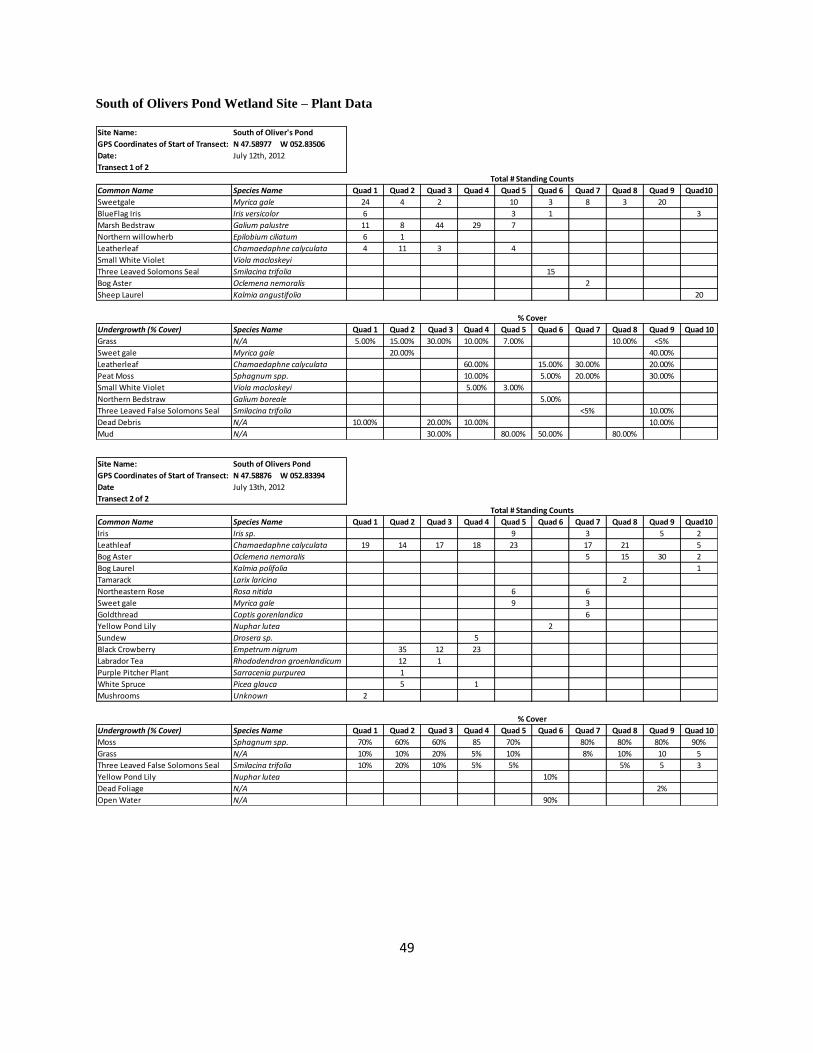
49
South of Olivers Pond Wetland Site – Plant Data
Site Name: South of Oliver's Pond
GPS Coordinates of Start of Transect: N 47.58977 W 052.83506
Date: July 12th, 2012
Transect 1 of 2
Common Name Species Name Quad 1 Quad 2 Quad 3 Quad 4 Quad 5 Quad 6 Quad 7 Quad 8 Quad 9 Quad10
Sweetgale Myrica gale 24 4 2 10 3 8 3 20
BlueFlag Iris Iris versicolor 6 3 1 3
Marsh Bedstraw Galium palustre 11 8 44 29 7
Northern willowherb Epilobium ciliatum 6 1
Leatherleaf Chamaedaphne calyculata 4 11 3 4
Small White Violet Viola macloskeyi
Three Leaved Solomons Seal Smilacina trifolia 15
Bog Aster Oclemena nemoralis 2
Sheep Laurel Kalmia angustifolia 20
Undergrowth (% Cover) Species Name Quad 1 Quad 2 Quad 3 Quad 4 Quad 5 Quad 6 Quad 7 Quad 8 Quad 9 Quad 10
Grass N/A 5.00% 15.00% 30.00% 10.00% 7.00% 10.00% <5%
Sweet gale Myrica gale 20.00% 40.00%
Leatherleaf Chamaedaphne calyculata 60.00% 15.00% 30.00% 20.00%
Peat Moss Sphagnum spp. 10.00% 5.00% 20.00% 30.00%
Small White Violet Viola macloskeyi 5.00% 3.00%
Northern Bedstraw Galium boreale 5.00%
Three Leaved False Solomons Seal Smilacina trifolia <5% 10.00%
Dead Debris N/A 10.00% 20.00% 10.00% 10.00%
Mud N/A 30.00% 80.00% 50.00% 80.00%
Total # Standing Counts
% Cover
Site Name: South of Olivers Pond
GPS Coordinates of Start of Transect: N 47.58876 W 052.83394
Date July 13th, 2012
Transect 2 of 2
Common Name Species Name Quad 1 Quad 2 Quad 3 Quad 4 Quad 5 Quad 6 Quad 7 Quad 8 Quad 9 Quad10
Iris Iris sp. 9 3 5 2
Leathleaf Chamaedaphne calyculata 19 14 17 18 23 17 21 5
Bog Aster Oclemena nemoralis 5 15 30 2
Bog Laurel Kalmia polifolia 1
Tamarack Larix laricina 2
Northeastern Rose Rosa nitida 6 6
Sweet gale Myrica gale 9 3
Goldthread Coptis gorenlandica 6
Yellow Pond Lily Nuphar lutea 2
Sundew Drosera sp. 5
Black Crowberry Empetrum nigrum 35 12 23
Labrador Tea Rhododendron groenlandicum 12 1
Purple Pitcher Plant Sarracenia purpurea 1
White Spruce Picea glauca 5 1
Mushrooms Unknown 2
Undergrowth (% Cover) Species Name Quad 1 Quad 2 Quad 3 Quad 4 Quad 5 Quad 6 Quad 7 Quad 8 Quad 9 Quad 10
Moss Sphagnum spp. 70% 60% 60% 85 70% 80% 80% 80% 90%
Grass N/A 10% 10% 20% 5% 10% 8% 10% 10 5
Three Leaved False Solomons Seal Smilacina trifolia 10% 20% 10% 5% 5% 5% 5 3
Yellow Pond Lily Nuphar lutea 10%
Dead Foliage N/A 2%
Open Water N/A 90%
Total # Standing Counts
% Cover

50
South of Olivers Pond Wetland Site – Invertebrate Data
Site:
GPS Coordinates (Inflow)
GPS Coordinates (Downstream)
INFLOW
Order Family Common Name Count
Coleoptera Dytiscidae Predacious Diving Beetle 12
Coleoptera Dytiscidae Larvae 1
Coleoptera Whirlygig 1
Coleoptera Unknown #1 1
Coleoptera Unknown#2 1
Odonata Ashnidae 1
Odonata Anisoptera Dragonfly Nymph 1
Hemiptera Pleidae 1
Hemiptera Corixidae Water Boatmen 8
DOWNSTREAM
Order Family Common Name Count
Mollusca Pill Clam 1
Odonata Anisoptera Dragonfly Nymph 1
South of Oliver's Pond
N 47.58977 W 052.83506
N 47.58942 W 052.83461
South of Olivers Pond Wetland Site – Stress Evaluation Rubric
Value 3 2 1 X 2
1 < 1000 m2
2 1000 - 10,000
3 > 10,000 m2 9
1 < 1000 m2
2 1000 - 10,000 m2
3 > 10,000 m2
Res idence on Ol ivers
Pond Road (to the east
of wetland)
2Dense
2
Res idence on Ol ivers
Pond Road (to the west
of wetland)
1Sparse
3
2 Dense
1 Sparse
2 Dense
1 Sparse
14
Value 3 2 1
Culvert
Dam
Table 1
Table 2
Table 3
Score
Part 1: Area Features
FeatureArea 15 m - 30 m 30 m - 50 m
Elevation of
Concern TOTALS
AgricultureProperty facing
Olivers Pond Place9
<15m
Impervious Surfaces
Residential 5
Commercial /
Institutional
Industrial
Part 2: Roadways
Feature<15m 30 m - 50 m Elevation
of ConcernTOTALS
Dirt Road 1
15 m - 30 m
2 Lane Road Oliver's Pond Road 2 6 6
6
1
21
1 Crosses under Oliver's Pond Road 1
1
TOTALS
14
6
Part 3: Culverts and Dams
# Present Comment TOTALS
4 Lane Road 3
The wetland delineation found in Appendix A (Figure 9) was used for the analysis of potential stressors in the stress
evaluation rubric. There was an agricultural area located to the west of the wetland boundary, and some residences
that appeared to be within 50m of the wetland boundary. Olivers Pond Road was also one of the features included
in the rubric.

51
Topsail Beach Wetland Site- Plant Data
Site Name: Topsail Beach
GPS Coordinates of Start of Transect:
Date: August 6th, 2012
Transect 1 of 2
Common Name Species Name Quad 1 Quad 2 Quad 3 Quad 4 Quad 5 Quad 6 Quad 7 Quad 8 Quad 9 Quad10
Blue Flag Irises Iris versicolor 2 2
Large Forget-Me-Not Myosotis scorpioides 9 4 9 10 10 2 1
Common Reed Phragmites australis 20 11 45 *NL Invasive Species
Bog buckbean Menyanthes trifoliata 2 41 23 1
Woolgrass Scirpus cypernius 3 6
Yellow Loosestrife/Swamp Candles Lysmachia terrestris 1
Spurred Gentain Halenia deflexa 1
Rattlesnake Mannagrass Glyceria canadensis 1
Undergrowth (% Cover) Species Name Quad 1 Quad 2 Quad 3 Quad 4 Quad 5 Quad 6 Quad 7 Quad 8 Quad 9 Quad 10
Sweetflag Aconus americanus 40% 15% 30%
Normal grass N/A 30% 40% 30% 30% 20% 70% 40%
Common Reed Phragmites australis 30% <5% *NL Invasive Species
Bog buckbean Menyanthes trifoliata 90% 30% 60% 40%
Long thin grass N/A 10% 15%
Dead grass N/A 30% 40% 30% 20%
Open water N/A 15% 5% 30% 20% 40% 40% 30% 30% 35%
N 47.54090 W 052.92653 Ele: 3m
Total # Standing Counts
% Cover
Site Name: Topsail Beach
GPS Coordinates of Start of Transect: N 47.54082 W 052.92688 Ele: 1m
Date: August 6th, 2012
Transect 2 of 2
Common Name Species Name Quad 1 Quad 2 Quad 3 Quad 4 Quad 5 Quad 6 Quad 7 Quad 8 Quad 9 Quad10
Large Forget-Me-Not Myosotis scorpioides 3 4 5 12 2 2
Blue Flag Iris Iris versicolor 1 4 4 4 5
Common Reed Phragmites australis 2 * NL Invasive Species
Unidentified N/A 2
Bogbean/Buckbean Menyanthes trifoliata 2
Rough Mannagrass Glyceria maxima 14 * Considered non- native by John Maunder
White Beak Rush Rhynchospora alba 1 1
Yellow Loosestrife/Swamp Candles Lysimachia terrestris 3 7
Spurred Gentain Halenia deflexa 1
Tall Meadow Rue Thalictrum pubescens 6 2
Arrowleaf Tearthumb Persicaria sagittata 2 10 9 12
New York Aster Symphyotrichum novi-belgii 1 2 30 23 24
Marsh Willowherb Epilobium palustre 2 1
Field Horsetail Equisetum arvense 2 3 6 14
Marsh Bedstraw Galium palustre 12 21 15 9
Meadowsweet Spiraea latifolia 2 1
Undergrowth (% Cover) Species Name Quad 1 Quad 2 Quad 3 Quad 4 Quad 5 Quad 6 Quad 7 Quad 8 Quad 9 Quad 10
Bog Buckbean Menyanthes trifoliata 70% 70% 60%
Normal Grass N/A 10% 10% 20% 60% 80% 50% 10% 30% 30% 25%
Common Reed Phragmites australis 5% * NL Invasive Species
Sweetflag Acornus americanus 10% 30% 10%
Viola spp. Viola spp. 5% 5% 5% 5%
Peat Moss Sphagnum sp. 10% 30% 40% 50%
Dead Grass N/A 15%
Open Water N/A 20% 15% 40% 20% 40% 45% 20% 10%
Total # Standing Counts
% Cover

52
Topsail Beach Wetland Site- Invertebrate Data
Site: Topsail Beach
GPS Coordinates (Sample #1) N 47.54103 W 052.92672
GPS Coordinates (Sample #2) N 47.54076 W 052.92760
Sample #1
Order Family Common Name Count
Diptera Chironimidae Midge Larvae 7
Ephemeroptera Potamonthidae Mayfly Adults 60
Hirudinae Leech 23
Hemiptera Corixidae Water Boatmen 8
Platyhelminthes Flatworm 5
Oligochaeta Aquatic earthworm 1
Ostracod Seed Shrimp 1
Sample #2
Order Family Common Name Count
Hirudinae Leech 3
Hemiptera Corixidae Water Boatmen 5
Amphipoda Scud 1
Hempitera Gerridae Water Strider 1
Topsail Beach Wetland Site- Stress Evaluation Rubric
Value 3 2 1 X 2
1 < 1000 m2
2 1000 - 10,000
3 > 10,000 m2
1 < 1000 m2
2 1000 - 10,000 m2
3 > 10,000 m2
2 Dense
1 Sparse
2 Dense
1 Sparse
2 Dense
1 Sparse
3
Value 3 2 1
Culvert
Dam
Table 1
Table 2
Table 3
Score
Part 1: Area Features
FeatureArea 15 m - 30 m 30 m - 50 m
Elevation of
Concern TOTALS
Agriculture
<15m
Impervious Surfaces
ResidentialResidential Properties
on Route 6033
Commercial /
Institutional
Industrial
Part 2: Roadways
Feature<15m 30 m - 50 m Elevation
of ConcernTOTALS
Dirt Road 1
15 m - 30 m
2 Lane Road Route 60 2 2 x2 4
0
7
0
TOTALS
3
4
4
Part 3: Culverts and Dams
# Present Comment TOTALS
4 Lane Road 3
The wetland delineation found in Appendix A (Figure 10) was used for the analysis of potential stressors in the
stress evaluation rubric. The residential properties on Route 60 and Route 60 (Conception Bay Highway) were the
only two features determined to be within 50m of the wetland boundary. Only Route 60 was determined to be at an
elevation such that there was potential for a greater impact of runoff from it.

53
Voiseys Brook South Wetland Site- Plant Data
Site Name: Voisey's Brook South
GPS Coordinates of Start of Transect:
Date: July 25th 2012
Transect 1 of 1
Common Name Species Name Quad 1 Quad 2 Quad 3 Quad 4 Quad 5 Quad 6 Quad 7 Quad 8 Quad 9 Quad10
Mountain Holly Ilex mucronata 6 1 5 9
Sheep Laurel Kalmia angustifolia 18 9
Labrador Tea Rhododendron groenlandicum 27 38 22 2 1
Cottontail Sedge Eriophorum spp. 1
Bog Laurel Kalmia polifolia 8 26 6 16 2 5 1 10
Bunchberry Cornus canadensis 5 59 34
Sweet gale Myrica gale 16 6 22 31 15 29 21 14 6 19
Leatherleaf Chamaedaphne calyculata 7 35 23 39 8 3 15
3 Leaved False Solomons Seal Smilacinia trifolia 5 3 7 4 20
White Spruce Picea glauca 10
Tamarack Larix laricinia 2
Goldenrod Solidago spp. 2
Northeastern Rose Rosa nitida 1 1 7 1 10 3
Tall Meadow-rue Thalictrum pubescens 1
Bog Aster Oclemena nemoralis 43 12 1 88 20 53
Rough Leaved Aster Eurybia radula 3
Northern Wild Raisin Viburnum nudum 3
Canada Rush Juncus candensis 33 4
Undergrowth (% Cover) Species Name Quad 1 Quad 2 Quad 3 Quad 4 Quad 5 Quad 6 Quad 7 Quad 8 Quad 9 Quad 10
Peat Moss Sohagnum spp. 40% 20% 15% 60% 20% 40% 30% 40% 60% 50%
Grass N/A 20% 10% 5% 10% 5% 5% 10% 10% 20% 30%
Black Crowberry Empetrum nigrum 15% <5% <5%
Sundew Drosera spp. <5% <1%
Small Cranberry Vaccinium oxycoccus <10% <5% <10% 5% 5% <5% <10% 5%
Leatherleaf Chamaedaphne calyculata 30% 10%
Mountain Fly Honeysuckle Lonicera villosa 20% 10% 10%
N 47.62823 W 052.81515 Ele: 138m
Total # Standing Counts
% Cover
Voiseys Brook South Wetland Site- Invertebrate Data
Site: Voisey's Brook South
GPS Coordinates (Inflow)
GPS Coordinates (Outflow)
INFLOW (site #2)
Order Family Common Name Count
Diptera Chironimidae Midge larvae 25
Amphipoda Scuds 39
Coleoptera Dytiscidae 12
Trichoptera Limnephilidae Northern Caddisfly 5
Trichoptera Polycentropidae Caddisfly larvae 2
Diptera Psychodidae Larvae 1
Hydracarina Aquatic Mite 1
Annelida Hirudinae Leech 1
OUTFLOW (site #1)
Order Family Common Name Count
Amphipoda Scud 27
Diptera Chironimidae Midge Larvae 27
Coleoptera Dytiscidae 2
Trichoptera Polycentropidae 3
Isopoda Aquatic Sowbug 2
Unknown Flatworm 1
N 47.6542 W052.92110 Elevation: 125 m
N 47.62899 W 052.81451 Elevation: 131 m

54
Voiseys Brook South Wetland Site- Stress Evaluation Rubric
Value 3 2 1 X 2
1 < 1000 m2
2 1000 - 10,000
3 > 10,000 m2
1 < 1000 m2
2 1000 - 10,000 m2
3 > 10,000 m2Hous ing on the North
s ide of Indian Meal
Line
2 Dense 6
6Hous ing on the South
s ide of Indian Meal
Line
1 Sparse 2 x2 4
2 Dense
1 Sparse
2 Dense
1 Sparse
10
Value 3 2 1
Culvert
Dam
Table 1
Table 2
Table 3
Score
Part 1: Area Features
FeatureArea
Impervious Surfaces
Residential
15 m - 30 m 30 m - 50 m Elevation of
Concern TOTALS
Agriculture
<15m
Commercial /
Institutional
Industrial
Part 2: Roadways
Feature<15m 30 m - 50 m Elevation
of ConcernTOTALS
Dirt Road Voiseys Brook Road 1 3
15 m - 30 m
3
2 Lane Road Indian Meal Line 2 6 6
9
0
19
0
TOTALS
10
9
Part 3: Culverts and Dams
# Present Comment TOTALS
4 Lane Road 3
The wetland delineation found in Appendix A (Figure 11) was used for the analysis of potential stressors in the
stress evaluation rubric. Features determined to be within 50m of the wetland boundary were Voiseys Brook Road,
Indian Meal Line, and residences on Indian Meal Line. Only the residences on the south side of Indian Meal Line
were determined to be at an elevation such that there was potential for a greater impact of runoff from them. The
gravel parking area at Voiseys Brook park was also within 50m of the wetland boundary, but was not included in the
rubric because it did not fit the categories.

55
Voiseys Brook West Wetland- Plant Data
Site Name: Voisey's Brook (West)
GPS Coordinates of Start of Transect:
Date: July 19th, 2012
Transect 1 of 2
Common Name Species Name Quad 1 Quad 2 Quad 3 Quad 4 Quad 5 Quad 6 Quad 7 Quad 8 Quad 9 Quad10
Tawny Cottongrass Eriophorum virginicum 7 5 8 3
Sheep Laurel Kalmia angustifolia 15 4 14 20 5 3 9 4
Tamarack Larix laricinia 3 1 2 2 1 2
Bog Aster Oclemena nemoralis 1 21 8
Bog Goldenrod Solidago uliginosa 1 3
Bog Laurel Kalmia polifolia 8 13 18 3 4 3 5 4 9
Leather Leaf Chamaedaphne calyculata 22 12 19 3
Sweet gale Myrica gale 9 15 10 5 1 2 11 11
Chesnut Sedge Carex castanea 6
Labrador Tea Rhododendron groenlandicum 1 4 5 1 2 3 13
Dwarf Huckleberry /Bog Huckleberry Gaylussacia bigeloviana 1
Balsam Fir Abies balsamea 1 2 1 2 1
White Spruce Picea glauca 18 5 7 4
Creeping Snowberry Gaultheria hispidula 45
Purple Chokeberry Aronia X prunifolia 4 7
Bunchberry Cornus canadensis 1
Undergrowth (% Cover) Species Name Quad 1 Quad 2 Quad 3 Quad 4 Quad 5 Quad 6 Quad 7 Quad 8 Quad 9 Quad 10
Peat Moss Sphagnum spp. 60% 50% 60% 80% 30% 60% 30% 50% 60% 60%
Black Crowberry Empetrum nigrum 5% 5% 10% <1% 10% 5%
3 Leaved Falso Solomons Seal Smilacina trifolia 10% <5% 5% 5% 10% 10% 5% <5% 10%
Sundew Drosera spp. <5% 5% <5% <5% 10% 5% <5%
Sweet gale Myrica Gale 10% 10% 5% 10%
Grass N/A 15% 5% 10% 20% 15% 15% 10%
Mud N/A 10% 25%
N 47.62985 W 052.81763 Ele: 135m
Total # Standing Counts
% Cover
Site Name: Voisey's Brook West
GPS Coordinates of Start of Transect:
Date: July 19th 2012
Transect 2 of 2
Common Name Species Name Quad 1 Quad 2 Quad 3 Quad 4 Quad 5 Quad 6 Quad 7 Quad 8 Quad 9 Quad10
Labrador Tea Rhododendron groenlandicum 6 21 18 3 16 6 3 2 4 7
Bog Laurel Kalmia polifolia 7 8 6 2 5 3 4 4 3
Leatherleaf Chamaedaphne calyculata 26 5 12
Tawny Cottongrass Eriophorum virginicum 30
Bog Goldenrod Solidago uliginosa 1
Sheep Laurel Kalmia angustifolia 6 10 36 45 12 3 7 32 27 62
Bog Aster Oclemena nemoralis 4
Sweet Gale Myrica gale 3 2 4
Tamarack Larix laricinia 1 1 3 2 2
Purple Chokeberry Aronia X prunifolia 4 6 12 9
White Spruce Picea glauca 1
Goldthread Coptis trifolia 22 11
Twinflower Linna borealis 3
Undergrowth (% Cover) Species Name Quad 1 Quad 2 Quad 3 Quad 4 Quad 5 Quad 6 Quad 7 Quad 8 Quad 9 Quad 10
Peat Moss Sphagnum spp. 50% 60% 40% 70% 30% 40% 10% 50% 40% 30%
Grass N/A 10% 10% 5% 20% 10% 15% 15% 15% 20%
Sweet Gale Myrica Gale 15% 20% 10%
Black Crowberry Empetrum nigrum 5% 10% 10% 15% 20% 10% 10% 10% 10% 5%
3 Leaved False Solomons Seal Smilacina trifolia 5% 5% <5% 5% 5% 5% 5% 5% <5%
Creeping Snowberry Gaultheria hispidula 5% <5% <5% 5%
Sundew Drosera spp. 1% 1% 1%
White Spruce Picea glauca 50%
Moss N/A 5% <5% <5% 5%
Total # Standing Counts
N 47.63029 W 052.81836 Ele: 136m
% Cover

56
Voiseys Brook West Wetland- Invertebrate Data
Site: Voisey's Brook West
GPS Coordinates (Sample #2)
GPS Coordinates (Sample #1)
Upstream (Sample #2)
Order Family Common Name Count
Odonata Anisoptera Dragonfly Nymph 3
Isopoda Armadellididae Common Pillbug 1
Hemipteran Corixidae Water Boatmen 1
Coleoptera Dytiscidae Predacious Diving Beetle 1
Coleoptera Scirtidae Marsh Beetle Larvae 2
Diptera Simuliidae Blade Fly 1
Downstream (Sample #1)
Order Family Common Name Count
Amphipoda Scud 6
Diptera Chironomidae Midge Larvae 1
Arachnida Spider 1
Odonata Anisoptera Dragonfly Nymph 1
N 47.63108 W 052.81830 Ele: 129m
N 47.63031 W 052.81842 Ele: 134m
Voiseys Brook West Wetland- Stress Evaluation Rubric
Value 3 2 1 X 2
1 < 1000 m2
2 1000 - 10,000
3 > 10,000 m2
1 < 1000 m2
2 1000 - 10,000 m2
3 > 10,000 m2
Residences on
Indian Meal Line2 x2
4
Residences on Lees
Place2 Dense 3 x2
6
Residence on
Bauline Line
Extension
1 Sparse 3 x2
6
2 Dense
1 Sparse
2 Dense
1 Sparse
16
Value 3 2 1
Culvert
Dam
Table 1
Table 2
Table 3
Score
Part 1: Area Features
FeatureArea
Impervious Surfaces
Residential
15 m - 30 m 30 m - 50 m Elevation of
Concern TOTALS
Agriculture
<15m
Commercial /
Institutional
Industrial
Part 2: Roadways
Feature<15m 30 m - 50 m Elevation
of ConcernTOTALS
Dirt Road 1
15 m - 30 m
2 Lane Road Indian Meal Line 2 4 x2 8
8
0
24
0
TOTALS
16
8
Part 3: Culverts and Dams
# Present Comment TOTALS
4 Lane Road 3
The wetland delineation found in Appendix A (Figure 11) was used for the analysis of potential stressors in the
stress evaluation rubric. Indian Meal Line and residences on Indian Meal Line, Lees Place and Bauline Line
Extension were determined to be within 50m of the delineated wetland boundary. All of these features were
determined to be at an elevation such that there was potential for a greater impact of runoff from them.

57
West Dam Pond Wetland Site- Plant Data
Site Name: West Dam Pond
GPS Coordinates of Start of Transect:N 47.63158 W 052.95720 Ele:100m
Date: August 1st 2012
Transect 1 of 2
Common Name Species Name Quad 1 Quad 2 Quad 3 Quad 4 Quad 5 Quad 6 Quad 7 Quad 8 Quad 9 Quad10
Sweet Gale Myrica gale 13 13 8 16 11 8 5 2 8
Goldenrod Solidago sp. 5 1 3 1
Leatherleaf Chamaedaphne calyculata 13 7 8 16 40 50 28 50 29
Bog Aster Oclemena nemoralis 3 28 6 10 12 1 5 3 1 6
Sheep Laurel Kalmia angustifolia 7 1 4 1
Labrador Tea Rhododendron groenlandicum 2 17 25
Rhodora Rhododendron canadense 5 5
Purple Chokeberry Aronia prunifolia 2
Cinnamon Fern Osmundastrum cinnamomeum 14 4
Bog Rush/Soft Rush Juncus effusus 3 6 20 14 12 14 10 14
Marsh Bedstraw Galium palustrae 6 14
Bog Laurel Kalmia polifolia 12 9 2
Mountain Holly Ilex mucronata 4
Undergrowth (% Cover) Species Name Quad 1 Quad 2 Quad 3 Quad 4 Quad 5 Quad 6 Quad 7 Quad 8 Quad 9 Quad 10
Grass N/A 90% 15% 60% 60% 60% 30% 60% 70% 40% 90%
3 Leaved False Solomons Seal Smilacinia trifolia <5% 5% 10% 10% <5% <5% <5%
Peat Moss Sphagnum sp. 15% 10% 40% 10% 5% 40%
Small Cranberry Vaccinium oxyoccos <5% 5% 5% <1% 10% <5%
Dead Grass N/A 5% 30% 20% 10% 20% 10% 5% <5%
Mud N/A 60% 10%
Total # Standing Counts
Site Name: West Dam Pond
GPS Coordinates of Start of Transect: N 47.63213 W 052.95539 Ele: 100m
Date: August 1st 2012
Transect 2 of 2
Common Name Species Name Quad 1 Quad 2 Quad 3 Quad 4 Quad 5 Quad 6 Quad 7 Quad 8 Quad 9 Quad10
Goldenrod Solidago spp. 6 14 4 1 6 10 4
Sweet Gale Myrica gale 1 3 8 3 1 5 4 3 5 13
Cut Leaved Water Horehound Lycopus americanus 14 46 32 45 31 17 7 24 25 20
Spotted Touch Me Not/Jewelweed Impatiens capensis 7
Marsh Bedstraw Galium palustre 6 6 17 16 9 4 9
Rattlesnake Mannagrass Glyceria canadensis 3 2 5 13 3
Arrowleaf Tearthumb/ Arrow-leaved smartweedPersicaria sagittata 67 2 7 1
Bog Aster Oclemena nemoralis 4 26 29 7 6 11 32 6
Devils beggarticks Bidens frondosa 1 2
Meadowsweet Spirea latifolia 36 18
Aster sp. Symphyotrichum spp. 7
Undergrowth (% Cover) Species Name Quad 1 Quad 2 Quad 3 Quad 4 Quad 5 Quad 6 Quad 7 Quad 8 Quad 9 Quad 10
Grass N/A 80% 90% 60% 70% 80% 60% 80% 60% 50% 40%
Violet sp. Violet spp. <5% <5%
3 Leaved False Solomons Seal Smilacina trifolia <5% <5% <5%
Willowherb sp. Epilobium spp. <1% <1%
Mud N/A 10% 5% 15% 20% 30% 40% 50%
Dead Grass N/A 30% 20% 10% 10%
Total # Standing Counts
% Cover
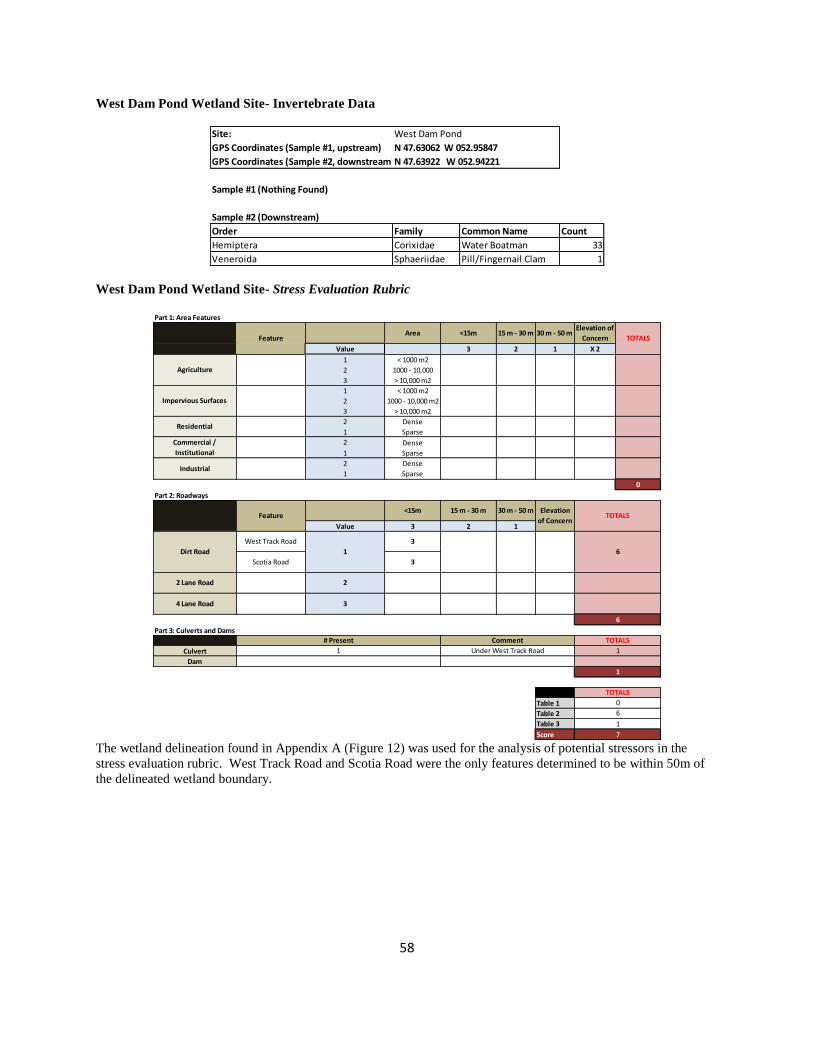
58
West Dam Pond Wetland Site- Invertebrate Data
Site: West Dam Pond
GPS Coordinates (Sample #1, upstream)
GPS Coordinates (Sample #2, downstream)
Sample #1 (Nothing Found)
Sample #2 (Downstream)
Order Family Common Name Count
Hemiptera Corixidae Water Boatman 33
Veneroida Sphaeriidae Pill/Fingernail Clam 1
N 47.63062 W 052.95847
N 47.63922 W 052.94221
West Dam Pond Wetland Site- Stress Evaluation Rubric
Value 3 2 1 X 2
1 < 1000 m2
2 1000 - 10,000
3 > 10,000 m2
1 < 1000 m2
2 1000 - 10,000 m2
3 > 10,000 m2
2 Dense
1 Sparse
2 Dense
1 Sparse
2 Dense
1 Sparse
0
Value 3 2 1
Culvert
Dam
Table 1
Table 2
Table 3
Score
Part 1: Area Features
FeatureArea 15 m - 30 m 30 m - 50 m
Elevation of
Concern TOTALS
Agriculture
<15m
Industrial
Impervious Surfaces
Residential
30 m - 50 m Elevation
of ConcernTOTALS
2 Lane Road 2
6
Part 3: Culverts and Dams
# Present Comment TOTALS
4 Lane Road 3
1
7
1 Under West Track Road 1
1
TOTALS
0
6
6
West Track Road
Scotia Road
3
3
Dirt Road 1
Part 2: Roadways
Feature<15m 15 m - 30 m
Commercial /
Institutional
The wetland delineation found in Appendix A (Figure 12) was used for the analysis of potential stressors in the
stress evaluation rubric. West Track Road and Scotia Road were the only features determined to be within 50m of
the delineated wetland boundary.
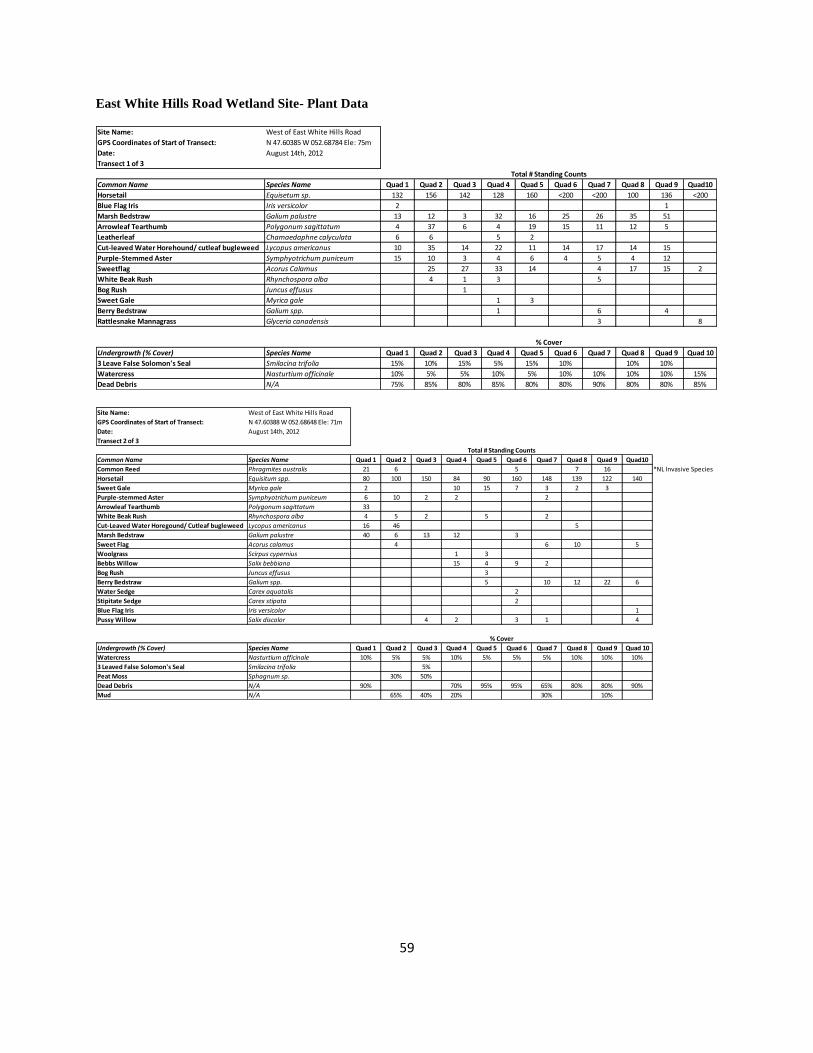
59
East White Hills Road Wetland Site- Plant Data
Site Name: West of East White Hills Road
GPS Coordinates of Start of Transect: N 47.60385 W 052.68784 Ele: 75m
Date: August 14th, 2012
Transect 1 of 3
Common Name Species Name Quad 1 Quad 2 Quad 3 Quad 4 Quad 5 Quad 6 Quad 7 Quad 8 Quad 9 Quad10
Horsetail Equisetum sp. 132 156 142 128 160 <200 <200 100 136 <200
Blue Flag Iris Iris versicolor 2 1
Marsh Bedstraw Galium palustre 13 12 3 32 16 25 26 35 51
Arrowleaf Tearthumb Polygonum sagittatum 4 37 6 4 19 15 11 12 5
Leatherleaf Chamaedaphne calyculata 6 6 5 2
Cut-leaved Water Horehound/ cutleaf bugleweed Lycopus americanus 10 35 14 22 11 14 17 14 15
Purple-Stemmed Aster Symphyotrichum puniceum 15 10 3 4 6 4 5 4 12
Sweetflag Acorus Calamus 25 27 33 14 4 17 15 2
White Beak Rush Rhynchospora alba 4 1 3 5
Bog Rush Juncus effusus 1
Sweet Gale Myrica gale 1 3
Berry Bedstraw Galium spp. 1 6 4
Rattlesnake Mannagrass Glyceria canadensis 3 8
Undergrowth (% Cover) Species Name Quad 1 Quad 2 Quad 3 Quad 4 Quad 5 Quad 6 Quad 7 Quad 8 Quad 9 Quad 10
3 Leave False Solomon's Seal Smilacina trifolia 15% 10% 15% 5% 15% 10% 10% 10%
Watercress Nasturtium officinale 10% 5% 5% 10% 5% 10% 10% 10% 10% 15%
Dead Debris N/A 75% 85% 80% 85% 80% 80% 90% 80% 80% 85%
Total # Standing Counts
% Cover
Site Name: West of East White Hills Road
GPS Coordinates of Start of Transect: N 47.60388 W 052.68648 Ele: 71m
Date: August 14th, 2012
Transect 2 of 3
Common Name Species Name Quad 1 Quad 2 Quad 3 Quad 4 Quad 5 Quad 6 Quad 7 Quad 8 Quad 9 Quad10
Common Reed Phragmites australis 21 6 5 7 16 *NL Invasive Species
Horsetail Equisitum spp. 80 100 150 84 90 160 148 139 122 140
Sweet Gale Myrica gale 2 10 15 7 3 2 3
Purple-stemmed Aster Symphyotrichum puniceum 6 10 2 2 2
Arrowleaf Tearthumb Polygonum sagittatum 33
White Beak Rush Rhynchospora alba 4 5 2 5 2
Cut-Leaved Water Horegound/ Cutleaf bugleweed Lycopus americanus 16 46 5
Marsh Bedstraw Galium palustre 40 6 13 12 3
Sweet Flag Acorus calamus 4 6 10 5
Woolgrass Scirpus cypernius 1 3
Bebbs Willow Salix bebbiana 15 4 9 2
Bog Rush Juncus effusus 3
Berry Bedstraw Galium spp. 5 10 12 22 6
Water Sedge Carex aquatalis 2
Stipitate Sedge Carex stipata 2
Blue Flag Iris Iris versicolor 1
Pussy Willow Salix discolor 4 2 3 1 4
Undergrowth (% Cover) Species Name Quad 1 Quad 2 Quad 3 Quad 4 Quad 5 Quad 6 Quad 7 Quad 8 Quad 9 Quad 10
Watercress Nasturtium officinale 10% 5% 5% 10% 5% 5% 5% 10% 10% 10%
3 Leaved False Solomon's Seal Smilacina trifolia 5%
Peat Moss Sphagnum sp. 30% 50%
Dead Debris N/A 90% 70% 95% 95% 65% 80% 80% 90%
Mud N/A 65% 40% 20% 30% 10%
Total # Standing Counts
% Cover

60
Site Name: West of East White Hills Road
GPS Coordinates of Start of Transect: N 47.60514 W 052.68193 Ele: 77m
Date: August 16th, 2012
Transect 3 of 3
Common Name Species Name Quad 1 Quad 2 Quad 3 Quad 4 Quad 5 Quad 6 Quad 7 Quad 8 Quad 9 Quad10
Common Reed Phragmites australis 8 5 9 7 *NL Invasive Species
Goldenrod Solidago sp. 4 8 4
Water Sedge Carex aquatalis 1 3
Sweet Flag Acorus calamus 5 4 8 6
Cow Vetch Vicia cracca 1
Woolgrass Scirpus cyperinus 5 3 5
Goldenrod #2 Solidago spp. 2
Fireweed Epilobium angustifolium 2
Sweet Gale Myrica gale 10 3 1 4 3
Puple-stemmed Aster Symphyotrichum puniceum 2 2
Bog Rush Juncus effusus 21
Rattlesnake Mannagrass Glyceria Canadensis 1
White Beak rush Rhynchospora alba 1
Nodding Sedge Carex gynandra 18 14 23 20 38
Berry Bedstraw Galium spp. 4
Blue Flag Iris Iris versicolor 2
Undergrowth (% Cover) Species Name Quad 1 Quad 2 Quad 3 Quad 4 Quad 5 Quad 6 Quad 7 Quad 8 Quad 9 Quad 10
Beachgrass (leaves) Ammophila briviligulata 70% 60% 50% 50% 50% 40% 60% 80% 60%
Marsh Bedstraw Galium palustre 10% 5% 10% 10% 10% 10%
Watercress Nasturtium officinale 10% 10% 10% 5%
Bog Buckbean Menyanthes trifoliata 60%
Dead Debris N/A 30% 30% 35% 30% 30% 40% 20% 10% 15%
Water N/A 20% 10% 10% 10% 40%
Total # Standing Counts
% Cover
East White Hills Road Wetland Site- Invertebrate Data
Site:
GPS Coordinates (Inflow)
Order Family Common Name Count
Odonata Anisoptera Dragonfly Nymph 43
Hirudinae Leech 1
Coleoptera Noteridae Diving Beetles 7
Odonata Zygoptera Damselfly Nymph 2
Odonata Lestidae Damselfly Nymph 1
Amphipoda Scud 18
West of East White Hills Road
N 47.60353 W052.68769
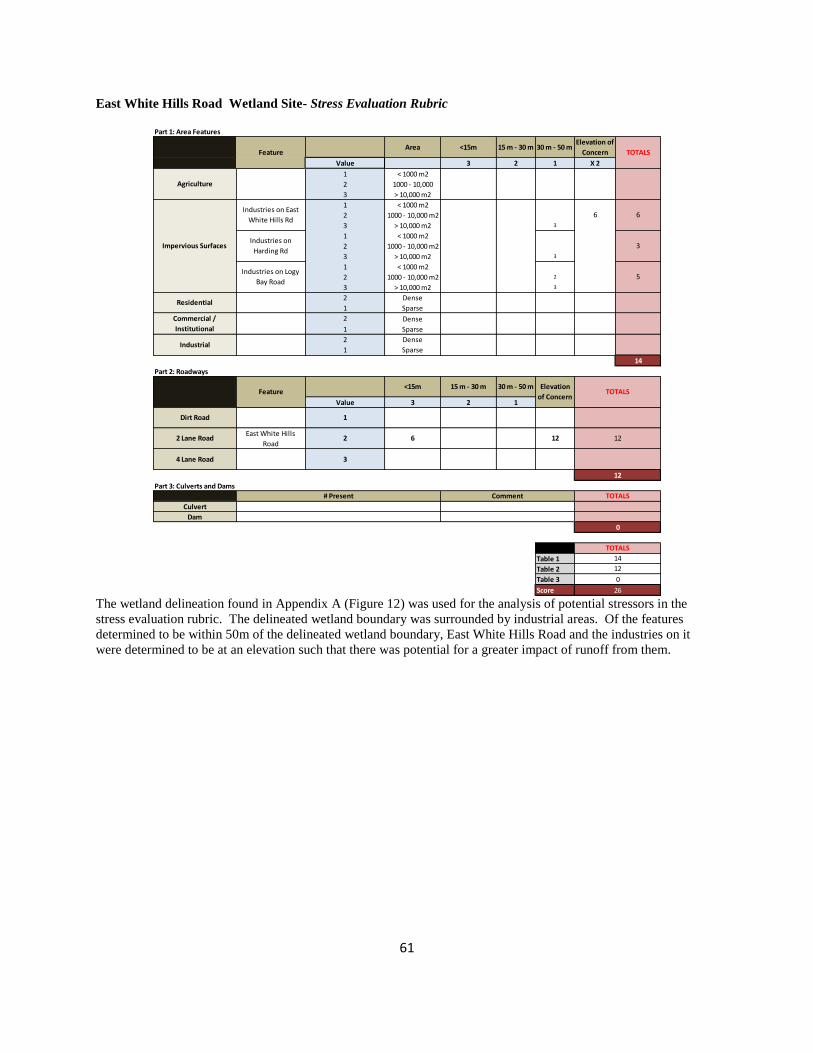
61
East White Hills Road Wetland Site- Stress Evaluation Rubric
Value 3 2 1 X 2
1 < 1000 m2
2 1000 - 10,000
3 > 10,000 m2
1 < 1000 m2
2 1000 - 10,000 m2
3 > 10,000 m2 3
1 < 1000 m2
2 1000 - 10,000 m2
3 > 10,000 m2 3
1 < 1000 m2
2 1000 - 10,000 m2 2
3 > 10,000 m2 3
2 Dense
1 Sparse
2 Dense
1 Sparse
2 Dense
1 Sparse
14
Value 3 2 1
Culvert
Dam
Table 1
Table 2
Table 3
Score
Part 2: Roadways
Commercial /
Institutional
# Present
1262 Lane Road 2
0
TOTALS
14
12
0
26
12East White Hills
Road
Comment TOTALS
4 Lane Road 3
12
Part 3: Culverts and Dams
TOTALS
Dirt Road 1
Feature<15m 15 m - 30 m 30 m - 50 m Elevation
of Concern
Industrial
6
Residential
3
Industries on Logy
Bay Road5
Impervious SurfacesIndustries on
Harding Rd
6
Part 1: Area Features
FeatureArea 15 m - 30 m 30 m - 50 m
Elevation of
Concern TOTALS
Agriculture
<15m
Industries on East
White Hills Rd
The wetland delineation found in Appendix A (Figure 12) was used for the analysis of potential stressors in the
stress evaluation rubric. The delineated wetland boundary was surrounded by industrial areas. Of the features
determined to be within 50m of the delineated wetland boundary, East White Hills Road and the industries on it
were determined to be at an elevation such that there was potential for a greater impact of runoff from them.