Embed Size (px)
Citation preview
NORTH YORKSHIRE COUNTY COUNCIL
EXECUTIVE
22 February 2011
QUARTERLY PERFORMANCE AND BUDGET MONITORING REPORT
Joint Report of the Chief Executive and Corporate Director – Finance and Central Services
1.0 Purpose of Report 1.1 To bring together performance, personnel and financial information for
the third quarter of 2010/11 within the Performance Management and Improvement Framework.
2.0 Contents 3.0 Background 4.0 Performance
Annex A Top Level Performance Indicator Results 5.0 Citizens’ Panel
6.0 Human Resources Performance Data
Annex B Performance Framework 2010/11 – Qtr 3
7.0 Revenue 2010-11 Annex C Revenue Budget Appendices
8.0 Capital Expenditure and Financing
Annex D Capital Plan Appendices 9.0 Budget Savings
Annex E 10.0 Annual Treasury Management Annex F 11.0 Legal Implications 12.0 Consultation and Responses 13.0 Conclusions and Recommendations
E/2011/25
3.0 Background 3.1 The Council plan sets out the priorities that have been set to achieve the
County Council’s corporate objectives. Quarterly monitoring reports track progress and provide the information needed to adjust priorities or investment and spending plans.
4.0 Performance
Last October the Secretary of State for Communities and Local Government announced the ending of the National Indicator Set and central control over LAA targets. He announced that the Government would establish a single list of all data that central government asks of local government. Work on developing the single list is under way and the Government intends that the list will take effect from April 2011 and be reviewed annually thereafter.
4.1 In November the Government announced the abolition of the Care Quality Commission’s annual score for adult social care and the current annual performance assessment system. The Department of Health is consulting on a new sector-led performance assessment system which it intends to introduce in 2001/12. The Government has also announced that Ofsted’s annual assessment of children’s services will end as soon as a suitable legislative opportunity can be identified, although it will still be in place for 2011, and possibly 2012.
4.3 Since the last quarterly report the annual assessment of Adult Social Care
by CQC has been announced with the award of an overall grade of ‘excellent’ and a detailed report on this was presented to the Executive on 1 February 2011. Ofsted’s annual judgement on children’s services was announced in December, with an overall grade of ‘Performing Well’ and the very large majority of services, settings and institutions judged to be good or excellent. The Youth Justice Service has been inspected by HM Inspectorate of Probation and the report published in January 2011 noted the county’s work with young offenders as well above average in the three key areas and overall judged to be a ‘very creditable set of findings’.
4.4 While this report highlights particular areas of improved performance and
potential concern this is in the context of the County Council’s services being rated by external inspection as performing well or excellently. This is achieved thanks to the many services that consistently deliver excellent performance through sustained focus and effort over time.
4.5 In preparing this quarterly report a range of performance data relating to
each service area has been monitored as well as the Key Performance Indicators presented in Annex A. The annex shows target achievement, a comparison against the previous reporting period and where available the quartile position compared to all county councils. The information needs to be considered in the round – for example a decline in performance between quarters may not be a cause for concern if the indicator is still on or above target.
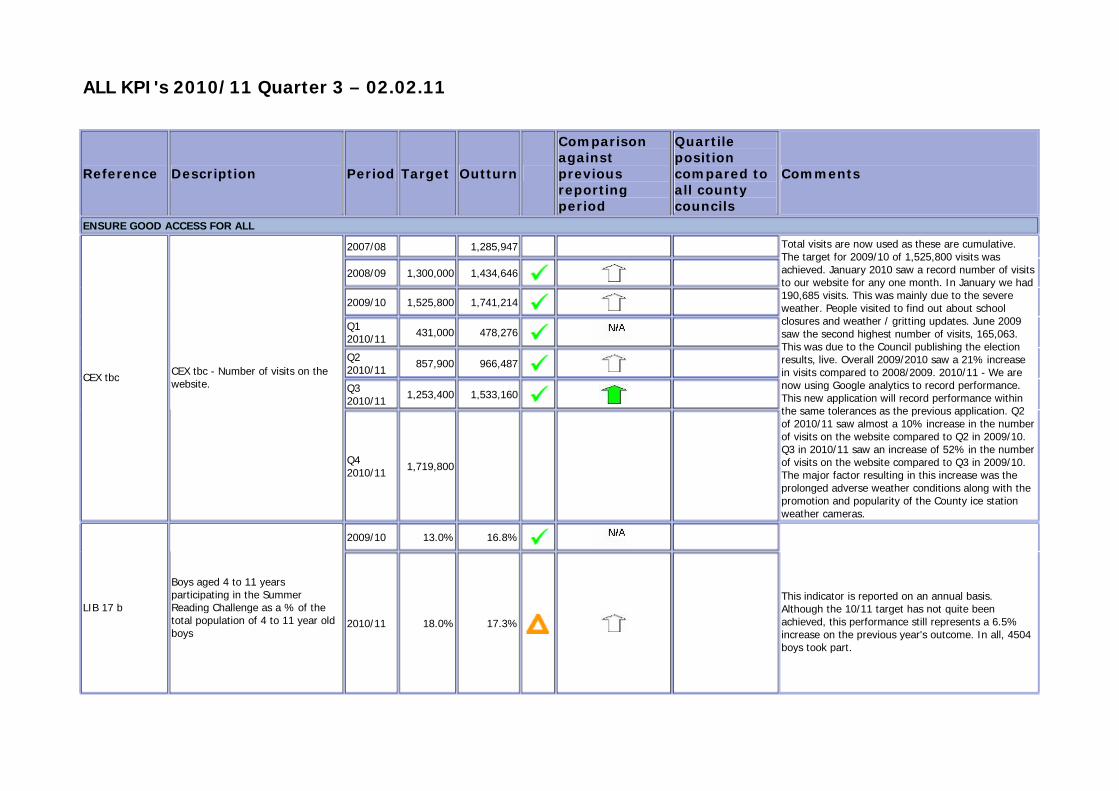
4.6 Particular areas of improved performance to note are: a. The number of visits to the website is well ahead of target with 1.5
million visits so far this year. A major factor in the Q3 performance was use of the website to access information during the bad weather and the promotion and popularity of the ice station weather cameras.
b. The number of people receiving an ‘At Home’ library service has
continued to rise and is ahead of target. c. The number of adult social care clients receiving Self Directed Support
has risen significantly, building on good performance last year, and is ahead of target.
d. The number of people killed or seriously injured in road traffic accidents
continues to reduce with the Q3 outturn of 366 keeping ahead of the target for the quarter of 467.
4.7 Areas of potential concern noted in the last report to the Executive were:
a. SEN final statements issued within 26 weeks (excluding exceptions) has dropped back slightly to 95.4% in Q3 but this is still more than 10% above last year’s performance.
b. The upward trend in number of moves of placements experienced by
looked after children last year has been reversed and the Q3 figure has maintained the improvement.
4.8 Recommendation
(a) Note performance in the third quarter.
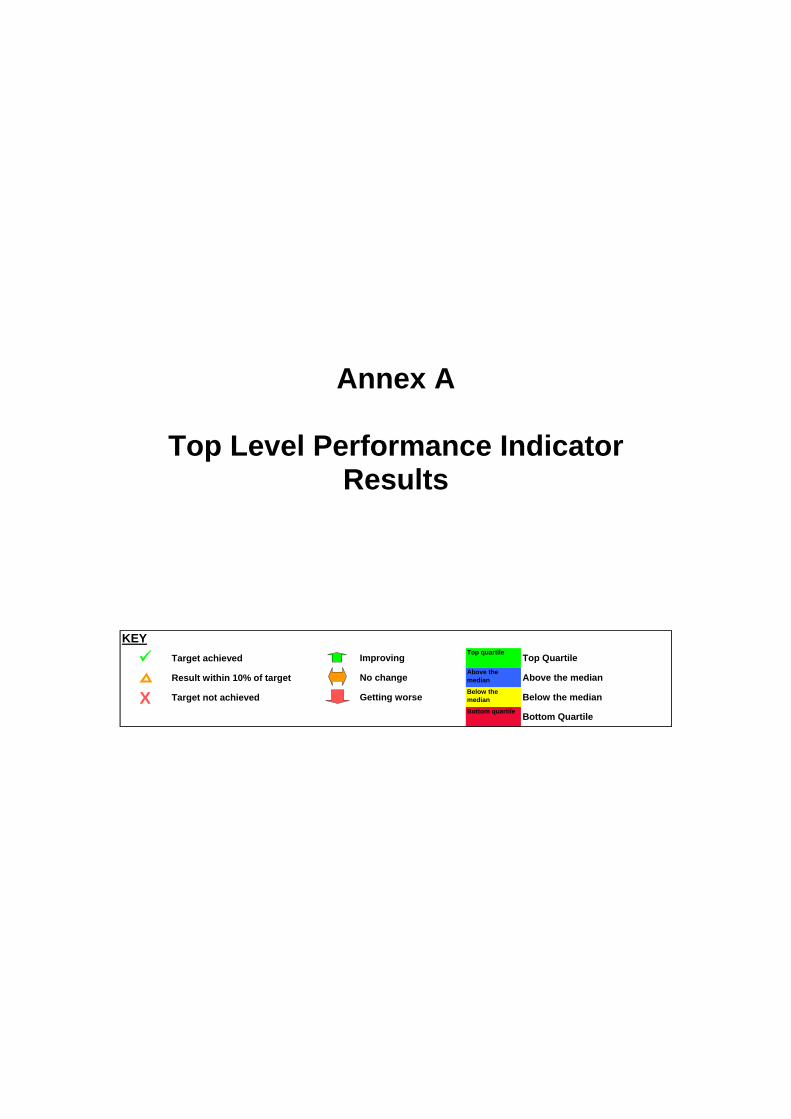
Annex A
Top Level Performance Indicator Results
KEYTarget achieved
Top quartile
Result within 10% of target Above the median
X Target not achievedBelow the median
Bottom quartile
Above the median
Below the median
Bottom Quartile
Improving
No change
Getting worse
Top Quartile
ALL KPI's 2010/11 Quarter 3 – 02.02.11
Reference Description Period Target Outturn
Comparison against previous reporting period
Quartile position compared to all county councils
Comments
ENSURE GOOD ACCESS FOR ALL
2007/08 1,285,947 2008/09 1,300,000 1,434,646 2009/10 1,525,800 1,741,214 Q1 2010/11 431,000 478,276 Q2 2010/11 857,900 966,487 Q3 2010/11 1,253,400 1,533,160
CEX tbc CEX tbc - Number of visits on the website.
Q4 2010/11 1,719,800
Total visits are now used as these are cumulative. The target for 2009/10 of 1,525,800 visits was achieved. January 2010 saw a record number of visits to our website for any one month. In January we had 190,685 visits. This was mainly due to the severe weather. People visited to find out about school closures and weather / gritting updates. June 2009 saw the second highest number of visits, 165,063. This was due to the Council publishing the election results, live. Overall 2009/2010 saw a 21% increase in visits compared to 2008/2009. 2010/11 - We are now using Google analytics to record performance. This new application will record performance within the same tolerances as the previous application. Q2 of 2010/11 saw almost a 10% increase in the number of visits on the website compared to Q2 in 2009/10. Q3 in 2010/11 saw an increase of 52% in the number of visits on the website compared to Q3 in 2009/10. The major factor resulting in this increase was the prolonged adverse weather conditions along with the promotion and popularity of the County ice station weather cameras.
2009/10 13.0% 16.8%
LIB 17 b
Boys aged 4 to 11 years participating in the Summer Reading Challenge as a % of the total population of 4 to 11 year old boys
2010/11 18.0% 17.3%
This indicator is reported on an annual basis. Although the 10/11 target has not quite been achieved, this performance still represents a 6.5% increase on the previous year's outcome. In all, 4504 boys took part.
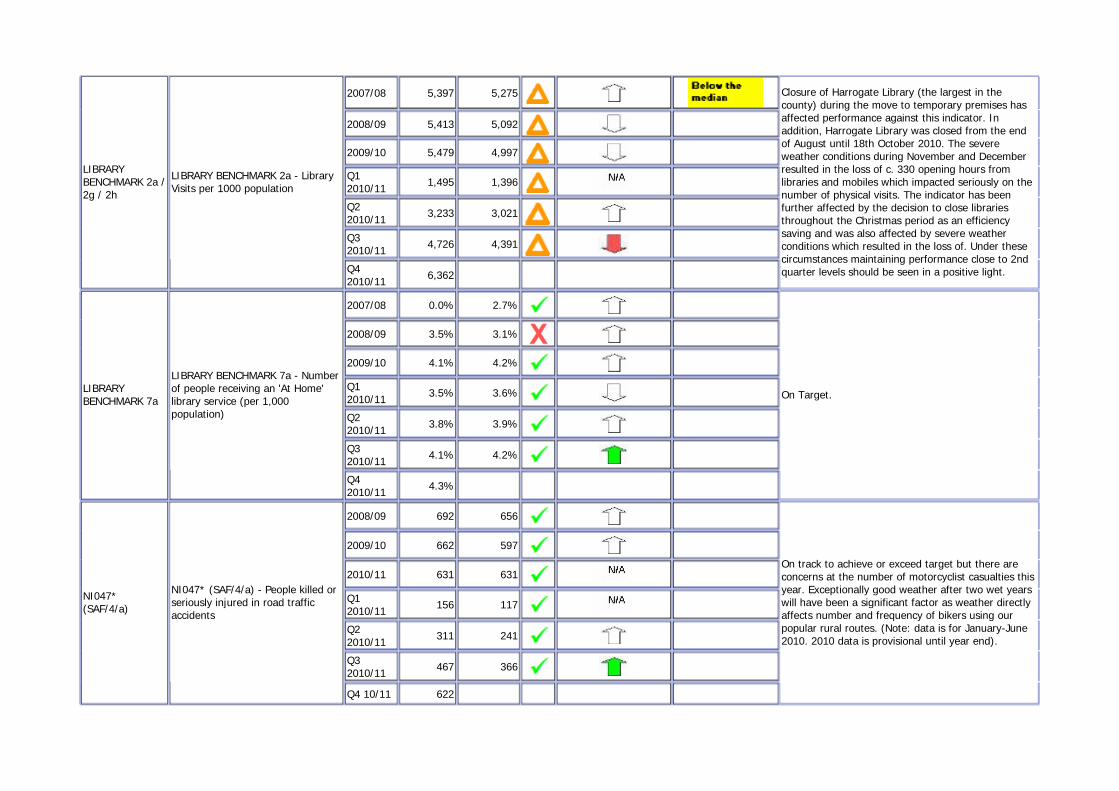
2007/08 5,397 5,275 2008/09 5,413 5,092 2009/10 5,479 4,997 Q1 2010/11 1,495 1,396 Q2 2010/11 3,233 3,021 Q3 2010/11 4,726 4,391
LIBRARY BENCHMARK 2a / 2g / 2h
LIBRARY BENCHMARK 2a - Library Visits per 1000 population
Q4 2010/11 6,362
Closure of Harrogate Library (the largest in the county) during the move to temporary premises has affected performance against this indicator. In addition, Harrogate Library was closed from the end of August until 18th October 2010. The severe weather conditions during November and December resulted in the loss of c. 330 opening hours from libraries and mobiles which impacted seriously on the number of physical visits. The indicator has been further affected by the decision to close libraries throughout the Christmas period as an efficiency saving and was also affected by severe weather conditions which resulted in the loss of. Under these circumstances maintaining performance close to 2nd quarter levels should be seen in a positive light.
2007/08 0.0% 2.7% 2008/09 3.5% 3.1% 2009/10 4.1% 4.2% Q1 2010/11 3.5% 3.6% Q2 2010/11 3.8% 3.9% Q3 2010/11 4.1% 4.2%
LIBRARY BENCHMARK 7a
LIBRARY BENCHMARK 7a - Number of people receiving an 'At Home' library service (per 1,000 population)
Q4 2010/11 4.3%
On Target.
2008/09 692 656 2009/10 662 597 2010/11 631 631 Q1 2010/11 156 117 Q2 2010/11 311 241 Q3 2010/11 467 366
NI047* (SAF/4/a)
NI047* (SAF/4/a) - People killed or seriously injured in road traffic accidents
Q4 10/11 622
On track to achieve or exceed target but there are concerns at the number of motorcyclist casualties this year. Exceptionally good weather after two wet years will have been a significant factor as weather directly affects number and frequency of bikers using our popular rural routes. (Note: data is for January-June 2010. 2010 data is provisional until year end).
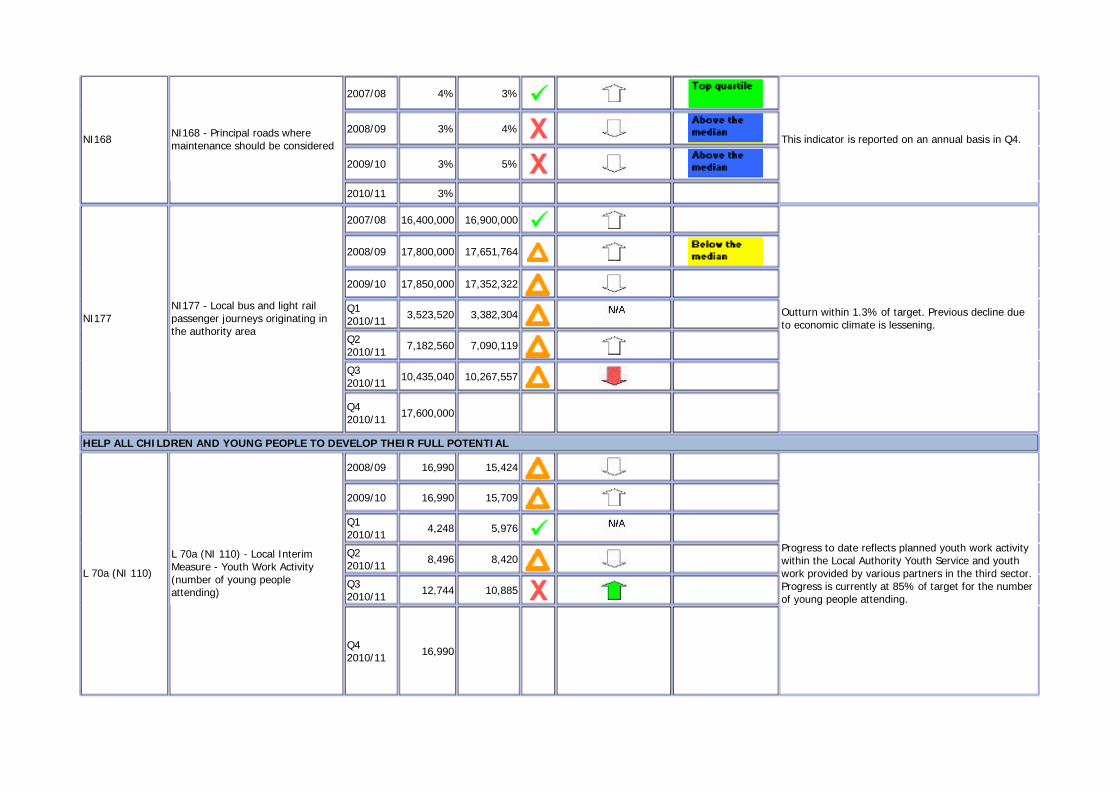
2007/08 4% 3% 2008/09 3% 4% 2009/10 3% 5%
NI168 NI168 - Principal roads where maintenance should be considered
2010/11 3%
This indicator is reported on an annual basis in Q4.
2007/08 16,400,000 16,900,000
2008/09 17,800,000 17,651,764 2009/10 17,850,000 17,352,322 Q1 2010/11 3,523,520 3,382,304 Q2 2010/11 7,182,560 7,090,119 Q3 2010/11 10,435,040 10,267,557
NI177 NI177 - Local bus and light rail passenger journeys originating in the authority area
Q4 2010/11 17,600,000
Outturn within 1.3% of target. Previous decline due to economic climate is lessening.
HELP ALL CHILDREN AND YOUNG PEOPLE TO DEVELOP THEIR FULL POTENTIAL
2008/09 16,990 15,424 2009/10 16,990 15,709 Q1 2010/11 4,248 5,976 Q2 2010/11 8,496 8,420 Q3 2010/11 12,744 10,885
L 70a (NI 110)
L 70a (NI 110) - Local Interim Measure - Youth Work Activity (number of young people attending)
Q4 2010/11 16,990
Progress to date reflects planned youth work activity within the Local Authority Youth Service and youth work provided by various partners in the third sector. Progress is currently at 85% of target for the number of young people attending.
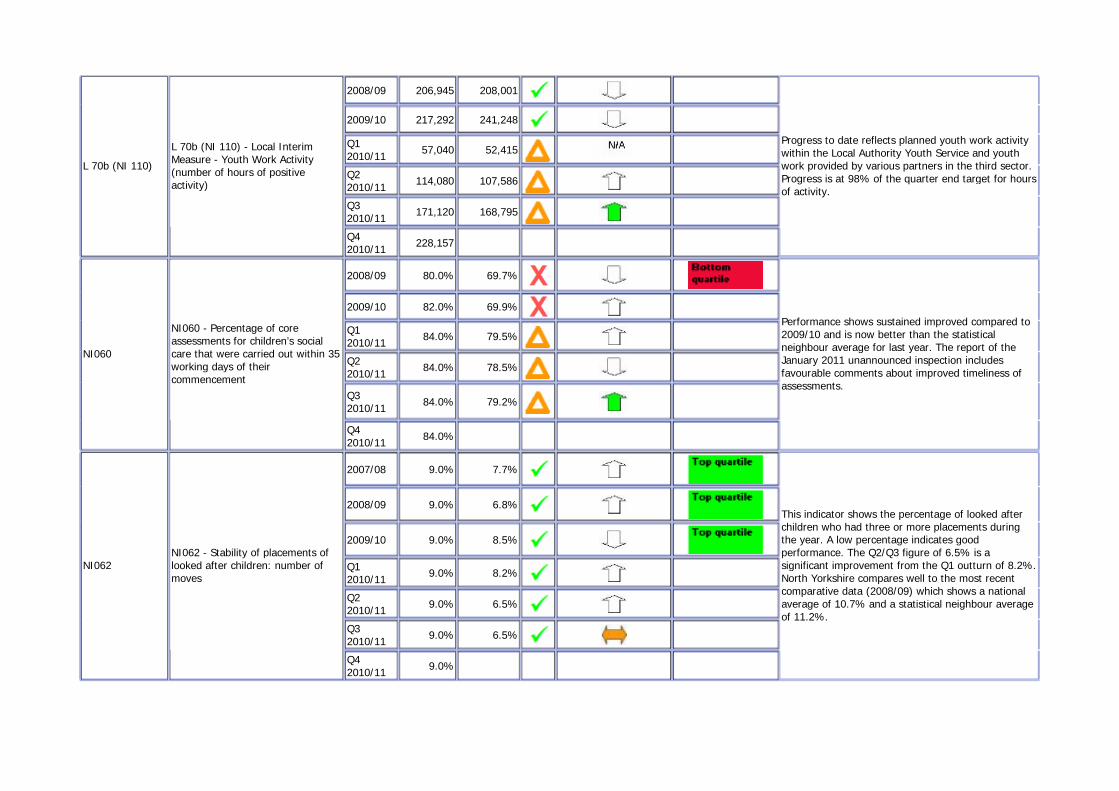
2008/09 206,945 208,001 2009/10 217,292 241,248 Q1 2010/11 57,040 52,415 Q2 2010/11 114,080 107,586 Q3 2010/11 171,120 168,795
L 70b (NI 110)
L 70b (NI 110) - Local Interim Measure - Youth Work Activity (number of hours of positive activity)
Q4 2010/11 228,157
Progress to date reflects planned youth work activity within the Local Authority Youth Service and youth work provided by various partners in the third sector. Progress is at 98% of the quarter end target for hours of activity.
2008/09 80.0% 69.7% 2009/10 82.0% 69.9% Q1 2010/11 84.0% 79.5% Q2 2010/11 84.0% 78.5% Q3 2010/11 84.0% 79.2%
NI060
NI060 - Percentage of core assessments for children’s social care that were carried out within 35 working days of their commencement
Q4 2010/11 84.0%
Performance shows sustained improved compared to 2009/10 and is now better than the statistical neighbour average for last year. The report of the January 2011 unannounced inspection includes favourable comments about improved timeliness of assessments.
2007/08 9.0% 7.7% 2008/09 9.0% 6.8% 2009/10 9.0% 8.5% Q1 2010/11 9.0% 8.2% Q2 2010/11 9.0% 6.5% Q3 2010/11 9.0% 6.5%
NI062 NI062 - Stability of placements of looked after children: number of moves
Q4 2010/11 9.0%
This indicator shows the percentage of looked after children who had three or more placements during the year. A low percentage indicates good performance. The Q2/Q3 figure of 6.5% is a significant improvement from the Q1 outturn of 8.2%. North Yorkshire compares well to the most recent comparative data (2008/09) which shows a national average of 10.7% and a statistical neighbour average of 11.2%.
2007/08 100.0% 100.0% 2008/09 100.0% 100.0% 2009/10 100.0% 99.0% Q1 2010/11 100.0% 100.0% Q2 2010/11 100.0% 100.0% Q3 2010/11 100.0% 100.0%
NI067 NI067 - Percentage of child protection cases which were reviewed within required timescales
Q4 2010/11 100.0%
On Target.
2007/08 0.00% 54.20% 2008/09 61.10% 54.70% 2009/10 62.40% 58.50%
NI075 NI075 - 5 or more A-C at GCSE (or equivalent) including English & Maths
2010/11 61.60%
Performance data from exam results is reported annually. 2010/11 figure is UNVALIDATED by DfE.
2008/09 87.6% 2009/10 84.6% Q1 2010/11 92.9% Q2 2010/11 96.8% Q3 2010/11 95.4%
NI103 NI103 - Special Educational Needs - statements issued within 26 weeks
Q4 2010/11
The Q3 figure demonstrates a sustained improvement on the 2009/10 outturn.
2007/08 4.4% 3.8%
2008/09 4.1% 4.8% 2009/10 3.6% 4.5% Q1 2010/11 3.3% 4.2% Q2 2010/11 3.3% 5.3% Q3 2010/11 3.3% 4.3%
NI117* (CYP/7/a)
NI117* (CYP/7/a) - The percentage of 16 to 18 year olds who are not in education, employment or training (NEET).
Q4 2010/11 3.3%
Target, set 3 years prior, is unrealistic due to present climate. Data accuracy has continued to improve since 2009-10. Currently showing as second in comparison with statistical neighbours. Data available quarterly but can be miss-leading as the annual target comes from the average for the 3 months Nov/Dec/Jan when the cohort is most settled and representative of the real situation, (i.e. it is always high in the Summer through to November due to school leavers settling into their post 16 destination).
HELP PEOPLE LIVE IN SAFE COMMUNITIES
2008/09 1.20 1.38 2009/10 1.10 1.13 Q1 2010/11 0.27 0.21 Q2 2010/11 0.54 0.58 Q3 2010/11 0.81
NI019 NI019 - Rate of proven re-offending by young offenders
Q4 2010/11 1.06
Reporting is one quarter behind. Baseline = Jan-Mar 05 cohort. 374 young people in the cohort, with 140 re-offending (37.4%) with a total of 452 further offences (an average of 1.21 further offences per member of the cohort). The rate of re-offending was significantly reduced in the final quarter of 2009/10, leading to at 1.13 a better 2009/10 outturn than anticipated. The 2010/11 Q2 offending figures are not due to be finalised and submitted to the Youth Justice Board (YJB) until 31.01.11. The unfinalised position at 2010/11 Q2 is an average number of offences per cohort member of 0.58.
IMPROVE HEALTH AND WELLBEING AND GIVE PEOPLE EFFECTIVE SUPPORT
2007/08 32.0% 40.2% 2008/09 35.0% 40.9% 2009/10 40.0% 45.7%
ACS 2 ACS 2 - The percentage of people receiving intensive support who are helped to live at home.
2010/11 45.0%
ACS has continued to perform well in this indicator as a result of a continuous drive to reduce residential placements and wherever possible support people in their own home or through community based services.
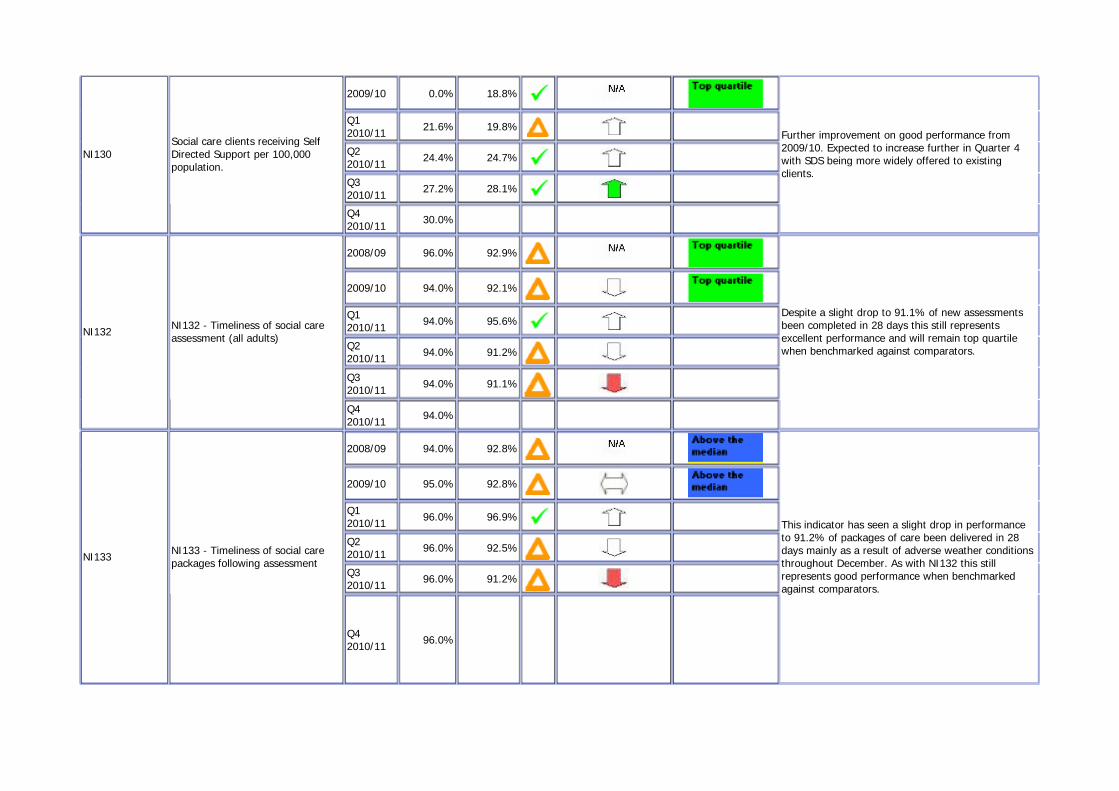
2009/10 0.0% 18.8% Q1 2010/11 21.6% 19.8% Q2 2010/11 24.4% 24.7% Q3 2010/11 27.2% 28.1%
NI130 Social care clients receiving Self Directed Support per 100,000 population.
Q4 2010/11 30.0%
Further improvement on good performance from 2009/10. Expected to increase further in Quarter 4 with SDS being more widely offered to existing clients.
2008/09 96.0% 92.9% 2009/10 94.0% 92.1% Q1 2010/11 94.0% 95.6% Q2 2010/11 94.0% 91.2% Q3 2010/11 94.0% 91.1%
NI132 NI132 - Timeliness of social care assessment (all adults)
Q4 2010/11 94.0%
Despite a slight drop to 91.1% of new assessments been completed in 28 days this still represents excellent performance and will remain top quartile when benchmarked against comparators.
2008/09 94.0% 92.8% 2009/10 95.0% 92.8% Q1 2010/11 96.0% 96.9% Q2 2010/11 96.0% 92.5% Q3 2010/11 96.0% 91.2%
NI133 NI133 - Timeliness of social care packages following assessment
Q4 2010/11 96.0%
This indicator has seen a slight drop in performance to 91.2% of packages of care been delivered in 28 days mainly as a result of adverse weather conditions throughout December. As with NI132 this still represents good performance when benchmarked against comparators.
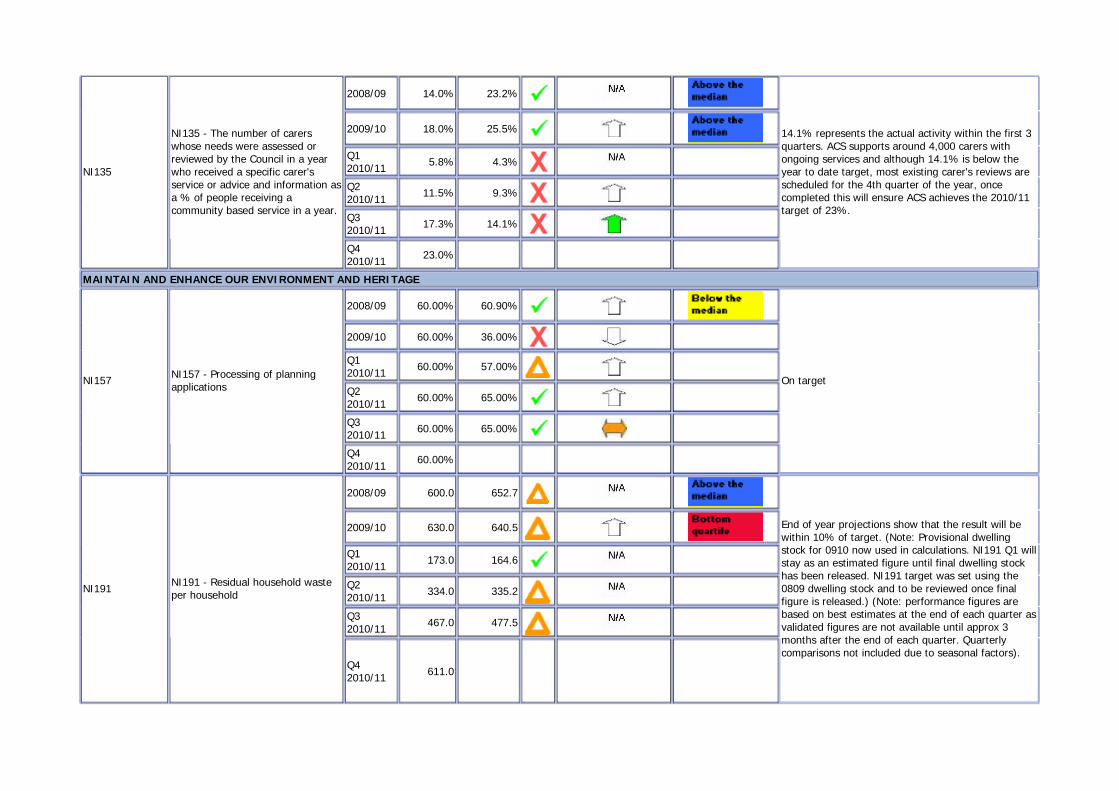
2008/09 14.0% 23.2% 2009/10 18.0% 25.5% Q1 2010/11 5.8% 4.3% Q2 2010/11 11.5% 9.3% Q3 2010/11 17.3% 14.1%
NI135
NI135 - The number of carers whose needs were assessed or reviewed by the Council in a year who received a specific carer's service or advice and information as a % of people receiving a community based service in a year.
Q4 2010/11 23.0%
14.1% represents the actual activity within the first 3 quarters. ACS supports around 4,000 carers with ongoing services and although 14.1% is below the year to date target, most existing carer's reviews are scheduled for the 4th quarter of the year, once completed this will ensure ACS achieves the 2010/11 target of 23%.
MAINTAIN AND ENHANCE OUR ENVIRONMENT AND HERITAGE
2008/09 60.00% 60.90% 2009/10 60.00% 36.00% Q1 2010/11 60.00% 57.00% Q2 2010/11 60.00% 65.00% Q3 2010/11 60.00% 65.00%
NI157 NI157 - Processing of planning applications
Q4 2010/11 60.00%
On target
2008/09 600.0 652.7 2009/10 630.0 640.5 Q1 2010/11 173.0 164.6 Q2 2010/11 334.0 335.2 Q3 2010/11 467.0 477.5
NI191 NI191 - Residual household waste per household
Q4 2010/11 611.0
End of year projections show that the result will be within 10% of target. (Note: Provisional dwelling stock for 0910 now used in calculations. NI191 Q1 will stay as an estimated figure until final dwelling stock has been released. NI191 target was set using the 0809 dwelling stock and to be reviewed once final figure is released.) (Note: performance figures are based on best estimates at the end of each quarter as validated figures are not available until approx 3 months after the end of each quarter. Quarterly comparisons not included due to seasonal factors).
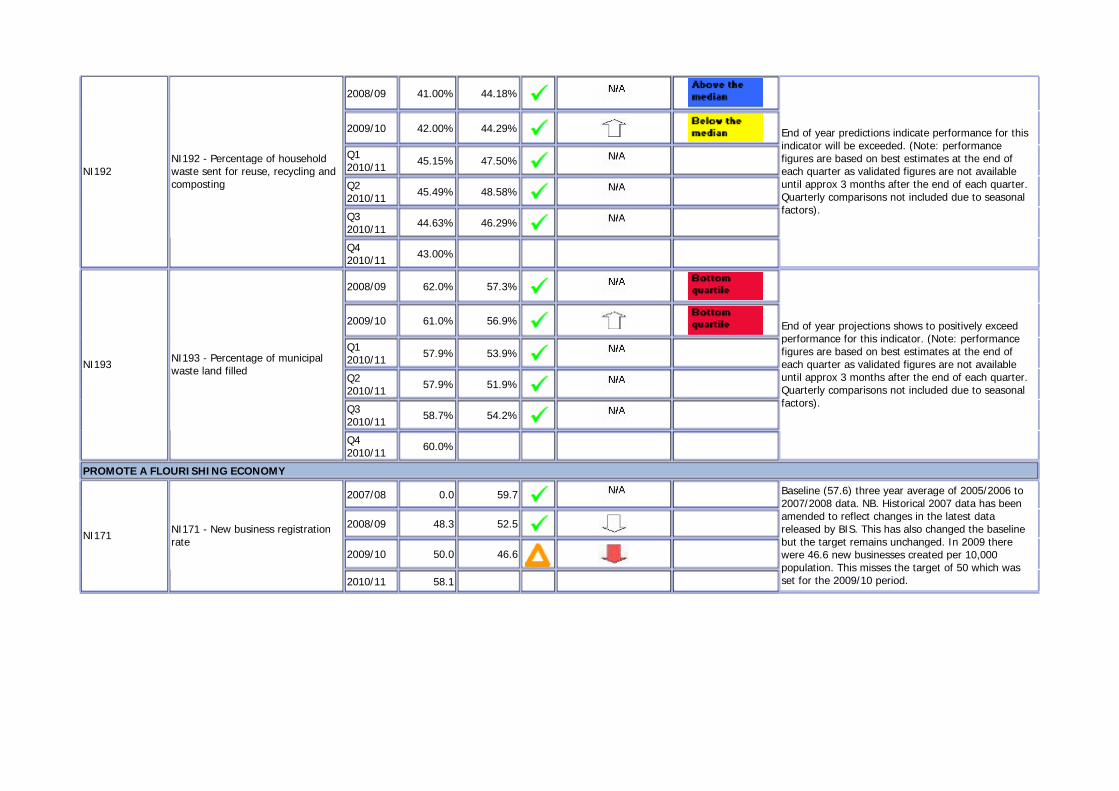
2008/09 41.00% 44.18% 2009/10 42.00% 44.29% Q1 2010/11 45.15% 47.50% Q2 2010/11 45.49% 48.58% Q3 2010/11 44.63% 46.29%
NI192 NI192 - Percentage of household waste sent for reuse, recycling and composting
Q4 2010/11 43.00%
End of year predictions indicate performance for this indicator will be exceeded. (Note: performance figures are based on best estimates at the end of each quarter as validated figures are not available until approx 3 months after the end of each quarter. Quarterly comparisons not included due to seasonal factors).
2008/09 62.0% 57.3% 2009/10 61.0% 56.9% Q1 2010/11 57.9% 53.9% Q2 2010/11 57.9% 51.9% Q3 2010/11 58.7% 54.2%
NI193 NI193 - Percentage of municipal waste land filled
Q4 2010/11 60.0%
End of year projections shows to positively exceed performance for this indicator. (Note: performance figures are based on best estimates at the end of each quarter as validated figures are not available until approx 3 months after the end of each quarter. Quarterly comparisons not included due to seasonal factors).
PROMOTE A FLOURISHING ECONOMY
2007/08 0.0 59.7 2008/09 48.3 52.5 2009/10 50.0 46.6
NI171 NI171 - New business registration rate
2010/11 58.1
Baseline (57.6) three year average of 2005/2006 to 2007/2008 data. NB. Historical 2007 data has been amended to reflect changes in the latest data released by BIS. This has also changed the baseline but the target remains unchanged. In 2009 there were 46.6 new businesses created per 10,000 population. This misses the target of 50 which was set for the 2009/10 period.

5.0 CITIZENS’ PANEL UPDATE 5.1 The current Citizens’ Panel was reviewed by the Corporate and
Partnerships Overview and Scrutiny Committee on 31st January 2011. A separate paper on the results of this review is on the agenda.
5.2 A number of topics have been proposed for the next survey including
awareness of adult safeguarding issues and services, minerals and waste planning and communication with the council. However, these will be reviewed as a result of the Scrutiny Committee recommendations.
5.3 RECOMMENDATION
To consider the separate paper on the scrutiny review of the Citizens’ Panel.
NYCC – Executive October 2010 Quarterly Monitoring Report/2
Performance Data Monitoring – Human Resources Quarter 3 – (October to December 2010)
6.0 INTRODUCTION 6.1 HR performance data is outlined in the attached Appendix and particular areas of interest
highlighted below. 6.2 Direction of performance is indicated using an upwards arrow for areas that have improved, a
sideways arrow where performance remains the same and a downwards arrow for areas that show a reduction in performance.
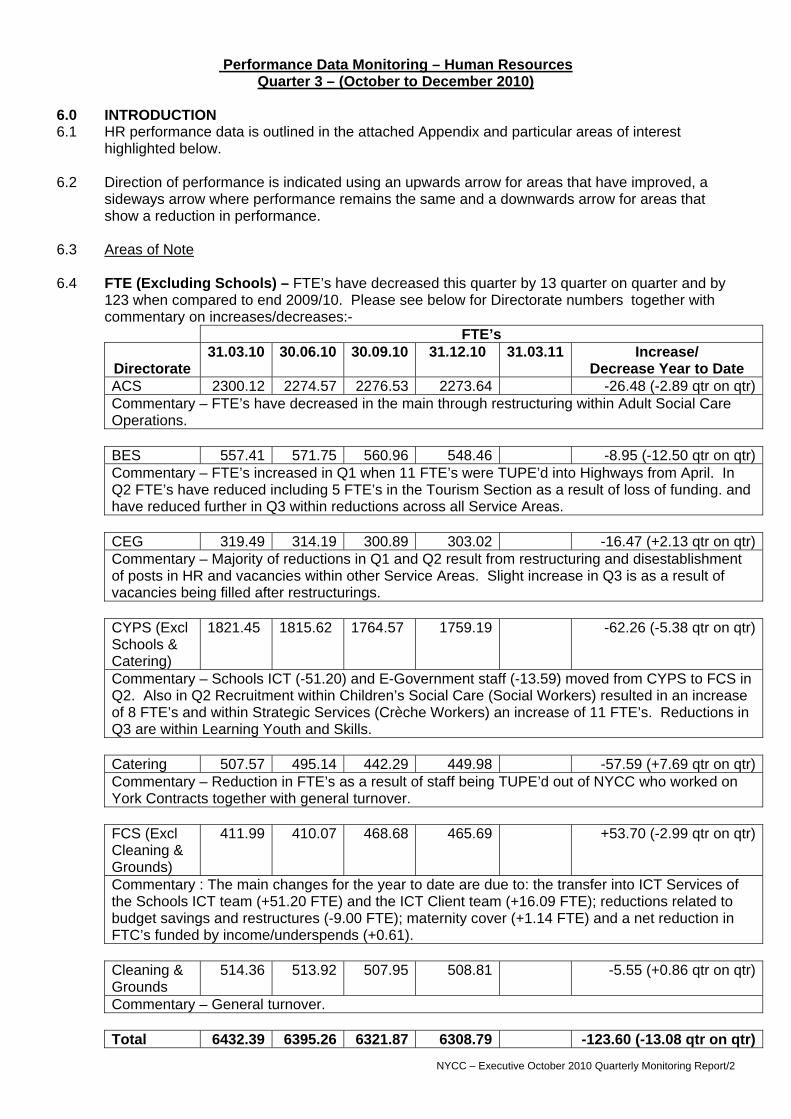
6.3 Areas of Note 6.4 FTE (Excluding Schools) – FTE’s have decreased this quarter by 13 quarter on quarter and by
123 when compared to end 2009/10. Please see below for Directorate numbers together with commentary on increases/decreases:-
FTE’s
Directorate 31.03.10 30.06.10 30.09.10 31.12.10 31.03.11 Increase/
Decrease Year to Date ACS 2300.12 2274.57 2276.53 2273.64 -26.48 (-2.89 qtr on qtr)Commentary – FTE’s have decreased in the main through restructuring within Adult Social Care Operations.
BES 557.41 571.75 560.96 548.46 -8.95 (-12.50 qtr on qtr)Commentary – FTE’s increased in Q1 when 11 FTE’s were TUPE’d into Highways from April. In Q2 FTE’s have reduced including 5 FTE’s in the Tourism Section as a result of loss of funding. and have reduced further in Q3 within reductions across all Service Areas.
CEG 319.49 314.19 300.89 303.02 -16.47 (+2.13 qtr on qtr)Commentary – Majority of reductions in Q1 and Q2 result from restructuring and disestablishment of posts in HR and vacancies within other Service Areas. Slight increase in Q3 is as a result of vacancies being filled after restructurings.
CYPS (Excl Schools & Catering)
1821.45 1815.62 1764.57 1759.19 -62.26 (-5.38 qtr on qtr)
Commentary – Schools ICT (-51.20) and E-Government staff (-13.59) moved from CYPS to FCS in Q2. Also in Q2 Recruitment within Children’s Social Care (Social Workers) resulted in an increase of 8 FTE’s and within Strategic Services (Crèche Workers) an increase of 11 FTE’s. Reductions in Q3 are within Learning Youth and Skills.
Catering 507.57 495.14 442.29 449.98 -57.59 (+7.69 qtr on qtr)Commentary – Reduction in FTE’s as a result of staff being TUPE’d out of NYCC who worked on York Contracts together with general turnover.
FCS (Excl Cleaning & Grounds)
411.99 410.07 468.68 465.69 +53.70 (-2.99 qtr on qtr)
Commentary : The main changes for the year to date are due to: the transfer into ICT Services of the Schools ICT team (+51.20 FTE) and the ICT Client team (+16.09 FTE); reductions related to budget savings and restructures (-9.00 FTE); maternity cover (+1.14 FTE) and a net reduction in FTC’s funded by income/underspends (+0.61).
Cleaning & Grounds
514.36 513.92 507.95 508.81 -5.55 (+0.86 qtr on qtr)
Commentary – General turnover.
Total 6432.39 6395.26 6321.87 6308.79 -123.60 (-13.08 qtr on qtr)
NYCC – Executive February 2010 Quarterly Monitoring Report/2
6.5 FTE’s are continuing to decrease slowly with more after 31st March 2011 as on-going restructurings across the Authority take effect in Quarter 4 and into 2011/12. 6.6 In addition to the above the following data illustrates changes taking place within the workforce in
response to savings requirements:-
• Vacancies – This quarter has seen a further rise in vacancies from 439 last quarter to 511 this quarter. This is expected as posts are held vacant as part of restructuring in order to maximise redeployment opportunities for staff under notice of redundancy and save budget.
• Leavers – Turnover has increased again this quarter compared to the same quarter last year
by 126 (full workforce). The projected turnover this year is 11.27% compared to 9.72% during 2009/10. A proportion of this relates to fixed term contracts expiring and not being renewed. Voluntary leavers (non-schools) have also increased this quarter when compared to the same quarter last year. The percentage of employees leaving with less than 12 months service has increased this quarter due to an increased volume of fixed term contracts of less than 12 months. Involuntary Leavers - The reported number of redundancies (non-schools workforce) this quarter is 11. The number of employees on redeployment (staff actively seeking alternative posts under notice of redundancy) is 56.
• Starters – The number has decreased again this quarter compared to the same quarter last
year with 199 reported this quarter compared to 279 last year. • Internal Movements – The quarter has seen an increase in internal movements due to
restructuring activity which will continue to increase. 6.7 Age Profile Full Workforce – The average age for the whole workforce has remained static for
this quarter but the average for the non-schools workforce has increased to 45.5. Workforce Aged Up to 25 – Non-Schools – This has remained static at 610 employees at the end of this quarter.
6.8 Attendance Management – Absence levels improved this quarter and the projected outturn is
now slightly lower than for 2009/10 (7.15 days compared to 7.21 days in 09/10). Absence levels for the same quarter last year were higher due to the swine flu pandemic and other winter viruses which do not appear to have had the same impact this quarter. Substantial numbers of staff are now affected by specific restructuring which historically tends to reduce absence.
6.9 Key Developments/Area for Expansion during Quarter 3 6.10 Removal of the Default Retirement Age (DRA) - From October 2011 the DRA will be removed which means that employers will no longer be able to rely on the DRA of age 65 to justify a dismissal for a compulsory retirement age, and will therefore be unable to issue new notifications of retirement using the DRA on or after 6.4.11. Employers have the option to retain a DRA, but must be able to objectively justify the reason for this as it may be open to challenge on discrimination grounds. Alternatively, employers can have no DRA. NYCC is currently considering how to respond to this legislation. 6.11 RECOMMENDATION 6.12 Executive is recommended to:
a) Note the performance within the report and the Appendix. Justine Brooksbank - Assistant Chief Executive – HR & OD – 26 January 2011 - JB/JML

Annex B Performance Framework
2010/11 – Qtr 3
Performance Report - 2010/11 AppendixPerformance Improvement Plans
2009
/201
0
Qua
rter
1
Qua
rter
2
Qua
rter
3
Qua
rter
4
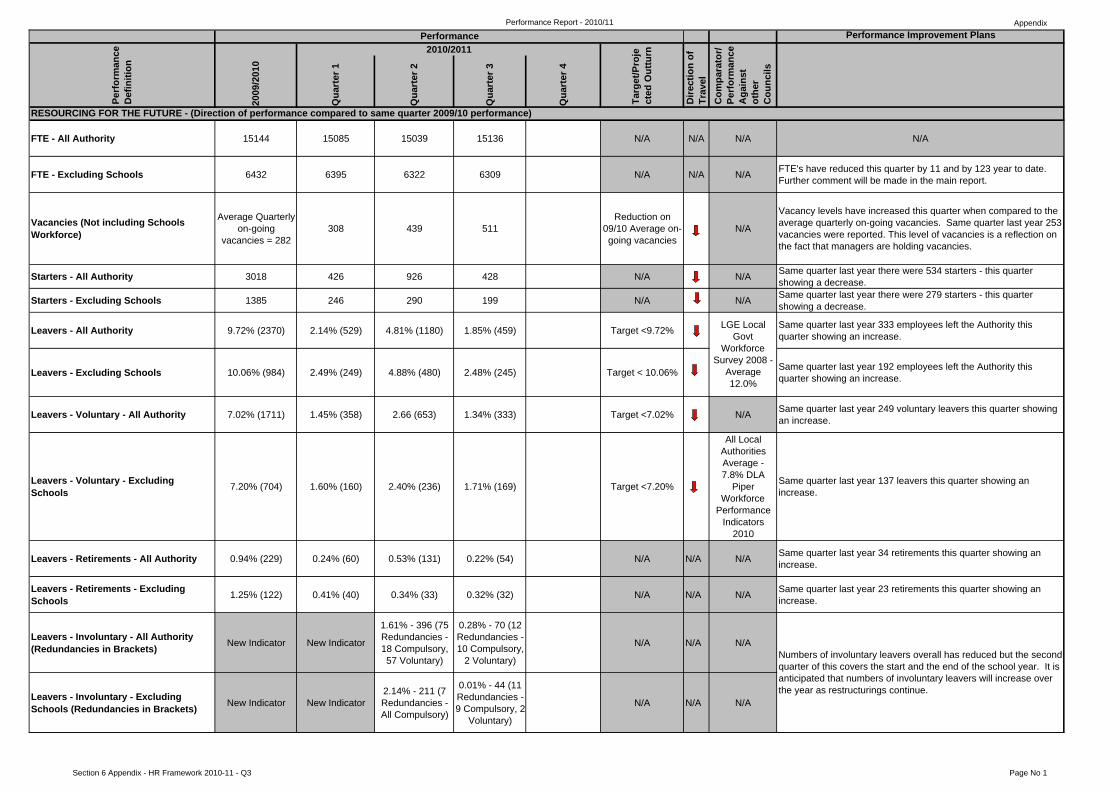
FTE - All Authority 15144 15085 15039 15136 N/A N/A N/A N/A
FTE - Excluding Schools 6432 6395 6322 6309 N/A N/A N/A FTE's have reduced this quarter by 11 and by 123 year to date. Further comment will be made in the main report.
Vacancies (Not including Schools Workforce)
Average Quarterly on-going
vacancies = 282308 439 511
Reduction on 09/10 Average on-going vacancies
N/A
Vacancy levels have increased this quarter when compared to the average quarterly on-going vacancies. Same quarter last year 253 vacancies were reported. This level of vacancies is a reflection on the fact that managers are holding vacancies.
Starters - All Authority 3018 426 926 428 N/A N/A Same quarter last year there were 534 starters - this quarter showing a decrease.
Starters - Excluding Schools 1385 246 290 199 N/A N/A Same quarter last year there were 279 starters - this quarter showing a decrease.
Leavers - All Authority 9.72% (2370) 2.14% (529) 4.81% (1180) 1.85% (459) Target <9.72% Same quarter last year 333 employees left the Authority this quarter showing an increase.
Leavers - Excluding Schools 10.06% (984) 2.49% (249) 4.88% (480) 2.48% (245) Target < 10.06% Same quarter last year 192 employees left the Authority this quarter showing an increase.
Leavers - Voluntary - All Authority 7.02% (1711) 1.45% (358) 2.66 (653) 1.34% (333) Target <7.02% N/A Same quarter last year 249 voluntary leavers this quarter showing an increase.
Leavers - Voluntary - Excluding Schools 7.20% (704) 1.60% (160) 2.40% (236) 1.71% (169) Target <7.20%
All Local Authorities Average - 7.8% DLA
Piper Workforce
Performance Indicators
2010
Same quarter last year 137 leavers this quarter showing an increase.
Leavers - Retirements - All Authority 0.94% (229) 0.24% (60) 0.53% (131) 0.22% (54) N/A N/A N/A Same quarter last year 34 retirements this quarter showing an increase.
Leavers - Retirements - Excluding Schools 1.25% (122) 0.41% (40) 0.34% (33) 0.32% (32) N/A N/A N/A Same quarter last year 23 retirements this quarter showing an
increase.
Leavers - Involuntary - All Authority (Redundancies in Brackets) New Indicator New Indicator
1.61% - 396 (75 Redundancies - 18 Compulsory, 57 Voluntary)
0.28% - 70 (12 Redundancies - 10 Compulsory,
2 Voluntary)
N/A N/A N/A
Leavers - Involuntary - Excluding Schools (Redundancies in Brackets) New Indicator New Indicator
2.14% - 211 (7 Redundancies - All Compulsory)
0.01% - 44 (11 Redundancies - 9 Compulsory, 2
Voluntary)
N/A N/A N/AD
irect
ion
of
Trav
el
LGE Local Govt
Workforce Survey 2008 -
Average 12.0%
RESOURCING FOR THE FUTURE - (Direction of performance compared to same quarter 2009/10 performance)
Numbers of involuntary leavers overall has reduced but the second quarter of this covers the start and the end of the school year. It is anticipated that numbers of involuntary leavers will increase over the year as restructurings continue.
Performance
Targ
et/P
roje
cted
Out
turn2010/2011
Perf
orm
ance
D
efin
ition
Com
para
tor/
Perf
orm
ance
A
gain
st
othe
r C
ounc
ilsSection 6 Appendix - HR Framework 2010-11 - Q3 Page No 1
Performance Report - 2010/11 AppendixPerformance Improvement Plans
2009
/201
0
Qua
rter
1
Qua
rter
2
Qua
rter
3
Qua
rter
4
Dire
ctio
n of
Tr
avel
Performance
Targ
et/P
roje
cted
Out
turn2010/2011
Perf
orm
ance
D
efin
ition
Com
para
tor/
Perf
orm
ance
A
gain
st
othe
r C
ounc
ils
Number of Staff on Redeployment New Indicator New Indicator 20 56 N/A N/A N/AThis number of employees on redeployment has more than doubled compared to Q2. In current climate we expect numbers to increase in Q4.
Internal Movements - All Authority 13.46% (3280) 2.80% (692) 5.46% (1389) 2.58% (641) Target >13.46% N/A Same quarter last year 403 internal movements this quarter showing an increase.
Internal Movements - Excluding Schools 16.43% (1606) 4.67% (466) 6.02% (593) 4.36% (430) Target >16.43% N/A
Same quarter last year 256 internal movements. The increase this quarter due to restructuring activity. This will increase further as the year progresses.
Number and % of leavers with less than 12 months service (% of the Workforce) -All Authority
2.94% (714) 0.67% (165) 1.16% (284) 0.46% (113) Target <2.94% N/A Same quarter last year 99 leavers with less than 12 months service this quarter showing an increase..
Number and % of leavers with less than 12 months service (% of the Workforce) -Excluding Schools
2.90% (283) 1.65% (66) 1.23% (121) 0.63% (62) Target <2.90% N/A Same quarter last year 55 leavers with less than 12 months service.
Stability Index - %age of Workforce still in employment after 12 months service New Indicator New Indicator 90.65% 90.86% N/A N/A N/A The stability index remains constant.
Age Profile - Average Age - All Authority 44.3 44.4 44.3 44.3
Age Profile - Average Age - Excluding Schools 45.4 45.4 45.4 45.5
Age Profile - Up to 25 - All Authority 5.95% (1478) 5.67% (1404) 5.89% (1445) 6.00% (1489) Same quarter last year 1383 employees aged under 25.
Age Profile - Up to 25 - Excluding Schools 6.65% (667) 6.47% (646) 6.20% (610) 6.18% (610) Same quarter last year 595 employees aged under 25.
Age Profile - Over 55 (ie 56 & Over) - All Authority 16.54% (4110) 16.80% (4160) 16.24% (3984) 16.35% (4058) <16.54% Same quarter last year 4018 employees aged 56+
Age Profile - Over 55 (ie 56 & Over) - Excluding Schools 21.46% (2152) 21.59% (2159) 21.33% (2100) 21.50% (2121) <21.46% Same quarter last year 2097 employees aged 56+
Full Time -v- Part-time - All Authority 34% Full Time - 66% Part-time
35% Full Time - 65% Part-time
35% Full Time - 65% Part-time
34% Full Time - 66% Part-time N/A Remains constant.
Full Time -v- Part-time - Excluding Schools
36% Full Time - 64% Part-time
36% Full Time - 64% Part-time
35% Full Time - 65% Part-time
35% Full Time - 65% Part-time N/A Remains constant.
Apprentices Appointed within Quarter - All Authority
55 appointments since September
2009
11 (April - June) 73 appointments since September
2009
19 (July - Sept) 92 appointment
since September 2009
4 (Oct - Dec) 10 appointments
since September
2010
Minimum of 100 Apprenticeships between Sept 09 and Aug 10 (15% delivered through
SCRN)
N/A N/A
Total no of Apprentices - All Authority 354 (no leavers in Qtr 4)
370 (2 leavers in Qtr 1)
378 (11 leavers in Qtr 2)
375 (13 leavers in Qtr 3) 500 by 2011 N/A
% of Apprentices in Substantive Posts - All Authority 96% (340) 97% (358) 97% (367) 100% (377) 98% N/A
Ethnic minority representation in the workforce - All Authority 1.05% (243) 1.06% (243) 1.11% (252) 1.15% (265) Target 1.12% Same quarter last year 1.04% (236) of workforce came from a
BME background.
Census Working Age Population of NY - 13.66%
All Local Authorities Average - 3.8% (DLA
Piper W kf
Census Av Working Age Population of NY - 40.93
The target of acheiving 100 apprenticeships between 01 September 2009 and 31 Aug 2010 has not been achieved, with a shortfall of 8 opportunities. The provision of apprenticeship opportunities has decreased as the availability of band 1 - 4 posts has diminished due to reduced turnover and restructuring. Further partnerships with schools and the Supply Chain Readiness Network is required to maintain the minimum delivery of provision and the target will be adjusted on a rolling basis.
Average age for whole Authority remains the same but the workforce excluding schools has increased.
LGAR Survey 2006 Shire
County Split = 24% M 76% F
Census Working Age Population of NY - 17.85%
Increase Nos & % of Employees Aged Up to 25
Reduce Average Age at end 09/10
Section 6 Appendix - HR Framework 2010-11 - Q3 Page No 2
Performance Report - 2010/11 AppendixPerformance Improvement Plans
2009
/201
0
Qua
rter
1
Qua
rter
2
Qua
rter
3
Qua
rter
4
Dire
ctio
n of
Tr
avel
Performance
Targ
et/P
roje
cted
Out
turn2010/2011
Perf
orm
ance
D
efin
ition
Com
para
tor/
Perf
orm
ance
A
gain
st
othe
r C
ounc
ils
Ethnic minority representation in the workforce - Excluding Schools 1.26% (110) 1.31% (114) 1.34% (115) 1.40% (121) Target 1.12% Same quarter last year 1.23% (105) of workforce came from a
BME background.
Ethnic Minority Representation in the Workforce + White Other - All Authority 2.99% (690) 2.96% (678) 3.00% (683) 3.02% (698) N/A N/A Same quarter last year 2.97% (675) of workforce came from a
BME and White Other Background.
Ethnic Minority Representation in the Workforce + White Other - Excluding Schools
3.99% (349) 4.00% (347) 4.07% (350) 4.10% (355) N/A N/A Same quarter last year 3.96% (339) of workforce came from a BME and White Other Background.
No of Adverts placed by Recruitment Bureau - Excluding Schools
1049 Ads (154 external)
298 Adverts (41 External Adverts)
314 Ads (24 external)
148 Ads (3 external)
Decrease in Number of
External Adverts Placed
N/A N/A
The number of adverts has decreased by over half compared to Q2. The number of external (paid for) advertisements has also reduced. Paid adverts are for social care where there is a National Skill shortage. All new vacancies effective 01.01.11 are advertised internally for 1 week prior to external due to redeployment. Expect ads to reduce again in Q4
Absence - Full Workforce 7.21 1.44 1.45 1.89
Authority Weighted Target
6.82 - Rolling Year Projected Outturn -
7.15
Ranked 1 out of 13 in PWC
Benchmarking Club - (1=Best,
13=Worst) Based on 2009/10
Figures
Same quarter last year 2.77 Average Days were lost per fte. Top 3 Reasons for Absence this Quarter : Mental Health, Musculo-Skeletal Problems, Infections.
Directorate targets have been weighted where there are differing targets within Service Areas. Direction of travel is a comparator between the 09/10 Outturn and the 10/11 Rolling Year projection (Column T).
Adult & Community 10.17 2.23 2.71 2.84Target 9.38 - Rolling Year
Projection - 10.69N/A Same quarter last year 2.77 Average Days
Business & Environment 7.47 1.64 1.73 1.74Target 6.31 - Rolling Year
Projection - 7.15N/A Same quarter last year 1.91 Average Days
Chief Executive's 5.96 1.49 1.16 1.50Target 6.00 - Rolling Year
Projection - 6.46N/A Same quarter last year 1.45 Average Days
Children & Young People's 8.25 1.40 1.94 1.75Target 7.04 - Rolling Year
Projection - 7.85N/A Same quarter last year 2.28 Average Days
CYPS - Catering 8.43 1.60 1.35 2.03Target 8.00 - Rolling Year
Projection - 7.60N/A Same quarter last year 2.06 Average Days
CYPS - Schools 6.10 1.18 0.99 1.70Target 6.00 - Rolling Year
Projection - 6.03N/A Same quarter last year 1.92 Average Days
Finance & Central Services 4.32 1.08 1.23 1.22Target 6.00 - Rolling Year
Projection - 4.79N/A Same quarter last year 0.91 Average Days
Finance - Building Cleaning Services 10.53 2.37 2.04 2.33Target 8.50 - Rolling Year
Projection - 10.25N/A Same quarter last year 3.03 Average Days
ABSENCE BY DIRECTORATE
Workforce Performance
Indicators 2009)
SAFE AND HEALTHY - ABSENCE
Section 6 Appendix - HR Framework 2010-11 - Q3 Page No 3
Performance Report - 2010/11 AppendixPerformance Improvement Plans
2009
/201
0
Qua
rter
1
Qua
rter
2
Qua
rter
3
Qua
rter
4
Dire
ctio
n of
Tr
avel
Performance
Targ
et/P
roje
cted
Out
turn2010/2011
Perf
orm
ance
D
efin
ition
Com
para
tor/
Perf
orm
ance
A
gain
st
othe
r C
ounc
ils
Absence - Short Term (1-7 Days) New Indicator New Indicator 23% 31% N/A N/A N/A
Absence - Medium Term (8-30 Days) New Indicator New Indicator 22% 20% N/A N/A N/A
Absence - Long Term (31+ Days) New Indicator New Indicator 55% 49% N/A N/A N/A
Average Length of Absence New Indicator New Indicator 4.20 Days 3.23 Days N/A N/A
All Local Authorities Average - 6.3 Days
(DLA Piper Workforce Performance Indicators
2010)
Average length of absence has reduced in line with the increase in number of short-term absences during the quarter.
Reported injuries, diseases & dangerous occurrences per 1000 employees per year
2.50 (61 Reportable Employee Incidents)
0.69 (17 Reportable Employee Incidents)
0.20 (5 Reportable Employee Incidents)
0.64 (16 Reportable Employee Incidents
Reduction on 09/10 Figure N/A
This is one of the measures of effectiveness of NYCC's health and safety procedures. It is based on the RIDDOR Regulations 1995 which requires the reporting of work-related accidents, diseases and dangerous occurrences.
Members Appeals (AC), Employment Tribunals (ET), Appeals Against Redundancy (AR) and Appeals Against Ill-Health (IHA)
8 AC 3 ET 2 AC 0 ET 0 AC 2 ET0 AC 1 ET 1 x
Attendance Appeal
N/A N/A N/AOne ET was held this quarter and the outcome is awaited. There was one manager appeal against attendance which was not upheld.
Number of Grievances/Apps of Resolving Issues at Work (RIAW)
5 RIAW Grievances - 32
Formal 7 Informal
1 RIAW Grievances - 4
Formal 2 Informal
3 RIAW Grievances - 2
Formal 4 Informal
0 RIAW Grievances - 4
Formal 3 Informal
N/A N/A N/A Number of grievances remain small compared to the workforce.
Union Membership (Excludes Teaching Staff)
Unison 19% : GMB 1.10%
Unison 20% : GMB 1.09%
Unison 20% : GMB 1.10%
Unison 20% : GMB : 1.12% N/A N/A N/A Slight increase in GMB membership this quarter.
Cost of Agency Staff as % of Total Pay Bill
£3.57m (1.33% Excluding
Teachers Pay Bill, 0.73% including
Teachers Pay Bill)
N/A N/A Comment will be made on an annual basis.
MODERNISATION AND CHANGE TO IMPROVEANNUAL STATISTICS
Short-term absence has increased this quarter with a reduction in long term absence.
Annual Report
ENGAGING WITH STAFF
Section 6 Appendix - HR Framework 2010-11 - Q3 Page No 4
7.0 REVENUE BUDGET FOR 2010/11 7.1 The County Council approved a total net expenditure Budget of £350.0m in
February 2010 but subsequently agreed the carry forward of 2009/10 net underspendings of £10.2m in July 2010. The revised total net Budget is therefore £360.2m.
7.2 The supporting information for this section of the report is contained in Annex C
which of itself comprises a number of Appendices that are referred to in the text. 7.3 An analysis of the latest 2010/11 Revenue Budget by Directorate is attached as
Appendix A. This Statement starts with the original Budgets approved by the County Council in February 2010 then shows:
(i) carry forwards from 2009/10 approved by the County Council (ii) allocations from the Pending Issues Provision (PIP) agreed by the Executive
(paragraphs 7.9 to 7.14 and Appendix I) (ii) various other agreed budget transfers and adjustments made to date during
the current year. 7.4 Also attached as Appendices B-G are statements prepared by each Corporate
Director setting out the latest forecast position for their Directorate. 7.5 In financial terms, these statements can be summarised as follows: -
Directorate Appendix Type of Budget Latest
2010/11 Budget
Forecast Variation at December 2010 (- = underspend + = overspend)
Previous Quarter at September
2010 £000 £000 £000
B PIP 1,236 -365 -335 Base 131,127 301 1,642
Adult and Community Services Total 132,363 -64 1,307
C PIP 1,805 0 -663 Base 67,505 2,594 1,573
Business and Environmental Services Total 69,310 2,594 910
D PIP 718 -272 -186 Base 14,143 -250 -338
Chief Executive’s Group
Total 14,861 -522 -524
E PIP 275 0 -2,000 Base 77,848 -634 -306
Children and Young People’s Service Total 78,123 -634 -2,306
F PIP 4,710 -1,263 -1,357 Base 18,098 -1,319 -159
Finance and Central Services
Total 22,808 -2,582 -1,516
G PIP 4,000 0 0 Base 31,850 -2,266 -1,967 Funds 6,861 -6,194 -1,297
Corporate Miscellaneous
Total 42,711 -8,460 -3,264
PIP 12,744 -1,900 -4,541 Base 340,571 -1,574 445 Corp Misc Funds 6,861 -6,194 -1,297 Total
Total 360,176 -9,668 -5,393
COM/EXEC/0211revenuebudget
7.6 The following paragraphs explain the variances shown above.
Projected Variances
7.7 Comments on the forecast variance for each Directorate is as follows:-
(a) Adult and Community Services Adults and Communities Services (ACS) has a revised budget of £132,363k which includes the one-off allocations of PIP monies. The projected expenditure included in Appendix B takes account of the current service pressures and trends and projects these to the financial year end. If these levels of service continue to run at the current levels, the outturn position at the 31st March is estimated to be £132,299k. The overall £64k underspend consists of £365k unspent PIP funding being carried forward to 2011/12 and a remaining £301k (0.2%) overspend against the base budget. Compared with the figures reported at Q2, and excluding the potential impact of ordinary residence cases (see below), this represents a reduction in the projected overspend of more than £1.3m reflecting the vigorous management action to reduce costs. The most significant pressure on the ACS budget continues to be the high levels of demand for social care services largely driven by demographic pressures, in particular the growth in the numbers of older people and people with learning disabilities requiring service. To offset these pressures a number of measures have been taken:- (i) a programme of efficiency savings over and above the VFM budget target
has been identified and ‘re-cycled’ into social care operations (ii) an intensive programme of service reviews has been initiated which has
already released significant cash savings (iii) linked to (ii) PIP monies are being used to increase the cost effectiveness
of service delivery through the development of re-ablement services and use of facilities such as telecare
(iv) a re-emphasis on rigorous ‘gatekeeping’ of services including senior
management approval of care packages, use of placement panels etc (v) concerted action to ensure external funding is maximised However one of the other major risks to the social care budget is the incidence of ordinary residence challenges. These are where social care clients, originally from other local authority areas, have moved to North Yorkshire and live in their own accommodation. Because of financial pressures local authorities are now seeking to argue that these individuals are ordinarily resident in North Yorkshire and therefore responsibility for funding their care falls to the County Council.
COM/EXEC/0211revenuebudget
Where cases have been decided the financial impact is included in the main projections but in addition a number of other cases are currently in dispute and the possible ongoing impact on the base budget of these is included as a memo item in Appendix B. It should be emphasised that these are just the cases currently in process but the total costs of all the potential cases would be very significantly higher. Work is ongoing to identify the potential liability for NYCC. Elsewhere the main concern is within the Libraries and Community Services unit. On the core library service a projected overspend of £100k is a result of a number of factors but in particular the decision not to reduce the mobile fleet at this point in time although this was identified as one of the budget savings for the service and the budget reduced accordingly. On the School Library Service, compared to the position at Q2, there has been a small reduction in the projected overspend reflecting downwards pressure on the costs of the operation. Further discussions are taking place with CYPS to discuss the long term funding of the service.
(b) Business and Environmental Services
The forecast position is an overspend of £2,594k, of which the winter service accounts for £2,450k after the application of the Reserve of £1,500k referred to below. However, excluding the winter service, BES is aiming to deliberately under spend in 2010/11 to help the overall financial position of the County Council, whilst recognising that there are other cost pressures which the Directorate is looking to contain within existing resources. Currently it is estimated that the available underspend to contribute will be in excess of £1m and will reduce the above overspend forecast accordingly. This approach will reduce the potential claim on the GWB for the ‘overspend’ on the winter service (see paragraph 7.19 et seq). The overspend for the winter service is due to weather conditions experienced during this season as at 23 January 2011. The forecast is subject to change as the season continues. The winter service Reserve was fully utilised last financial year but as part of the Q1 report the Executive approved a contribution of £1.5m to re-establish the Reserve, - however as indicated above this will be fully utilised in 2010/11. Based on expenditure incurred in the current and previous winters the longer term aim is to build the Reserve to £2.5m. The Directorate continues to prioritise highway maintenance works to deal with damage to the network resultant from severe winter conditions experienced in 2009/10. A works package of £10.5m is in place funded from both revenue and capital budgets. The total estimate of damage remaining from 2009/10 is £23m but it should be noted however that the value of additional damage resulting from 2010/11 winter conditions is yet to be quantified indicating that further funding from future budgets will be directed to the repair efforts. The remaining net overspend forecast of £144k relates to additional external fees for the waste procurement project.
COM/EXEC/0211revenuebudget

The Q2 report noted an over spend of £1,573k due to the loss of Yorwaste dividend for 2010/11. A budget transfer of £1,573k (increase for BES) has been effected from Corporate Miscellaneous (PIP) in Q3 to fund this shortfall. Further assessments of the Waste Management budget have been carried out which confirm the position reported to the Executive at Q2. The forecast position on the waste budget is subject to change given its volatile nature albeit this should diminish as the financial year progresses; close monitoring of the position will continue. Forecast expenditure on the PIP funded Bedale-Aiskew-Leeming Bar Bypass (BALB) scheme for 2010/11 is £305k. This is £552k below the PIP allocation this year.
(c) Chief Executive’s Group
The forecast net underspend on Chief Executive’s Group at Q3 is £522k. Once adjusted for the reprofiling of one-off projects funded by the PIP (£272k) the effective forecast underspend against base Budget is £250k. The budgets for Chief Executive’s Office, Grants & Subscriptions and Members Services have been reduced by £100k to reflect savings within the CEG programme that have been brought forward from 2011/12. A large proportion of the forecast saving is due to staffing vacancies in the current year as managers seek to hold vacancies as part of the savings strategy. Savings have been used to provide for severance costs (thereby reducing the impact on any corporate fund for severance) and to support one-off activity that will allow HR services to implement change which will deliver further savings in later years. The Legal Expenses budget continues to be volatile and is forecast to overspend due to a number of potentially high cost court cases. A judgement has been made as to whether the total potential outstanding commitments will fall in 2010/11 or 2011/12. Approximately £100k has been assumed to fall in 2011/12. Although no expenditure is expected against the Elections budget in 2010/11, funding will be put into a reserve to contribute to the costs of the next County Council Elections.
(d) Children and Young People’s Service
(i) Local Authority Block Overall the projected underspending at Q3 is £634k compared with a forecast underspend at Q2 of £306k – representing an increase in underspending of £328k. These projections exclude the non-recurring £2m PIP originally agreed for capital investment and subsequently earmarked to support CYPS Revenue budgets up to Q2. The Directorate has decided in Q3 not to use this allocation in 2010/11 for revenue purposes and it has therefore been re-phased into 2011/12 for investment in Directorate co-location which is needed to secure efficiency savings via integration.
COM/EXEC/0211revenuebudget
The latest assessment of spending against Children’s Social Care budgets indicates that management action has helped to contain costs in the current year. Overall, these measures have helped to reduce the projected overspending of £584k at Q2 to a projected overspend of £369k – a reduction of £215k. In particular, new “gatekeeping” arrangements around children entering the care system have had a significant impact. There are currently 467 looked after children which represents an increase of 4 compared with Q2 and an increase of 8 compared to the commencement of the year. While overall numbers have increased, changes in the way children’s needs are matched to placement type are reflected by a mix of care which represents better value for money. The Children’s Social Care budget – excluding placements and services for disabled children – is showing an overspend of £268k. However, after the application of the entire £524k earmarked reserve for non-recurring social care costs this shows an underspend of £256k within the headline figure above. This reduced call on the reserve for 2010/11 is due to management action to reduce spending in Assessment & Safeguarding teams. This includes: a temporary freeze on all recruitment; restriction of Children in Need payments, and; cessation of the use of agency staff, balancing the need to address the underlying budgetary position and manage child welfare risks. However there may be additional non-recurring and recurring pressures on this budget in 2011/12. The projected underspend on Home to School Transport is £407k compared with £350k at Q2 – an increase in underspending of £57k. While the daily rate of contract prices has increased by over £900 a day, reflecting the network changes from September, this is offset by savings accruing from school closures due to winter weather. £300k of this underspend has already been offered up as a recurring MTFS saving from 2011/12. The CYPS MTFS savings strategy equals £7,386k: a significant financial challenge to the Directorate. As part of the savings strategy CYPS will use some reserves carried forward from previous years and specifically earmarked to achieve the cash targets before recurring savings are implemented in full from 1 April 2011. Therefore the current projection, will deliver the full £7.386m savings plus £300k recurring from 2011/12, which is reflected in the outturn underspend in 2010/11. In addition a Home to School Transport contingency of £300k has been set aside to deal with one off issues and the latest position suggests that this will not be called on during 2010/11.
(ii) Schools Block Dedicated Schools Grant (DSG) is used to fund the Schools Block. Currently, there is a projected net overspend on the Schools Block of £136k which, if confirmed, would reduce the unallocated DSG to £683k. This represents a small contingency (0.2%) in relation to a ring-fenced grant of £328m.
COM/EXEC/0211revenuebudget

(e) Finance and Central Services
There is an overall forecast underspend of £2,582k of which £174k relates to recurring base budget provision; of the remainder £1,263k relates to PIP funded projects (primarily Harrogate BOS) and £1,145k relates chiefly to committed property and ICT related projects for which funds have been specifically allocated. These projects have either been delayed or in the case of ICT ‘stopped’ pending the outcome of a strategy review. The main items making up this sum are: (i) a potential underspend against Financial Services of £184k mainly due to
the carry-forward from 2009/10; this will be used to fund non-recurring priorities within the Directorate (eg replacement of server for Oracle Financials)
(ii) a planned overspend of £223k relating to the Scanning Bureau which will
be offset by income from Directorates over future years (iii) following a project review, a ‘managed’ £183k underspend on the core
STIC budget for system infrastructure. This will be available to meet future STIC programme costs
(iv) a forecast net underspend on ICT Services of £251k primarily relating to
the phasing of development projects (£523k) offset by £282k planned overspend on infrastructure investment (eg servers and storage) that will be offset by contributions from Directorates in future years
(v) a forecast underspend of £100k on Corporate Repairs and Maintenance
due to rephasing of maintenance schemes into 2011/12 following the bad weather in November/January period
(vi) a forecast underspend of £293k primarily on minor improvements against
the Corporate Accommodation budget due to individual on site scheme delays
(vii) a forecast underspend of £980k on Harrogate BOS due to scheme
rephasing. This PIP funding will be carried forward to fund the completion of the scheme in 2011/12. Also in the light of the pending financial scenario a review of some aspects of the scheme is in hand to ensure there is no long term over-capacity of office accommodation in the Harrogate area (this review embraces a number of CYPS properties in Harrogate and offices in Ripon)
(viii) a forecast underspend of £100k on Skipton BOS due to delays in the
refurbishment. This funding will be carried forward to fund the completion of the scheme in early 2011/12
(ix) a forecast underspend of £380k on Corporate Property Management.
The underspend comprises staffing vacancies (linked to 2011/12 Budget savings), delays on Farms Minor Improvements offset by the contract management setup costs relating to the new Gypsy sites management agreement
COM/EXEC/0211revenuebudget
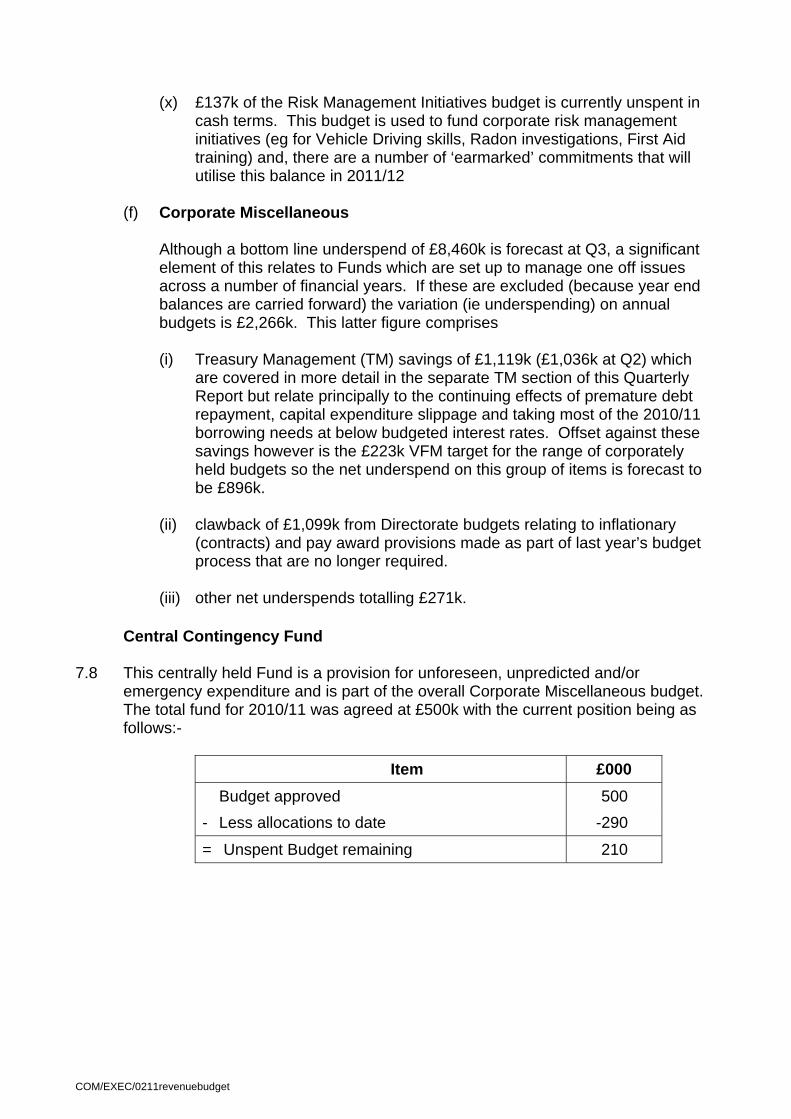
(x) £137k of the Risk Management Initiatives budget is currently unspent in
cash terms. This budget is used to fund corporate risk management initiatives (eg for Vehicle Driving skills, Radon investigations, First Aid training) and, there are a number of ‘earmarked’ commitments that will utilise this balance in 2011/12
(f) Corporate Miscellaneous
Although a bottom line underspend of £8,460k is forecast at Q3, a significant element of this relates to Funds which are set up to manage one off issues across a number of financial years. If these are excluded (because year end balances are carried forward) the variation (ie underspending) on annual budgets is £2,266k. This latter figure comprises (i) Treasury Management (TM) savings of £1,119k (£1,036k at Q2) which
are covered in more detail in the separate TM section of this Quarterly Report but relate principally to the continuing effects of premature debt repayment, capital expenditure slippage and taking most of the 2010/11 borrowing needs at below budgeted interest rates. Offset against these savings however is the £223k VFM target for the range of corporately held budgets so the net underspend on this group of items is forecast to be £896k.
(ii) clawback of £1,099k from Directorate budgets relating to inflationary
(contracts) and pay award provisions made as part of last year’s budget process that are no longer required.
(iii) other net underspends totalling £271k.
Central Contingency Fund 7.8 This centrally held Fund is a provision for unforeseen, unpredicted and/or
emergency expenditure and is part of the overall Corporate Miscellaneous budget. The total fund for 2010/11 was agreed at £500k with the current position being as follows:-
Item £000 Budget approved 500
- Less allocations to date -290
= Unspent Budget remaining 210
COM/EXEC/0211revenuebudget
Pending Issues Provision (PIP) 7.9 The Pending Issues Provision (PIP) was set up in 2008/09 as part of the MTFS
process, to underpin a financial strategy, that would ensure sufficient recurring funds are available in future years to meet the predicted year on year additional costs of the Waste Strategy. In addition to providing long term funding for the Waste Strategy, the funding paid into the PIP but not yet required by the Waste Strategy is available to fund non-recurring items, with significant sums having been allocated to date by the Executive.
7.10 Full details of the PIP were reported as part of the Medium Term Financial Strategy
2011/15 and Revenue Budget for 2011/12 approved by Executive on 8 February 2011. As mentioned in that report, since the PIP was first created its use has been widened both in terms of the sources of contributions paid in and the range of allocations paid out.
7.11 In terms of the overall PIP, a summary of the current position reflecting allocations
agreed by Executive to date is as follows:
Item 2010/11 2011/12 2012/13
£000 £000 £000 Funding approved 2 February 2010 17,073 13,385 9,346 Net Underspend carried forward from 2009/10
503
Transfer of Community Fund underspend 277
Total funds available 17,853 13,385 11,171
- allocations approved by Executive to date -21,177 -8,438 -846 - re-phasing of CYPS Capital allocations
agreed on 27 May 2008 +2,000 -4,000
- further re-phasing of CYPS allocations +2,000 +1,000 -3,000 - re-phasing of ACS Reablement projects +2,998 -1,525 -1,473 - re-phasing of BES Bedale Bypass
Allocations +552 +171 -723
- allocation to BES to fund Yorwaste Dividend Shortfall
-1,573
- re-phasing of Redundancy Reserve +2,500 -2,500 - STIC provisions for related projects and
priorities (earmarked and to be confirmed by Executive)
-885
Total Allocations to Date -12,700 -16,177 -6,042
Budget remaining +5,153 -2,792 5,129 7.12 In relation to STIC provisions of £885k a further report will be submitted to
Executive once the necessary business case(s) to substantiate the allocation of these funds have been prepared. Provision has been made for these items in 2011/12 for the time being however.
COM/EXEC/0211revenuebudget
7.13 Based on the allocations and earmarked provisions set out in the table in paragraph 7.11 and the papers submitted to Executive on 8 February 2011 as part of the 2010/11 Budget/MTFS report the current year on year indicative cash balances for the PIP are
Balance pa Cumulative
Balance
year £000 £000
2010/11 +5,153 = actual cash 2011/12 -2,792 +2,361 = cash not 2012/13 +5,129 +7,490 ‘actual’ 2013/14 +11,239 +18,729 until year 2014/15 +4,411 +23,140 indicated 2015/16 +3,332 +26,472 Total PIP remaining to be allocated (up to 2015/16)
+26,472 +26,472
7.14 In relation to 2010/11, the table above indicates an uncommitted PIP budget
remaining in Corporate Miscellanous of £5,153k. This is £6,479k higher than the -£1,326k reported at Q2 because of the following
item £000
re-phasing of ACS Reablement Funding +2,998 re-phasing of Redundancy Reserve Expenditure +2,500 re-phasing of Bedale Bypass Expenditure +552 re-phasing of CYPS “Capital Allocations” +2,000 approval of CYPS ICT Transformation Allocations for 2010/11 -275 approval of Yorwaste Dividend Shortfall allocation -1,573 re-allocation of carried forward Community Fund underspends into the PIP
+277
Total 6,479
All of the above were approved as part of the Budget/MTFS report considered by
the Executive on 8 February 2011. 7.15 The reported PIP budget in Corporate Miscellaneous at Q3 shown in Appendix G
is £5,833k and differs from the £5,153k reported above because the forecast Reablement spend of £680k in 2011/12 has not yet been allocated to ACS.
7.16 Appendix I attached provides full details of the 2010/11 – 2012/13 allocations and
their progress to date. The Appendix also provides initial revised assumptions of expenditure on PIP approved projects in 2011/12, 2012/13 and 2013/14.
COM/EXEC/0211revenuebudget
Area Committee Budgets 7.17 The table below sets out the position on Area Committee budgets as at the end of
December 2010. 2010/11 Budget
Area Committee Base Budget
2009/10Carry Over
Total Budget
Spent/ Committed
to end December
Budget remaining
end December
£000 £000 £000 £000 £000 Craven 40 22 62 27 35 Hambleton 52 7 59 16 43 Harrogate 77 11 88 44 44 Richmondshire 40 15 55 16 39 Ryedale 39 3 42 14 28 Yorkshire Coast & Moors 60 0 60 55 5 Selby 49 28 77 43 34
Total 357 86 443 215 228 7.18 As part of the 2011/12 Budget and MTFS process the Executive agreed on 8
February 2011 and for subsequent consideration by County Council on 16 February 2011 that:
• this budget provision will be deleted with effect from 2011/12 but
• allow for any unspent balance at 31 March 2011 to be retained by the Area Committee until spent.
General Working Balance
7.19 A key objective of the updated Medium Term Financial Strategy and the 2011/12
Revenue Budget approved by Executive on 8 February 2011 and pending approval by County Council on 16 February 2011 is to maintain the General Working Balance (GWB) at a defined minimum acceptable level.
7.20 The policy target for the level of the GWB has been defined as 2% of the net
Revenue Budget of the County Council. 7.21 The level of the GWB is directly affected by any year end under or overspending on
the various Corporate Miscellaneous budgets which are not rolled forward between years, plus any unforeseen in year factors arising on Service Budgets which need to be funded corporately. Based on the information in this report and allowing for a provision of £2m for year end Directorate write offs as agreed in the 2011/12 Budget/MTFS report submitted to Executive on 8 February 2011 the current projection is that the GWB at the year end would be £7,660k or 2.2% of the net Revenue Budget, made up as follows:-
COM/EXEC/0211revenuebudget
Item £000 Balance at 31 March 2010 +17,569
- Directorate underspends carried forward from 2009/10 -10,175
= Free Working Balance at 31 March 2010 +7,394
Forecast variations in 2010/11
- Provision for year end Directorate overspend write offs -2,000
+ Corporate Miscellaneous variations (paragraph 7.7(f)) +2,266
= forecast position at 31 March 2011 +7,660 7.22 Not reflected in the above Table are
(i) any further items that have arisen or may arise that will require recurring funding, and/or
(ii) any Directorate overspends or other items that may require write off at the year
end in excess of the £2m provision allowed for
7.23 The forecast balance of £7,660k at 31 March 2011 compares with:
• an actual of £7,394k at 31 March 2010
• a forecast of £7,761k at Q2 2010/11
• a forecast of £7,361k included in the Medium Term Financial Strategy and 2011/12 Revenue Budget considered by Executive on 8 February 2011 and County Council on 16 February 2011
7.24 A full comparison of this latest projection with the figures used in the Medium Term
Financial Strategy and Revenue Budget process for 2010/11 is provided in Appendix H.
Local Area Agreement (LAA) Performance Reward Grant 7.25 In relation to LAA1 which ran from 2007/08 to 2009/10, the County Council (as the
Accountable Body for LAA1) are expecting to receive £6.2m Performance Reward Grant (PRG). This was less than the £6.41m sum estimated at Q2 due to the final performance against the stretch targets. A final audited claim has been submitted to Government, and sign off and payment is expected before the end of the financial year. A sum of £1.75m has already been received as an interim claim. The expected sum is 50% of the original anticipated amount, as announced by the Government in June 2010.
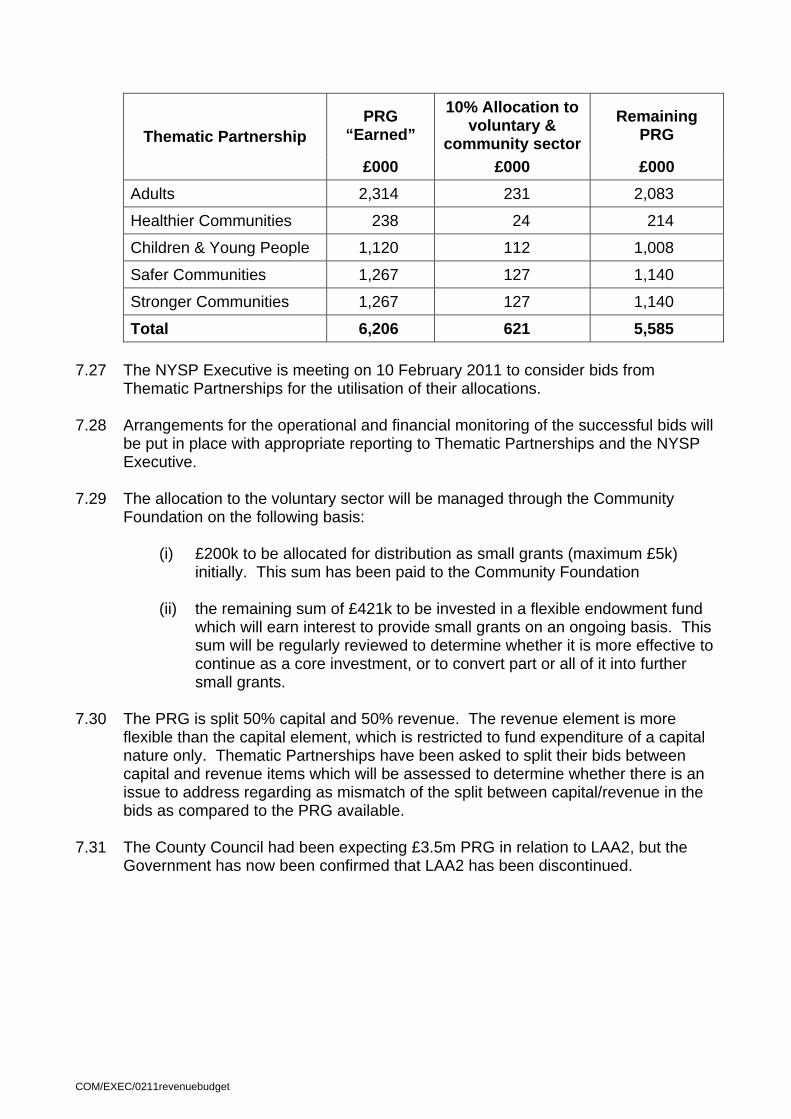
7.26 The table below shows the allocation of the PRG between Thematic Partnerships,
with an agreed 10% allocation to the voluntary and community sector split across Thematic Partnerships pro rata to the PRG earned.
COM/EXEC/0211revenuebudget
PRG “Earned”
10% Allocation to voluntary &
community sector Remaining
PRG Thematic Partnership
£000 £000 £000 Adults 2,314 231 2,083
Healthier Communities 238 24 214
Children & Young People 1,120 112 1,008
Safer Communities 1,267 127 1,140
Stronger Communities 1,267 127 1,140
Total 6,206 621 5,585 7.27 The NYSP Executive is meeting on 10 February 2011 to consider bids from
Thematic Partnerships for the utilisation of their allocations. 7.28 Arrangements for the operational and financial monitoring of the successful bids will
be put in place with appropriate reporting to Thematic Partnerships and the NYSP Executive.
7.29 The allocation to the voluntary sector will be managed through the Community
Foundation on the following basis:
(i) £200k to be allocated for distribution as small grants (maximum £5k) initially. This sum has been paid to the Community Foundation
(ii) the remaining sum of £421k to be invested in a flexible endowment fund
which will earn interest to provide small grants on an ongoing basis. This sum will be regularly reviewed to determine whether it is more effective to continue as a core investment, or to convert part or all of it into further small grants.
7.30 The PRG is split 50% capital and 50% revenue. The revenue element is more
flexible than the capital element, which is restricted to fund expenditure of a capital nature only. Thematic Partnerships have been asked to split their bids between capital and revenue items which will be assessed to determine whether there is an issue to address regarding as mismatch of the split between capital/revenue in the bids as compared to the PRG available.
7.31 The County Council had been expecting £3.5m PRG in relation to LAA2, but the
Government has now been confirmed that LAA2 has been discontinued.
COM/EXEC/0211revenuebudget

7.32 RECOMMENDATIONS
That the Executive (i) notes the latest position for Directorate budgets as summarised in paragraph
7.5 (ii) notes the consequential forecast position of the General Working Balance as
detailed in paragraph 7.21
COM/EXEC/0211revenuebudget

ANNEX C
REVENUE BUDGET APPENDICES
Appendix A 2010/11 Latest Revenue Budgets Appendix B Adult and Community Services Appendix C Business and Environmental Services Appendix D Chief Executive’s Group Appendix E Children and Young People’s Service Appendix F Finance and Central Services Appendix G Corporate Miscellaneous Appendix H General Working Balance Appendix I Pending Issue Provision (PIP) Monitoring Statement
COM/EXEC/0211revenuebudget
2010/11 LATEST REVENUE BUDGETS AT 31 DECEMBER 2010
Original Approved Pending Corporate Other LatestBudgets carry Issues Clawback of agreed Revised
agreed by forwards Provision Excess transfers BudgetsCty Cncl on from Inflation and17-Feb-10 2009/10 Provisions adjustments
£000s £000s £000s £000s £000s £000sDIRECTORATE
Children & Young Peoples' Service 79,238 696 -1,725 -207 121 78,123
Business & Environmental Services 68,560 965 1,021 -493 -743 69,310
Adult & Community Services 131,437 470 691 -314 79 132,363
Chief Executive's Group 13,682 856 -47 370 14,861
Finance & Central Services 15,951 4,223 1,205 -38 1,467 22,808
Corporate MiscellaneousContingency - general provision 500 -188 312Contingency - specific inflation provision 0 1,099 1,099Contingency - additional CYPS Demand 500 -500 0Contribution from Insurance Fund Reserve -3,000 -3,000Pending Issues Provision - Non-Recurring 10,245 503 -4,915 5,833Capital Financing charges 32,778 -255 32,523Interest earned -1,695 -50 -1,745Community Fund / Second Homes Council Tax 800 1,746 -277 -146 2,123Transformation Fund 620 301 -50 871DSG Contribution to Corporate Overheads -1,052 -1,052Pay & Reward Initiative 533 329 -271 591Contribution to Redundancy Reserve 0 2,500 2,500Contribution to Winter Maintenance Reserve 0 1,500 1,500Other (net) 904 86 166 1,156
41,133 2,965 -1,192 1,099 -1,294 42,711
350,001 10,175 0 0 0 360,176
FINANCINGInternal revenue balances 10,175 10,175Externally
Revenue support grant 13,232 13,232National non domestic rates 91,123 91,123Precept on District Councils current year 245,154 245,154 previous years arrears 492 492
350,001 10,175 0 0 0 360,176
APPEN
DIX A
BUDGET HEAD REVISED FORECAST VARIANCEHIGH BUDGET OUTTURN (-) = underRISK? 2010/11 2010/11 spend
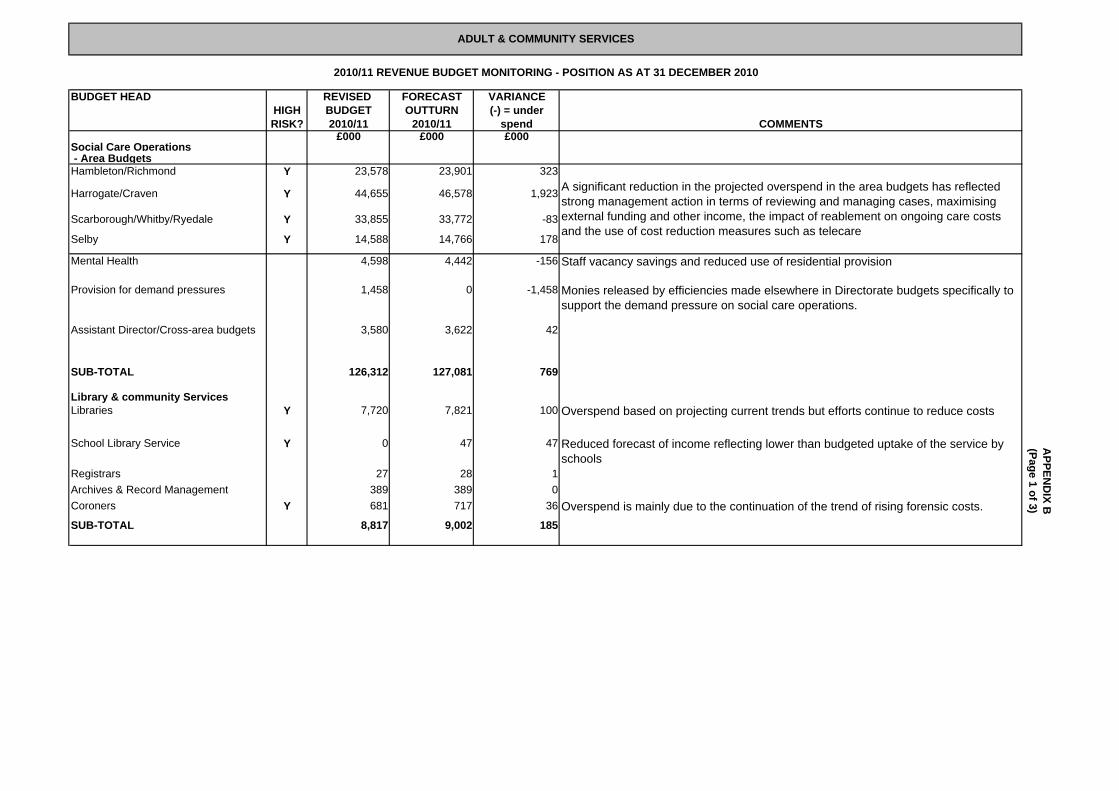
£000 £000 £000Social Care Operations - Area BudgetsHambleton/Richmond Y 23,578 23,901 323
Harrogate/Craven Y 44,655 46,578 1,923
Scarborough/Whitby/Ryedale Y 33,855 33,772 -83
Selby Y 14,588 14,766 178
Mental Health 4,598 4,442 -156 Staff vacancy savings and reduced use of residential provision
Provision for demand pressures 1,458 0 -1,458 Monies released by efficiencies made elsewhere in Directorate budgets specifically to support the demand pressure on social care operations.
Assistant Director/Cross-area budgets 3,580 3,622 42
SUB-TOTAL 126,312 127,081 769
Library & community ServicesLibraries Y 7,720 7,821 100 Overspend based on projecting current trends but efforts continue to reduce costs
School Library Service Y 0 47 47 Reduced forecast of income reflecting lower than budgeted uptake of the service by schools
Registrars 27 28 1Archives & Record Management 389 389 0Coroners Y 681 717 36 Overspend is mainly due to the continuation of the trend of rising forensic costs.SUB-TOTAL 8,817 9,002 185
ADULT & COMMUNITY SERVICES
2010/11 REVENUE BUDGET MONITORING - POSITION AS AT 31 DECEMBER 2010
COMMENTS
A significant reduction in the projected overspend in the area budgets has reflected strong management action in terms of reviewing and managing cases, maximising external funding and other income, the impact of reablement on ongoing care costs and the use of cost reduction measures such as telecare
APPEN
DIX B
(Page 1 of 3)
BUDGET HEAD REVISED FORECAST VARIANCEHIGH BUDGET OUTTURN (-) = underRISK? 2010/11 2010/11 spend
£000 £000 £000
ADULT & COMMUNITY SERVICES
2010/11 REVENUE BUDGET MONITORING - POSITION AS AT 31 DECEMBER 2010
COMMENTS
Commissioning, contracting & quality assurance
551 555 4
Strategic Commissioning & Partnerships
780 785 5
Resources Unit 8,269 8,184 -85 Reduced insurance premiums, tight management of staff vacancies
Performance & Change Management 2,068 2,063 -5
Director & Cross-Directorate 902 635 -267 Savings on General Social Care Council registration, contingency and uncommitted budgets
One-off savings 0 -305 -305 Backdated CHC funding, reclaimed direct payment balances etc
Government Grants & Health Transfer
-16,572 -16,572 0
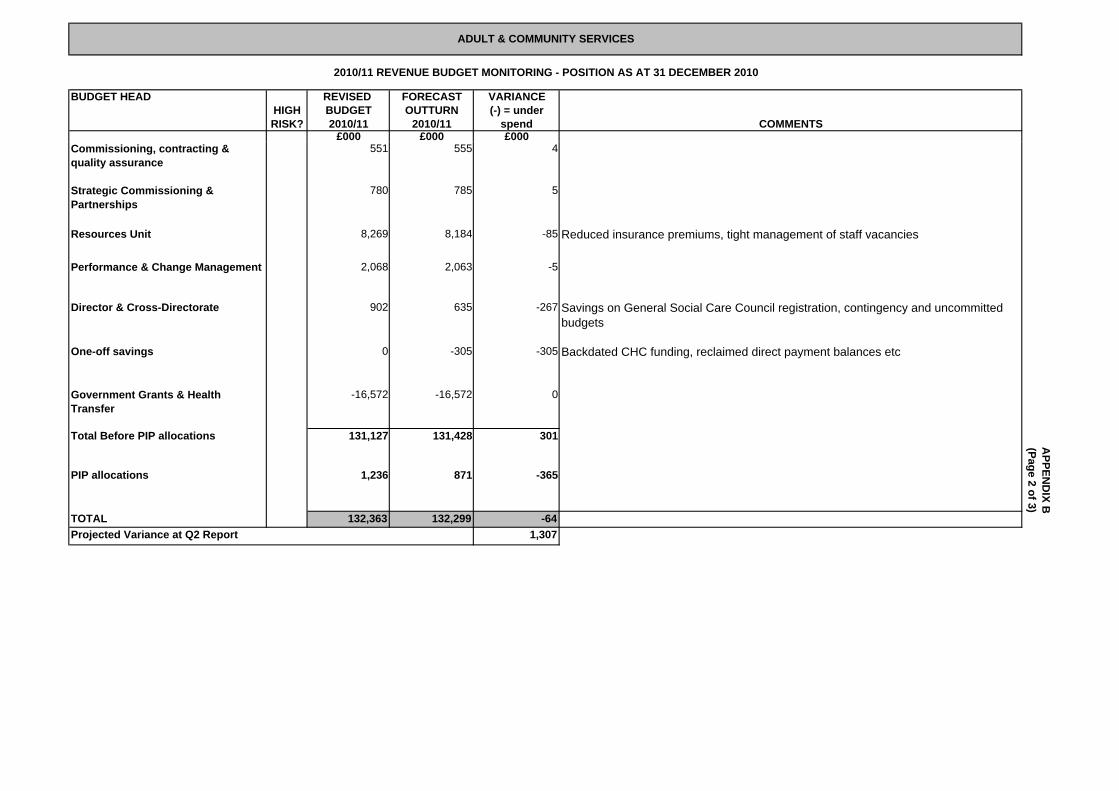
Total Before PIP allocations 131,127 131,428 301
PIP allocations 1,236 871 -365
TOTAL 132,363 132,299 -641,307Projected Variance at Q2 Report
APPEN
DIX B
(Page 2 of 3)
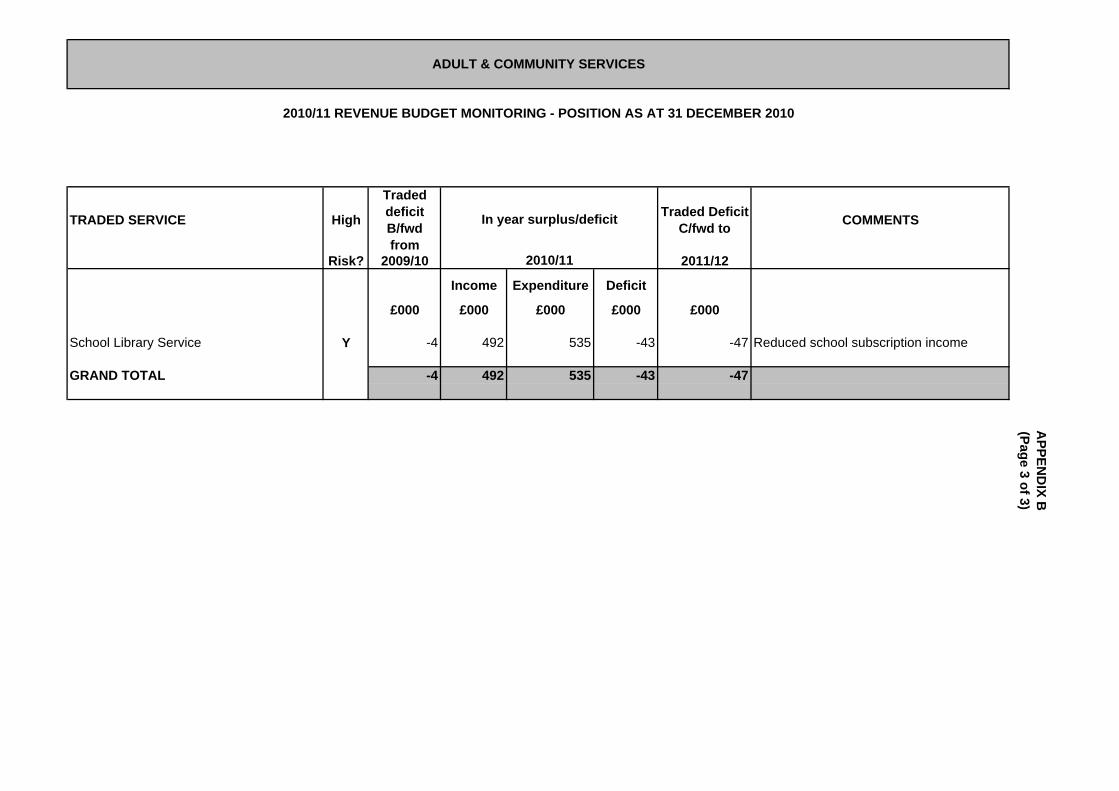
TRADED SERVICE High
Traded deficit B/fwd from
Traded Deficit C/fwd to COMMENTS
Risk? 2009/10 2011/12
Income Expenditure Deficit
£000 £000 £000 £000 £000
School Library Service Y -4 492 535 -43 -47 Reduced school subscription income
GRAND TOTAL -4 492 535 -43 -47
In year surplus/deficit
2010/11
ADULT & COMMUNITY SERVICES
2010/11 REVENUE BUDGET MONITORING - POSITION AS AT 31 DECEMBER 2010
APPEN
DIX B
(Page 3 of 3)
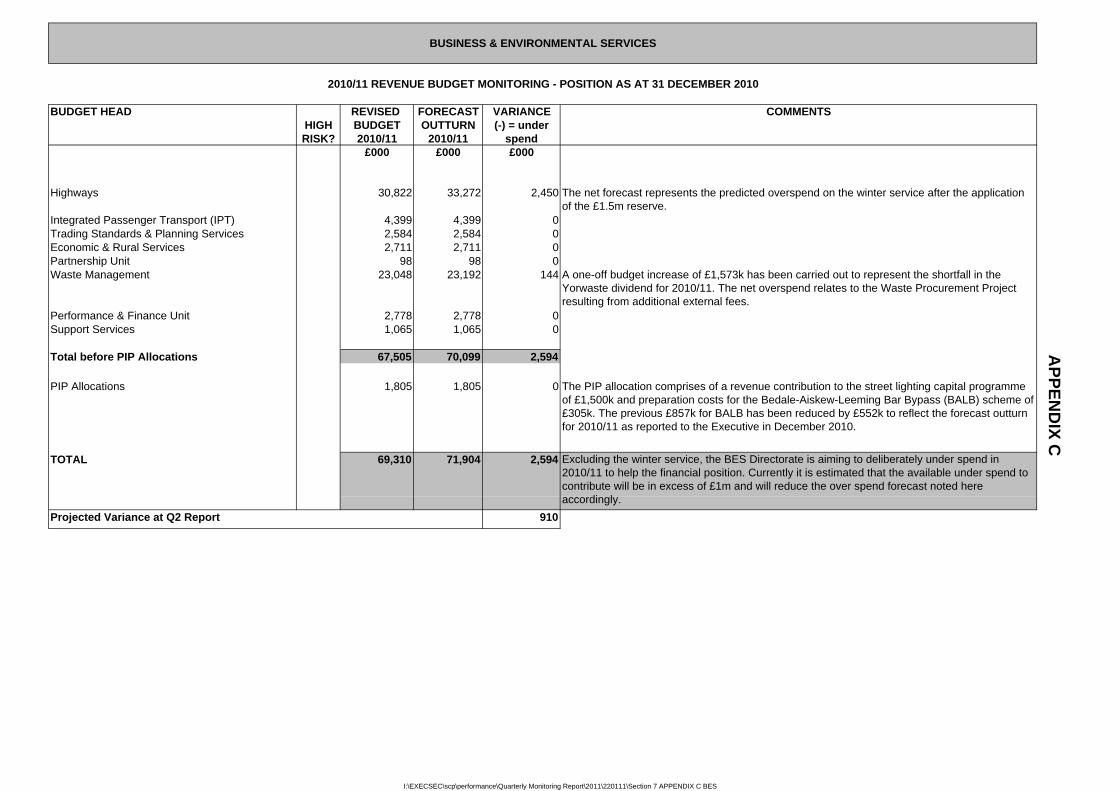
BUDGET HEAD REVISED FORECAST VARIANCEHIGH BUDGET OUTTURN (-) = underRISK? 2010/11 2010/11 spend
£000 £000 £000
Highways 30,822 33,272 2,450 The net forecast represents the predicted overspend on the winter service after the application of the £1.5m reserve.
Integrated Passenger Transport (IPT) 4,399 4,399 0Trading Standards & Planning Services 2,584 2,584 0Economic & Rural Services 2,711 2,711 0Partnership Unit 98 98 0Waste Management 23,048 23,192 144 A one-off budget increase of £1,573k has been carried out to represent the shortfall in the
Yorwaste dividend for 2010/11. The net overspend relates to the Waste Procurement Project resulting from additional external fees.
Performance & Finance Unit 2,778 2,778 0Support Services 1,065 1,065 0
Total before PIP Allocations 67,505 70,099 2,594
PIP Allocations 1,805 1,805 0 The PIP allocation comprises of a revenue contribution to the street lighting capital programme of £1,500k and preparation costs for the Bedale-Aiskew-Leeming Bar Bypass (BALB) scheme of £305k. The previous £857k for BALB has been reduced by £552k to reflect the forecast outturn for 2010/11 as reported to the Executive in December 2010.
TOTAL 69,310 71,904 2,594
910
BUSINESS & ENVIRONMENTAL SERVICES
2010/11 REVENUE BUDGET MONITORING - POSITION AS AT 31 DECEMBER 2010
Excluding the winter service, the BES Directorate is aiming to deliberately under spend in 2010/11 to help the financial position. Currently it is estimated that the available under spend to contribute will be in excess of £1m and will reduce the over spend forecast noted here accordingly.
COMMENTS
Projected Variance at Q2 Report
APPEN
DIX C
I:\EXECSEC\scp\performance\Quarterly Monitoring Report\2011\220111\Section 7 APPENDIX C BES
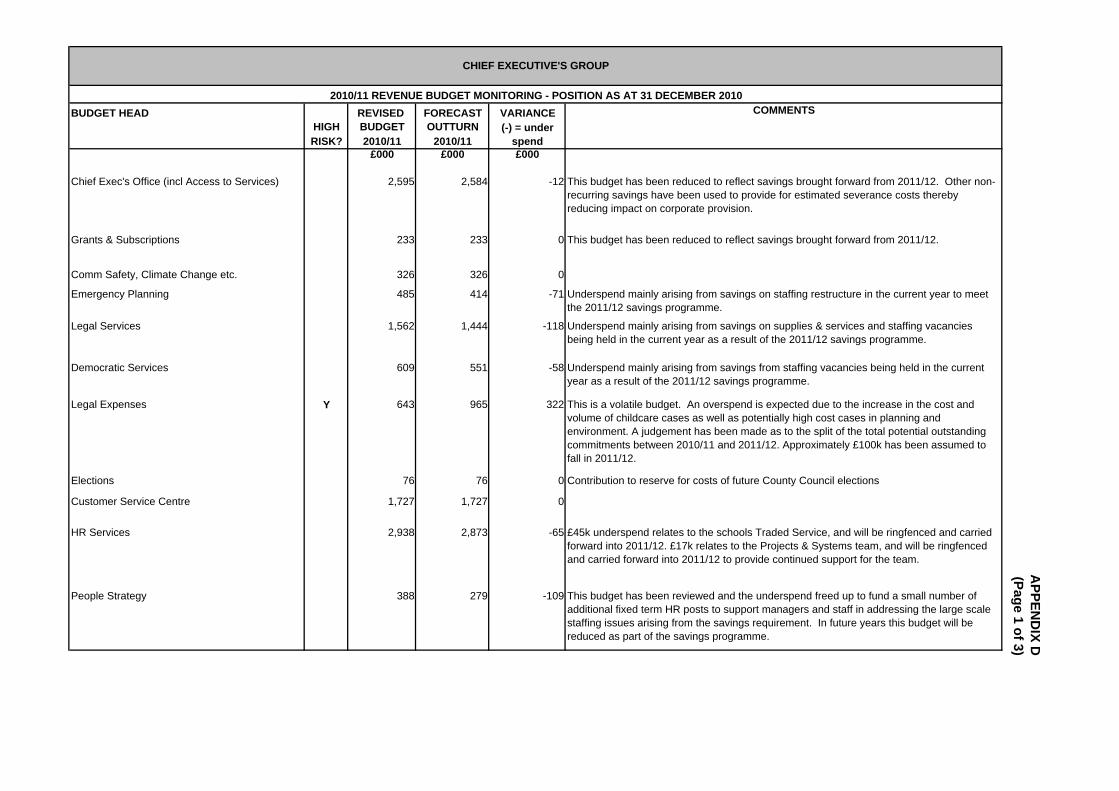
BUDGET HEAD REVISED FORECAST VARIANCEHIGH BUDGET OUTTURNRISK? 2010/11 2010/11
£000 £000 £000
Chief Exec's Office (incl Access to Services) 2,595 2,584 -12
Grants & Subscriptions 233 233 0
Comm Safety, Climate Change etc. 326 326 0
Emergency Planning 485 414 -71
Legal Services 1,562 1,444 -118
Democratic Services 609 551 -58
Legal Expenses Y 643 965 322
Elections 76 76 0
Customer Service Centre 1,727 1,727 0
HR Services 2,938 2,873 -65
People Strategy 388 279 -109
Underspend mainly arising from savings on supplies & services and staffing vacancies being held in the current year as a result of the 2011/12 savings programme.
Underspend mainly arising from savings from staffing vacancies being held in the current year as a result of the 2011/12 savings programme.
£45k underspend relates to the schools Traded Service, and will be ringfenced and carried forward into 2011/12. £17k relates to the Projects & Systems team, and will be ringfenced and carried forward into 2011/12 to provide continued support for the team.
This budget has been reviewed and the underspend freed up to fund a small number of additional fixed term HR posts to support managers and staff in addressing the large scale staffing issues arising from the savings requirement. In future years this budget will be reduced as part of the savings programme.
This budget has been reduced to reflect savings brought forward from 2011/12. Other non-recurring savings have been used to provide for estimated severance costs thereby reducing impact on corporate provision.
This budget has been reduced to reflect savings brought forward from 2011/12.
Underspend mainly arising from savings on staffing restructure in the current year to meet the 2011/12 savings programme.
CHIEF EXECUTIVE'S GROUP
2010/11 REVENUE BUDGET MONITORING - POSITION AS AT 31 DECEMBER 2010COMMENTS
(-) = under spend
This is a volatile budget. An overspend is expected due to the increase in the cost and volume of childcare cases as well as potentially high cost cases in planning and environment. A judgement has been made as to the split of the total potential outstanding commitments between 2010/11 and 2011/12. Approximately £100k has been assumed to fall in 2011/12.
Contribution to reserve for costs of future County Council elections
APPEN
DIX D
(Page 1 of 3)
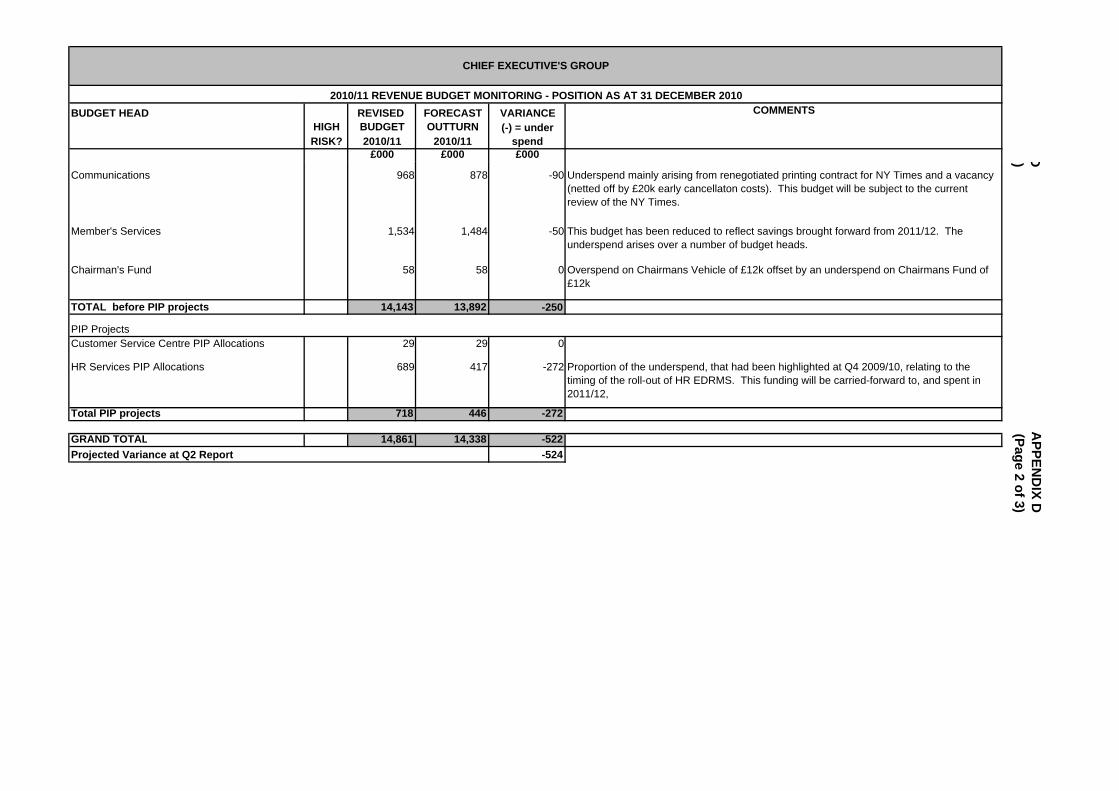
BUDGET HEAD REVISED FORECAST VARIANCEHIGH BUDGET OUTTURNRISK? 2010/11 2010/11
£000 £000 £000
CHIEF EXECUTIVE'S GROUP
2010/11 REVENUE BUDGET MONITORING - POSITION AS AT 31 DECEMBER 2010COMMENTS
(-) = under spend
Communications 968 878 -90
Member's Services 1,534 1,484 -50
Chairman's Fund 58 58 0
TOTAL before PIP projects 14,143 13,892 -250
PIP ProjectsCustomer Service Centre PIP Allocations 29 29 0
HR Services PIP Allocations 689 417 -272
Total PIP projects 718 446 -272
GRAND TOTAL 14,861 14,338 -522-524Projected Variance at Q2 Report
Proportion of the underspend, that had been highlighted at Q4 2009/10, relating to the timing of the roll-out of HR EDRMS. This funding will be carried-forward to, and spent in 2011/12,
This budget has been reduced to reflect savings brought forward from 2011/12. The underspend arises over a number of budget heads.
Underspend mainly arising from renegotiated printing contract for NY Times and a vacancy (netted off by £20k early cancellaton costs). This budget will be subject to the current review of the NY Times.
Overspend on Chairmans Vehicle of £12k offset by an underspend on Chairmans Fund of £12k
APPEN
DIX D
(Page 2 of 3)D)
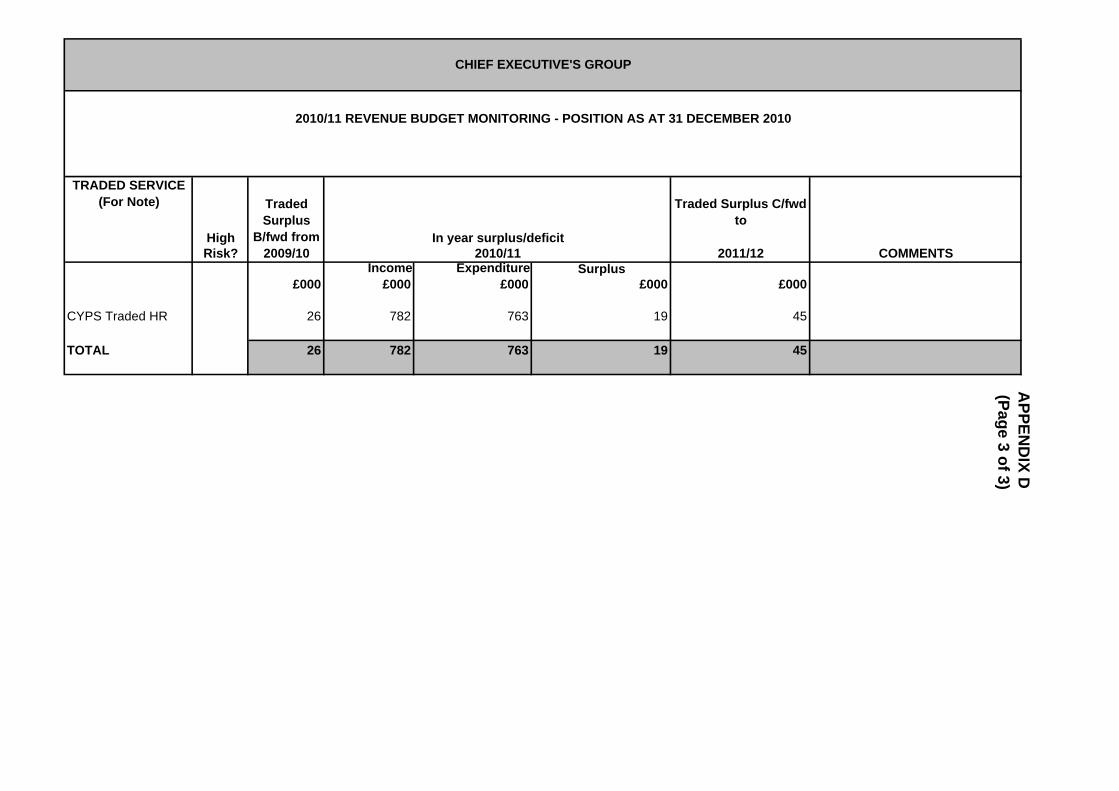
High
Traded Surplus
B/fwd from
Traded Surplus C/fwd to
Risk? 2009/10 2011/12Income Expenditure Surplus
£000 £000 £000 £000 £000
CYPS Traded HR 26 782 763 19 45
TOTAL 26 782 763 19 45
CHIEF EXECUTIVE'S GROUP
2010/11 REVENUE BUDGET MONITORING - POSITION AS AT 31 DECEMBER 2010
In year surplus/deficitCOMMENTS2010/11
TRADED SERVICE (For Note)
APPEN
DIX D
(Page 3 of 3)
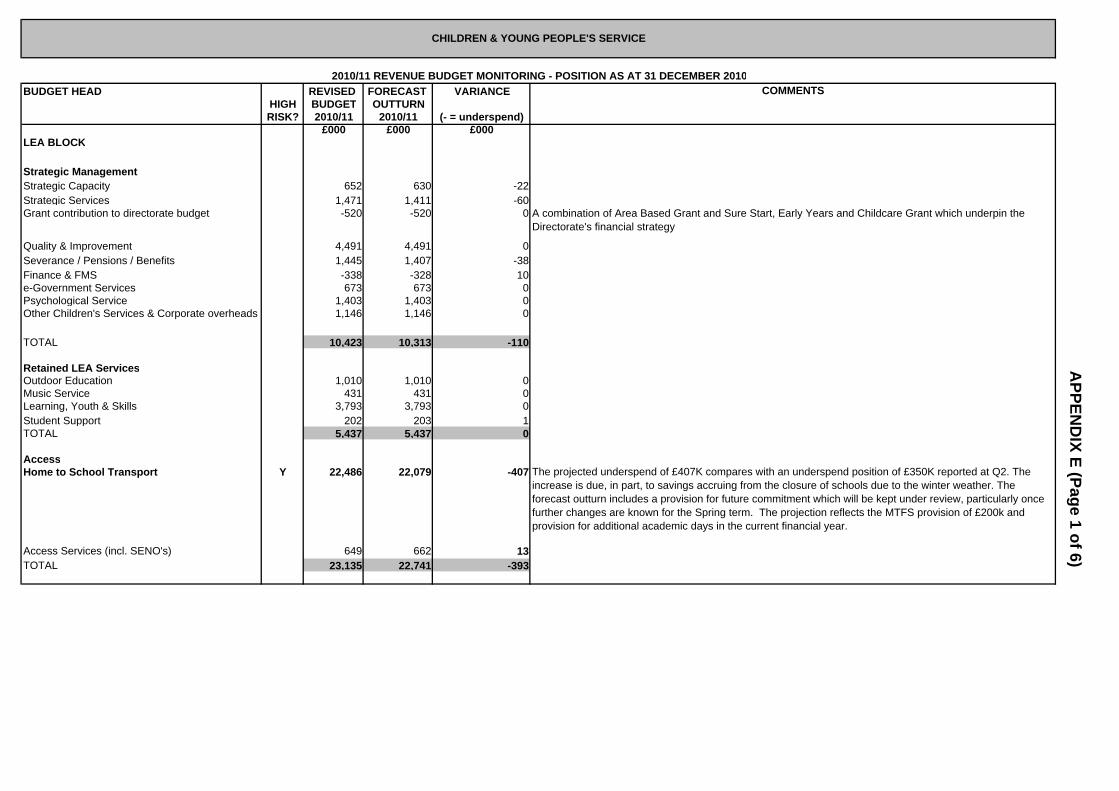
BUDGET HEAD REVISED FORECAST VARIANCEHIGH BUDGET OUTTURNRISK? 2010/11 2010/11 (- = underspend)
£000 £000 £000LEA BLOCK
Strategic ManagementStrategic Capacity 652 630 -22Strategic Services 1,471 1,411 -60Grant contribution to directorate budget -520 -520 0
Quality & Improvement 4,491 4,491 0Severance / Pensions / Benefits 1,445 1,407 -38Finance & FMS -338 -328 10e-Government Services 673 673 0Psychological Service 1,403 1,403 0Other Children's Services & Corporate overheads 1,146 1,146 0
TOTAL 10,423 10,313 -110
Retained LEA ServicesOutdoor Education 1,010 1,010 0Music Service 431 431 0Learning, Youth & Skills 3,793 3,793 0Student Support 202 203 1TOTAL 5,437 5,437 0
AccessHome to School Transport Y 22,486 22,079 -407
Access Services (incl. SENO's) 649 662 13TOTAL 23,135 22,741 -393
A combination of Area Based Grant and Sure Start, Early Years and Childcare Grant which underpin the Directorate's financial strategy
CHILDREN & YOUNG PEOPLE'S SERVICE
2010/11 REVENUE BUDGET MONITORING - POSITION AS AT 31 DECEMBER 2010COMMENTS
The projected underspend of £407K compares with an underspend position of £350K reported at Q2. The increase is due, in part, to savings accruing from the closure of schools due to the winter weather. The forecast outturn includes a provision for future commitment which will be kept under review, particularly once further changes are known for the Spring term. The projection reflects the MTFS provision of £200k and provision for additional academic days in the current financial year.
APPEN
DIX E (Page 1 of 6)
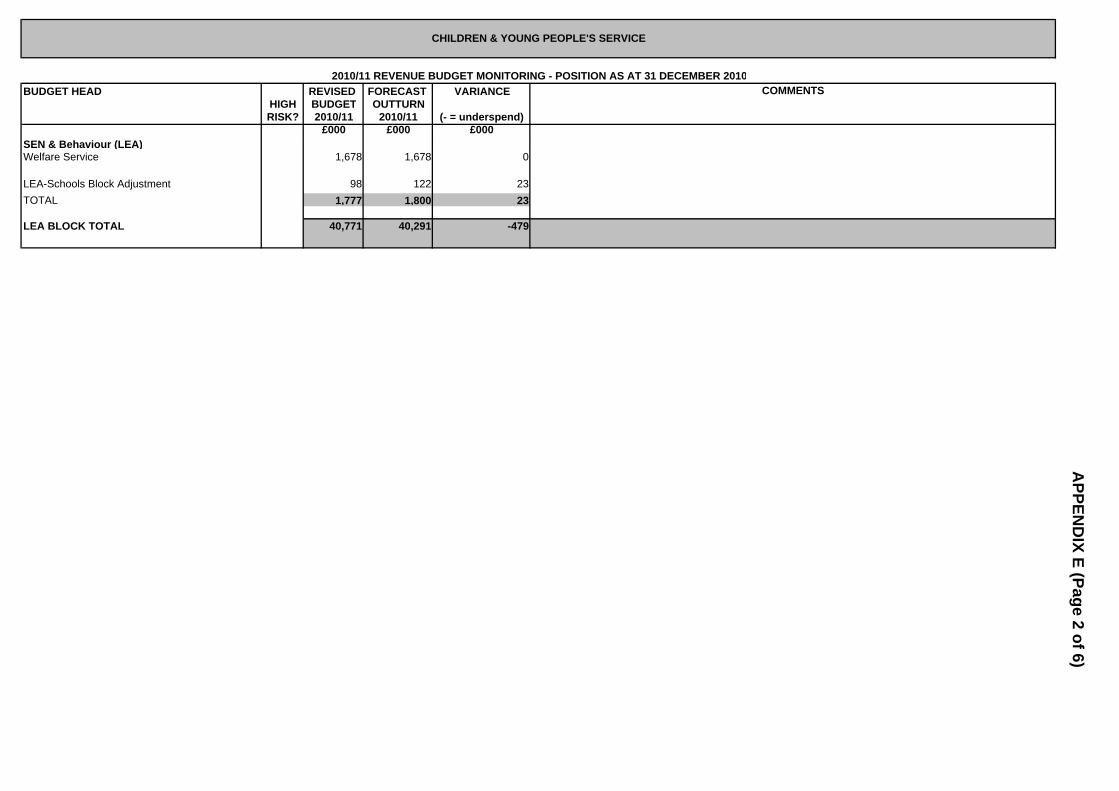
BUDGET HEAD REVISED FORECAST VARIANCEHIGH BUDGET OUTTURNRISK? 2010/11 2010/11 (- = underspend)
£000 £000 £000
CHILDREN & YOUNG PEOPLE'S SERVICE
2010/11 REVENUE BUDGET MONITORING - POSITION AS AT 31 DECEMBER 2010COMMENTS
SEN & Behaviour (LEA)Welfare Service 1,678 1,678 0
LEA-Schools Block Adjustment 98 122 23TOTAL 1,777 1,800 23
LEA BLOCK TOTAL 40,771 40,291 -479
APPEN
DIX E (Page 2 of 6)
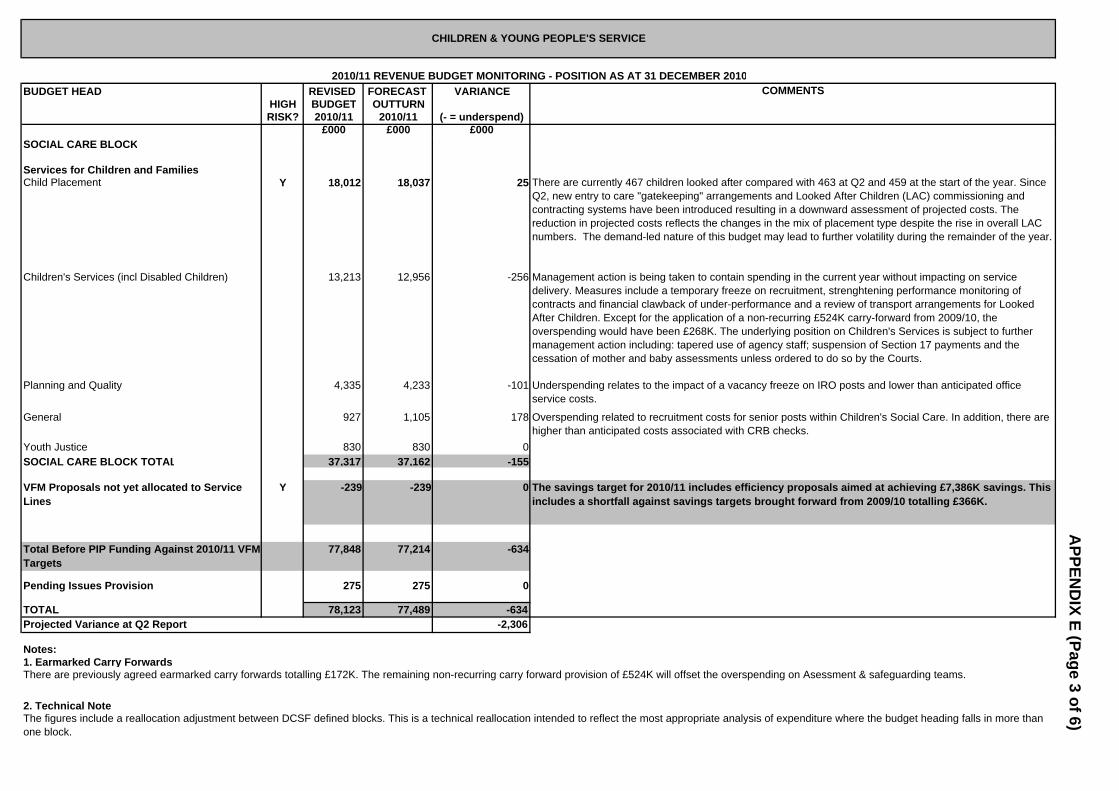
BUDGET HEAD REVISED FORECAST VARIANCEHIGH BUDGET OUTTURNRISK? 2010/11 2010/11 (- = underspend)
£000 £000 £000
CHILDREN & YOUNG PEOPLE'S SERVICE
2010/11 REVENUE BUDGET MONITORING - POSITION AS AT 31 DECEMBER 2010COMMENTS
SOCIAL CARE BLOCK
Services for Children and FamiliesChild Placement Y 18,012 18,037 25
Children's Services (incl Disabled Children) 13,213 12,956 -256
Planning and Quality 4,335 4,233 -101
General 927 1,105 178
Youth Justice 830 830 0SOCIAL CARE BLOCK TOTAL 37,317 37,162 -155
VFM Proposals not yet allocated to Service Lines
Y -239 -239 0
Total Before PIP Funding Against 2010/11 VFM Targets
77,848 77,214 -634
Pending Issues Provision 275 275 0
TOTAL 78,123 77,489 -634-2,306
Notes:1. Earmarked Carry Forwards
2. Technical Note
Underspending relates to the impact of a vacancy freeze on IRO posts and lower than anticipated office service costs.
There are currently 467 children looked after compared with 463 at Q2 and 459 at the start of the year. Since Q2, new entry to care "gatekeeping" arrangements and Looked After Children (LAC) commissioning and contracting systems have been introduced resulting in a downward assessment of projected costs. The reduction in projected costs reflects the changes in the mix of placement type despite the rise in overall LAC numbers. The demand-led nature of this budget may lead to further volatility during the remainder of the year.
Management action is being taken to contain spending in the current year without impacting on service delivery. Measures include a temporary freeze on recruitment, strenghtening performance monitoring of contracts and financial clawback of under-performance and a review of transport arrangements for Looked After Children. Except for the application of a non-recurring £524K carry-forward from 2009/10, the overspending would have been £268K. The underlying position on Children's Services is subject to further management action including: tapered use of agency staff; suspension of Section 17 payments and the cessation of mother and baby assessments unless ordered to do so by the Courts.
The figures include a reallocation adjustment between DCSF defined blocks. This is a technical reallocation intended to reflect the most appropriate analysis of expenditure where the budget heading falls in more than one block.
Overspending related to recruitment costs for senior posts within Children's Social Care. In addition, there are higher than anticipated costs associated with CRB checks.
There are previously agreed earmarked carry forwards totalling £172K. The remaining non-recurring carry forward provision of £524K will offset the overspending on Asessment & safeguarding teams.
The savings target for 2010/11 includes efficiency proposals aimed at achieving £7,386K savings. This includes a shortfall against savings targets brought forward from 2009/10 totalling £366K.
Projected Variance at Q2 Report
APPEN
DIX E (Page 3 of 6)
BUDGET HEAD REVISED FORECAST VARIANCEHIGH BUDGET OUTTURNRISK? 2010/11 2010/11 (- = underspend)
£000 £000 £000
CHILDREN & YOUNG PEOPLE'S SERVICE
2010/11 REVENUE BUDGET MONITORING - POSITION AS AT 31 DECEMBER 2010COMMENTS
SCHOOLS BLOCK/ DEDICATED SCHOOLS GRANT
SEN & Behaviour (Schools)Independent Fees & Recoupment 2,594 2,350 -244
Access Strategy, E-LAC and EMA 2,585 2,586 1Early Intervention 672 672 0TOTAL 5,850 5,608 -242
NetworksBehavioural, Emotional & Social Difficulties Y 5,549 5,799 250Cognition & Learning 692 692 0Sensory, Physical and Medical 1,067 1,110 43Communication & Interaction 619 619 0
7,926 8,220 294Schools & Early YearsISB & LMS Contingency 287,945 288,196 251
LSC (Sixth Form Funding) 2,075 2,075 0Mainstream Early Years 5,995 5,995 0Private, Voluntary and Independent Early Years Funding
8,174 8,174 0
Enhanced Mainstream Schools 2,669 2,668 -1Minority Ethnic Achievement Hub Schools 500 501 1Structural R&M 1,657 1,657 0Learning Platforms - Broadband 857 857 0TOTAL 309,873 310,123 250
Strategic ServicesStrategic Capacity 387 345 -42Catering Service 903 903 0TU Duties and Legal Fees 125 125 0Children's Services 101 0 -101
DSG Overheads 1,513 1,513 0Schools Causing Concern 600 600 0LEA-Schools Block Adjustment -98 -122 -23TOTAL 3,531 3,364 -167
Total 327,180 327,315 135
The projected underspending reflects the net impact of pupil changes against budgeted assumptions made at the commencement of the year. In addition, other local authorities have reduced their fees for placements where we have pupils placed.
There is no significant movement to the projected outturn reported at Q2. It is worth noting that, when reviewed in conjunction with the projected outturn position for Independent Fees & Recoupment - a projected underspend of £244K - the directorate anticipates to "break-even" on SEN.
Phased spending to support key aspects of the preventative agenda has resulted in a non-recurring underspend in 2010/11. The residual budget has been earmarked for Pupil Referral Unit in line with the planned implementation of the SEN & Behaviour Review.
APPEN
DIX E (Page 4 of 6)
BUDGET HEAD REVISED FORECAST VARIANCEHIGH BUDGET OUTTURNRISK? 2010/11 2010/11 (- = underspend)
£000 £000 £000
CHILDREN & YOUNG PEOPLE'S SERVICE
2010/11 REVENUE BUDGET MONITORING - POSITION AS AT 31 DECEMBER 2010COMMENTS
Unallocated Efficiency Savings 0
Dedicated Schools Grant -327,999 -327,999 0Unallocated DSG 819 683 -136
TOTAL 0 0 0
Notes:A. Efficiency SavingsThe Medium Term Financial Strategy (MTFS) is prepared with an assumption that the level of Dedicated Schools Grant will "go further" by 1.0% because of efficiency improvements, reflecting the approach in determining and fixing individual school budgets. Savings amounting to £350K have been allocated to individual service lines within the Schools Block.
(See Note B)
The forecast unallocated grant represents the net impact of projected spending. Following confirmation of the finalised DSG, £683K represents a projected underspend against the grant.
The finalised DSG allocation in support of the Schools Block is £327,999K
*
APPEN
DIX E (Page 5 of 6)
TRADED SERVICE High
Traded Surplus/Deficit (-)
B/fwd from
Traded Balance C/fwd to
Risk? 2009/10 2011/12
Turnover Expenditure Surplus/deficit (-)£000 £000 £000 £000 £000
Catering Y 773 13,810 13,762 48 821
Premises Scheme -254 5,650 5,396 254 0
Staff Absence Insurance Scheme 550 4,294 4,294 0 550
School's ICT 60 4,446 4,417 29 89
Outdoor Education Y 204 2,868 2,927 -59 145
FMS 29 1,306 1,328 -22 7
Other Traded Services 837 3,350 3,565 -215 622
GRAND TOTAL 2,200 35,724 35,689 35 2,235
Turnover consists of real income of £1,858k together with a contribution of £1,010K from the Outdoor Education Budget in CYPS.
The Catering Service is forecast to make an in-year operational surplus of £48K - this compares with a projected in-year deficit of £304K at Q2.
Staffing costs are broadly in line with budget. However, income targets may not be achieved. A decision not to purchase a Management Information System and a delay in purchasing new vehicles will yield savings in 2010/11.
A projected in-year surplus of £29K compares to a projected deficit of £48k at Q2. However, software licenses will now, by necessity, be incurred in 2010/11.
CHILDREN & YOUNG PEOPLE'S SERVICE
2010/11 REVENUE BUDGET MONITORING - POSITION AS AT 31 DECEMBER 2010
In year surplus/deficit
COMMENTS
2010/11
APPEN
DIX E
(Page 6 of 6)
**
*
REVISED FORECAST VARIANCEHIGH BUDGET OUTTURNRISK? 2010/11 2010/11
£000 £000 £000Financial Services Base budget 5,219 5,153 -66 Carry forward from 2009/10 118 0 -118
Total 5,337 5,153 -184Strategic Transformation and Integration Capability - Scanning Bureau Carry forward from 2009/10 -186 37 223
Strategic Transformation and Integration Capability PIP 323 323 0 Carry forward (PIP) 237 54 -183
Total 560 377 -183Corporate Procurement Base budget 474 474 0 Carry forward from 2009/10 9 1 -8
Total 483 475 -8ICT ServicesICT Services - Operational Base budget 4,058 4,058 0 PIP 191 191 0 Carry forward from 2009/10 15 5 -10 Underpend due to staff vacancies and savings on training. Total 4,264 4,254 -10ICT Services - Developments Y Base budget 416 416 0 Carry forward from 2009/10 1,664 1,141 -523 Total 2,080 1,557 -523ICT Recharged Services Y Base budget -707 -683 24 Additional Novell Support Costs Carry forward from 2009/10 -258 258 Total -965 -683 282WAN Base budget 863 863 0 Budget fully committed via Nynet. PIP 600 600 0 Budget transfer -1,356 -1,356 0 Budget now devolved to Directorates Total 107 107 0ICT Services sub-total 5,486 5,235 -251
The underspend is primarily the 2009/10 carry forward. The underspend will be used to fund non-recurring priorities in the Directorate (e.g. replacement server for Financial Services).
FINANCE & CENTRAL SERVICES
COMMENTS(-) = under
spend
BUDGET HEAD2010/11 REVENUE BUDGET MONITORING - POSITION AS AT 31 DECEMBER 2010
The underspend is due to higher than expected income from rebates on corporate contracts.
Will be utilised to help fund Microsoft Transition (Business Case pending)
Up-front expenditure on Scanning bureau will be offset by income from Directorates over future years. At this stage no allowance has been made for the income from the initial scanning to be carried out later in 2010/11. In effect the deficit will be 'funded' by the rest of the Directorate budget until cost-recovery is achieved.
The underspend arises following a budget review, including the profile of spend to 2013/14. This will be available to meet future STIC programme costs.
Upfront expenditure on infrastructure that will be offset by income from Directorates over future years. A
PPEND
IX F (Page 1 of 4)
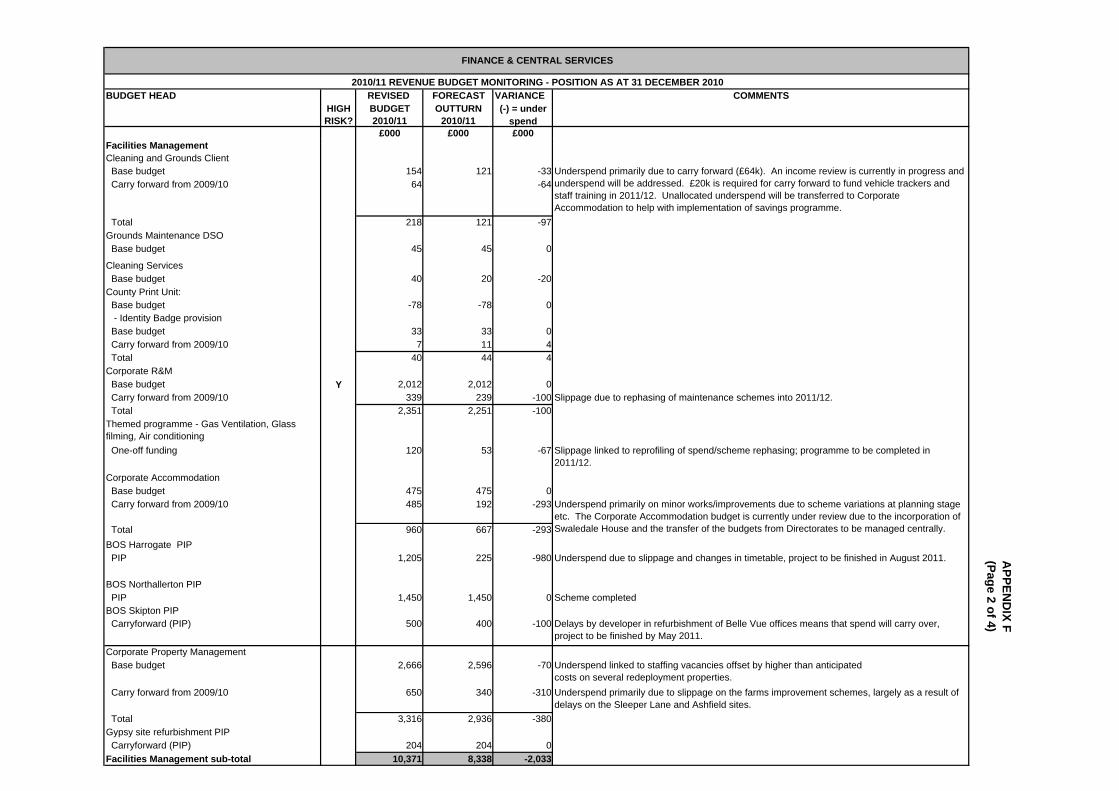
REVISED FORECAST VARIANCEHIGH BUDGET OUTTURNRISK? 2010/11 2010/11
£000 £000 £000
FINANCE & CENTRAL SERVICES
COMMENTS(-) = under
spend
BUDGET HEAD2010/11 REVENUE BUDGET MONITORING - POSITION AS AT 31 DECEMBER 2010
Facilities ManagementCleaning and Grounds Client Base budget 154 121 -33 Carry forward from 2009/10 64 -64
Total 218 121 -97Grounds Maintenance DSO Base budget 45 45 0
Cleaning Services Base budget 40 20 -20County Print Unit: Base budget -78 -78 0 - Identity Badge provision Base budget 33 33 0 Carry forward from 2009/10 7 11 4 Total 40 44 4Corporate R&M Base budget Y 2,012 2,012 0 Carry forward from 2009/10 339 239 -100 Slippage due to rephasing of maintenance schemes into 2011/12. Total 2,351 2,251 -100Themed programme - Gas Ventilation, Glass filming, Air conditioning One-off funding 120 53 -67
Corporate Accommodation Base budget 475 475 0 Carry forward from 2009/10 485 192 -293
Total 960 667 -293BOS Harrogate PIP PIP 1,205 225 -980
BOS Northallerton PIP PIP 1,450 1,450 0BOS Skipton PIP Carryforward (PIP) 500 400 -100
Corporate Property Management Base budget 2,666 2,596 -70 Underspend linked to staffing vacancies offset by higher than anticipated
costs on several redeployment properties. Carry forward from 2009/10 650 340 -310
Total 3,316 2,936 -380Gypsy site refurbishment PIP Carryforward (PIP) 204 204 0Facilities Management sub-total 10,371 8,338 -2,033
Underspend primarily due to slippage on the farms improvement schemes, largely as a result of delays on the Sleeper Lane and Ashfield sites.
Underspend primarily due to carry forward (£64k). An income review is currently in progress and underspend will be addressed. £20k is required for carry forward to fund vehicle trackers and staff training in 2011/12. Unallocated underspend will be transferred to Corporate Accommodation to help with implementation of savings programme.
Scheme completed
Slippage linked to reprofiling of spend/scheme rephasing; programme to be completed in 2011/12.
Underspend primarily on minor works/improvements due to scheme variations at planning stage etc. The Corporate Accommodation budget is currently under review due to the incorporation of Swaledale House and the transfer of the budgets from Directorates to be managed centrally.
Underspend due to slippage and changes in timetable, project to be finished in August 2011.
Delays by developer in refurbishment of Belle Vue offices means that spend will carry over, project to be finished by May 2011.
APPEN
DIX F
(Page 2 of 4)
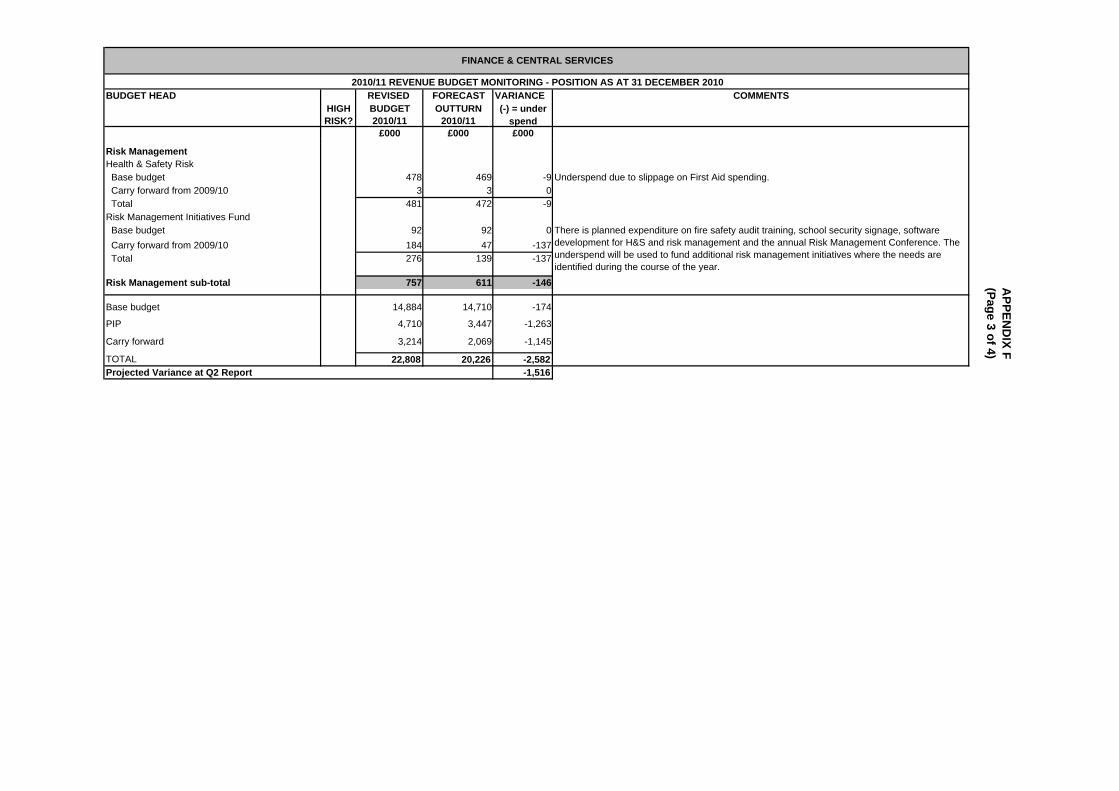
REVISED FORECAST VARIANCEHIGH BUDGET OUTTURNRISK? 2010/11 2010/11
£000 £000 £000
FINANCE & CENTRAL SERVICES
COMMENTS(-) = under
spend
BUDGET HEAD2010/11 REVENUE BUDGET MONITORING - POSITION AS AT 31 DECEMBER 2010
Risk ManagementHealth & Safety Risk Base budget 478 469 -9 Underspend due to slippage on First Aid spending. Carry forward from 2009/10 3 3 0 Total 481 472 -9Risk Management Initiatives Fund Base budget 92 92 0 Carry forward from 2009/10 184 47 -137 Total 276 139 -137
Risk Management sub-total 757 611 -146
Base budget 14,884 14,710 -174
PIP 4,710 3,447 -1,263
Carry forward 3,214 2,069 -1,145
TOTAL 22,808 20,226 -2,582-1,516Projected Variance at Q2 Report
There is planned expenditure on fire safety audit training, school security signage, software development for H&S and risk management and the annual Risk Management Conference. The underspend will be used to fund additional risk management initiatives where the needs are identified during the course of the year.
APPEN
DIX F
(Page 3 of 4)
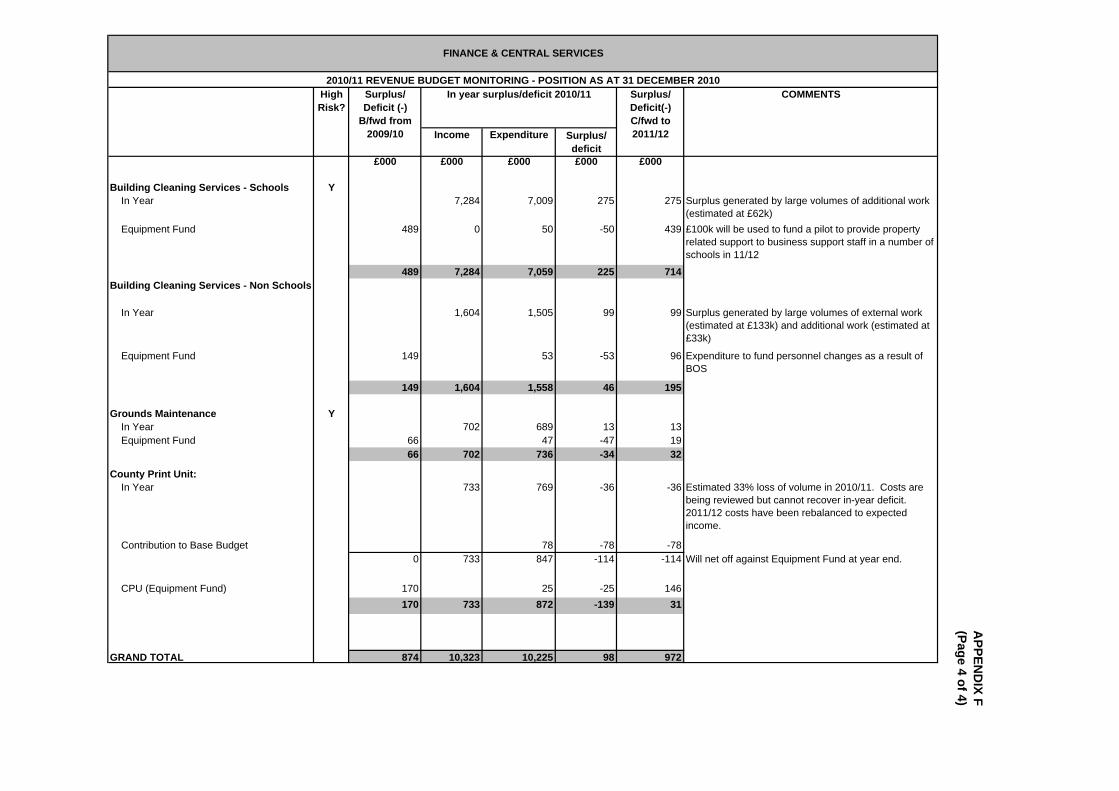
High Risk?
Income Expenditure Surplus/ deficit
£000 £000 £000 £000 £000
Building Cleaning Services - Schools Y In Year 7,284 7,009 275 275
Equipment Fund 489 0 50 -50 439
489 7,284 7,059 225 714Building Cleaning Services - Non Schools
In Year 1,604 1,505 99 99
Equipment Fund 149 53 -53 96
149 1,604 1,558 46 195
Grounds Maintenance Y In Year 702 689 13 13 Equipment Fund 66 47 -47 19
66 702 736 -34 32
County Print Unit: In Year 733 769 -36 -36
Contribution to Base Budget 78 -78 -780 733 847 -114 -114
CPU (Equipment Fund) 170 25 -25 146170 733 872 -139 31
GRAND TOTAL 874 10,323 10,225 98 972
COMMENTS
Estimated 33% loss of volume in 2010/11. Costs are being reviewed but cannot recover in-year deficit. 2011/12 costs have been rebalanced to expected income.
Surplus generated by large volumes of additional work (estimated at £62k)
Will net off against Equipment Fund at year end.
Surplus generated by large volumes of external work (estimated at £133k) and additional work (estimated at £33k)
In year surplus/deficit 2010/11
FINANCE & CENTRAL SERVICES
2010/11 REVENUE BUDGET MONITORING - POSITION AS AT 31 DECEMBER 2010Surplus/ Deficit (-)
B/fwd from 2009/10
Surplus/ Deficit(-) C/fwd to 2011/12
£100k will be used to fund a pilot to provide property related support to business support staff in a number of schools in 11/12
Expenditure to fund personnel changes as a result of BOS
APPEN
DIX F
(Page 4 of 4)
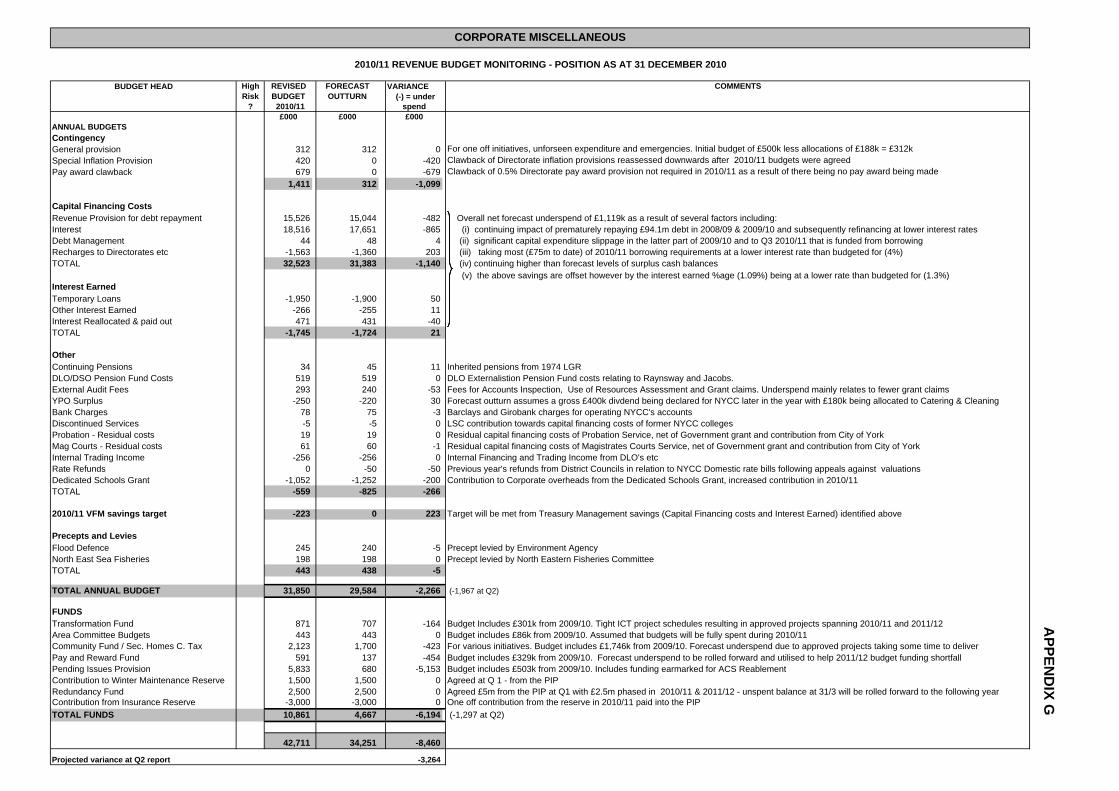
BUDGET HEAD High REVISED FORECAST VARIANCE COMMENTSRisk BUDGET OUTTURN (-) = under
? spend£000 £000 £000
ANNUAL BUDGETSContingencyGeneral provision 312 312 0 For one off initiatives, unforseen expenditure and emergencies. Initial budget of £500k less allocations of £188k = £312kSpecial Inflation Provision 420 0 -420 Clawback of Directorate inflation provisions reassessed downwards after 2010/11 budgets were agreedPay award clawback 679 0 -679 Clawback of 0.5% Directorate pay award provision not required in 2010/11 as a result of there being no pay award being made
1,411 312 -1,099
Capital Financing CostsRevenue Provision for debt repayment 15,526 15,044 -482 Overall net forecast underspend of £1,119k as a result of several factors including:Interest 18,516 17,651 -865 (i) continuing impact of prematurely repaying £94.1m debt in 2008/09 & 2009/10 and subsequently refinancing at lower interest ratesDebt Management 44 48 4 (ii) significant capital expenditure slippage in the latter part of 2009/10 and to Q3 2010/11 that is funded from borrowingRecharges to Directorates etc -1,563 -1,360 203 (iii) taking most (£75m to date) of 2010/11 borrowing requirements at a lower interest rate than budgeted for (4%)TOTAL 32,523 31,383 -1,140 (iv) continuing higher than forecast levels of surplus cash balances
(v) the above savings are offset however by the interest earned %age (1.09%) being at a lower rate than budgeted for (1.3%)Interest EarnedTemporary Loans -1,950 -1,900 50Other Interest Earned -266 -255 11Interest Reallocated & paid out 471 431 -40TOTAL -1,745 -1,724 21
OtherContinuing Pensions 34 45 11 Inherited pensions from 1974 LGRDLO/DSO Pension Fund Costs 519 519 0 DLO Externalistion Pension Fund costs relating to Raynsway and Jacobs. External Audit Fees 293 240 -53 Fees for Accounts Inspection, Use of Resources Assessment and Grant claims. Underspend mainly relates to fewer grant claimsYPO Surplus -250 -220 30 Forecast outturn assumes a gross £400k divdend being declared for NYCC later in the year with £180k being allocated to Catering & CleaningBank Charges 78 75 -3 Barclays and Girobank charges for operating NYCC's accountsDiscontinued Services -5 -5 0 LSC contribution towards capital financing costs of former NYCC collegesProbation - Residual costs 19 19 0 Residual capital financing costs of Probation Service, net of Government grant and contribution from City of YorkMag Courts - Residual costs 61 60 -1 Residual capital financing costs of Magistrates Courts Service, net of Government grant and contribution from City of YorkInternal Trading Income -256 -256 0 Internal Financing and Trading Income from DLO's etcRate Refunds 0 -50 -50 Previous year's refunds from District Councils in relation to NYCC Domestic rate bills following appeals against valuationsDedicated Schools Grant -1,052 -1,252 -200 Contribution to Corporate overheads from the Dedicated Schools Grant, increased contribution in 2010/11TOTAL -559 -825 -266
2010/11 VFM savings target -223 0 223 Target will be met from Treasury Management savings (Capital Financing costs and Interest Earned) identified above
Precepts and LeviesFlood Defence 245 240 -5 Precept levied by Environment AgencyNorth East Sea Fisheries 198 198 0 Precept levied by North Eastern Fisheries CommitteeTOTAL 443 438 -5
TOTAL ANNUAL BUDGET 31,850 29,584 -2,266 (-1,967 at Q2)
FUNDSTransformation Fund 871 707 -164 Budget Includes £301k from 2009/10. Tight ICT project schedules resulting in approved projects spanning 2010/11 and 2011/12Area Committee Budgets 443 443 0 Budget includes £86k from 2009/10. Assumed that budgets will be fully spent during 2010/11Community Fund / Sec. Homes C. Tax 2,123 1,700 -423 For various initiatives. Budget includes £1,746k from 2009/10. Forecast underspend due to approved projects taking some time to deliverPay and Reward Fund 591 137 -454 Budget includes £329k from 2009/10. Forecast underspend to be rolled forward and utilised to help 2011/12 budget funding shortfallPending Issues Provision 5,833 680 -5,153 Budget includes £503k from 2009/10. Includes funding earmarked for ACS Reablement Contribution to Winter Maintenance Reserve 1,500 1,500 0 Agreed at Q 1 - from the PIPRedundancy Fund 2,500 2,500 0 Agreed £5m from the PIP at Q1 with £2.5m phased in 2010/11 & 2011/12 - unspent balance at 31/3 will be rolled forward to the following yearContribution from Insurance Reserve -3,000 -3,000 0 One off contribution from the reserve in 2010/11 paid into the PIPTOTAL FUNDS 10,861 4,667 -6,194 (-1,297 at Q2)
42,711 34,251 -8,460
Projected variance at Q2 report -3,264
CORPORATE MISCELLANEOUS
2010/11 REVENUE BUDGET MONITORING - POSITION AS AT 31 DECEMBER 2010
2010/11
APPEN
DIX G
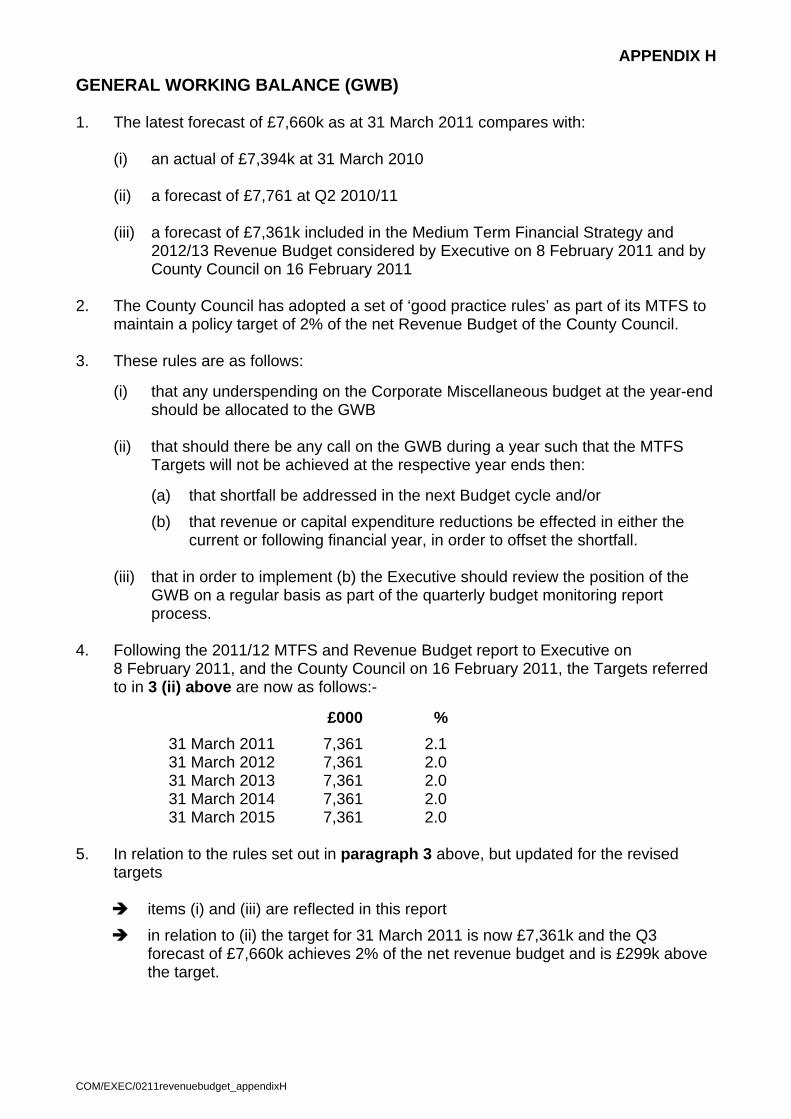
APPENDIX H
GENERAL WORKING BALANCE (GWB) 1. The latest forecast of £7,660k as at 31 March 2011 compares with:
(i) an actual of £7,394k at 31 March 2010
(ii) a forecast of £7,761 at Q2 2010/11 (iii) a forecast of £7,361k included in the Medium Term Financial Strategy and
2012/13 Revenue Budget considered by Executive on 8 February 2011 and by County Council on 16 February 2011
2. The County Council has adopted a set of ‘good practice rules’ as part of its MTFS to
maintain a policy target of 2% of the net Revenue Budget of the County Council. 3. These rules are as follows:
(i) that any underspending on the Corporate Miscellaneous budget at the year-end should be allocated to the GWB
(ii) that should there be any call on the GWB during a year such that the MTFS
Targets will not be achieved at the respective year ends then:
(a) that shortfall be addressed in the next Budget cycle and/or (b) that revenue or capital expenditure reductions be effected in either the
current or following financial year, in order to offset the shortfall.
(iii) that in order to implement (b) the Executive should review the position of the GWB on a regular basis as part of the quarterly budget monitoring report process.
4. Following the 2011/12 MTFS and Revenue Budget report to Executive on
8 February 2011, and the County Council on 16 February 2011, the Targets referred to in 3 (ii) above are now as follows:-
£000 % 31 March 2011 7,361 2.1 31 March 2012 7,361 2.0 31 March 2013 7,361 2.0 31 March 2014 7,361 2.0 31 March 2015 7,361 2.0
5. In relation to the rules set out in paragraph 3 above, but updated for the revised
targets
items (i) and (iii) are reflected in this report in relation to (ii) the target for 31 March 2011 is now £7,361k and the Q3
forecast of £7,660k achieves 2% of the net revenue budget and is £299k above the target.
COM/EXEC/0211revenuebudget_appendixH
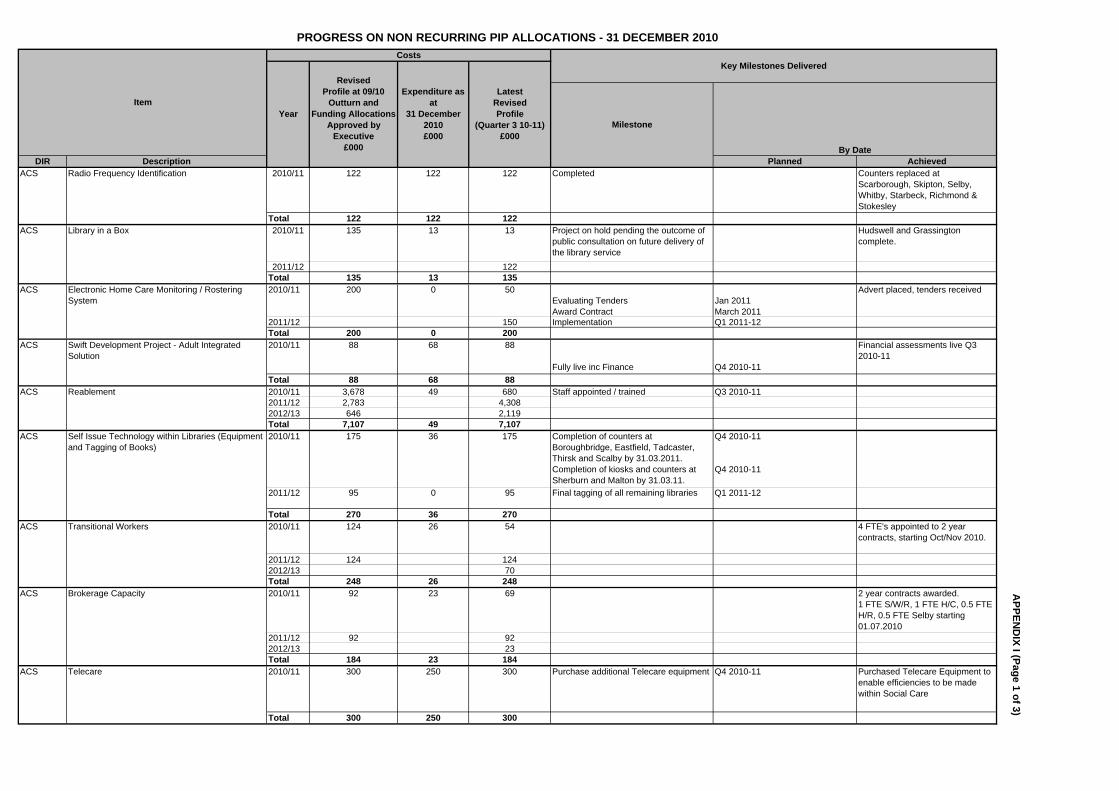
DIR Description Planned Achieved2010/11 122 122 122 Completed Counters replaced at
Scarborough, Skipton, Selby, Whitby, Starbeck, Richmond & Stokesley
Total 122 122 1222010/11 135 13 13 Project on hold pending the outcome of
public consultation on future delivery of the library service
Hudswell and Grassington complete.
2011/12 122Total 135 13 1352010/11 200 0 50
Evaluating TendersAward Contract
Jan 2011March 2011
Advert placed, tenders received
2011/12 150 Implementation Q1 2011-12Total 200 0 2002010/11 88 68 88
Fully live inc Finance Q4 2010-11
Financial assessments live Q3 2010-11
Total 88 68 882010/11 3,678 49 680 Staff appointed / trained Q3 2010-112011/12 2,783 4,3082012/13 646 2,119Total 7,107 49 7,1072010/11 175 36 175 Completion of counters at
Boroughbridge, Eastfield, Tadcaster, Thirsk and Scalby by 31.03.2011.Completion of kiosks and counters at Sherburn and Malton by 31.03.11.
Q4 2010-11
Q4 2010-11
2011/12 95 0 95 Final tagging of all remaining libraries Q1 2011-12
Total 270 36 2702010/11 124 26 54 4 FTE's appointed to 2 year
contracts, starting Oct/Nov 2010.
2011/12 124 1242012/13 70Total 248 26 2482010/11 92 23 69 2 year contracts awarded.
1 FTE S/W/R, 1 FTE H/C, 0.5 FTE H/R, 0.5 FTE Selby starting 01.07.2010
2011/12 92 922012/13 23Total 184 23 1842010/11 300 250 300 Purchase additional Telecare equipment Q4 2010-11 Purchased Telecare Equipment to
enable efficiencies to be made within Social Care
Total 300 250 300
ACS Telecare
ACS Transitional Workers
ACS Brokerage Capacity
ACS Reablement
ACS Self Issue Technology within Libraries (Equipment and Tagging of Books)
ACS Electronic Home Care Monitoring / Rostering System
ACS Swift Development Project - Adult Integrated Solution
ACS Radio Frequency Identification
ACS Library in a Box
PROGRESS ON NON RECURRING PIP ALLOCATIONS - 31 DECEMBER 2010
Item
CostsKey Milestones Delivered
Milestone
By Date
Year
RevisedProfile at 09/10
Outturn and Funding Allocations
Approved byExecutive
£000
LatestRevisedProfile
(Quarter 3 10-11)£000
Expenditure as at
31 December 2010£000
APPEN
DIX I (Page 1 of 3)
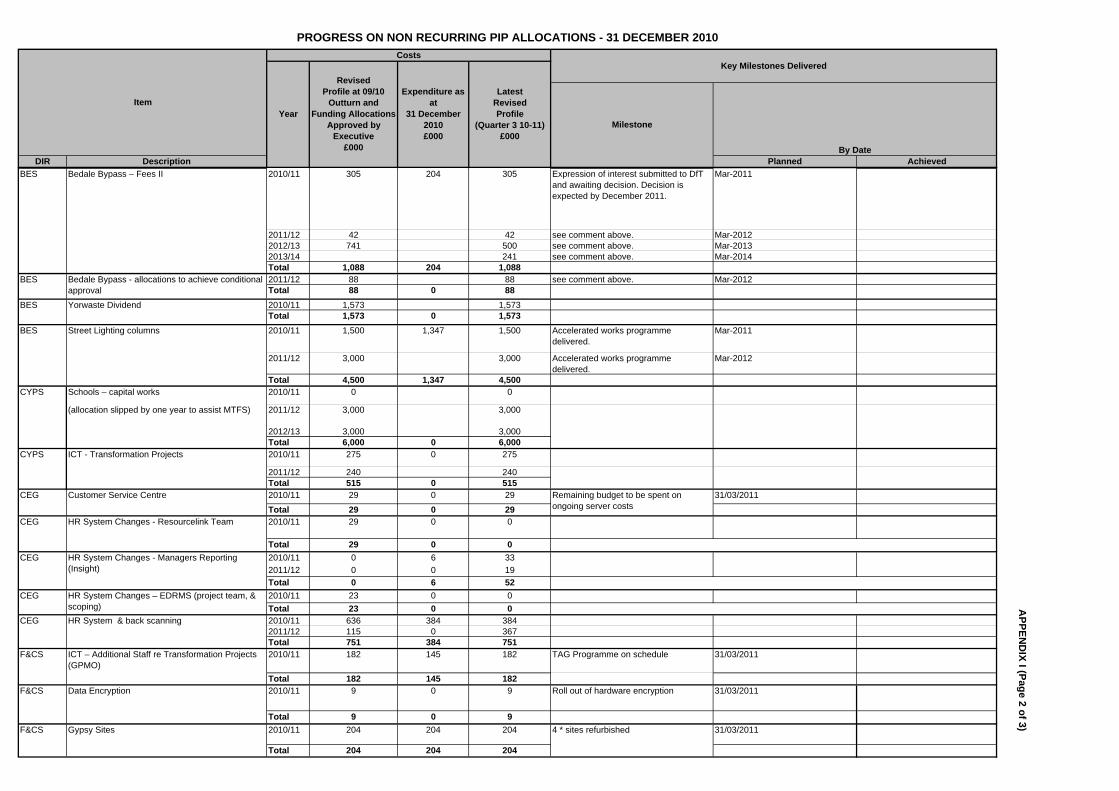
DIR Description Planned Achieved
PROGRESS ON NON RECURRING PIP ALLOCATIONS - 31 DECEMBER 2010
Item
CostsKey Milestones Delivered
Milestone
By Date
Year
RevisedProfile at 09/10
Outturn and Funding Allocations
Approved byExecutive
£000
LatestRevisedProfile
(Quarter 3 10-11)£000
Expenditure as at
31 December 2010£000
2010/11 305 204 305 Expression of interest submitted to DfT and awaiting decision. Decision is expected by December 2011.
Mar-2011
2011/12 42 42 see comment above. Mar-20122012/13 741 500 see comment above. Mar-20132013/14 241 see comment above. Mar-2014Total 1,088 204 1,0882011/12 88 88 see comment above. Mar-2012
2010/11 1,573 1,573
2010/11 1,500 1,347 1,500 Accelerated works programme delivered.
Mar-2011
2011/12 3,000 3,000 Accelerated works programme delivered.
Mar-2012
Total 4,500 1,347 4,500CYPS Schools – capital works 2010/11 0 0
(allocation slipped by one year to assist MTFS) 2011/12 3,000 3,000
2012/13 3,000 3,000Total 6,000 0 6,000
CYPS ICT - Transformation Projects 2010/11 275 0 275
2011/12 240 240Total 515 0 5152010/11 29 0 29 31/03/2011
Total 29 0 292010/11 29 0 0
Total 29 0 02010/11 0 6 332011/12 0 0 19Total 0 6 522010/11 23 0 0Total 23 0 02010/11 636 384 3842011/12 115 0 367Total 751 384 7512010/11 182 145 182 TAG Programme on schedule 31/03/2011
Total 182 145 1822010/11 9 0 9 Roll out of hardware encryption 31/03/2011
Total 9 0 92010/11 204 204 204 31/03/2011
Total 204 204 204
BES Bedale Bypass – Fees II
BES Street Lighting columns
BES Yorwaste Dividend
BES Bedale Bypass - allocations to achieve conditional approval Total 88
CEG Customer Service Centre Remaining budget to be spent on ongoing server costs
0 88
CEG HR System Changes - Resourcelink Team
CEG HR System Changes - Managers Reporting (Insight)
CEG HR System Changes – EDRMS (project team, & scoping)
CEG HR System & back scanning
F&CS ICT – Additional Staff re Transformation Projects (GPMO)
F&CS Data Encryption
F&CS Gypsy Sites 4 * sites refurbished
Total 1,573 0 1,573
APPEN
DIX I (Page 2 of 3)
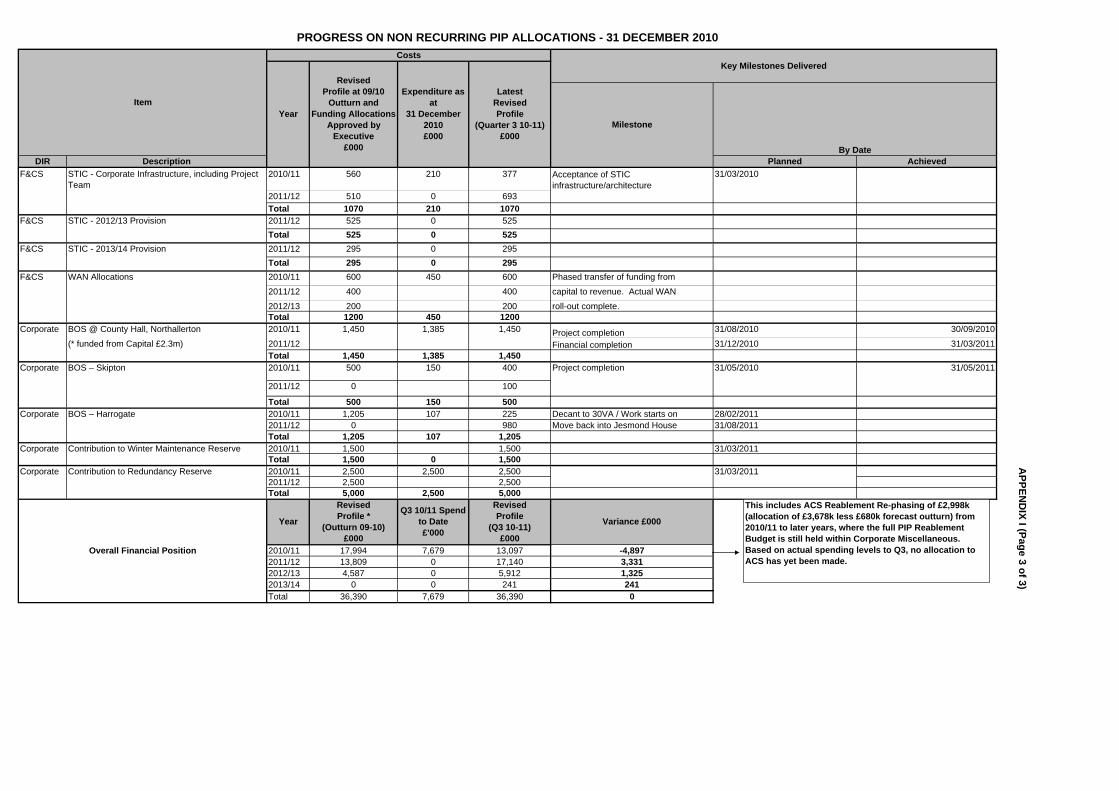
DIR Description Planned Achieved
PROGRESS ON NON RECURRING PIP ALLOCATIONS - 31 DECEMBER 2010
Item
CostsKey Milestones Delivered
Milestone
By Date
Year
RevisedProfile at 09/10
Outturn and Funding Allocations
Approved byExecutive
£000
LatestRevisedProfile
(Quarter 3 10-11)£000
Expenditure as at
31 December 2010£000
2010/11 560 210 377 Acceptance of STIC infrastructure/architecture
31/03/2010
2011/12 510 0 693Total 1070 210 10702011/12 525 0 525Total 525 0 5252011/12 295 0 295Total 295 0 2952010/11 600 450 600 Phased transfer of funding from
2011/12 400 400 capital to revenue. Actual WAN
2012/13 200 200 roll-out complete. Total 1200 450 1200
BOS @ County Hall, Northallerton 2010/11 1,450 1,385 1,450 Project completion 31/08/2010 30/09/2010
(* funded from Capital £2.3m) 2011/12 Financial completion 31/12/2010 31/03/2011Total 1,450 1,385 1,450
Corporate BOS – Skipton 2010/11 500 150 400
2011/12 0 100
Total 500 150 500Corporate BOS – Harrogate 2010/11 1,205 107 225 Decant to 30VA / Work starts on 28/02/2011
2011/12 0 980 Move back into Jesmond House 31/08/2011Total 1,205 107 1,205
Corporate Contribution to Winter Maintenance Reserve 2010/11 1,500 1,500 31/03/2011Total 1,500 0 1,500
Corporate Contribution to Redundancy Reserve 2010/11 2,500 2,500 2,500 31/03/20112011/12 2,500 2,500Total 5,000 2,500 5,000
2010/11 17,994 7,679 13,097 -4,8972011/12 13,809 0 17,140 3,3312012/13 4,587 0 5,912 1,3252013/14 0 0 241 241Total 36,390 7,679 36,390 0
F&CS STIC - Corporate Infrastructure, including Project Team
F&CS STIC - 2012/13 Provision
F&CS STIC - 2013/14 Provision
RevisedProfile
(Q3 10-11)£000
Variance £000
F&CS WAN Allocations
Corporate
Project completion
Overall Financial Position
Year
RevisedProfile *
(Outturn 09-10)£000
Q3 10/11 Spend to Date£'000
31/05/201131/05/2010
This includes ACS Reablement Re-phasing of £2,998k (allocation of £3,678k less £680k forecast outturn) from 2010/11 to later years, where the full PIP Reablement Budget is still held within Corporate Miscellaneous. Based on actual spending levels to Q3, no allocation to ACS has yet been made.
APPEN
DIX I (Page 3 of 3)
8.0 CAPITAL PLAN Overview 8.1 This 2010/11 Q3 report continues to reflect the Capital Plan being split in to two
components – a Capital Programme and a Capital Forecast. This development flows from the Corporate Capital Project Management process (using Gateway principles) which is now in operation with the two components being as follows:-
(a) a Capital Programme – of schemes that have passed the necessary
Gateways and are proceeding to construction; slippage on these schemes should be negligible because experience shows that most slippage takes place in the preparatory stages of a scheme
(b) a Capital Forecast – of schemes for which the preparatory process has not
progressed to the point where they can enter the Capital Programme. Analysis has shown that it is these schemes that suffer slippage due to a wide range of internal and external factors.
8.2 The paragraphs that follow update the Capital Programme/Forecast in the light of
ongoing policy and operational developments. 8.3 The supporting information for this section of the report is contained in Annex D
which consists of several appendices that are referred to in the text. 8.4 Details at individual scheme/project level are not attached to this report but are
available on request. However summaries for each Directorate analysed into the main areas of capital spending are attached as Appendices A to D, with an overall County Summary at Appendix E.
8.5 Given the future financial scenario detailed in the Medium Term Financial Strategy
report to the Executive on 8 February 2011, a review of the schemes in the Capital Programme and Capital Forecast that are financed by capital receipts and/or prudential borrowing will be undertaken to ensure that the purpose of each scheme is still consistent with the requirement of the Service involved given the Budget reductions that are having to be made by each Service.
8.6 The updated Capital Plan for Q3 2010/11 is based on the last version (Q2 2010/11)
approved by Executive on 16 November 2010 but incorporates the following:-
• the implications of capital approvals announced as part of the Provisional Local Government Finance Settlement on 13 December 2010 (paragraphs 8.14 to 8.17)
• the addition of a further year (2013/14) to the Capital Plan (paragraphs 8.18 to 8.21)
• movements between Capital Forecast and Capital Programme referred to in paragraph 8.1 above
• additions or variations to schemes that are self funded (ie through grants contributions, revenue contributions and earmarked capital receipts)
• necessary re-phasing of expenditure between years
COMREP/Exec/0211capplan_sect8
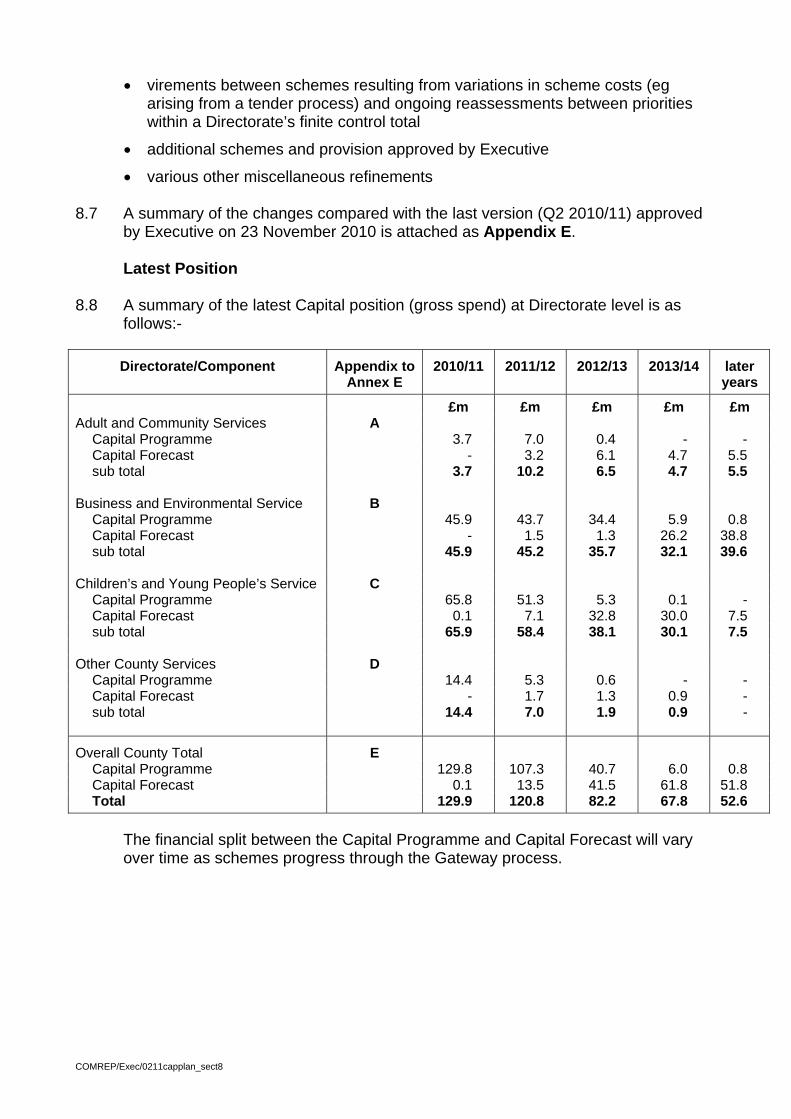
• virements between schemes resulting from variations in scheme costs (eg arising from a tender process) and ongoing reassessments between priorities within a Directorate’s finite control total
• additional schemes and provision approved by Executive
• various other miscellaneous refinements 8.7 A summary of the changes compared with the last version (Q2 2010/11) approved
by Executive on 23 November 2010 is attached as Appendix E.
Latest Position 8.8 A summary of the latest Capital position (gross spend) at Directorate level is as
follows:-
Directorate/Component Appendix to Annex E
2010/11 2011/12 2012/13 2013/14 later years
£m £m £m £m £m Adult and Community Services A
Capital Programme 3.7 7.0 0.4 - - Capital Forecast - 3.2 6.1 4.7 5.5 sub total 3.7 10.2 6.5 4.7 5.5
Business and Environmental Service B
Capital Programme 45.9 43.7 34.4 5.9 0.8 Capital Forecast - 1.5 1.3 26.2 38.8 sub total 45.9 45.2 35.7 32.1 39.6
Children’s and Young People’s Service C
Capital Programme 65.8 51.3 5.3 0.1 - Capital Forecast 0.1 7.1 32.8 30.0 7.5 sub total 65.9 58.4 38.1 30.1 7.5
Other County Services D
Capital Programme 14.4 5.3 0.6 - - Capital Forecast - 1.7 1.3 0.9 - sub total 14.4 7.0 1.9 0.9 -
Overall County Total E Capital Programme 129.8 107.3 40.7 6.0 0.8 Capital Forecast 0.1 13.5 41.5 61.8 51.8 Total 129.9 120.8 82.2 67.8 52.6
The financial split between the Capital Programme and Capital Forecast will vary over time as schemes progress through the Gateway process.
COMREP/Exec/0211capplan_sect8
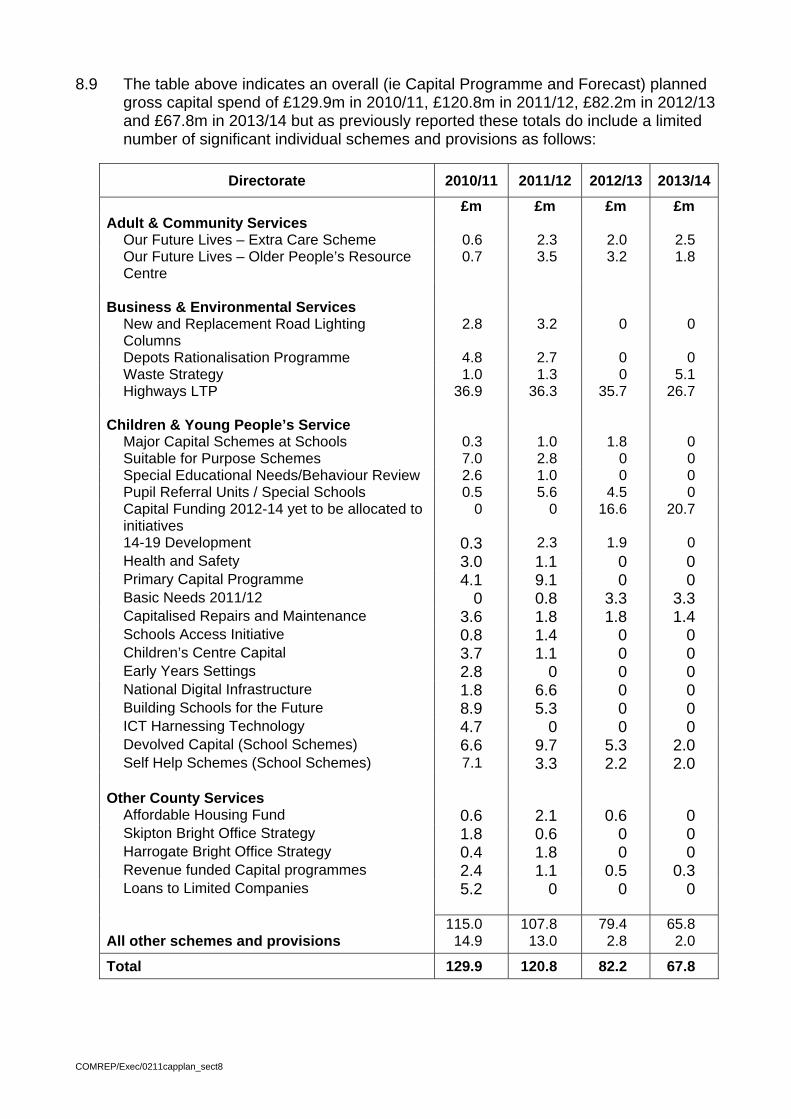
8.9 The table above indicates an overall (ie Capital Programme and Forecast) planned gross capital spend of £129.9m in 2010/11, £120.8m in 2011/12, £82.2m in 2012/13 and £67.8m in 2013/14 but as previously reported these totals do include a limited number of significant individual schemes and provisions as follows:
Directorate 2010/11 2011/12 2012/13 2013/14
£m £m £m £m Adult & Community Services
Our Future Lives – Extra Care Scheme 0.6 2.3 2.0 2.5 Our Future Lives – Older People’s Resource Centre
0.7 3.5 3.2 1.8
Business & Environmental Services
New and Replacement Road Lighting Columns
2.8 3.2 0 0
Depots Rationalisation Programme 4.8 2.7 0 0 Waste Strategy 1.0 1.3 0 5.1 Highways LTP 36.9 36.3 35.7 26.7
Children & Young People’s Service
Major Capital Schemes at Schools 0.3 1.0 1.8 0 Suitable for Purpose Schemes 7.0 2.8 0 0 Special Educational Needs/Behaviour Review 2.6 1.0 0 0 Pupil Referral Units / Special Schools 0.5 5.6 4.5 0 Capital Funding 2012-14 yet to be allocated to initiatives
0 0 16.6 20.7
14-19 Development 0.3 2.3 1.9 0 Health and Safety 3.0 1.1 0 0 Primary Capital Programme 4.1 9.1 0 0 Basic Needs 2011/12 0 0.8 3.3 3.3 Capitalised Repairs and Maintenance 3.6 1.8 1.8 1.4 Schools Access Initiative 0.8 1.4 0 0 Children’s Centre Capital 3.7 1.1 0 0 Early Years Settings 2.8 0 0 0 National Digital Infrastructure 1.8 6.6 0 0 Building Schools for the Future 8.9 5.3 0 0 ICT Harnessing Technology 4.7 0 0 0 Devolved Capital (School Schemes) 6.6 9.7 5.3 2.0 Self Help Schemes (School Schemes) 7.1 3.3 2.2 2.0
Other County Services Affordable Housing Fund 0.6 2.1 0.6 0 Skipton Bright Office Strategy 1.8 0.6 0 0 Harrogate Bright Office Strategy 0.4 1.8 0 0 Revenue funded Capital programmes 2.4 1.1 0.5 0.3 Loans to Limited Companies 5.2 0 0 0
115.0 107.8 79.4 65.8 All other schemes and provisions 14.9 13.0 2.8 2.0
Total 129.9 120.8 82.2 67.8
COMREP/Exec/0211capplan_sect8
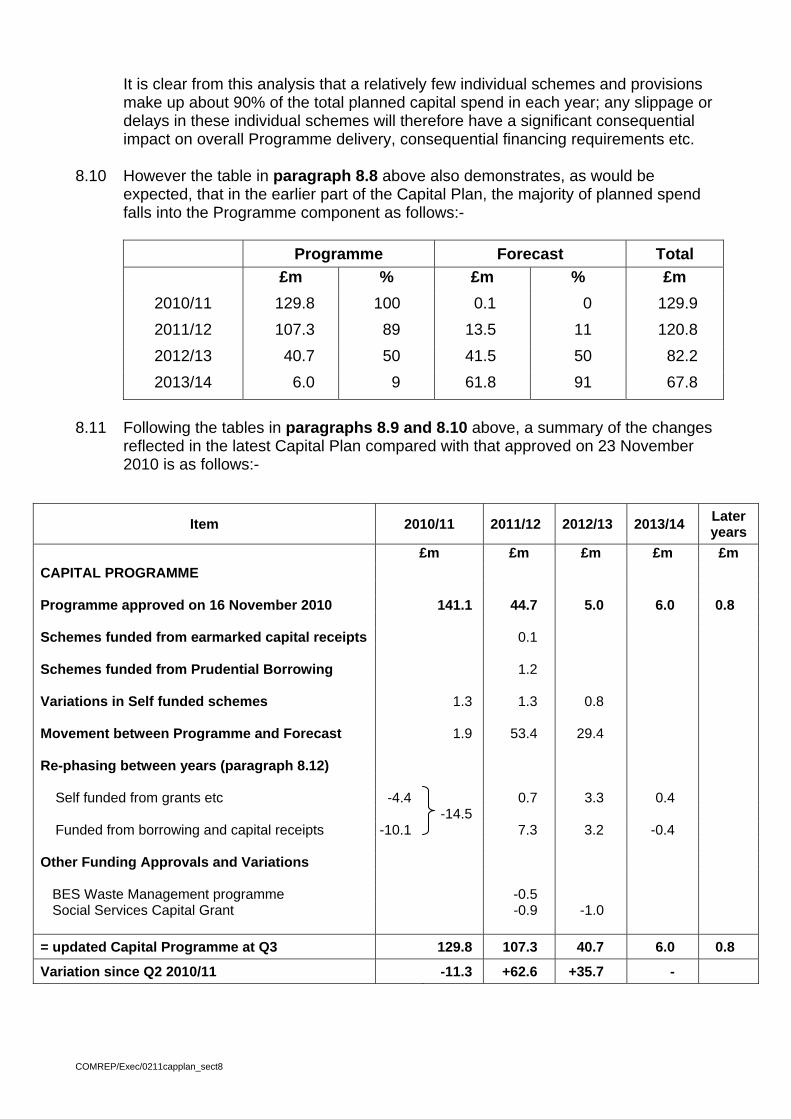
It is clear from this analysis that a relatively few individual schemes and provisions make up about 90% of the total planned capital spend in each year; any slippage or delays in these individual schemes will therefore have a significant consequential impact on overall Programme delivery, consequential financing requirements etc.
8.10 However the table in paragraph 8.8 above also demonstrates, as would be expected, that in the earlier part of the Capital Plan, the majority of planned spend falls into the Programme component as follows:-
Programme Forecast Total £m % £m % £m
2010/11 129.8 100 0.1 0 129.9 2011/12 107.3 89 13.5 11 120.8 2012/13 40.7 50 41.5 50 82.2 2013/14 6.0 9 61.8 91 67.8
8.11 Following the tables in paragraphs 8.9 and 8.10 above, a summary of the changes
reflected in the latest Capital Plan compared with that approved on 23 November 2010 is as follows:-
Item 2010/11 2011/12 2012/13 2013/14 Later years
£m £m £m £m £m CAPITAL PROGRAMME Programme approved on 16 November 2010 141.1 44.7 5.0 6.0 0.8 Schemes funded from earmarked capital receipts 0.1 Schemes funded from Prudential Borrowing 1.2 Variations in Self funded schemes 1.3 1.3 0.8 Movement between Programme and Forecast 1.9 53.4 29.4 Re-phasing between years (paragraph 8.12)
Self funded from grants etc -4.4 0.7 3.3 0.4 -14.5 Funded from borrowing and capital receipts -10.1 7.3 3.2 -0.4
Other Funding Approvals and Variations
BES Waste Management programme -0.5 Social Services Capital Grant -0.9 -1.0
= updated Capital Programme at Q3 129.8 107.3 40.7 6.0 0.8
Variation since Q2 2010/11 -11.3 +62.6 +35.7 -
COMREP/Exec/0211capplan_sect8
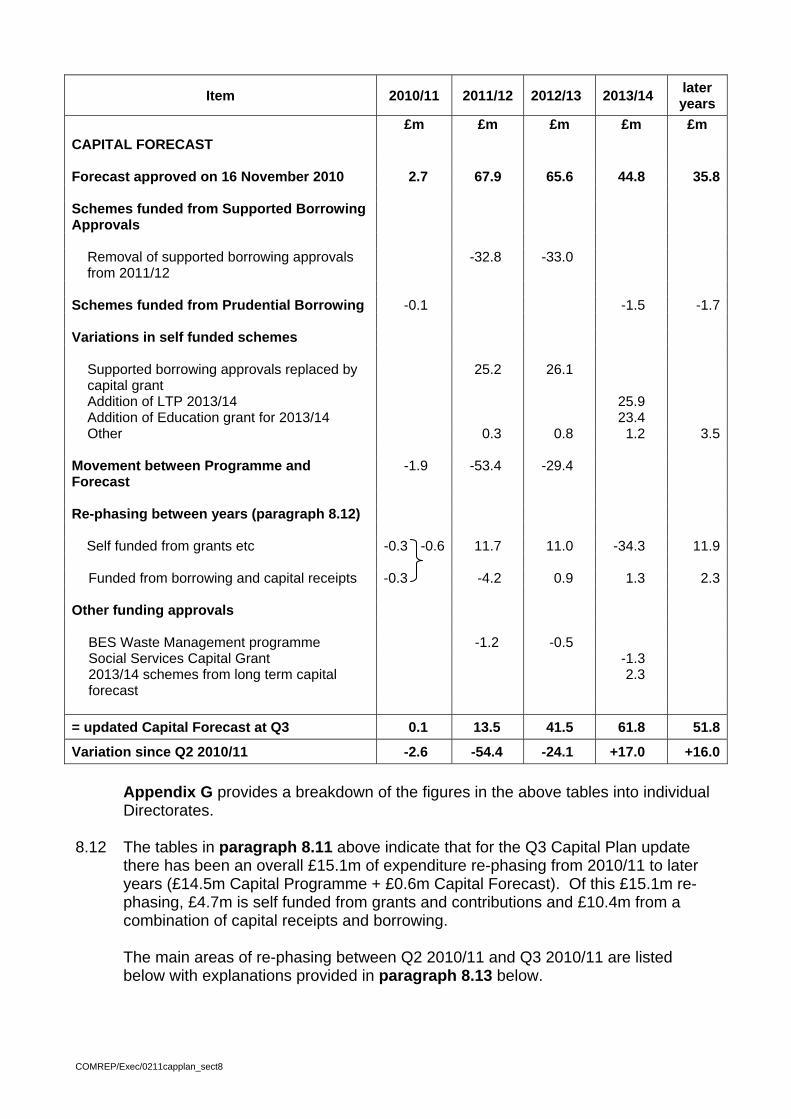
Item 2010/11 2011/12 2012/13 2013/14 later years
£m £m £m £m £m CAPITAL FORECAST Forecast approved on 16 November 2010 2.7 67.9 65.6 44.8 35.8 Schemes funded from Supported Borrowing Approvals
Removal of supported borrowing approvals from 2011/12
-32.8 -33.0
Schemes funded from Prudential Borrowing -0.1 -1.5 -1.7 Variations in self funded schemes
Supported borrowing approvals replaced by capital grant
25.2 26.1
Addition of LTP 2013/14 25.9 Addition of Education grant for 2013/14 23.4 Other 0.3 0.8 1.2 3.5
Movement between Programme and Forecast
-1.9 -53.4 -29.4
Re-phasing between years (paragraph 8.12)
Self funded from grants etc -0.3 -0.6 11.7 11.0 -34.3 11.9 Funded from borrowing and capital receipts -0.3 -4.2 0.9 1.3 2.3
Other funding approvals BES Waste Management programme -1.2 -0.5 Social Services Capital Grant -1.3 2013/14 schemes from long term capital forecast
2.3
= updated Capital Forecast at Q3 0.1 13.5 41.5 61.8 51.8
Variation since Q2 2010/11 -2.6 -54.4 -24.1 +17.0 +16.0
Appendix G provides a breakdown of the figures in the above tables into individual Directorates.
8.12 The tables in paragraph 8.11 above indicate that for the Q3 Capital Plan update
there has been an overall £15.1m of expenditure re-phasing from 2010/11 to later years (£14.5m Capital Programme + £0.6m Capital Forecast). Of this £15.1m re-phasing, £4.7m is self funded from grants and contributions and £10.4m from a combination of capital receipts and borrowing.
The main areas of re-phasing between Q2 2010/11 and Q3 2010/11 are listed
below with explanations provided in paragraph 8.13 below.
COMREP/Exec/0211capplan_sect8
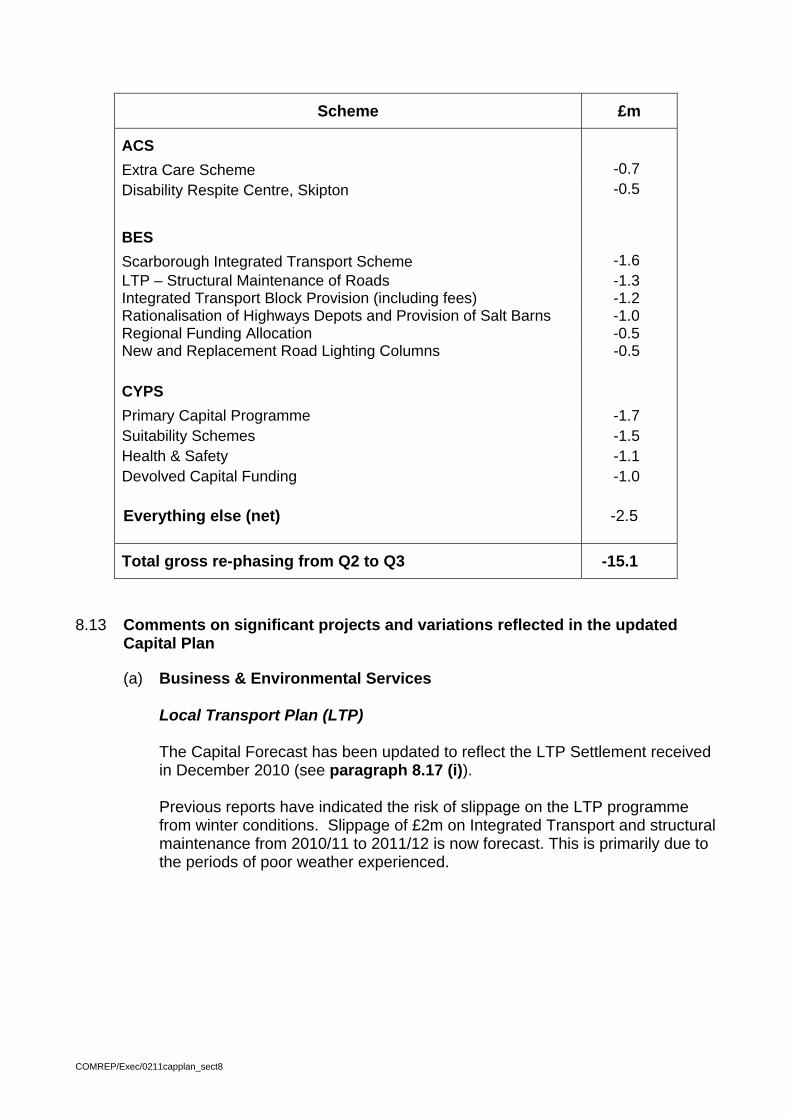
Scheme £m
ACS
Extra Care Scheme -0.7 Disability Respite Centre, Skipton -0.5
BES
Scarborough Integrated Transport Scheme -1.6 LTP – Structural Maintenance of Roads -1.3 Integrated Transport Block Provision (including fees) -1.2 Rationalisation of Highways Depots and Provision of Salt Barns -1.0 Regional Funding Allocation -0.5 New and Replacement Road Lighting Columns -0.5 CYPS Primary Capital Programme -1.7 Suitability Schemes -1.5 Health & Safety -1.1 Devolved Capital Funding -1.0
Everything else (net) -2.5
Total gross re-phasing from Q2 to Q3 -15.1 8.13 Comments on significant projects and variations reflected in the updated
Capital Plan
(a) Business & Environmental Services
Local Transport Plan (LTP) The Capital Forecast has been updated to reflect the LTP Settlement received in December 2010 (see paragraph 8.17 (i)). Previous reports have indicated the risk of slippage on the LTP programme from winter conditions. Slippage of £2m on Integrated Transport and structural maintenance from 2010/11 to 2011/12 is now forecast. This is primarily due to the periods of poor weather experienced.
COMREP/Exec/0211capplan_sect8
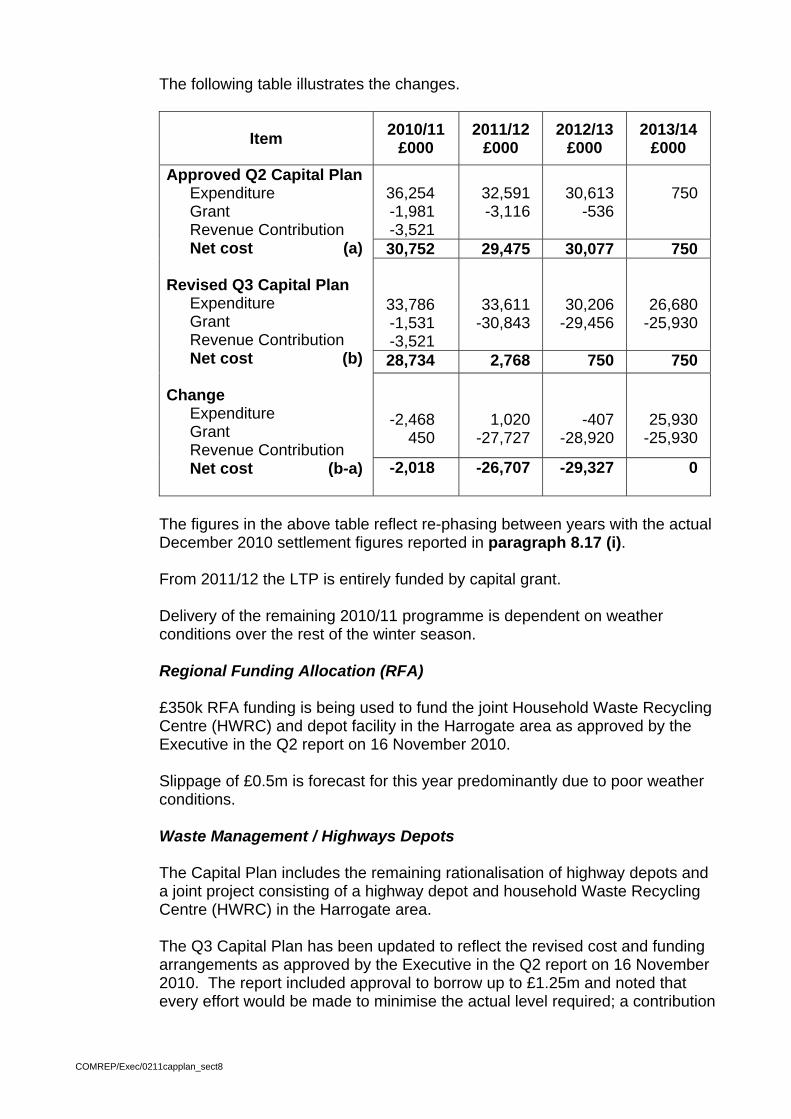
The following table illustrates the changes.
Item 2010/11 £000
2011/12 £000
2012/13 £000
2013/14 £000
36,254 -1,981 -3,521
32,591 -3,116
30,613
-536
750
30,752 29,475 30,077 750
33,786 -1,531 -3,521
33,611 -30,843
30,206 -29,456
26,680 -25,930
28,734 2,768 750 750
-2,468 450
1,020 -27,727
-407 -28,920
25,930 -25,930
Approved Q2 Capital Plan Expenditure Grant Revenue Contribution Net cost (a)
Revised Q3 Capital Plan Expenditure Grant Revenue Contribution Net cost (b)
Change Expenditure Grant Revenue Contribution Net cost (b-a)
-2,018 -26,707 -29,327 0
The figures in the above table reflect re-phasing between years with the actual December 2010 settlement figures reported in paragraph 8.17 (i). From 2011/12 the LTP is entirely funded by capital grant. Delivery of the remaining 2010/11 programme is dependent on weather conditions over the rest of the winter season. Regional Funding Allocation (RFA) £350k RFA funding is being used to fund the joint Household Waste Recycling Centre (HWRC) and depot facility in the Harrogate area as approved by the Executive in the Q2 report on 16 November 2010. Slippage of £0.5m is forecast for this year predominantly due to poor weather conditions. Waste Management / Highways Depots The Capital Plan includes the remaining rationalisation of highway depots and a joint project consisting of a highway depot and household Waste Recycling Centre (HWRC) in the Harrogate area. The Q3 Capital Plan has been updated to reflect the revised cost and funding arrangements as approved by the Executive in the Q2 report on 16 November 2010. The report included approval to borrow up to £1.25m and noted that every effort would be made to minimise the actual level required; a contribution
COMREP/Exec/0211capplan_sect8
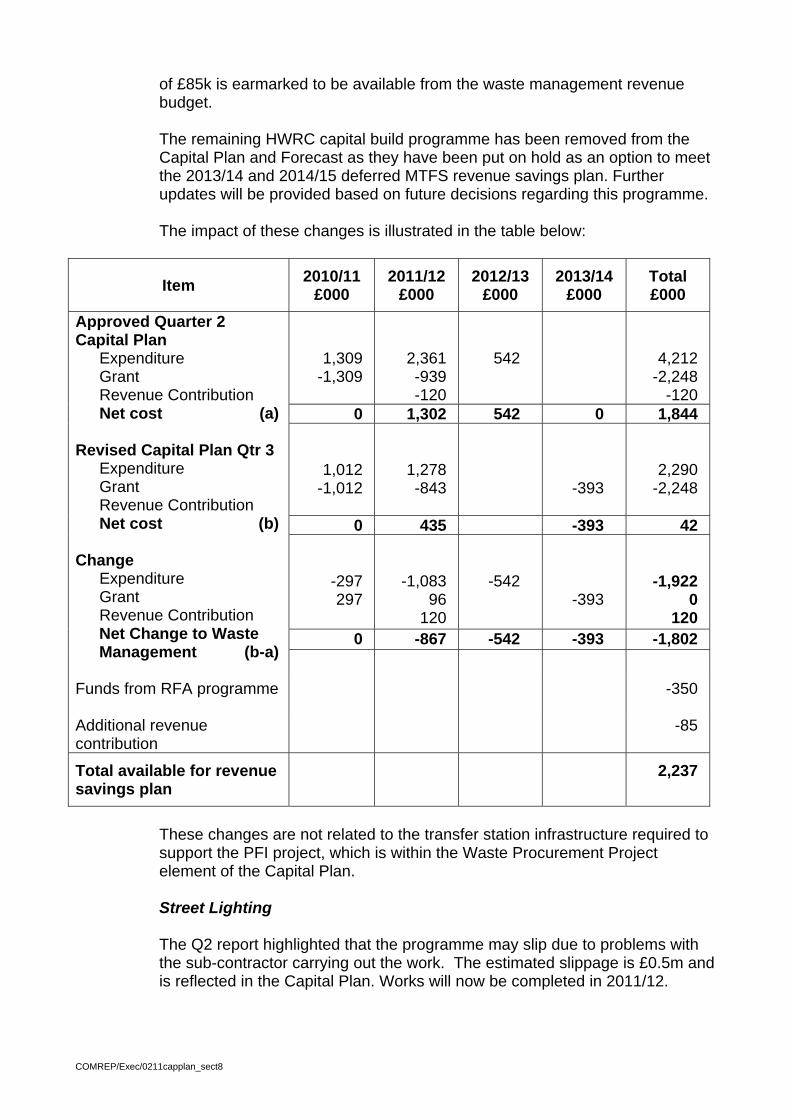
of £85k is earmarked to be available from the waste management revenue budget. The remaining HWRC capital build programme has been removed from the Capital Plan and Forecast as they have been put on hold as an option to meet the 2013/14 and 2014/15 deferred MTFS revenue savings plan. Further updates will be provided based on future decisions regarding this programme. The impact of these changes is illustrated in the table below:
Item 2010/11 £000
2011/12 £000
2012/13 £000
2013/14 £000
Total £000
1,309 -1,309
2,361 -939 -120
542
4,212 -2,248
-120 0 1,302 542 0 1,844
1,012 -1,012
1,278 -843
-393
2,290 -2,248
0 435 -393 42
-297 297
-1,083 96
120
-542
-393
-1,922 0
120 0 -867 -542 -393 -1,802
Approved Quarter 2 Capital Plan
Expenditure Grant Revenue Contribution Net cost (a)
Revised Capital Plan Qtr 3 Expenditure Grant Revenue Contribution Net cost (b)
Change Expenditure Grant Revenue Contribution Net Change to Waste Management (b-a)
Funds from RFA programme
-350
Additional revenue contribution
-85
Total available for revenue savings plan
2,237
These changes are not related to the transfer station infrastructure required to support the PFI project, which is within the Waste Procurement Project element of the Capital Plan. Street Lighting The Q2 report highlighted that the programme may slip due to problems with the sub-contractor carrying out the work. The estimated slippage is £0.5m and is reflected in the Capital Plan. Works will now be completed in 2011/12.
COMREP/Exec/0211capplan_sect8
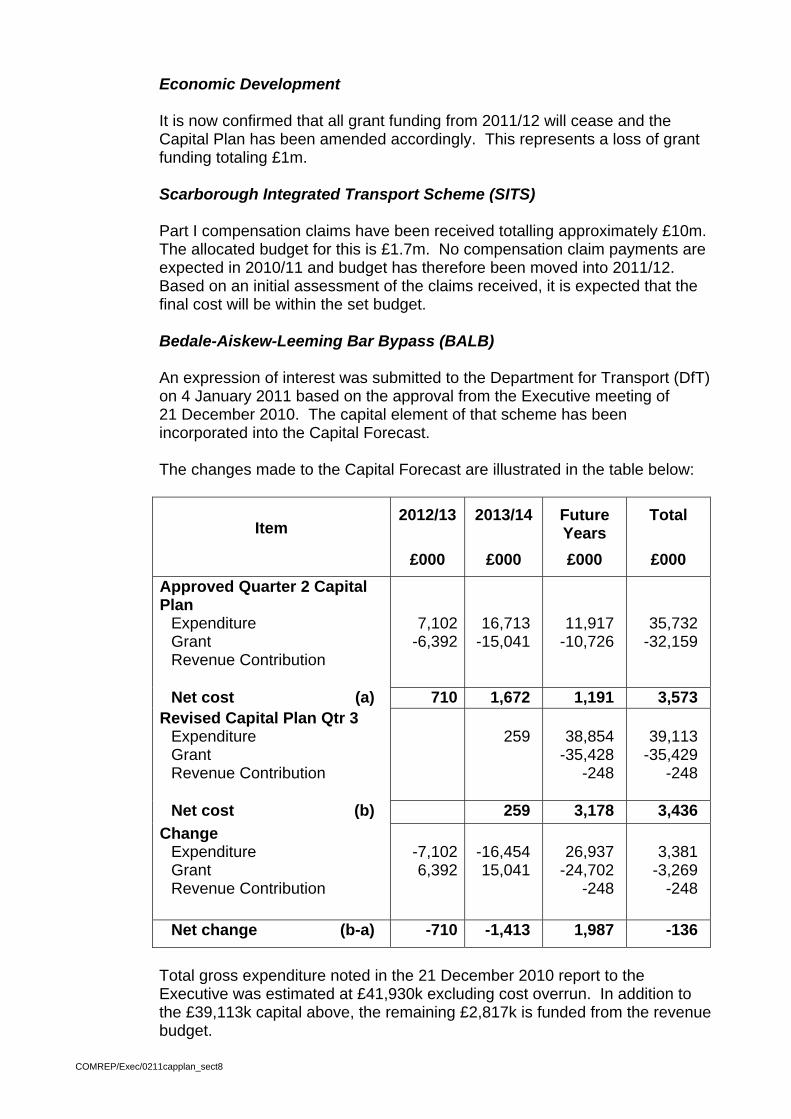
Economic Development It is now confirmed that all grant funding from 2011/12 will cease and the Capital Plan has been amended accordingly. This represents a loss of grant funding totaling £1m. Scarborough Integrated Transport Scheme (SITS) Part I compensation claims have been received totalling approximately £10m. The allocated budget for this is £1.7m. No compensation claim payments are expected in 2010/11 and budget has therefore been moved into 2011/12. Based on an initial assessment of the claims received, it is expected that the final cost will be within the set budget. Bedale-Aiskew-Leeming Bar Bypass (BALB) An expression of interest was submitted to the Department for Transport (DfT) on 4 January 2011 based on the approval from the Executive meeting of 21 December 2010. The capital element of that scheme has been incorporated into the Capital Forecast. The changes made to the Capital Forecast are illustrated in the table below:
Item 2012/13
2013/14
Future Years
Total
£000 £000 £000 £000
Approved Quarter 2 Capital Plan
Expenditure Grant Revenue Contribution
7,102-6,392
16,713 -15,041
11,917 -10,726
35,732 -32,159
Net cost (a) 710 1,672 1,191 3,573 Revised Capital Plan Qtr 3
Expenditure Grant Revenue Contribution
259
38,854 -35,428
-248
39,113
-35,429 -248
Net cost (b) 259 3,178 3,436 Change
Expenditure Grant Revenue Contribution
-7,1026,392
-16,454 15,041
26,937
-24,702 -248
3,381
-3,269 -248
Net change (b-a) -710 -1,413 1,987 -136 Total gross expenditure noted in the 21 December 2010 report to the Executive was estimated at £41,930k excluding cost overrun. In addition to the £39,113k capital above, the remaining £2,817k is funded from the revenue budget.
COMREP/Exec/0211capplan_sect8
(b) Adult and Community Services There have been a number of changes to the Adult & Community Services capital plan between Q2 and Q3:- Fabric and Facilities Slippage of £293k to 2011/12. This change mainly reflects revisions to the projected expenditure on fire precautions work in 2010-11. This slippage has arisen from a number of factors including the corporate initiative to change to themed contractors from an individual tender process, the late confirmation of revised requirements around fire doors and on-site delays following concerns about the quality of work undertaken. Older People’s Service Strategy A formal programme of works to deal with water safety/legionella risks has now been included in the Capital Programme, funded from the general provision for resource centre schemes. Extra Care Schemes The contribution towards the scheme costs at Lower Greenfoot, Settle is now formally included in the Capital Programme. In addition, as part of the development, and critical to its overall financing, it is proposed to develop a ‘community hub’, to include library and registration services, which will merge a number of outreach bases, making savings on premises costs and other overheads. This will also be an opportunity to develop the social enterprise model, whereby volunteers will take over a range of activities, which both the residents (eg as at Bainbridge Extra Care) and the wider community will be able to take part in and advantage of. The gross cost of this development will be £256k. This will be in part funded through capital receipts from the disposal of the Settle registrar’s office (est £75k) with the balance funded from the general provision for the older persons service strategy. The Richmond scheme payment (£604K) has been slipped to 2011/12 Works on this facility are in progress but the finding of possible archaeological remains and the extreme weather in December 2010 have delayed the build and therefore the stage for release of the payment has not been met in 2010/11. Continuing delays in final agreement on the Easingwold footpath scheme, linked to the extra care scheme in the town, means the balance of this funding (£48k) will be slipped to 2011/12. Valuing People Difficulty in identifying suitable sites to develop changing place facilities has meant a reduction in the budgeted spend on this area at this stage. The small scheme at Dalewood House, Whitby has now been included in the programme but a delay in project initiation at Scott Road, Selby has meant £50k has been slipped to 2011/12.
COMREP/Exec/0211capplan_sect8

Directorate IT Facilities Investment decisions on some aspects of key IT requirements, in particular around reporting tools and infrastructure for the SWIFT/AIS system, has meant £58k of this budget has been brought forward to 2010/11 along with matching grant funding income. Disability Resource Centre, Skipton Continuing issues with planning consents has delayed this scheme and £480k has been slipped to 2011/12.
(c) Children and Young People’s Service Government Capital Approvals This Q3 Capital Plan update reflects the changes relating to the Local Government Finance Settlement as announced in December 2010. The new capital allocations are entirely funded from grant and there are no supported borrowing approvals. Central Government have indicated the allocations for 2012/13 and 2013/14 will be at a similar level to those announced in 2011/12, which have been included in this update. Details of these allocations, compared with the previous indicative figures included in the Q2 Capital Plan update, are shown in paragraph 8.17 (ii). SEN and Behaviour Review Forest Moor – New BESD School The project start date has been delayed from November 2010 to January 2011 creating slippage of £250k. The total project value including ICT and furniture estimates is well within the funding available of £13.4m, although this is highly dependent on site disposals achieving forecast levels of capital receipt. The expenditure on this project is expected to be back end loaded resulting in slippage of £3.15m from 2011/12 to 2012/13. Pupil Referral Services Total project costs including site acquisition are estimated at £1.56m which is within the funding in the current Capital Programme. The site identified is currently owned by the PCT, who are expected to initiate their disposal procedures shortly as they would like to vacate the premises during summer 2011. It is proposed to proceed with detailed design and to instruct Bruton Knowles to enter into negotiations with the PCT for acquisition of the site. Planning permission for change of use is not required. Enhanced Provisions in Mainstream Schools The remaining enhanced primary school to serve the Northallerton area is Brompton CP School and feasibility costs are awaited. The remaining enhanced provision projects are complete.
COMREP/Exec/0211capplan_sect8

Primary Capital Programme The main contract for three major schemes at Barrowcliff, Friarage and Hinderwell Schools has been signed and all projects are now on site. All three schemes have suffered significant delays due to poor weather conditions, resulting in slippage of £1.7m from 2010/11 to 2011/12. Efforts are being made to minimise further slippage to ensure maximum grant spend by 31 August 2011. The Government has discontinued the Primary Capital Programme and a separate report on the future of the Norton CP project and Phase 2 schemes in the light of this decision will be submitted to Executive Members for consideration. Low/High Bentham Feasibility estimates indicate a potential shortfall of between £600k and £1m which would need to be met from the basic need allocation for the next Capital Programme. A planning application was submitted in November 2010 with a view to finalising the site acquisition by the end of the financial year. Planning will be considered at the March 2011 Planning Committee meeting but a number of planning risks remain a threat to approval. This project has been delayed due to adaptations that have had to be made to the design in response to representations that have emerged during the planning consultation process, resulting in slippage of £0.4m from 2010/11 and £1.4m from 2011/12 to 2012/13. Children’s Centre Programme Eight Phase 3 Children’s Centres will be completed by March 2011. An extension to the existing use of space for the Eastfield Children’s Centre provision at Link Walk is under consideration. Richmond BSF Work commenced on the refurbishment of the final phase of teaching accommodation in October 2010. A final phase of demolition and external works will complete in January 2012. The project is within budget as at 10th December 2010. Aiming High for Disabled Children The schemes at Beckholme Family Centre and The Ghyll are now complete. Works at Nidderdale Children’s Resource Centre will complete in February 2011. 14-19 Development Programme Projects at Northallerton College, Stokesley School and Malton School have been commissioned and feasibility costs are awaited. A number of smaller scale schemes, mainly ICT projects, have been endorsed by the 14-19 Delivery Team and will be completed in the current programme in line with funding previously approved.
COMREP/Exec/0211capplan_sect8
Selby Abbey The new school and the level of capital contribution are being reviewed with the developers who have indicated that the scheme may now proceed, although timescales remain unclear. Gladstone Road Scarborough – MUGA and Accommodation Improvements The expenditure profiling to date would suggest the majority of the expenditure is back end loaded. Severe weather conditions are also expected to have an impact, resulting in slippage of (£785k) from 2010/11 to 2011/12. Ripon Grammar School – Accommodation Upgrade and Lab Refurbishment Site investigations revealed presence of Gypsum voids on the preferred site. Alternative sites are now being examined which have resulted in slippage of (£430k). The revised start date for the scheme is November 2011. Whitley and Eggborough – Extension Start-on-site delayed due to planning issues including discharge of pre-start conditions, resulting in slippage of £360k from 2010/11 to 2011/12. Fire Safety Programme Following the completion of the fire risk safety audits, financial support was offered directly to schools in July 2010. Schools have submitted their bids for fire safety works which are currently being assessed by the strategic team. The programme is expected to run into 2011/12, resulting in slippage of £800k. ICT Harnessing Technology £6.5m has been spent to date in year, which brings forward expenditure of £1.35m from 2011/12 to 2010/11.
(d) Other County Services Farm Improvements As a result of weather related delays on both the Sleaper Lane and Ashfield sites, a significant element (£350k) of the Farms Improvement scheme has been re-phased into 2011/12. ICT Infrastructure / SDT Refresh (funded from revenue) ICT Infrastructure spending has been reprofiled (£297k from 2010/11 and a further £157k from 2011/12, into 2013/14) to reflect revised project profiles, including Microsoft preparatory work.
COMREP/Exec/0211capplan_sect8

On the SDT refresh, estimated spend in future years has been reduced by £66k and re-profiled (£240k from 2011/12 to £120k in both 2012/13 and 2013/14) to reflect reduced prioritisation being given to PC refresh within Directorates. Public Access for Disabled People Public Access schemes within Northallerton Library and Harrogate Registrars will now be undertaken in late 2011/early 2012 resulting in re-phasing of expenditure (£434k) into 2011/12. Affordable Housing Schemes within the Capital Programme have been profiled in line with the expected project timescales. Uncommitted Capital Forecast provisions of £1.6m in 2013/14 and £1.6m in later years have been removed following a decision by Executive on 8 February 2011 to approve no more capital contributions to these schemes. This decision was taken as part of identifying revenue saving proposals from the Community Fund. Addition of 2013/14 Block provisions for 2013/14 have been added for Material Damage (£500k) and the Purchase of Vehicles, Plant and Equipment (£100k).
Capital approvals
8.14 The Q1 Capital Plan update reflected cuts in 2010/11 Capital Grants from the Government which were notified to the County Council in June and July 2010. This was followed at Q2 with the key headlines from the Spending Review announcement on 20 October 2010 in relation to indicated reductions in capital funding in the four year spending review period (2011/12 to 2014/15).
8.15 Actual capital approvals for each local authority have subsequently been
announced following the Provisional Local Government Finance Settlement on 13 December 2010. The main implications of these approvals were reported to Executive on 21 December 2010 as part of the ‘Medium Term Financial Strategy – Local Government Finance Settlement 2011/12 and 2012/13’ report.
8.16 One interesting aspect of the approvals is that they are being fully funded by 100%
capital grant rather than the previous mix of supported borrowing approvals and grant. This change is welcome on the basis that the ‘vagaries’ of the formula grant system meant that it was impossible to determine the extent to which supported borrowing approvals were supported by revenue support grant to cover consequential capital financing costs. It does however present two side effects which will have to be managed carefully.
(a) firstly is the Treasury Management implications of a reduced annual capital
borrowing requirement of about £33m per annum. This is considered in more detail in the Annual Treasury Management and Investment Strategy for 2011/12 that was approved by Executive on 8 February 2011 for subsequent approval by County Council on 16 February 2011.
COMREP/Exec/0211capplan_sect8
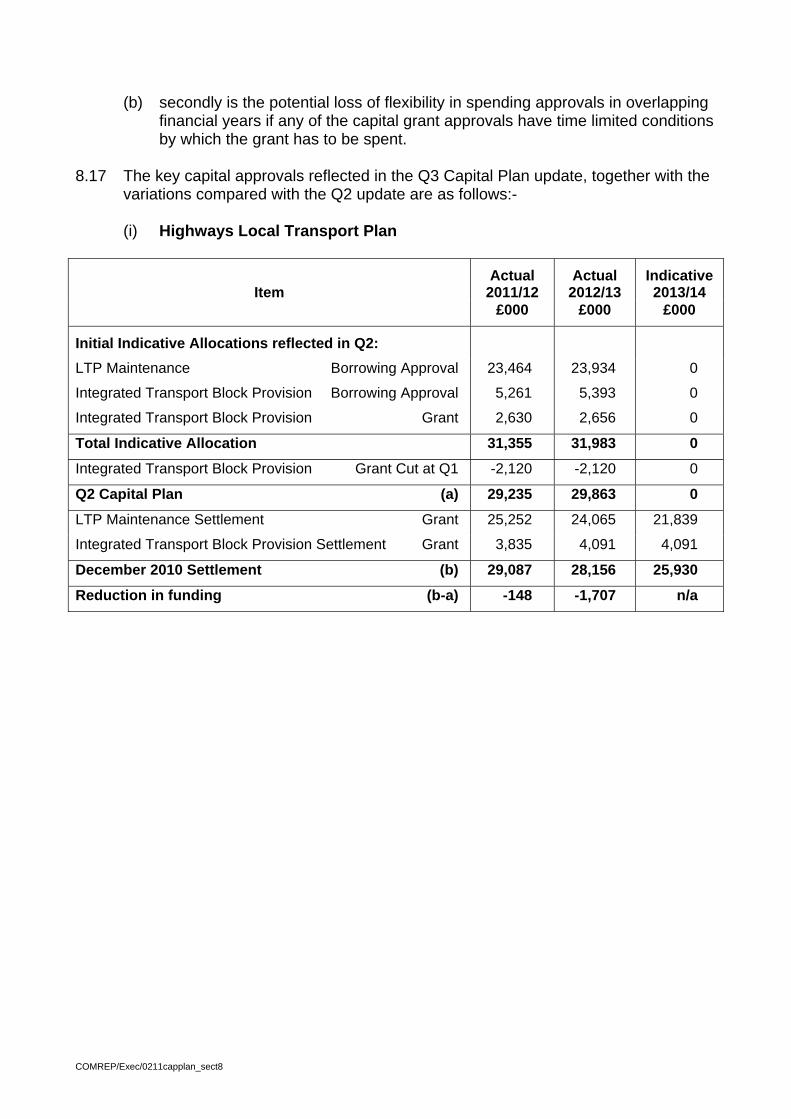
(b) secondly is the potential loss of flexibility in spending approvals in overlapping
financial years if any of the capital grant approvals have time limited conditions by which the grant has to be spent.
8.17 The key capital approvals reflected in the Q3 Capital Plan update, together with the
variations compared with the Q2 update are as follows:-
(i) Highways Local Transport Plan
Actual 2011/12
Actual 2012/13
Indicative 2013/14 Item
£000 £000 £000
Initial Indicative Allocations reflected in Q2:
LTP Maintenance Borrowing Approval 23,464 23,934 0
Integrated Transport Block Provision Borrowing Approval 5,261 5,393 0
Integrated Transport Block Provision Grant 2,630 2,656 0
Total Indicative Allocation 31,355 31,983 0
Integrated Transport Block Provision Grant Cut at Q1 -2,120 -2,120 0
Q2 Capital Plan (a) 29,235 29,863 0
LTP Maintenance Settlement Grant 25,252 24,065 21,839
Integrated Transport Block Provision Settlement Grant 3,835 4,091 4,091
December 2010 Settlement (b) 29,087 28,156 25,930
Reduction in funding (b-a) -148 -1,707 n/a
COMREP/Exec/0211capplan_sect8
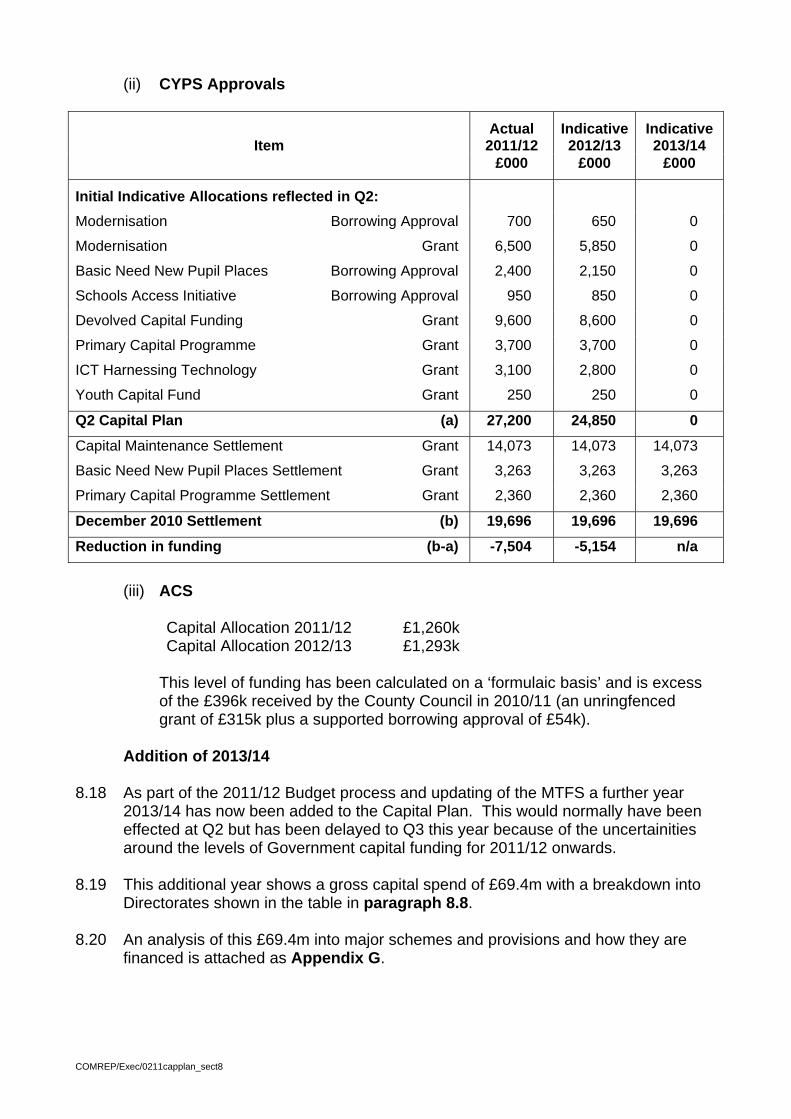
(ii) CYPS Approvals
Actual 2011/12
Indicative 2012/13
Indicative 2013/14 Item
£000 £000 £000
Initial Indicative Allocations reflected in Q2:
Modernisation Borrowing Approval 700 650 0
Modernisation Grant 6,500 5,850 0
Basic Need New Pupil Places Borrowing Approval 2,400 2,150 0
Schools Access Initiative Borrowing Approval 950 850 0
Devolved Capital Funding Grant 9,600 8,600 0
Primary Capital Programme Grant 3,700 3,700 0
ICT Harnessing Technology Grant 3,100 2,800 0
Youth Capital Fund Grant 250 250 0
Q2 Capital Plan (a) 27,200 24,850 0
Capital Maintenance Settlement Grant 14,073 14,073 14,073
Basic Need New Pupil Places Settlement Grant 3,263 3,263 3,263
Primary Capital Programme Settlement Grant 2,360 2,360 2,360
December 2010 Settlement (b) 19,696 19,696 19,696
Reduction in funding (b-a) -7,504 -5,154 n/a
(iii) ACS
Capital Allocation 2011/12 £1,260k Capital Allocation 2012/13 £1,293k
This level of funding has been calculated on a ‘formulaic basis’ and is excess
of the £396k received by the County Council in 2010/11 (an unringfenced grant of £315k plus a supported borrowing approval of £54k).
Addition of 2013/14
8.18 As part of the 2011/12 Budget process and updating of the MTFS a further year
2013/14 has now been added to the Capital Plan. This would normally have been effected at Q2 but has been delayed to Q3 this year because of the uncertainities around the levels of Government capital funding for 2011/12 onwards.
8.19 This additional year shows a gross capital spend of £69.4m with a breakdown into
Directorates shown in the table in paragraph 8.8.
8.20 An analysis of this £69.4m into major schemes and provisions and how they are financed is attached as Appendix G.
COMREP/Exec/0211capplan_sect8
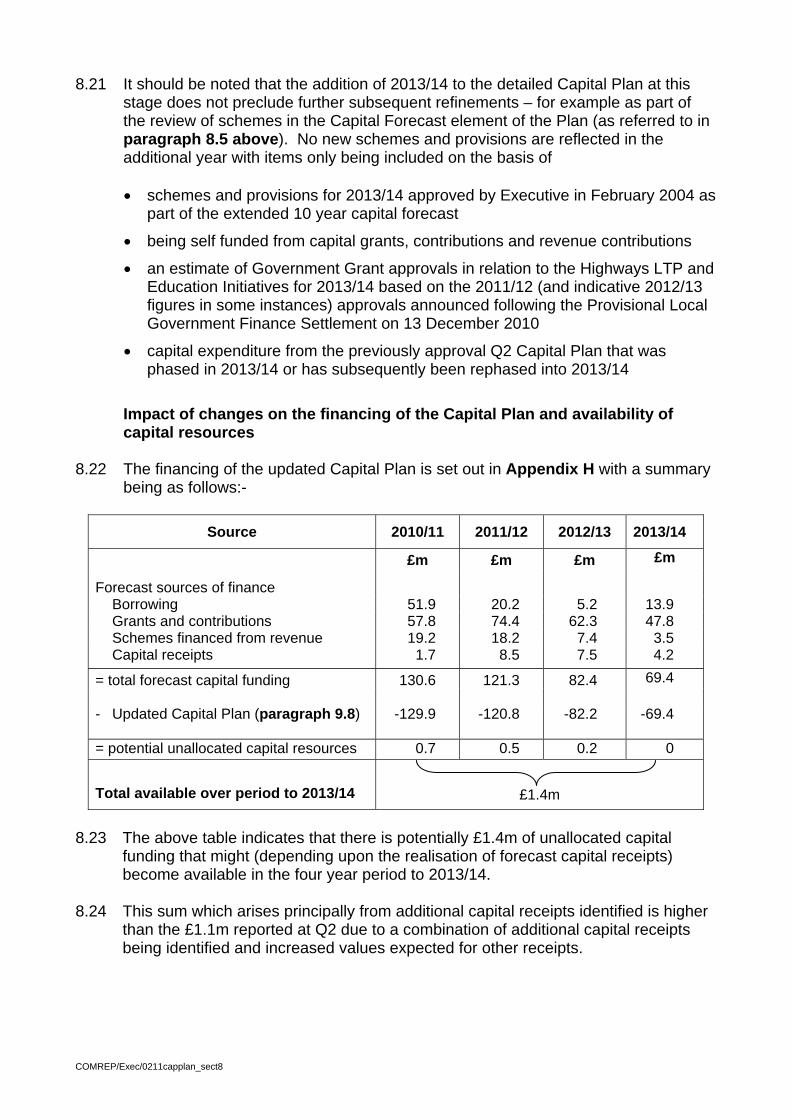
8.21 It should be noted that the addition of 2013/14 to the detailed Capital Plan at this stage does not preclude further subsequent refinements – for example as part of the review of schemes in the Capital Forecast element of the Plan (as referred to in paragraph 8.5 above). No new schemes and provisions are reflected in the additional year with items only being included on the basis of
• schemes and provisions for 2013/14 approved by Executive in February 2004 as
part of the extended 10 year capital forecast
• being self funded from capital grants, contributions and revenue contributions
• an estimate of Government Grant approvals in relation to the Highways LTP and Education Initiatives for 2013/14 based on the 2011/12 (and indicative 2012/13 figures in some instances) approvals announced following the Provisional Local Government Finance Settlement on 13 December 2010
• capital expenditure from the previously approval Q2 Capital Plan that was phased in 2013/14 or has subsequently been rephased into 2013/14
Impact of changes on the financing of the Capital Plan and availability of capital resources
8.22 The financing of the updated Capital Plan is set out in Appendix H with a summary being as follows:-
Source 2010/11 2011/12 2012/13 2013/14
£m £m £m £m
Forecast sources of finance Borrowing 51.9 20.2 5.2 13.9 Grants and contributions 57.8 74.4 62.3 47.8 Schemes financed from revenue 19.2 18.2 7.4 3.5 Capital receipts 1.7 8.5 7.5 4.2
= total forecast capital funding 130.6 121.3 82.4 69.4 - Updated Capital Plan (paragraph 9.8) -129.9 -120.8 -82.2 -69.4 = potential unallocated capital resources 0.7 0.5 0.2 0 Total available over period to 2013/14
£1.4m
8.23 The above table indicates that there is potentially £1.4m of unallocated capital
funding that might (depending upon the realisation of forecast capital receipts) become available in the four year period to 2013/14.
8.24 This sum which arises principally from additional capital receipts identified is higher
than the £1.1m reported at Q2 due to a combination of additional capital receipts being identified and increased values expected for other receipts.
COMREP/Exec/0211capplan_sect8
8.25 A further point to highlight in relation to forecast capital receipts is the continuing delay (slippage) in realising receipts as a result of the continuing depressed state of the property market. This results in additional Prudential Borrowing being required to finance the Capital Plan until the receipts are ultimately realised.
8.26 As mentioned at Q2 any significant reductions in the expected value of potential capital receipts in the pipeline would result in the Corporate Capital Pot being ‘overdrawn’. This scenario would also result in additional Prudential Borrowing being required to finance the existing Capital Plan.
8.27 Assuming the forecasts remain accurate, this £1.4m could be made available for
either:
(a) new capital investment (ie additional schemes), or (b) reducing prudential (unsupported) borrowing in any of the years up to 2013/14
and therefore achieving financing cost savings in the Revenue Budget, or (c) holding for the time being with no immediate decision to either spend or
reduce borrowing. This course of action would result in additional short-term interest being earned within Corporate Miscellaneous.
8.28 Members have previously agreed to adopt option (c) above and retain any surplus
capital funding for the time being. Another factor that influenced this decision was that the forecast funding levels include a capital receipts risk in terms of both forecast receipts slipping into a future year and/or not achieving their assumed estimate.
8.29 Given the factors mentioned above and the intention to review the schemes in
the Capital Forecast during 2011/12, it is proposed that option (c) be reaffirmed at this stage and that the funding is held in reserve for the next round of capital scheme bids.
RECOMMENDATIONS
8.30 The Executive is recommended to:
(a) approve the updated Capital Plan, summarised at Appendix D which
incorporates a number of specific refinements reported in paragraphs 8.13 (b) approves the funding arrangements for the scheme at Lower Greenfoot, Settle
as detailed in paragraphs 8.13(b) (c) agree that no action be taken at this stage to allocate any additional capital
resources (paragraph 8.29)
COMREP/Exec/0211capplan_sect8

ANNEX D
CAPITAL PLAN APPENDICES
Appendix A Adult and Community Services Appendix B Business and Environmental Services Appendix C Children and Young People’s Service Appendix D Other County Services Appendix E Summary of overall Capital Plan and analysis of changes Appendix F Summary of changes since last Capital Plan update Appendix G Addition of 2013/14 to Capital Plan Appendix H Financing of Capital Plan
COMREP/Exec/0211capplan_sect8
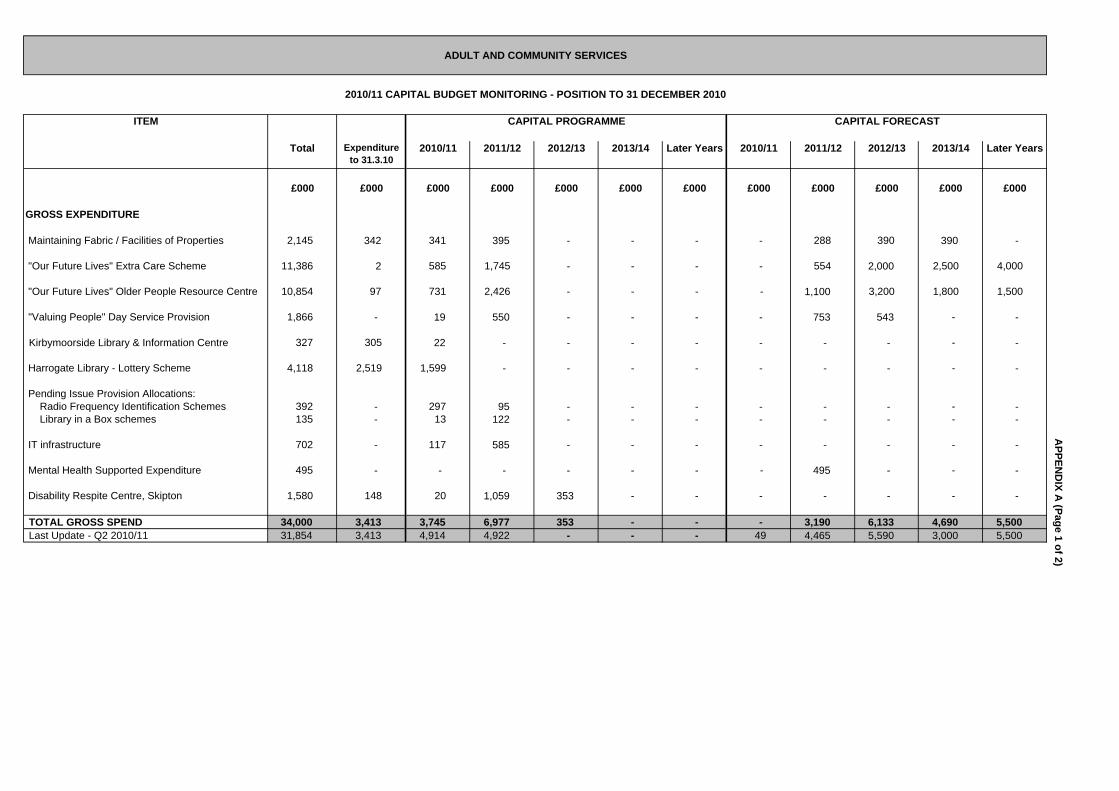
A
PPEND
IX A (Page 1 of 2)
ADULT AND COMMUNITY SERVICES
2010/11 CAPITAL BUDGET MONITORING - POSITION TO 31 DECEMBER 2010
ITEM CAPITAL PROGRAMME CAPITAL FORECAST
Total Expenditure to 31.3.10
2010/11 2011/12 2012/13 2013/14 Later Years 2010/11 2011/12 2012/13 2013/14 Later Years
£000 £000 £000 £000 £000 £000 £000 £000 £000 £000 £000 £000
GROSS EXPENDITURE
Maintaining Fabric / Facilities of Properties 2,145 342 341 395 - - - - 288 390 390 -
"Our Future Lives" Extra Care Scheme 11,386 2 585 1,745 - - - - 554 2,000 2,500 4,000
"Our Future Lives" Older People Resource Centre 10,854 97 731 2,426 - - - - 1,100 3,200 1,800 1,500
"Valuing People" Day Service Provision 1,866 - 19 550 - - - - 753 543 - -
Kirbymoorside Library & Information Centre 327 305 22 - - - - - - - - -
Harrogate Library - Lottery Scheme 4,118 2,519 1,599 - - - - - - - - -
Pending Issue Provision Allocations: Radio Frequency Identification Schemes 392 - 297 95 - - - - - - - - Library in a Box schemes 135 - 13 122 - - - - - - - -
IT infrastructure 702 - 117 585 - - - - - - - -
Mental Health Supported Expenditure 495 - - - - - - - 495 - - -
Disability Respite Centre, Skipton 1,580 148 20 1,059 353 - - - - - - -
TOTAL GROSS SPEND 34,000 3,413 3,745 6,977 353 - - - 3,190 6,133 4,690 5,500 Last Update - Q2 2010/11 31,854 3,413 4,914 4,922 - - - 49 4,465 5,590 3,000 5,500
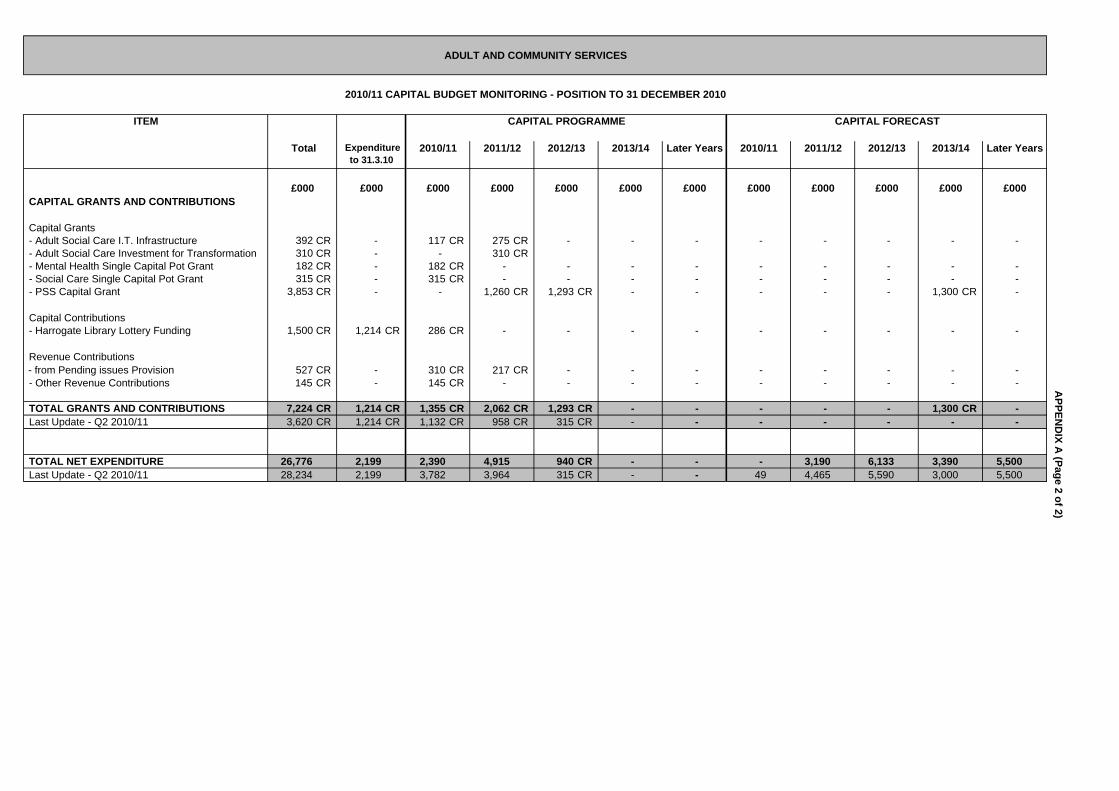
APPEN
DIX A
(Page 2 of 2)ADULT AND COMMUNITY SERVICES
2010/11 CAPITAL BUDGET MONITORING - POSITION TO 31 DECEMBER 2010
ITEM CAPITAL PROGRAMME CAPITAL FORECAST
Total Expenditure to 31.3.10
2010/11 2011/12 2012/13 2013/14 Later Years 2010/11 2011/12 2012/13 2013/14 Later Years
£000 £000 £000 £000 £000 £000 £000 £000 £000 £000 £000 £000CAPITAL GRANTS AND CONTRIBUTIONS
Capital Grants- Adult Social Care I.T. Infrastructure 392 CR - 117 CR 275 CR - - - - - - - - - Adult Social Care Investment for Transformation 310 CR - - 310 CR - Mental Health Single Capital Pot Grant 182 CR - 182 CR - - - - - - - - - - Social Care Single Capital Pot Grant 315 CR - 315 CR - - - - - - - - - - PSS Capital Grant 3,853 CR - - 1,260 CR 1,293 CR - - - - - 1,300 CR -
Capital Contributions - Harrogate Library Lottery Funding 1,500 CR 1,214 CR 286 CR - - - - - - - - -
Revenue Contributions
- from Pending issues Provision 527 CR - 310 CR 217 CR - - - - - - - - - Other Revenue Contributions 145 CR - 145 CR - - - - - - - - -
TOTAL GRANTS AND CONTRIBUTIONS 7,224 CR 1,214 CR 1,355 CR 2,062 CR 1,293 CR - - - - - 1,300 CR - Last Update - Q2 2010/11 3,620 CR 1,214 CR 1,132 CR 958 CR 315 CR - - - - - - -
TOTAL NET EXPENDITURE 26,776 2,199 2,390 4,915 940 CR - - - 3,190 6,133 3,390 5,500 Last Update - Q2 2010/11 28,234 2,199 3,782 3,964 315 CR - - 49 4,465 5,590 3,000 5,500
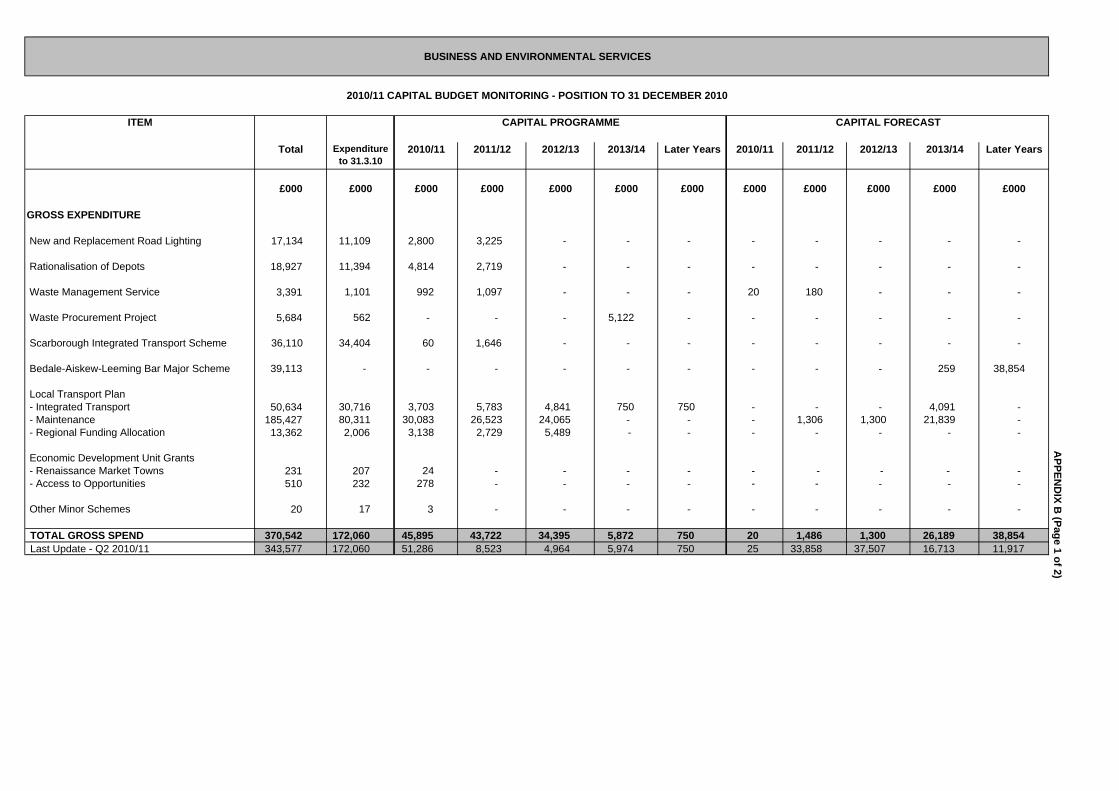
ITEM
GROSS EXPENDITURE
New and Replacement Road Lighting 17,134 11,109 2,800 3,225 - - - - - - - -
Rationalisation of Depots 18,927 11,394 4,814 2,719 - - - - - - - -
Waste Management Service 3,391 1,101 992 1,097 - - - 20 180 - - -
Waste Procurement Project 5,684 562 - - - 5,122 - - - - - -
Scarborough Integrated Transport Scheme 36,110 34,404 60 1,646 - - - - - - - -
Bedale-Aiskew-Leeming Bar Major Scheme 39,113 - - - - - - - - - 259 38,854
Local Transport Plan - Integrated Transport 50,634 30,716 3,703 5,783 4,841 750 750 - - - 4,091 - - Maintenance 185,427 80,311 30,083 26,523 24,065 - - - 1,306 1,300 21,839 - - Regional Funding Allocation 13,362 2,006 3,138 2,729 5,489 - - - - - - -
Economic Development Unit Grants - Renaissance Market Towns 231 207 24 - - - - - - - - - - Access to Opportunities 510 232 278 - - - - - - - - -
Other Minor Schemes 20 17 3 - - - - - - - - -
TOTAL GROSS SPEND 370,542 172,060 45,895 43,722 34,395 5,872 750 20 1,486 1,300 26,189 38,854 Last Update - Q2 2010/11 343,577 172,060 51,286 8,523 4,964 5,974 750 25 33,858 37,507 16,713 11,917
£000
2013/14
£000 £000
APPEN
DIX B
(Page 1 of 2)
£000 £000 £000£000 £000 £000£000
2010/11 2011/12
£000 £000
2010/112011/12 2012/13 Later Years 2012/13 Later Years2013/14
BUSINESS AND ENVIRONMENTAL SERVICES
2010/11 CAPITAL BUDGET MONITORING - POSITION TO 31 DECEMBER 2010
CAPITAL PROGRAMME CAPITAL FORECAST
Total Expenditure to 31.3.10
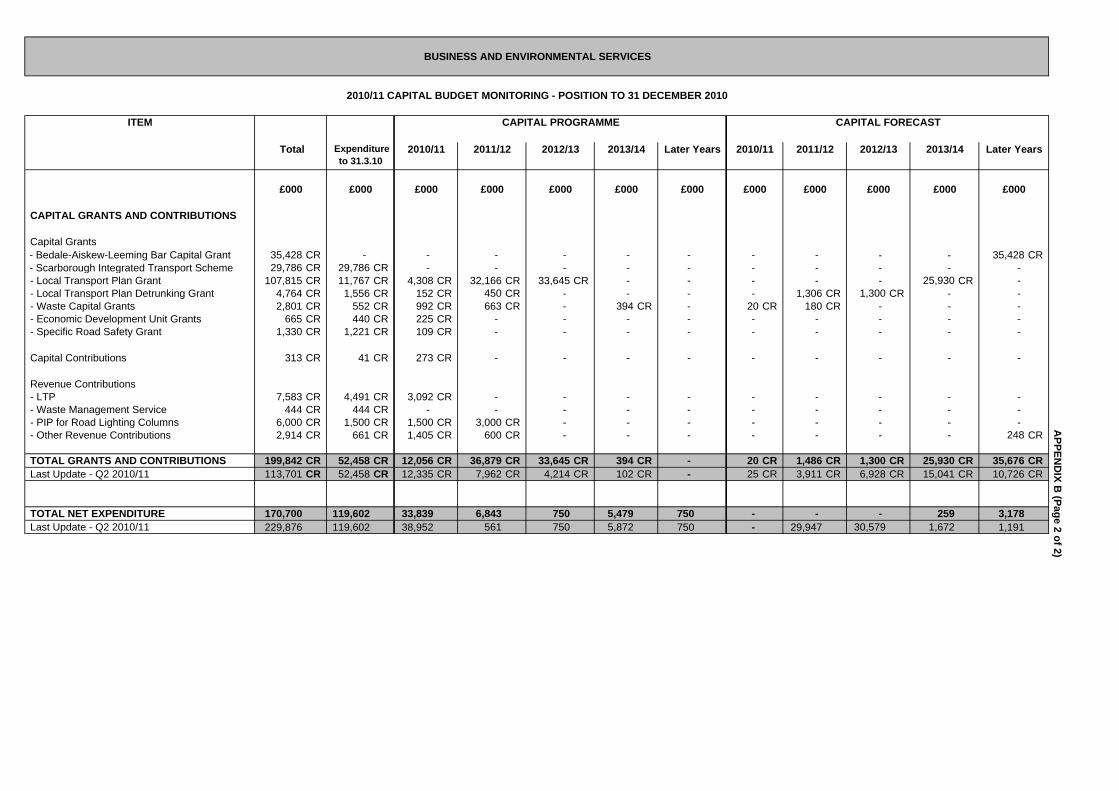
ITEM
CAPITAL GRANTS AND CONTRIBUTIONS
Capital Grants - Bedale-Aiskew-Leeming Bar Capital Grant 35,428 CR - - - - - - - - - - 35,428 CR - Scarborough Integrated Transport Scheme 29,786 CR 29,786 CR - - - - - - - - - - - Local Transport Plan Grant 107,815 CR 11,767 CR 4,308 CR 32,166 CR 33,645 CR - - - - - 25,930 CR - - Local Transport Plan Detrunking Grant 4,764 CR 1,556 CR 152 CR 450 CR - - - - 1,306 CR 1,300 CR - - - Waste Capital Grants 2,801 CR 552 CR 992 CR 663 CR - 394 CR - 20 CR 180 CR - - - - Economic Development Unit Grants 665 CR 440 CR 225 CR - - - - - - - - - - Specific Road Safety Grant 1,330 CR 1,221 CR 109 CR - - - - - - - - -
Capital Contributions 313 CR 41 CR 273 CR - - - - - - - - -
Revenue Contributions - LTP 7,583 CR 4,491 CR 3,092 CR - - - - - - - - - - Waste Management Service 444 CR 444 CR - - - - - - - - - - - PIP for Road Lighting Columns 6,000 CR 1,500 CR 1,500 CR 3,000 CR - - - - - - - - - Other Revenue Contributions 2,914 CR 661 CR 1,405 CR 600 CR - - - - - - - 248 CR
TOTAL GRANTS AND CONTRIBUTIONS 199,842 CR 52,458 CR 12,056 CR 36,879 CR 33,645 CR 394 CR - 20 CR 1,486 CR 1,300 CR 25,930 CR 35,676 CRLast Update - Q2 2010/11 113,701 CR 52,458 CR 12,335 CR 7,962 CR 4,214 CR 102 CR - 25 CR 3,911 CR 6,928 CR 15,041 CR 10,726 CR
TOTAL NET EXPENDITURE 170,700 119,602 33,839 6,843 750 5,479 750 - - - 259 3,178 Last Update - Q2 2010/11 229,876 119,602 38,952 561 750 5,872 750 - 29,947 30,579 1,672 1,191
2013/14
£000
2013/14
£000
2010/11 CAPITAL BUDGET MONITORING - POSITION TO 31 DECEMBER 2010
APPEN
DIX B
(Page 2 of 2)
£000 £000 £000 £000
2010/11 2011/12 2012/13 Later Years
£000 £000 £000£000 £000 £000
2011/12 2012/13 Later Years Total Expenditure to 31.3.10
2010/11
CAPITAL PROGRAMME CAPITAL FORECAST
BUSINESS AND ENVIRONMENTAL SERVICES
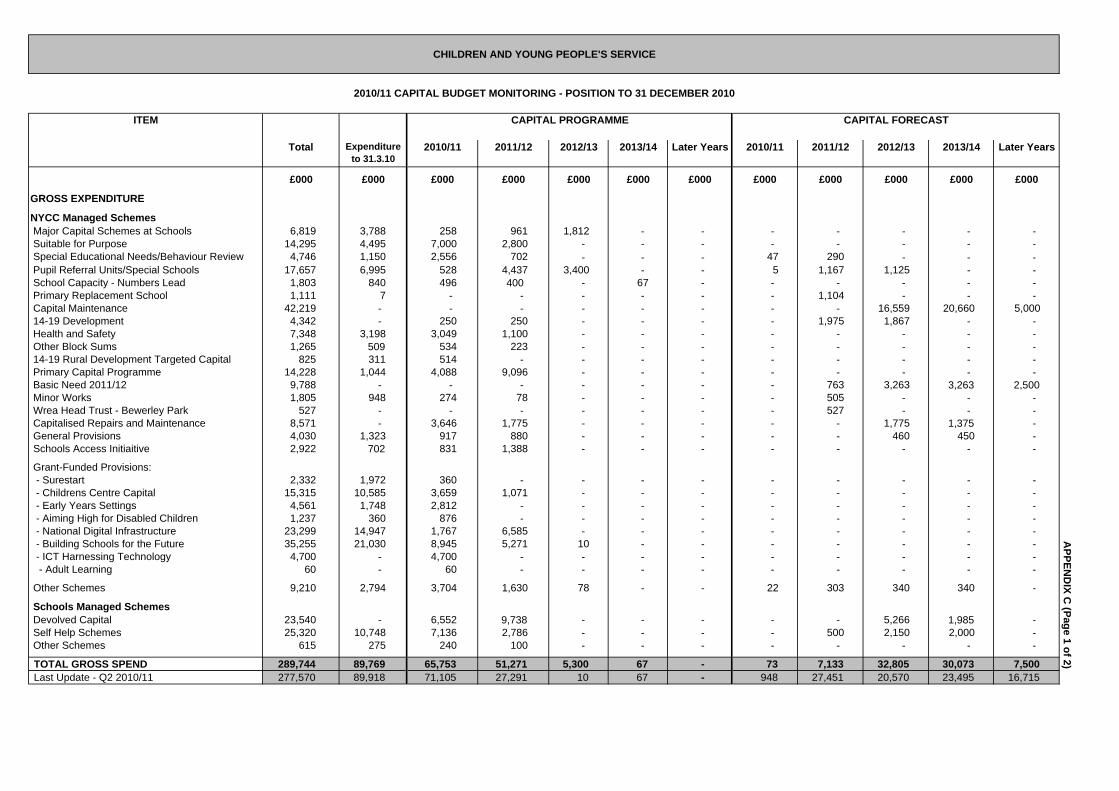
APPEN
DIX C
(Page 1 of 2)CHILDREN AND YOUNG PEOPLE'S SERVICE
2010/11 CAPITAL BUDGET MONITORING - POSITION TO 31 DECEMBER 2010
ITEM CAPITAL PROGRAMME CAPITAL FORECAST
Total Expenditure to 31.3.10
2010/11 2011/12 2012/13 2013/14 Later Years 2010/11 2011/12 2012/13 2013/14 Later Years
£000 £000 £000 £000 £000 £000 £000 £000 £000 £000 £000 £000
GROSS EXPENDITURE
NYCC Managed Schemes Major Capital Schemes at Schools 6,819 3,788 258 961 1,812 - - - - - - - Suitable for Purpose 14,295 4,495 7,000 2,800 - - - - - - - - Special Educational Needs/Behaviour Review 4,746 1,150 2,556 702 - - - 47 290 - - - Pupil Referral Units/Special Schools 17,657 6,995 528 4,437 3,400 - - 5 1,167 1,125 - - School Capacity - Numbers Lead 1,803 840 496 400 - 67 - - - - - - Primary Replacement School 1,111 7 - - - - - - 1,104 - - - Capital Maintenance 42,219 - - - - - - - - 16,559 20,660 5,000 14-19 Development 4,342 - 250 250 - - - - 1,975 1,867 - - Health and Safety 7,348 3,198 3,049 1,100 - - - - - - - - Other Block Sums 1,265 509 534 223 - - - - - - - - 14-19 Rural Development Targeted Capital 825 311 514 - - - - - - - - - Primary Capital Programme 14,228 1,044 4,088 9,096 - - - - - - - - Basic Need 2011/12 9,788 - - - - - - - 763 3,263 3,263 2,500 Minor Works 1,805 948 274 78 - - - - 505 - - - Wrea Head Trust - Bewerley Park 527 - - - - - - - 527 - - - Capitalised Repairs and Maintenance 8,571 - 3,646 1,775 - - - - - 1,775 1,375 - General Provisions 4,030 1,323 917 880 - - - - - 460 450 - Schools Access Initiaitive 2,922 702 831 1,388 - - - - - - - -
Grant-Funded Provisions: - Surestart 2,332 1,972 360 - - - - - - - - - - Childrens Centre Capital 15,315 10,585 3,659 1,071 - - - - - - - - - Early Years Settings 4,561 1,748 2,812 - - - - - - - - - - Aiming High for Disabled Children 1,237 360 876 - - - - - - - - - - National Digital Infrastructure 23,299 14,947 1,767 6,585 - - - - - - - - - Building Schools for the Future 35,255 21,030 8,945 5,271 10 - - - - - - - - ICT Harnessing Technology 4,700 - 4,700 - - - - - - - - - - Adult Learning 60 - 60 - - - - - - - - -
Other Schemes 9,210 2,794 3,704 1,630 78 - - 22 303 340 340 -
Schools Managed Schemes Devolved Capital 23,540 - 6,552 9,738 - - - - - 5,266 1,985 - Self Help Schemes 25,320 10,748 7,136 2,786 - - - - 500 2,150 2,000 - Other Schemes 615 275 240 100 - - - - - - - -
TOTAL GROSS SPEND 289,744 89,769 65,753 51,271 5,300 67 - 73 7,133 32,805 30,073 7,500 Last Update - Q2 2010/11 277,570 89,918 71,105 27,291 10 67 - 948 27,451 20,570 23,495 16,715
APPEN
DIX C
(Page 2 of 2)CHILDREN AND YOUNG PEOPLE'S SERVICE
2010/11 CAPITAL BUDGET MONITORING - POSITION TO 31 DECEMBER 2010
ITEM CAPITAL PROGRAMME CAPITAL FORECAST
Total Expenditure to 31.3.10
2010/11 2011/12 2012/13 2013/14 Later Years 2010/11 2011/12 2012/13 2013/14 Later Years
£000 £000 £000 £000 £000 £000 £000 £000 £000 £000 £000 £000
CAPITAL GRANTS AND CONTRIBUTIONS
NYCC MANAGED SCHEMESCapital Grants- Devolved Capital Grant 5,202 CR 476 CR 2,389 CR 1,612 CR - - - - - 350 CR 375 CR - - NDS Modernisation 11,840 CR 3,653 CR 6,629 CR 1,558 CR - - - - - - - - - Childrens Centre Grant 5,168 CR 1,510 CR 3,659 CR - - - - - - - - - - Surestart 2,332 CR 1,972 CR 360 CR - - - - - - - - - - Building Schools for the Future 32,350 CR 19,300 CR 8,104 CR 4,936 CR 10 CR - - - - - - - - Primary Capital Programme Grant 11,967 CR 1,044 CR 5,294 CR 5,630 CR - - - - - - - - - Targeted Capital Fund 7,342 CR 6,062 CR 1,280 CR - - - - - - - - - - Capital Maintenance 42,219 CR - - 10,535 CR 5,212 CR - - - 953 CR 11,447 CR 14,073 CR - - Basic Need Grant 9,788 CR - - - - - - - 763 CR 3,263 CR 3,263 CR 2,500 CR- 14-19 Rural Development 800 CR 311 CR 489 CR - - - - - - - - - - ICT Harnessing Technology 4,700 CR - 4,700 CR - - - - - - - - - - National Digital Infrastructure 14,688 CR 14,341 CR 347 CR - - - - - - - - - - Early Years Settings 4,561 CR 1,748 CR 2,812 CR - - - - - - - - - - Other 6,283 CR 2,376 CR 3,287 CR 550 CR - - - - 70 CR - - - Capital Contributions -Self Help Schemes 12,014 8,909 3,105 - - - - - - - - - - Other 2,020 CR 817 CR 241 CR - - - - - 962 CR - - -
Revenue Contributions - Capitalised Repairs & Maintenance 4,992 CR - 1,742 CR 825 CR - - - - - 1,425 CR 1,000 CR - - Self Help Schemes 6,154 CR - 312 CR 5,342 CR - - - - 500 CR - - -
- from the Pending issues Provision 4,000 CR - - - - - - - 1,000 CR 3,000- CR - - - Other 9,420 CR 2,392 CR 2,956 CR 2,564 CR 78 CR - - - - 720 CR 710 CR -
SCHOOLS MANAGED SCHEMES - Devolved Capital Grant 24,390 CR 450 CR 6,952 CR 9,738 CR - - - - - 5,266 CR 1,985 CR - - Capital Contributions - Self Help Schemes 2,798 CR 658 CR 640 CR 500 CR - - - - - 500 CR 500 CR - - Revenue Contributions - Self Help Schemes 8,181 CR 451 CR 2,680 CR 1,900 CR - - - - - 1,650 CR 1,500 CR -
TOTAL GRANTS AND CONTRIBUTIONS 233,207 CR 66,469 CR 57,975 CR 45,689 CR 5,300 CR - - - 4,248 CR 27,620 CR 23,406 CR 2,500 CRLast Update - Q2 2010/11 213,264 CR 66,469 CR 60,813 CR 12,945 CR 10 CR - - 63 CR 25,283 CR 16,171 CR 19,560 CR 11,950 CR
TOTAL NET EXPENDITURE 56,536 23,300 7,777 5,582 - 67 - 73 2,886 5,184 6,667 5,000 Last Update - Q2 2010/11 64,307 23,449 10,292 14,347 - 67 - 886 2,167 4,399 3,935 4,765
APPEN
DIX D
(Page 1 of 2)OTHER COUNTY SERVICES
2010/11 CAPITAL BUDGET MONITORING - POSITION TO 31 DECEMBER 2010
ITEM CAPITAL PROGRAMME CAPITAL FORECAST
Total Expenditure to 31.3.10
2010/11 2011/12 2012/13 2013/14 Later Years 2010/11 2011/12 2012/13 2013/14 Later Years
£000 £000 £000 £000 £000 £000 £000 £000 £000 £000 £000 £000
GROSS EXPENDITURE
Material Damage Provision 1,900 - 400 - - - - - 500 500 500 - Public Access to Buildings for Disabled 1,250 543 23 245 - - - - 314 125 - - Affordable Housing Fund - Initial Provision 4,000 2,434 583 984 - - - - - - - - - Additional Exec Approval - 4 Nov 08 1,780 - - 1,145 635 - - - - - - - Control of Legionella Bacteria in Water 450 294 156 - - - - - - - - - Purchase of Vehicles, Plant & Equip 400 - 100 - - - - - 100 100 100 - Telephone Contact Centre 1,010 986 24 - - - - - - - - - Carbon Reduction Initiative 750 220 250 - - - - - 280 - - - Travellers' Sites 1,351 - 1,351 - - - - - - - - - Northallerton Bright Office Strategy 4,190 2,847 1,343 - - - - - - - - - Skipton Bright Office Strategy 2,427 6 1,793 628 - - - - - - - - Harrogate Bright Office Strategy 2,165 6 359 1,800 - - - - - - - - Richmond Bright Office Strategy 332 36 296 - - - - - - - - -
Revenue-Funded Capital Provisions: - STIC - ICT Equipment 202 168 33 - - - - - - - - - - ICT Infrastructure (FCS) 3,529 1,466 1,110 - - - - - 406 406 141 - - SDT Refresh (all Directorates) 1,374 900 114 - - - - - 120 120 120 - - Corporate Accomadation Schemes 474 82 393 - - - - - - - - - - Farms Improvement Scheme 806 16 326 465 - - - - - - - - - Ventilation Scheme 1,243 906 337 - - - - - - - - - - Windows Scheme 90 - 23 67 - - - - - - - - - Air Conditioning Scheme 30 - 30 - - - - - - - - -
Safer Stronger Communities Fund 437 350 87 - - - - - - - - -
NY Data Observatory Project 125 - 125 - - - - - - - - -
Loans to Limited Companies etc. 13,900 8,742 5,158 - - - - - - - - -
TOTAL GROSS SPEND 44,214 20,001 14,413 5,333 635 - - - 1,720 1,251 861 0 Last Update - Q2 2010/11 46,789 20,001 13,757 3,989 - - - 1,748 2,080 1,967 1,624 1,624
APPEN
DIX D
(Page 2 of 2)
OTHER COUNTY SERVICES
2010/11 CAPITAL BUDGET MONITORING - POSITION TO 31 DECEMBER 2010
ITEM CAPITAL PROGRAMME CAPITAL FORECAST
Total Expenditure to 31.3.10
2010/11 2011/12 2012/13 2013/14 Later Years 2010/11 2011/12 2012/13 2013/14 Later Years
£000 £000 £000 £000 £000 £000 £000 £000 £000 £000 £000 £000
CAPITAL GRANTS AND CONTRIBUTIONS
Capital Grants - Safer Stronger Communities Fund 437 CR 350 CR 87 CR - - - - - - - - - - Travellers' Sites 345 CR - 345 CR - - - - - - - - - - Regional Improvement Grant 125 - 125 CR - - - - - - - - -
Revenue Contributions - Northallerton Bright Office Strategy 1,690 CR 240 CR 1,450 CR - - - - - - - - - - Skipton Bright Office Strategy 500 CR - 450 CR 50 CR - - - - - - - -
- Harrogate Bright Office Strategy 1,205 CR - 365 CR 840 CR - - - - - - - - - Carbon Reduction Initiative 750 CR 220 CR 250 CR - - - - - 280 CR - - - - Travellers' Sites 206 CR - 206 CR - - - - - - - - -
- STIC - ICT Equipment (PIP Funded) 202 CR 168 CR 33 CR - - - - - - - - - - ICT Infrastructure (FCS) 3,529 CR 1,466 CR 1,110 CR - - - - - 406 CR 406 CR 141 CR - - SDT Refresh 1,374 CR 900 CR 114 CR - - - - - 120 CR 120 CR 120 CR - - Corporate Accomadation Schemes 474 CR 82 CR 393 CR - - - - - - - - - - Farms Improvement Scheme 806 CR 16 CR 326 CR 465 CR - - - - - - - - - Ventilation Scheme 1,243 CR 906 CR 337 CR - - - - - - - - - - Windows Scheme 90 CR - 23 CR 67 CR - - - - - - - - - Air Conditioning Scheme 30 CR - 30 CR - - - - - - - - -
TOTAL GRANTS AND CONTRIBUTIONS 13,005 CR 4,347 CR 5,643 CR 1,422 CR - - - - 806 CR 526 CR 261 CR - Last Update - Q2 2010/11 12,860 CR 4,347 CR 4,992 CR 957 CR - - - 1,209 CR 1,355 CR - - -
TOTAL NET EXPENDITURE 31,209 15,654 8,770 3,912 635 - - - 914 725 600 0 Last Update - Q2 2010/11 33,929 15,654 8,765 3,032 - - - 539 725 1,967 1,624 1,624
£m £m £m £m £m £m £m £m £m £m £m £m £m £m £m £m £m £m £m £m £m
Programme 14.5 3.4 3.7 7.0 0.4 - - 5.9 CR 1.2 CR 1.3 CR 2.1 CR 1.3 CR - - 8.6 2.2 2.4 4.9 0.9 CR - -
Forecast 19.5 - - 3.2 6.1 4.7 5.5 1.3 CR - - - - 1.3 CR - 18.2 - - 3.2 6.1 3.4 5.5
Total 34.0 3.4 3.7 10.2 6.5 4.7 5.5 7.2 CR 1.2 CR 1.3 CR 2.1 CR 1.3 CR 1.3 CR - 26.8 2.2 2.4 8.1 5.2 3.4 5.5
Programme 302.7 172.0 45.9 43.7 34.4 5.9 0.8 135.6 CR 52.5 CR 12.1 CR 36.9 CR 33.7 CR 0.4 CR - 167.2 119.6 33.8 6.8 0.8 5.5 0.7
Forecast 67.8 - - 1.5 1.3 26.2 38.8 64.4 CR - 0.0 CR 1.5 CR 1.3 CR 25.9 CR 35.7 CR 3.5 - - - - 0.3 3.2
Total 370.5 172.0 45.9 45.2 35.7 32.1 39.6 200.0 CR 52.5 CR 12.1 CR 38.4 CR 35.0 CR 26.3 CR 35.7 CR 170.7 119.6 33.8 6.8 0.8 5.8 3.9
Programme 212.3 89.8 65.8 51.3 5.3 0.1 - 175.5 CR 66.5 CR 58.0 CR 45.7 CR 5.3 CR - - 36.8 23.3 7.8 5.6 - 0.1 -
Forecast 77.5 - 0.1 7.1 32.8 30.0 7.5 57.7 CR - - 4.2 CR 27.6 CR 23.4 CR 2.5 CR 19.8 - 0.1 2.9 5.2 6.6 5.0
Total 289.8 89.8 65.9 58.4 38.1 30.1 7.5 233.2 CR 66.5 CR 58.0 CR 49.9 CR 32.9 CR 23.4 CR 2.5 CR 56.6 23.3 7.9 8.5 5.2 6.7 5.0
Programme 40.3 20.0 14.4 5.3 0.6 - - 11.3 CR 4.3 CR 5.6 CR 1.4 CR - - - 28.9 15.6 8.8 3.9 0.6 - -
Forecast 3.9 - - 1.7 1.3 0.9 0.0 1.6 CR - - 0.8 CR 0.5 CR 0.3 CR - 2.2 - - 0.9 0.7 0.6 -
Total 44.2 20.0 14.4 7.0 1.9 0.9 0.0 12.9 CR 4.3 CR 5.6 CR 2.2 CR 0.5 CR 0.3 CR - 31.1 15.6 8.8 4.8 1.3 0.6 0.0
Total 738.5 285.2 129.9 120.8 82.2 67.8 52.6 453.3 CR 124.5 CR 77.0 CR 92.6 CR 69.7 CR 51.3 CR 38.2 CR 285.2 160.7 52.9 28.2 12.5 16.5 14.4
Memo Item
Programme 569.8 285.2 129.8 107.3 40.7 6.0 0.8 328.3 CR 124.5 CR 77.0 CR 86.1 CR 40.3 CR 0.4 CR - 241.6 160.7 52.8 21.3 0.5 5.6 0.7
Forecast 168.7 - 0.1 13.5 41.5 61.8 51.8 125.0 CR - 0.0 CR 6.5 CR 29.4 CR 50.9 CR 38.2 CR 43.7 - 0.1 7.0 12.0 10.9 13.7
Total 738.5 285.2 129.9 120.8 82.2 67.8 52.6 453.3 CR 124.5 CR 77.0 CR 92.6 CR 69.7 CR 51.3 CR 38.2 CR 285.3 160.7 52.9 28.3 12.5 16.5 14.4
13/14 13/14 Later Years
10/11 11/12
Q3 CAPITAL PROGRAMME AND FORECAST 2010/11 - SUMMARY POSITION TO 31 DECEMBER 2010
10/11 11/12 12/1312/13 Later Years
Total Net to 31.3.10
NET EXPENDITURE
Inc to 31.3.10
OCS (Appendix D)
GROSS EXPENDITURE GRANTS AND CONTRIBUTIONS
Total Exp to 31.3.10
10/11 11/12 12/13
ACS (Appendix A)
BES (Appendix B)
CYPS (Appendix C)
Later Years
Total13/14
APPEN
DIX E
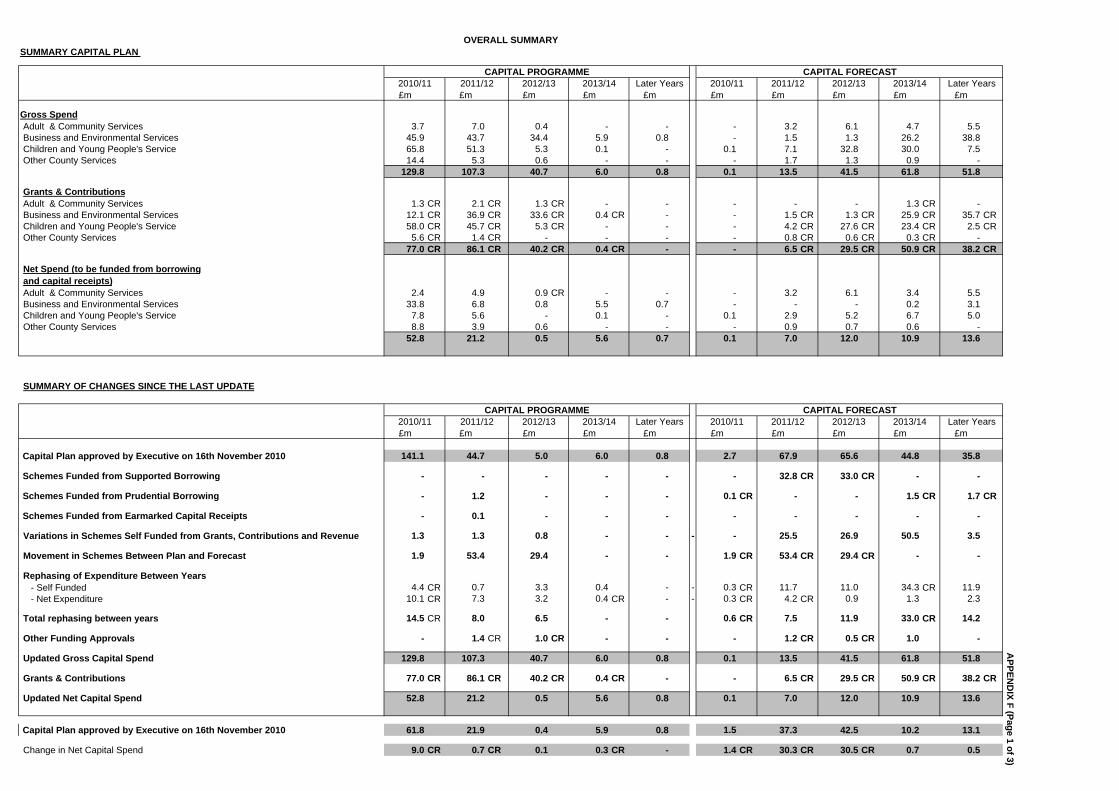
£m £m £m £m £m £m £m £m £m £m
Gross SpendAdult & Community Services 3.7 7.0 0.4 - - - 3.2 6.1 4.7 5.5 Business and Environmental Services 45.9 43.7 34.4 5.9 0.8 - 1.5 1.3 26.2 38.8 Children and Young People's Service 65.8 51.3 5.3 0.1 - 0.1 7.1 32.8 30.0 7.5 Other County Services 14.4 5.3 0.6 - - - 1.7 1.3 0.9 -
129.8 107.3 40.7 6.0 0.8 0.1 13.5 41.5 61.8 51.8
Grants & ContributionsAdult & Community Services 1.3 CR 2.1 CR 1.3 CR - - - - - 1.3 CR - Business and Environmental Services 12.1 CR 36.9 CR 33.6 CR 0.4 CR - - 1.5 CR 1.3 CR 25.9 CR 35.7 CRChildren and Young People's Service 58.0 CR 45.7 CR 5.3 CR - - - 4.2 CR 27.6 CR 23.4 CR 2.5 CROther County Services 5.6 CR 1.4 CR - - - - 0.8 CR 0.6 CR 0.3 CR -
77.0 CR 86.1 CR 40.2 CR 0.4 CR - - 6.5 CR 29.5 CR 50.9 CR 38.2 CR
Net Spend (to be funded from borrowingand capital receipts)Adult & Community Services 2.4 4.9 0.9 CR - - - 3.2 6.1 3.4 5.5 Business and Environmental Services 33.8 6.8 0.8 5.5 0.7 - - - 0.2 3.1 Children and Young People's Service 7.8 5.6 - 0.1 - 0.1 2.9 5.2 6.7 5.0 Other County Services 8.8 3.9 0.6 - - - 0.9 0.7 0.6 -
52.8 21.2 0.5 5.6 0.7 0.1 7.0 12.0 10.9 13.6
£m £m £m £m £m £m £m £m £m £m
141.1 44.7 5.0 6.0 0.8 2.7 67.9 65.6 44.8 35.8
- - - - - - 32.8 CR 33.0 CR - -
- 1.2 - - - 0.1 CR - - 1.5 CR 1.7 CR
- 0.1 - - - - - - - -
Variations in Schemes Self Funded from Grants, Contributions and Revenue 1.3 1.3 0.8 - - - - 25.5 26.9 50.5 3.5
Movement in Schemes Between Plan and Forecast 1.9 53.4 29.4 - - 1.9 CR 53.4 CR 29.4 CR - -
Rephasing of Expenditure Between Years - Self Funded 4.4 CR 0.7 3.3 0.4 - - 0.3 CR 11.7 11.0 34.3 CR 11.9 - Net Expenditure 10.1 CR 7.3 3.2 0.4 CR - - 0.3 CR 4.2 CR 0.9 1.3 2.3
Total rephasing between years 14.5 CR 8.0 6.5 - - 0.6 CR 7.5 11.9 33.0 CR 14.2
Other Funding Approvals - 1.4 CR 1.0 CR - - - 1.2 CR 0.5 CR 1.0 -
Updated Gross Capital Spend 129.8 107.3 40.7 6.0 0.8 0.1 13.5 41.5 61.8 51.8
Grants & Contributions 77.0 CR 86.1 CR 40.2 CR 0.4 CR - - 6.5 CR 29.5 CR 50.9 CR 38.2 CR
Updated Net Capital Spend 52.8 21.2 0.5 5.6 0.8 0.1 7.0 12.0 10.9 13.6
61.8 21.9 0.4 5.9 0.8 1.5 37.3 42.5 10.2 13.1
Change in Net Capital Spend 9.0 CR 0.7 CR 0.1 0.3 CR - 1.4 CR 30.3 CR 30.5 CR 0.7 0.5
Capital Plan approved by Executive on 16th November 2010
APPEN
DIX F (Page 1 of 3)
2010/11 2011/12 2012/13
2010/11Later Years
CAPITAL PROGRAMME CAPITAL FORECAST
CAPITAL PROGRAMME CAPITAL FORECAST
2013/14Later Years2013/14 Later Years
SUMMARY OF CHANGES SINCE THE LAST UPDATE
Schemes Funded from Supported Borrowing
Schemes Funded from Prudential Borrowing
Schemes Funded from Earmarked Capital Receipts
Capital Plan approved by Executive on 16th November 2010
2010/11 2011/12 2012/13
2012/13 Later Years
OVERALL SUMMARYSUMMARY CAPITAL PLAN
2013/142010/11 2011/12 2011/12 2012/13 2013/14
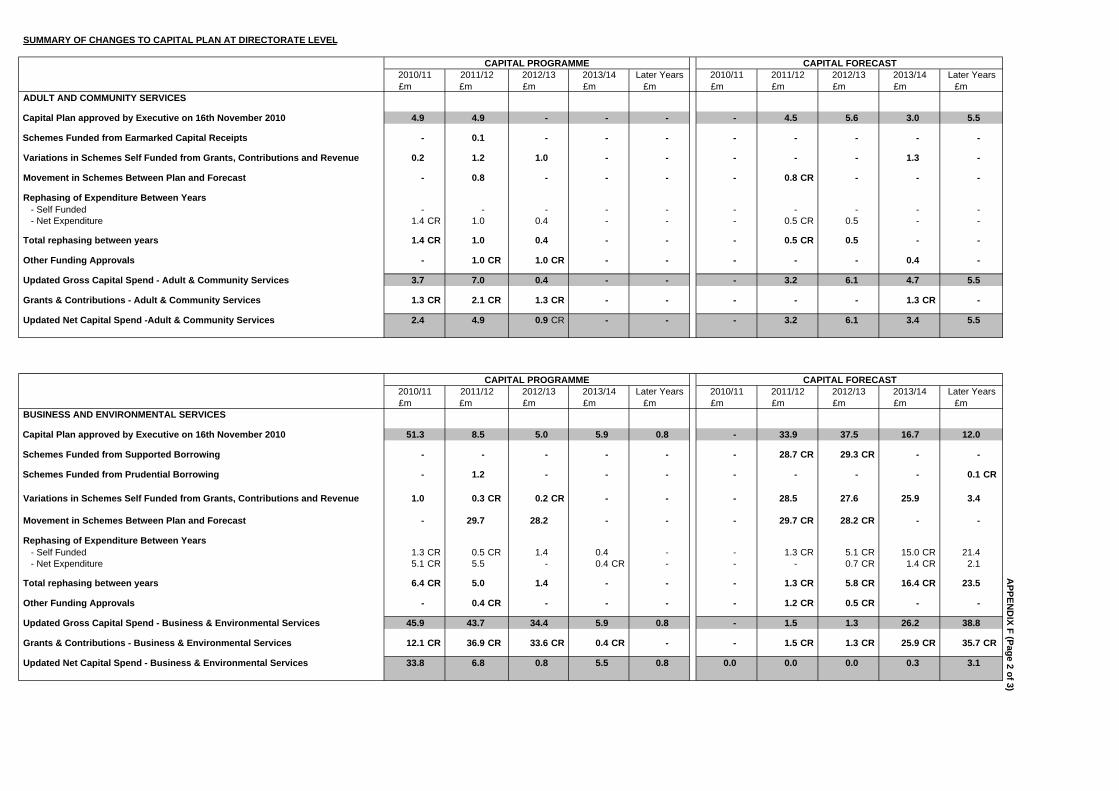
SUMMARY OF CHANGES TO CAPITAL PLAN AT DIRECTORATE LEVEL
£m £m £m £m £m £m £m £m £m £mADULT AND COMMUNITY SERVICES
4.9 4.9 - - - - 4.5 5.6 3.0 5.5
- 0.1 - - - - - - - -
Variations in Schemes Self Funded from Grants, Contributions and Revenue 0.2 1.2 1.0 - - - - - 1.3 -
Movement in Schemes Between Plan and Forecast - 0.8 - - - - 0.8 CR - - -
Rephasing of Expenditure Between Years - Self Funded - - - - - - - - - - - Net Expenditure 1.4 CR 1.0 0.4 - - - 0.5 CR 0.5 - -
Total rephasing between years 1.4 CR 1.0 0.4 - - - 0.5 CR 0.5 - -
Other Funding Approvals - 1.0 CR 1.0 CR - - - - - 0.4 -
Updated Gross Capital Spend - Adult & Community Services 3.7 7.0 0.4 - - - 3.2 6.1 4.7 5.5
Grants & Contributions - Adult & Community Services 1.3 CR 2.1 CR 1.3 CR - - - - - 1.3 CR -
Updated Net Capital Spend -Adult & Community Services 2.4 4.9 0.9 CR - - - 3.2 6.1 3.4 5.5
£m £m £m £m £m £m £m £m £m £mBUSINESS AND ENVIRONMENTAL SERVICES
51.3 8.5 5.0 5.9 0.8 - 33.9 37.5 16.7 12.0
- - - - - - 28.7 CR 29.3 CR - -
- 1.2 - - - - - - - 0.1 CR
Variations in Schemes Self Funded from Grants, Contributions and Revenue 1.0 0.3 CR 0.2 CR - - - 28.5 27.6 25.9 3.4
Movement in Schemes Between Plan and Forecast - 29.7 28.2 - - - 29.7 CR 28.2 CR - -
Rephasing of Expenditure Between Years - Self Funded 1.3 CR 0.5 CR 1.4 0.4 - - 1.3 CR 5.1 CR 15.0 CR 21.4 - Net Expenditure 5.1 CR 5.5 - 0.4 CR - - - 0.7 CR 1.4 CR 2.1
Total rephasing between years 6.4 CR 5.0 1.4 - - - 1.3 CR 5.8 CR 16.4 CR 23.5
Other Funding Approvals - 0.4 CR - - - - 1.2 CR 0.5 CR - -
Updated Gross Capital Spend - Business & Environmental Services 45.9 43.7 34.4 5.9 0.8 - 1.5 1.3 26.2 38.8
Grants & Contributions - Business & Environmental Services 12.1 CR 36.9 CR 33.6 CR 0.4 CR - - 1.5 CR 1.3 CR 25.9 CR 35.7 CR
Updated Net Capital Spend - Business & Environmental Services 33.8 6.8 0.8 5.5 0.8 0.0 0.0 0.0 0.3 3.1
APPEN
DIX F (Page 2 of 3)
CAPITAL PROGRAMME CAPITAL FORECAST
CAPITAL PROGRAMME CAPITAL FORECAST
2010/11 2011/12 2012/13 Later YearsLater Years 2013/142012/132011/122013/14 2010/11
Schemes Funded from Supported Borrowing
Schemes Funded from Prudential Borrowing
2010/11 2011/12
Schemes Funded from Earmarked Capital Receipts
Capital Plan approved by Executive on 16th November 2010
2013/142011/122012/13 Later Years 2010/112013/14 2012/13
Capital Plan approved by Executive on 16th November 2010
Later Years
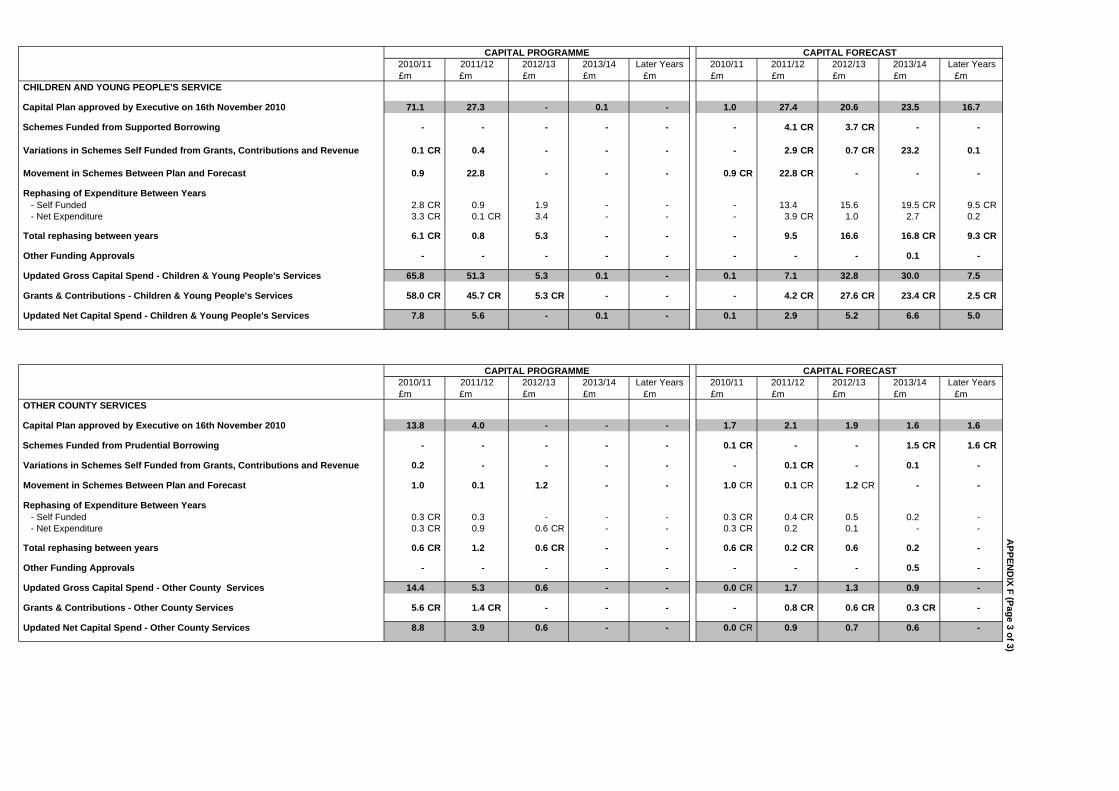
£m £m £m £m £m £m £m £m £m £mCHILDREN AND YOUNG PEOPLE'S SERVICE
71.1 27.3 - 0.1 - 1.0 27.4 20.6 23.5 16.7
- - - - - - 4.1 CR 3.7 CR - -
Variations in Schemes Self Funded from Grants, Contributions and Revenue 0.1 CR 0.4 - - - - 2.9 CR 0.7 CR 23.2 0.1
Movement in Schemes Between Plan and Forecast 0.9 22.8 - - - 0.9 CR 22.8 CR - - -
Rephasing of Expenditure Between Years - Self Funded 2.8 CR 0.9 1.9 - - - 13.4 15.6 19.5 CR 9.5 CR - Net Expenditure 3.3 CR 0.1 CR 3.4 - - - 3.9 CR 1.0 2.7 0.2
Total rephasing between years 6.1 CR 0.8 5.3 - - - 9.5 16.6 16.8 CR 9.3 CR
Other Funding Approvals - - - - - - - - 0.1 -
Updated Gross Capital Spend - Children & Young People's Services 65.8 51.3 5.3 0.1 - 0.1 7.1 32.8 30.0 7.5
Grants & Contributions - Children & Young People's Services 58.0 CR 45.7 CR 5.3 CR - - - 4.2 CR 27.6 CR 23.4 CR 2.5 CR
Updated Net Capital Spend - Children & Young People's Services 7.8 5.6 - 0.1 - 0.1 2.9 5.2 6.6 5.0
£m £m £m £m £m £m £m £m £m £mOTHER COUNTY SERVICES
13.8 4.0 - - - 1.7 2.1 1.9 1.6 1.6
- - - - - 0.1 CR - - 1.5 CR 1.6 CR
Variations in Schemes Self Funded from Grants, Contributions and Revenue 0.2 - - - - - 0.1 CR - 0.1 -
Movement in Schemes Between Plan and Forecast 1.0 0.1 1.2 - - 1.0 CR 0.1 CR 1.2 CR - -
Rephasing of Expenditure Between Years - Self Funded 0.3 CR 0.3 - - - 0.3 CR 0.4 CR 0.5 0.2 - - Net Expenditure 0.3 CR 0.9 0.6 CR - - 0.3 CR 0.2 0.1 - -
Total rephasing between years 0.6 CR 1.2 0.6 CR - - 0.6 CR 0.2 CR 0.6 0.2 -
Other Funding Approvals - - - - - - - - 0.5 -
Updated Gross Capital Spend - Other County Services 14.4 5.3 0.6 - - 0.0 CR 1.7 1.3 0.9 -
Grants & Contributions - Other County Services 5.6 CR 1.4 CR - - - - 0.8 CR 0.6 CR 0.3 CR -
Updated Net Capital Spend - Other County Services 8.8 3.9 0.6 - - 0.0 CR 0.9 0.7 0.6 -
APPEN
DIX F (Page 3 of 3)
CAPITAL PROGRAMME CAPITAL FORECAST
CAPITAL PROGRAMME CAPITAL FORECAST
2013/14
Capital Plan approved by Executive on 16th November 2010
Schemes Funded from Prudential Borrowing
Capital Plan approved by Executive on 16th November 2010
Schemes Funded from Supported Borrowing
Later Years
2010/11 2011/12 2012/13 Later Years 2010/11 2011/12
2012/13
2013/14
2010/11
2012/13 Later Years2013/14
2011/12 2013/142010/11 2011/12 2012/13Later Years
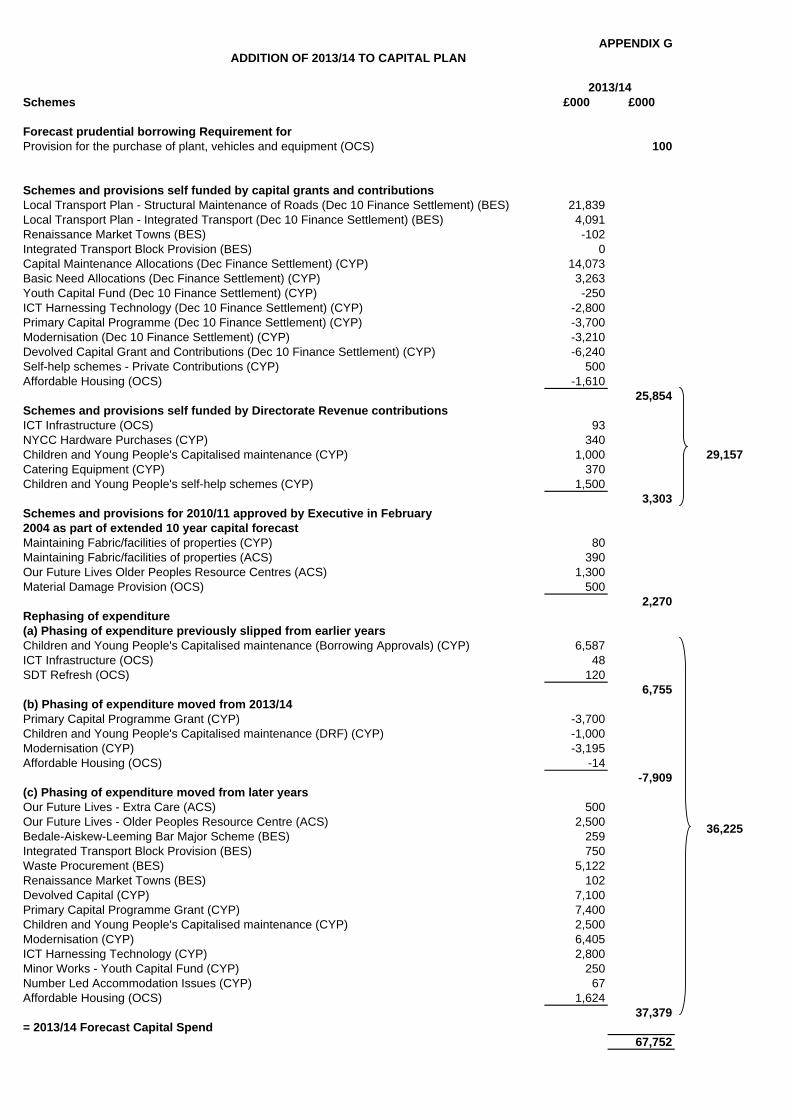
Schemes £000 £000
Forecast prudential borrowing Requirement forProvision for the purchase of plant, vehicles and equipment (OCS) 100
Schemes and provisions self funded by capital grants and contributionsLocal Transport Plan - Structural Maintenance of Roads (Dec 10 Finance Settlement) (BES) 21,839Local Transport Plan - Integrated Transport (Dec 10 Finance Settlement) (BES) 4,091Renaissance Market Towns (BES) -102Integrated Transport Block Provision (BES) 0Capital Maintenance Allocations (Dec Finance Settlement) (CYP) 14,073Basic Need Allocations (Dec Finance Settlement) (CYP) 3,263Youth Capital Fund (Dec 10 Finance Settlement) (CYP) -250ICT Harnessing Technology (Dec 10 Finance Settlement) (CYP) -2,800Primary Capital Programme (Dec 10 Finance Settlement) (CYP) -3,700Modernisation (Dec 10 Finance Settlement) (CYP) -3,210Devolved Capital Grant and Contributions (Dec 10 Finance Settlement) (CYP) -6,240Self-help schemes - Private Contributions (CYP) 500Affordable Housing (OCS) -1,610
25,854Schemes and provisions self funded by Directorate Revenue contributionsICT Infrastructure (OCS) 93NYCC Hardware Purchases (CYP) 340Children and Young People's Capitalised maintenance (CYP) 1,000 29,157Catering Equipment (CYP) 370Children and Young People's self-help schemes (CYP) 1,500
3,303Schemes and provisions for 2010/11 approved by Executive in February2004 as part of extended 10 year capital forecastMaintaining Fabric/facilities of properties (CYP) 80Maintaining Fabric/facilities of properties (ACS) 390Our Future Lives Older Peoples Resource Centres (ACS) 1,300Material Damage Provision (OCS) 500
2,270Rephasing of expenditure (a) Phasing of expenditure previously slipped from earlier yearsChildren and Young People's Capitalised maintenance (Borrowing Approvals) (CYP) 6,587ICT Infrastructure (OCS) 48SDT Refresh (OCS) 120
6,755(b) Phasing of expenditure moved from 2013/14Primary Capital Programme Grant (CYP) -3,700Children and Young People's Capitalised maintenance (DRF) (CYP) -1,000Modernisation (CYP) -3,195Affordable Housing (OCS) -14
-7,909(c) Phasing of expenditure moved from later yearsOur Future Lives - Extra Care (ACS) 500Our Future Lives - Older Peoples Resource Centre (ACS) 2,500Bedale-Aiskew-Leeming Bar Major Scheme (BES) 259Integrated Transport Block Provision (BES) 750Waste Procurement (BES) 5,122Renaissance Market Towns (BES) 102Devolved Capital (CYP) 7,100Primary Capital Programme Grant (CYP) 7,400Children and Young People's Capitalised maintenance (CYP) 2,500Modernisation (CYP) 6,405ICT Harnessing Technology (CYP) 2,800Minor Works - Youth Capital Fund (CYP) 250Number Led Accommodation Issues (CYP) 67Affordable Housing (OCS) 1,624
37,379= 2013/14 Forecast Capital Spend
67,752
2013/14
APPENDIX GADDITION OF 2013/14 TO CAPITAL PLAN
36,225
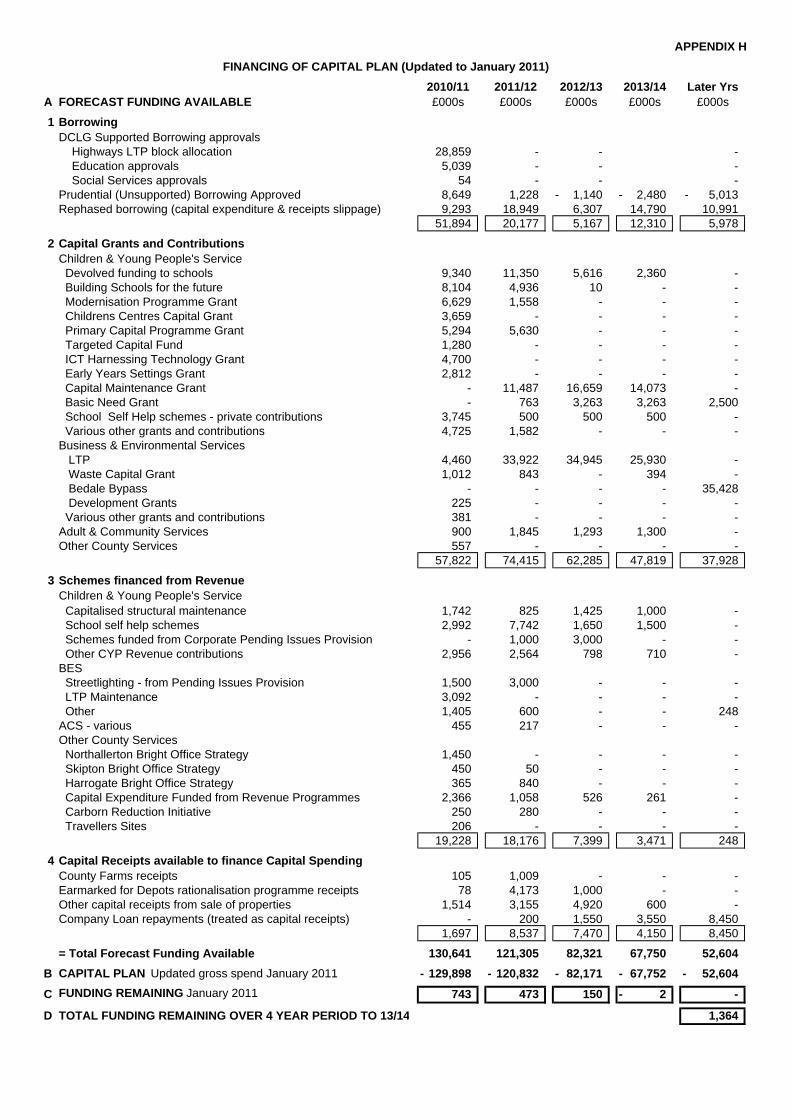
APPENDIX H FINANCING OF CAPITAL PLAN (Updated to January 2011)
2010/11 2011/12 2012/13 2013/14 Later YrsA FORECAST FUNDING AVAILABLE £000s £000s £000s £000s £000s
1 BorrowingDCLG Supported Borrowing approvals Highways LTP block allocation 28,859 - - - Education approvals 5,039 - - - Social Services approvals 54 - - - Prudential (Unsupported) Borrowing Approved 8,649 1,228 1,140- 2,480- 5,013- Rephased borrowing (capital expenditure & receipts slippage) 9,293 18,949 6,307 14,790 10,991
51,894 20,177 5,167 12,310 5,978
2 Capital Grants and ContributionsChildren & Young People's Service Devolved funding to schools 9,340 11,350 5,616 2,360 - Building Schools for the future 8,104 4,936 10 - - Modernisation Programme Grant 6,629 1,558 - - - Childrens Centres Capital Grant 3,659 - - - - Primary Capital Programme Grant 5,294 5,630 - - - Targeted Capital Fund 1,280 - - - - ICT Harnessing Technology Grant 4,700 - - - - Early Years Settings Grant 2,812 - - - - Capital Maintenance Grant - 11,487 16,659 14,073 - Basic Need Grant - 763 3,263 3,263 2,500 School Self Help schemes - private contributions 3,745 500 500 500 - Various other grants and contributions 4,725 1,582 - - - Business & Environmental Services LTP 4,460 33,922 34,945 25,930 - Waste Capital Grant 1,012 843 - 394 - Bedale Bypass - - - - 35,428 Development Grants 225 - - - - Various other grants and contributions 381 - - - - Adult & Community Services 900 1,845 1,293 1,300 - Other County Services 557 - - - -
57,822 74,415 62,285 47,819 37,928
3 Schemes financed from RevenueChildren & Young People's Service Capitalised structural maintenance 1,742 825 1,425 1,000 - School self help schemes 2,992 7,742 1,650 1,500 - Schemes funded from Corporate Pending Issues Provision - 1,000 3,000 - - Other CYP Revenue contributions 2,956 2,564 798 710 - BES Streetlighting - from Pending Issues Provision 1,500 3,000 - - - LTP Maintenance 3,092 - - - - Other 1,405 600 - - 248 ACS - various 455 217 - - - Other County Services Northallerton Bright Office Strategy 1,450 - - - - Skipton Bright Office Strategy 450 50 - - - Harrogate Bright Office Strategy 365 840 - - - Capital Expenditure Funded from Revenue Programmes 2,366 1,058 526 261 - Carborn Reduction Initiative 250 280 - - - Travellers Sites 206 - - - -
19,228 18,176 7,399 3,471 248
4 Capital Receipts available to finance Capital SpendingCounty Farms receipts 105 1,009 - - - Earmarked for Depots rationalisation programme receipts 78 4,173 1,000 - - Other capital receipts from sale of properties 1,514 3,155 4,920 600 - Company Loan repayments (treated as capital receipts) - 200 1,550 3,550 8,450
1,697 8,537 7,470 4,150 8,450
= Total Forecast Funding Available 130,641 121,305 82,321 67,750 52,604 B CAPITAL PLAN Updated gross spend January 2011 129,898- 120,832- 82,171- 67,752- 52,604-
C FUNDING REMAINING January 2011 743 473 150 2- -
D TOTAL FUNDING REMAINING OVER 4 YEAR PERIOD TO 13/14 1,364
9.0 BUDGET SAVINGS 9.1 The overall level of Budget savings required by the County Council in 2010/11 are a
combination of the following:
(i) the need to complete the third year of the VFM Plan reflected in the 2010/11 Revenue Budget / MTFS
(ii) the additional savings identified as necessary in the 2010/11 Revenue Budget
/ MTFS (iii) the need to implement the expenditure reductions necessary to match the in
year grant reductions announced by the Government in June 2010
9.2 Details of savings proposals for 2011/12 and subsequent years are included in the Revenue Budget 2011/12 and Medium Term Financial Strategy for 2011-15 report that was approved by Executive on 8 February 2011 and for subsequent consideration by County Council on 16 February 2011.
9.3 This report concentrates on the savings required for the current financial year
2010/11 as indicated in paragraph 9.1 above. 9.4 The total savings required in 2010/11 which are reflected in Directorate budgets
total £19.598m with a breakdown provided in Appendix A and a Directorate summary being as follows:
£000
ACS 7,972 BES 3,396 CYPS 7,386 CEG 291 F&CS 330 Corp Misc 223
19,598
9.5 Details of the individual items each Directorate is implementing to achieve the overall target reduction of £19.598m for 2010/11 are provided in Appendix B. The schedule shows that all Directorates have plans to meet their targets. The schedule also indicates a current assessment of the level of risk attached to each plan using a simple high/medium/low index. Appendix B shows that £1.2m of the ACS savings are still rated as high risk but this potential shortfall has largely been offset within the overall ACS Budget by management actions in other areas (see paragraph 7.7(a) of this report).
RECOMMENDATION 9.6 That the Executive notes progress to date on achieving the Budget savings required
for 2010/11.
COMMREP/Exec/0211budgetsavings_sect9
MTFS June 20102009/10 Savings 2010/11
Excess (-)/ Shortfall(+) 2010/11 Total 2010/11 Req'd + VFM + "June 2010"
a b a + b = c d e c + d + e = f£000k £000k £000k £000k £000k £000k
ACS -900 4,783 3,883 3,800 289 7,972
BES -7 2,370 2,363 480 553 3,396
CYPS 366 2,718 3,084 1,540 2,762 7,386
CEG -37 270 233 0 58 291
FCS -46 376 330 0 0 330
Corp Misc 0 223 223 0 0 223
TOTALS -624 10,740 10,116 5,820 3,662 19,598
Balance of VFM
BUDGET SAVINGS TARGETS 2010/11
APPEN
DIX A
COMMREP/Exec/0211budgetsavings_sect9_appendix a 11/02/2011
PROGRESS ON BUDGET SAVINGS 2010/11 - AS AT 31 DECEMBER 2010
Proposal Proposal Description Low/No Risk to Delivery
Some Risk to Delivery
High Risk to
Delivery£'000 £'000 £'000
ADULT AND COMMUNITY SERVICESMiddle management of in-house services Savings realised by reducing the number of senior managers within the Directorate. 100E care management arrangements - AIS A review of care management and related financial processes has been completed. Electronic
assessment arrangements have been introduced and operational staff responsible for the integrity of case management files consequently the level of admin support has been reduced by 20% to reflect this changing in roles.
384
Review of Libraries Provision Implementation of new ways of working; more efficient book procurement, stock management, developing a range of community based facilities and savings arising from the introduction of self issue.
80 100
Independent and Voluntary Sector Contract Negotiations
A proposal to contain price increases within the current formula based increase reflected in the MTFS. Initial discussions with the Independent Care Group. Proposed model is being tested against experience in other authorities in the region
1,841
Extra Care developments to assist in moving away from reliance on residential care.
Savings based upon roll-out of Extra Care programme 188
Home Care Tender/ Zoning A procurement process started in March 2010 however due to a number of reasons the Directorate took the decision to stop the process and review the best way forward. Discussions have taken place with the providers in Harrogate and Craven and some have agreed to composite rates which have yielded some savings. However the procurement process is unlikely to commence before April 2011 and therefore the savings will not be achieved in 2010-11 or realised for a full year in 2011-12.
62 538
Charging review for non-residential services Above inflation increases in home care hourly rate 136
Reduce reliance on residential care. This practice will continue into 2010/11 and relates to the extra developments/reablement.
The number of residential placements will be actively managed to reduce the reliance on residential provision
800
Reablement. Retraining of in-house domiciliary staff to provide intensive 6 week rehabilitation support to enable people to live at home longer. Staff consultation packs agreed with Unison and distributed. Process progressing well. First evaluation report is pointing to savings being achieved.
608
Transitional workers Presently ACS become involved at year 11 reviews due to capacity. The additional resources will be used to target appropriate year 9 children to ensure that the most cost effective services are achieved in conjunction with parents and carers. This initiative is also being considered alongside reviewing out of county placements. Currently no savings have been identified.
200
Brokerage Additional brokerage staff have been engaged to undertake commercial discussions with care providers and maximise personal state benefits and client contribution to NYCC. Savings are being realised and projections would point to being able to deliver the full sum in 2010-11.
350
APPEN
DIX B
(Page 1 of 6)
I:\EXECSEC\scp\performance\Quarterly Monitoring Report\2011\220111\Section 9 BUDGET SAVINGS APPENDIX B/APPENDIX B Q36 11/02/2011
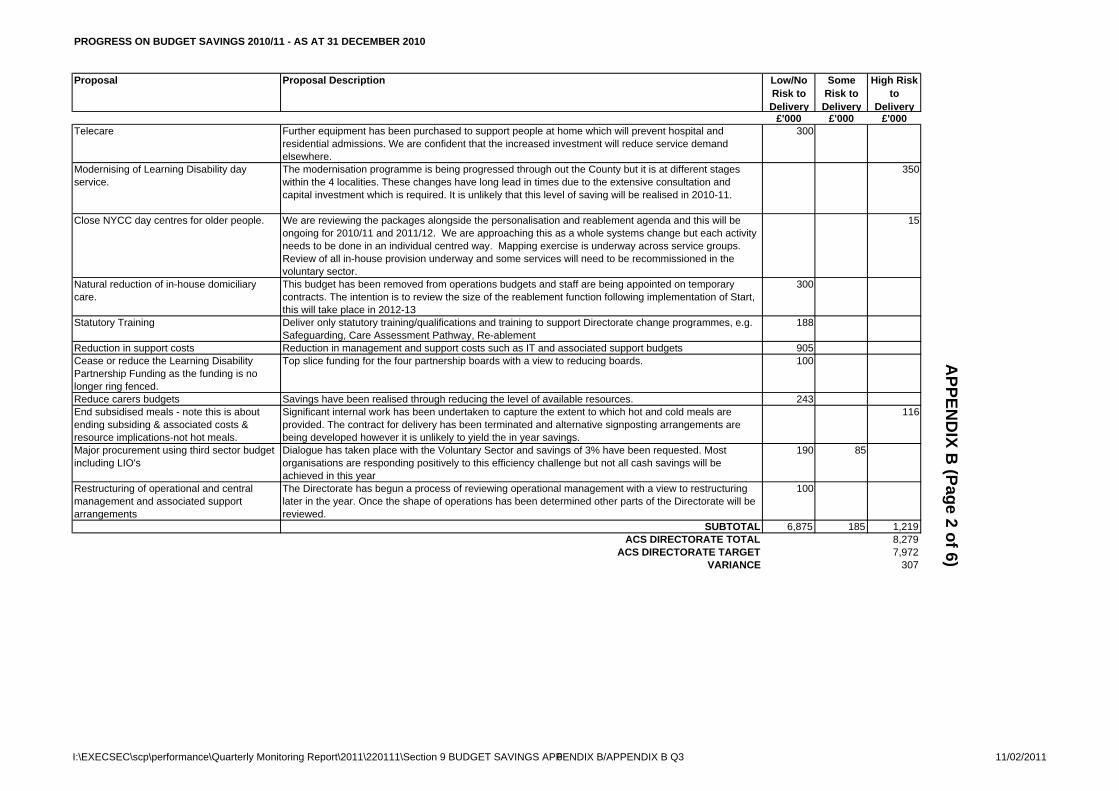
PROGRESS ON BUDGET SAVINGS 2010/11 - AS AT 31 DECEMBER 2010
Proposal Proposal Description Low/No Risk to Delivery
Some Risk to Delivery
High Risk to
Delivery£'000 £'000 £'000
Telecare Further equipment has been purchased to support people at home which will prevent hospital and residential admissions. We are confident that the increased investment will reduce service demand elsewhere.
300
Modernising of Learning Disability day service.
The modernisation programme is being progressed through out the County but it is at different stages within the 4 localities. These changes have long lead in times due to the extensive consultation and capital investment which is required. It is unlikely that this level of saving will be realised in 2010-11.
350
Close NYCC day centres for older people.
We are reviewing the packages alongside the personalisation and reablement agenda and this will be ongoing for 2010/11 and 2011/12. We are approaching this as a whole systems change but each activity needs to be done in an individual centred way. Mapping exercise is underway across service groups. Review of all in-house provision underway and some services will need to be recommissioned in the voluntary sector.
15
Natural reduction of in-house domiciliary care.
This budget has been removed from operations budgets and staff are being appointed on temporary contracts. The intention is to review the size of the reablement function following implementation of Start, this will take place in 2012-13
300
Statutory Training Deliver only statutory training/qualifications and training to support Directorate change programmes, e.g. Safeguarding, Care Assessment Pathway, Re-ablement
188
Reduction in support costs Reduction in management and support costs such as IT and associated support budgets 905Cease or reduce the Learning Disability Partnership Funding as the funding is no longer ring fenced.
Top slice funding for the four partnership boards with a view to reducing boards. 100
Reduce carers budgets Savings have been realised through reducing the level of available resources. 243End subsidised meals - note this is about ending subsiding & associated costs & resource implications-not hot meals.
Significant internal work has been undertaken to capture the extent to which hot and cold meals are provided. The contract for delivery has been terminated and alternative signposting arrangements are being developed however it is unlikely to yield the in year savings.
116
Major procurement using third sector budget including LIO's
Dialogue has taken place with the Voluntary Sector and savings of 3% have been requested. Most organisations are responding positively to this efficiency challenge but not all cash savings will be achieved in this year
190 85
Restructuring of operational and central management and associated support arrangements
The Directorate has begun a process of reviewing operational management with a view to restructuring later in the year. Once the shape of operations has been determined other parts of the Directorate will be reviewed.
100
SUBTOTAL 6,875 185 1,219ACS DIRECTORATE TOTAL 8,279
ACS DIRECTORATE TARGET 7,972VARIANCE 307
APPEN
DIX B
(Page 2 of 6)
I:\EXECSEC\scp\performance\Quarterly Monitoring Report\2011\220111\Section 9 BUDGET SAVINGS APPENDIX B/APPENDIX B Q36 11/02/2011
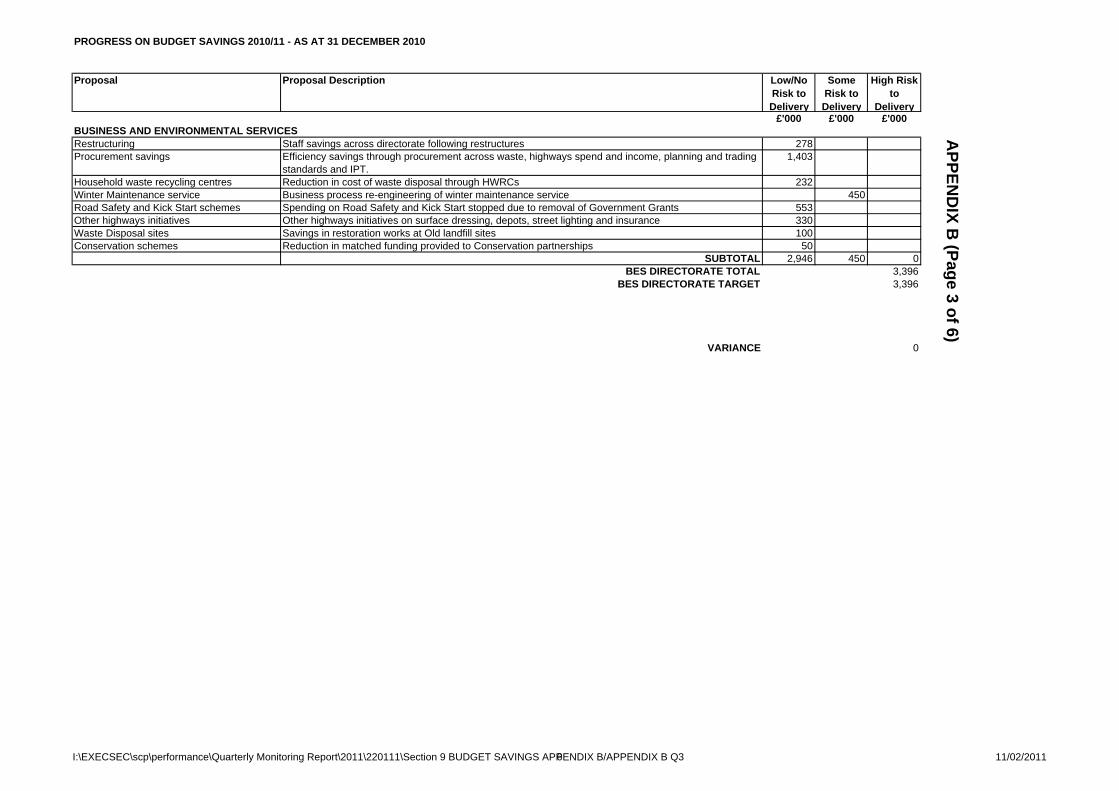
PROGRESS ON BUDGET SAVINGS 2010/11 - AS AT 31 DECEMBER 2010
Proposal Proposal Description Low/No Risk to Delivery
Some Risk to Delivery
High Risk to
Delivery£'000 £'000 £'000
BUSINESS AND ENVIRONMENTAL SERVICESRestructuring Staff savings across directorate following restructures 278Procurement savings Efficiency savings through procurement across waste, highways spend and income, planning and trading
standards and IPT.1,403
Household waste recycling centres Reduction in cost of waste disposal through HWRCs 232Winter Maintenance service Business process re-engineering of winter maintenance service 450Road Safety and Kick Start schemes Spending on Road Safety and Kick Start stopped due to removal of Government Grants 553Other highways initiatives Other highways initiatives on surface dressing, depots, street lighting and insurance 330Waste Disposal sites Savings in restoration works at Old landfill sites 100Conservation schemes Reduction in matched funding provided to Conservation partnerships 50
SUBTOTAL 2,946 450 0BES DIRECTORATE TOTAL 3,396
BES DIRECTORATE TARGET 3,396
VARIANCE 0
APPEN
DIX B
(Page 3 of 6)
I:\EXECSEC\scp\performance\Quarterly Monitoring Report\2011\220111\Section 9 BUDGET SAVINGS APPENDIX B/APPENDIX B Q36 11/02/2011
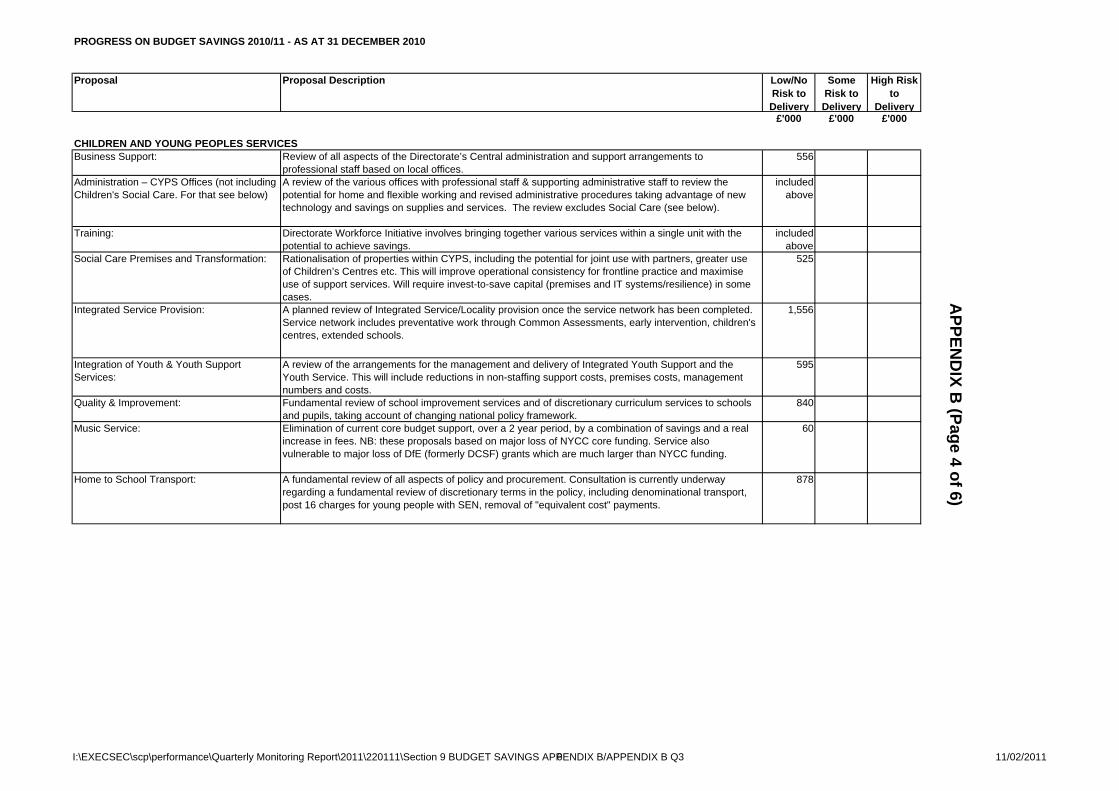
PROGRESS ON BUDGET SAVINGS 2010/11 - AS AT 31 DECEMBER 2010
Proposal Proposal Description Low/No Risk to Delivery
Some Risk to Delivery
High Risk to
Delivery£'000 £'000 £'000
CHILDREN AND YOUNG PEOPLES SERVICESBusiness Support: Review of all aspects of the Directorate’s Central administration and support arrangements to
professional staff based on local offices.556
Administration – CYPS Offices (not including Children's Social Care. For that see below)
A review of the various offices with professional staff & supporting administrative staff to review the potential for home and flexible working and revised administrative procedures taking advantage of new technology and savings on supplies and services. The review excludes Social Care (see below).
included above
Training: Directorate Workforce Initiative involves bringing together various services within a single unit with the potential to achieve savings.
included above
Social Care Premises and Transformation: Rationalisation of properties within CYPS, including the potential for joint use with partners, greater use of Children’s Centres etc. This will improve operational consistency for frontline practice and maximise use of support services. Will require invest-to-save capital (premises and IT systems/resilience) in some cases.
525
Integrated Service Provision: A planned review of Integrated Service/Locality provision once the service network has been completed. Service network includes preventative work through Common Assessments, early intervention, children's centres, extended schools.
1,556
Integration of Youth & Youth Support Services:
A review of the arrangements for the management and delivery of Integrated Youth Support and the Youth Service. This will include reductions in non-staffing support costs, premises costs, management numbers and costs.
595
Quality & Improvement: Fundamental review of school improvement services and of discretionary curriculum services to schools and pupils, taking account of changing national policy framework.
840
Music Service: Elimination of current core budget support, over a 2 year period, by a combination of savings and a real increase in fees. NB: these proposals based on major loss of NYCC core funding. Service also vulnerable to major loss of DfE (formerly DCSF) grants which are much larger than NYCC funding.
60
Home to School Transport: A fundamental review of all aspects of policy and procurement. Consultation is currently underway regarding a fundamental review of discretionary terms in the policy, including denominational transport, post 16 charges for young people with SEN, removal of "equivalent cost" payments.
878
APPEN
DIX B
(Page 4 of 6)
I:\EXECSEC\scp\performance\Quarterly Monitoring Report\2011\220111\Section 9 BUDGET SAVINGS APPENDIX B/APPENDIX B Q36 11/02/2011
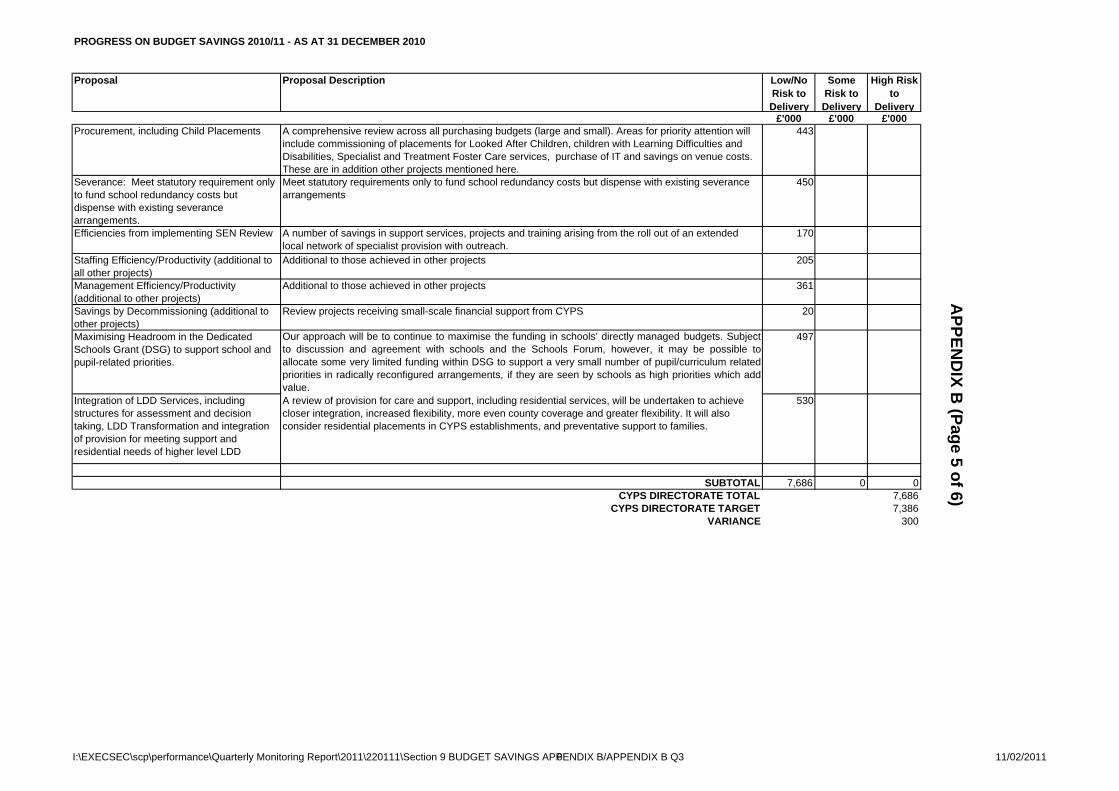
PROGRESS ON BUDGET SAVINGS 2010/11 - AS AT 31 DECEMBER 2010
Proposal Proposal Description Low/No Risk to Delivery
Some Risk to Delivery
High Risk to
Delivery£'000 £'000 £'000
Procurement, including Child Placements A comprehensive review across all purchasing budgets (large and small). Areas for priority attention will include commissioning of placements for Looked After Children, children with Learning Difficulties and Disabilities, Specialist and Treatment Foster Care services, purchase of IT and savings on venue costs. These are in addition other projects mentioned here.
443
Severance: Meet statutory requirement only to fund school redundancy costs but dispense with existing severance arrangements.
Meet statutory requirements only to fund school redundancy costs but dispense with existing severance arrangements
450
Efficiencies from implementing SEN Review A number of savings in support services, projects and training arising from the roll out of an extended local network of specialist provision with outreach.
170
Staffing Efficiency/Productivity (additional to all other projects)
Additional to those achieved in other projects 205
Management Efficiency/Productivity (additional to other projects)
Additional to those achieved in other projects 361
Savings by Decommissioning (additional to other projects)
Review projects receiving small-scale financial support from CYPS 20
Maximising Headroom in the Dedicated Schools Grant (DSG) to support school and pupil-related priorities.
Our approach will be to continue to maximise the funding in schools’ directly managed budgets. Subjectto discussion and agreement with schools and the Schools Forum, however, it may be possible toallocate some very limited funding within DSG to support a very small number of pupil/curriculum relatedpriorities in radically reconfigured arrangements, if they are seen by schools as high priorities which addvalue.
497
Integration of LDD Services, including structures for assessment and decision taking, LDD Transformation and integration of provision for meeting support and residential needs of higher level LDD
A review of provision for care and support, including residential services, will be undertaken to achieve closer integration, increased flexibility, more even county coverage and greater flexibility. It will also consider residential placements in CYPS establishments, and preventative support to families.
530
SUBTOTAL 7,686 0 0CYPS DIRECTORATE TOTAL 7,686
CYPS DIRECTORATE TARGET 7,386VARIANCE 300
APPEN
DIX B
(Page 5 of 6)
I:\EXECSEC\scp\performance\Quarterly Monitoring Report\2011\220111\Section 9 BUDGET SAVINGS APPENDIX B/APPENDIX B Q36 11/02/2011
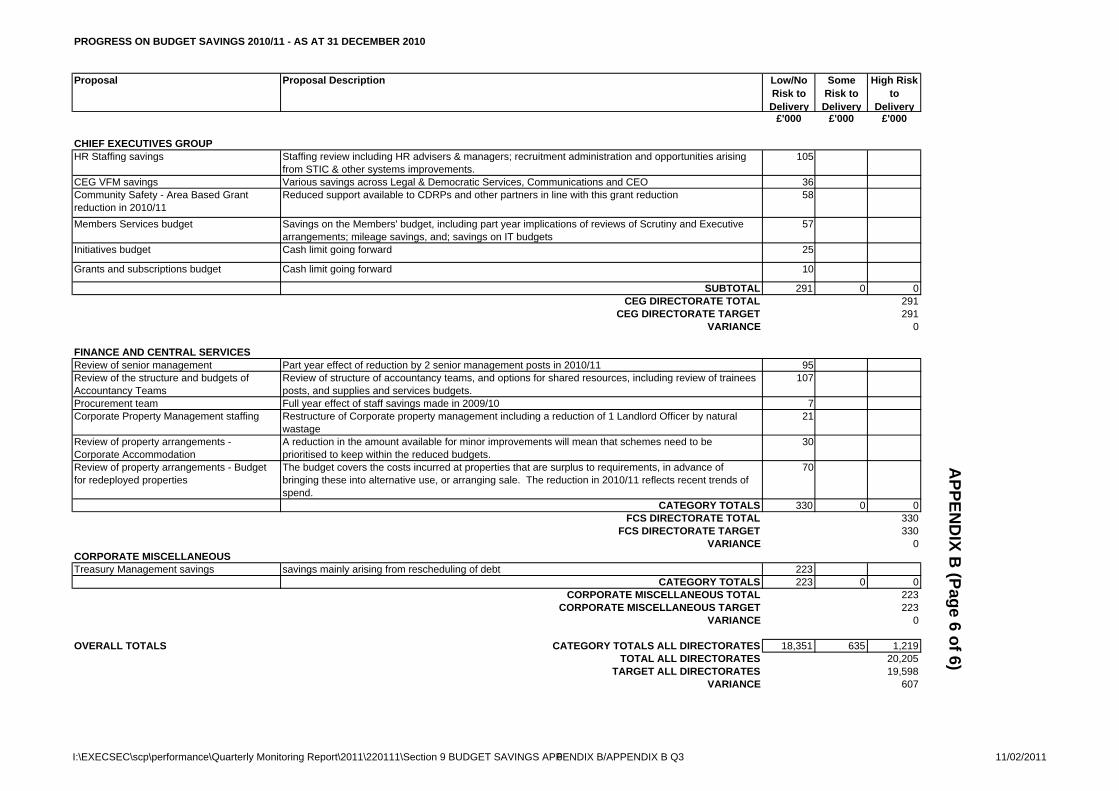
PROGRESS ON BUDGET SAVINGS 2010/11 - AS AT 31 DECEMBER 2010
Proposal Proposal Description Low/No Risk to Delivery
Some Risk to Delivery
High Risk to
Delivery£'000 £'000 £'000
CHIEF EXECUTIVES GROUPHR Staffing savings Staffing review including HR advisers & managers; recruitment administration and opportunities arising
from STIC & other systems improvements.105
CEG VFM savings Various savings across Legal & Democratic Services, Communications and CEO 36Community Safety - Area Based Grant reduction in 2010/11
Reduced support available to CDRPs and other partners in line with this grant reduction 58
Members Services budget Savings on the Members' budget, including part year implications of reviews of Scrutiny and Executive arrangements; mileage savings, and; savings on IT budgets
57
Initiatives budget Cash limit going forward 25
Grants and subscriptions budget Cash limit going forward 10
SUBTOTAL 291 0 0CEG DIRECTORATE TOTAL 291
CEG DIRECTORATE TARGET 291VARIANCE 0
FINANCE AND CENTRAL SERVICESReview of senior management Part year effect of reduction by 2 senior management posts in 2010/11 95Review of the structure and budgets of Accountancy Teams
Review of structure of accountancy teams, and options for shared resources, including review of trainees posts, and supplies and services budgets.
107
Procurement team Full year effect of staff savings made in 2009/10 7Corporate Property Management staffing Restructure of Corporate property management including a reduction of 1 Landlord Officer by natural
wastage21
Review of property arrangements - Corporate Accommodation
A reduction in the amount available for minor improvements will mean that schemes need to be prioritised to keep within the reduced budgets.
30
Review of property arrangements - Budget for redeployed properties
The budget covers the costs incurred at properties that are surplus to requirements, in advance of bringing these into alternative use, or arranging sale. The reduction in 2010/11 reflects recent trends of spend.
70
CATEGORY TOTALS 330 0 0FCS DIRECTORATE TOTAL 330
FCS DIRECTORATE TARGET 330VARIANCE 0
CORPORATE MISCELLANEOUSTreasury Management savings savings mainly arising from rescheduling of debt 223
CATEGORY TOTALS 223 0 0CORPORATE MISCELLANEOUS TOTAL 223
CORPORATE MISCELLANEOUS TARGET 223VARIANCE 0
OVERALL TOTALS CATEGORY TOTALS ALL DIRECTORATES 18,351 635 1,219TOTAL ALL DIRECTORATES 20,205
TARGET ALL DIRECTORATES 19,598VARIANCE 607
APPEN
DIX B
(Page 6 of 6)
I:\EXECSEC\scp\performance\Quarterly Monitoring Report\2011\220111\Section 9 BUDGET SAVINGS APPENDIX B/APPENDIX B Q36 11/02/2011

NYCC – Executive – February 2011 – Treasury Management COM/EXEC/0211treasman_section 10
10.0 TREASURY MANAGEMENT Overview 10.1 This section of the report presents details of the County Council’s Treasury
Management Activity during Q3 2010/11, changes to the Approved Lending List and other current policy issues and considerations.
10.2 The supporting information for this section of the report is contained in Annex F
which consists of several appendices that are referred to in the text. 10.3 CIPFA issued a revised Code of Practice for Treasury Management in November
2009 which recommends that Members should be informed of Treasury Management activities at least twice a year but preferably quarterly. This report ensures, therefore, that the County Council is embracing Best Practice in accordance with CIPFA’s revised Code of Practice.
10.4 The current monitoring and reporting arrangements in relation to Treasury
Management activities are as follows:
(a) an annual report to Executive and County Council as part of the Budget process that sets out the County Council’s Treasury Management and Investment Strategy and Policy for the forthcoming financial year. For 2010/11 this report was submitted to Executive on 2 February 2010 and for 2011/12 on 8 February 2011
(b) an annual report to Executive and County Council as part of the Budget
process that sets the various Prudential Indicators (submitted to Executive on 2 February 2010 for 2010/11), together with a mid year update of these indicators to the Executive (part of the Q1 Performance Monitoring report submitted to Executive on 24 August 2010). An update for 2011/12 with PIs up to 2013/14 was recently submitted to Executive on 1 February 2011
(c) annual outturn reports to the Executive for both Treasury Management and
Prudential Indicators setting out full details of activities and performance during the preceding financial year. The outturn reports for 2009/10 were submitted to Executive on 22 June 2010 with those for 2010/11 scheduled for submission to Executive on 22 June 2011
(d) a quarterly report on Treasury Management to the Executive (this report) as
part of the Quarterly Performance Monitoring report (e) regular meetings between the Corporate Director – Finance and Central
Services, the Deputy Leader and the Corporate Affairs Portfolio Holder to discuss issues arising from the day to day management of Treasury Management activities
(f) reports on proposed changes to the County Council’s Treasury Management
activities are submitted as required to the Audit Committee for consideration and comment.

NYCC – Executive – February 2011 – Treasury Management COM/EXEC/0211treasman_section 10
Economic Update 10.5 The Quarter ended 31 December 2010 saw the following:
• activity indicators strengthening again, suggesting that the recovery still has a reasonable amount of momentum
• spending on the high street continuing to recover
• conditions in the labour market deteriorating further
• house prices continuing to fall with some regional exceptional
• the public finances deteriorating, tentatively questioning whether the government can meet its fiscal forecasts
• the UK’s trade deficit widens further, pouring cold water on hopes of an export-led recovery
• CPI inflation rise and pipeline price pressures continuing to build
• the Monetary Policy Committee shying away from doing more quantitative easing
• UK equities surging and gilt yields rising
• economic growth picking up strongly in the US and maintaining pace in the euro-zone.
10.6 Activity indicators suggested that the recovery still has a reasonable amount of
momentum. Surveys indicated improvement in the third quarter which were consistent with modest growth, having briefly pointed to a double-dip in prior months. The surveys suggested that the recovery weakened in the construction sector, but strengthened in the larger manufacturing sector. Following two quarters with positive growth, recently announced preliminary growth figures for the quarter ended 30 December came as a surprise, however, with the economy contracting by 0.5%.
10.7 There were signs that consumer spending improved during the quarter. Retail sales
volumes rose by a solid 0.7% and 0.3% in October and November respectively. Survey evidence has suggested that December’s heavy snowfall has not had too much of a negative effect on retail spending over the festive period as a whole, with consumers making up for weaker spending in early December during the post-Christmas “sales” period.
10.8 The resilience of consumer spending during the quarter was in sharp contrast to the
renewed deterioration of conditions in the labour market. Employment on the Labour Force Survey (LFS) measure fell by 33,000 in the three months to October, which was far less than the large rises seen a few months ago. As a result unemployment rose by 35,000 over the same period.
10.9 House prices have also continued to fall during the quarter. The Nationwide
measure fell by 0.7% m/m in October and 0.3%m/m in November, before rising by 0.4%m/m in December. The Halifax house price measure rose by 1.9% m/m in October, this only offset around half of the fall in September. The measure subsequently posted a small 0.1% m/m drop in November but a fall of 1.3% in December.

NYCC – Executive – February 2011 – Treasury Management COM/EXEC/0211treasman_section 10
10.10 Public finances appear to have deteriorated during the quarter. Borrowing was in line with 2009/10 figures in October but was £6bn higher than a year before in November. The figures therefore cast doubt on whether the Government will be able to meet its borrowing forecast of £149bn this year, some £7bn lower than last year’s total. Elsewhere, there are still few signs that the external sector has begun to support the overall recovery. The trade in goods deficit widened again from £8.4bn to £8.5bn in October, while the overall deficit also grew from £3.8bn to £3.9bn. While export goods volumes rose by 2.2% in October, import goods volumes rose by a larger 2.6%.
10.11 CPI (consumer price inflation) inflation edged up from 3.1% to 3.2% in October and
then to 3.3% in November. Part of the rise may have reflected retailers pushing up their prices ahead of the VAT rise in January 2011. The rise also seems to have reflected the surge in commodity prices during the quarter and earlier in the year. If these commodities hold onto their recent price gains, then their inflationary effects will build over the next few months.
10.12 Encouraging activity data and strong inflation data prevented the Monetary Policy
Committee (MPC) from following the US Fed in sanctioning more quantitative easing (QE) at its November meeting. The majority of members on the MPC have continued to vote for official interest rates to remain on hold at 0.5%; the minutes to their meetings suggested that most members thought that the risks that CPI inflation would overshoot the 2% target in two years time had grown.
Ongoing Review of Annual Treasury Management and Investment Strategy
2010/11 10.13 The County Council’s Treasury Management and Investment Strategy for 2010/11
was approved by Executive on 2 February 2010 and subsequently by County Council on 17 February 2010.
10.14 This Annual Strategy sets out the County Council’s approach to managing its
Treasury Management activities (borrowing and investments) for the year ahead – 2010/11.
10.15 Following the unprecedented events and turmoil in the world’s financial markets
over the last two years, it became readily apparent that such annual strategies needed to be reviewed and adapted in reaction to events and changing circumstances. Reports have been submitted to Members as appropriate, at the time in year changes have needed to be made to the Treasury Management Strategy.
10.16 It is also a key requirement of the updated CIPFA Code of Practice for Treasury
Management (issued in November 2009) that annual Treasury Management Strategies should be kept under constant review throughout the year and reported to Members as appropriate. There is the specific requirement of a mid year review as a minimum being reported to Members.
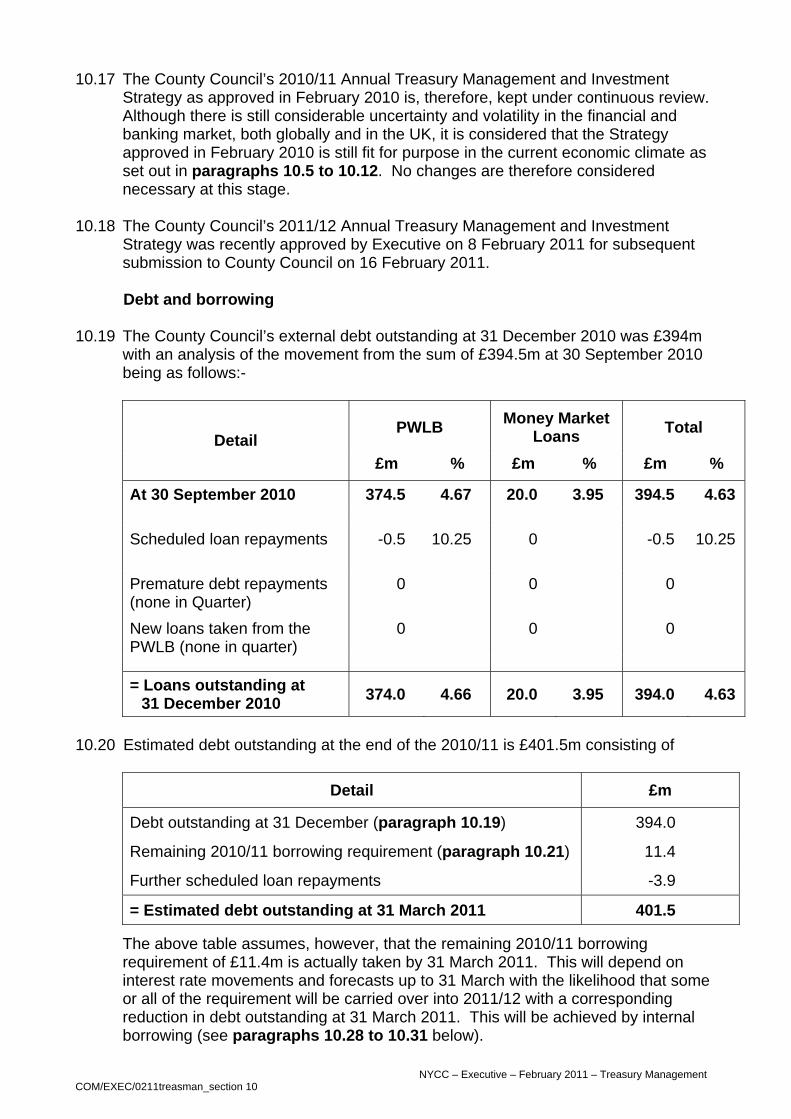
NYCC – Executive – February 2011 – Treasury Management COM/EXEC/0211treasman_section 10
10.17 The County Council’s 2010/11 Annual Treasury Management and Investment Strategy as approved in February 2010 is, therefore, kept under continuous review. Although there is still considerable uncertainty and volatility in the financial and banking market, both globally and in the UK, it is considered that the Strategy approved in February 2010 is still fit for purpose in the current economic climate as set out in paragraphs 10.5 to 10.12. No changes are therefore considered necessary at this stage.
10.18 The County Council’s 2011/12 Annual Treasury Management and Investment
Strategy was recently approved by Executive on 8 February 2011 for subsequent submission to County Council on 16 February 2011.
Debt and borrowing 10.19 The County Council’s external debt outstanding at 31 December 2010 was £394m
with an analysis of the movement from the sum of £394.5m at 30 September 2010 being as follows:-
PWLB Money Market Loans Total
Detail £m % £m % £m %
At 30 September 2010 374.5 4.67 20.0 3.95 394.5 4.63 Scheduled loan repayments -0.5 10.25 0 -0.5 10.25 Premature debt repayments (none in Quarter)
0 0 0
New loans taken from the PWLB (none in quarter)
0 0 0
= Loans outstanding at 31 December 2010 374.0 4.66 20.0 3.95 394.0 4.63
10.20 Estimated debt outstanding at the end of the 2010/11 is £401.5m consisting of
Detail £m
Debt outstanding at 31 December (paragraph 10.19) 394.0
Remaining 2010/11 borrowing requirement (paragraph 10.21) 11.4
Further scheduled loan repayments -3.9
= Estimated debt outstanding at 31 March 2011 401.5
The above table assumes, however, that the remaining 2010/11 borrowing requirement of £11.4m is actually taken by 31 March 2011. This will depend on interest rate movements and forecasts up to 31 March with the likelihood that some or all of the requirement will be carried over into 2011/12 with a corresponding reduction in debt outstanding at 31 March 2011. This will be achieved by internal borrowing (see paragraphs 10.28 to 10.31 below).
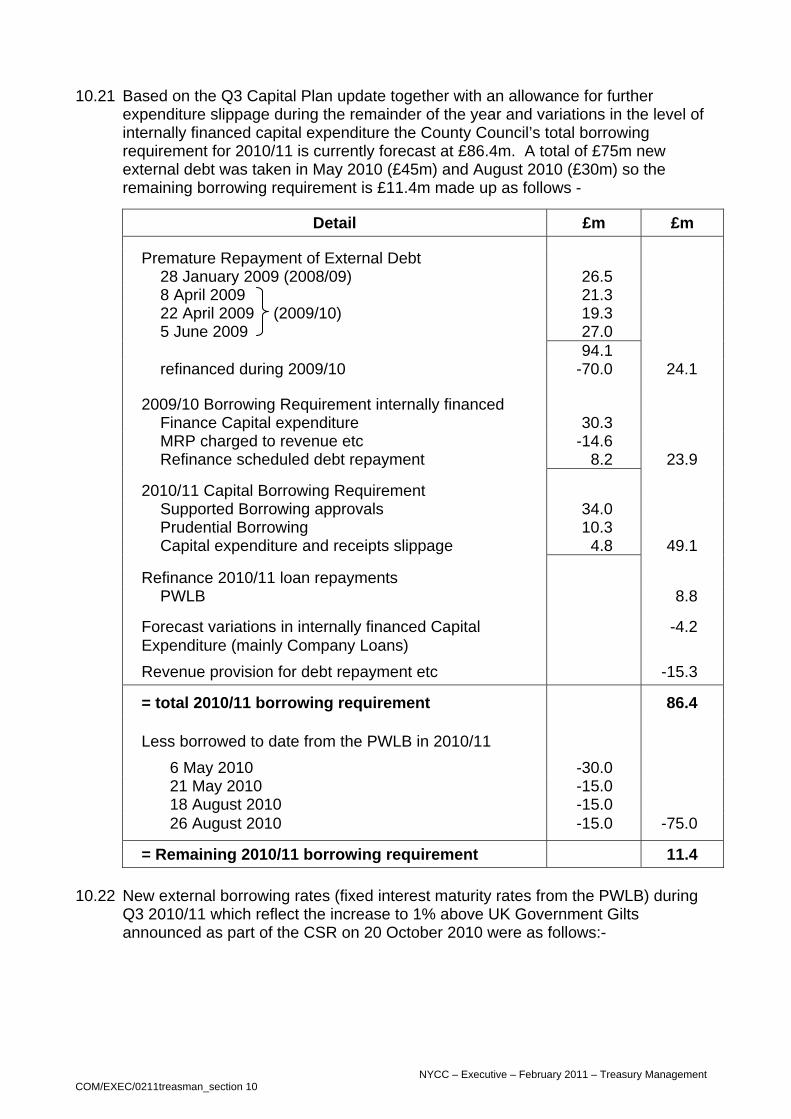
NYCC – Executive – February 2011 – Treasury Management COM/EXEC/0211treasman_section 10
10.21 Based on the Q3 Capital Plan update together with an allowance for further
expenditure slippage during the remainder of the year and variations in the level of internally financed capital expenditure the County Council’s total borrowing requirement for 2010/11 is currently forecast at £86.4m. A total of £75m new external debt was taken in May 2010 (£45m) and August 2010 (£30m) so the remaining borrowing requirement is £11.4m made up as follows -
Detail £m £m Premature Repayment of External Debt
28 January 2009 (2008/09) 26.5 8 April 2009 21.3 22 April 2009 (2009/10) 19.3 5 June 2009 27.0
94.1
refinanced during 2009/10 -70.0 24.1
2009/10 Borrowing Requirement internally financed Finance Capital expenditure 30.3 MRP charged to revenue etc -14.6 Refinance scheduled debt repayment 8.2 23.9
2010/11 Capital Borrowing Requirement
Supported Borrowing approvals 34.0 Prudential Borrowing 10.3 Capital expenditure and receipts slippage 4.8 49.1
Refinance 2010/11 loan repayments PWLB 8.8
Forecast variations in internally financed Capital -4.2 Expenditure (mainly Company Loans) Revenue provision for debt repayment etc -15.3
= total 2010/11 borrowing requirement 86.4
Less borrowed to date from the PWLB in 2010/11 6 May 2010 -30.0 21 May 2010 -15.0 18 August 2010 -15.0 26 August 2010 -15.0 -75.0
= Remaining 2010/11 borrowing requirement 11.4 10.22 New external borrowing rates (fixed interest maturity rates from the PWLB) during
Q3 2010/11 which reflect the increase to 1% above UK Government Gilts announced as part of the CSR on 20 October 2010 were as follows:-
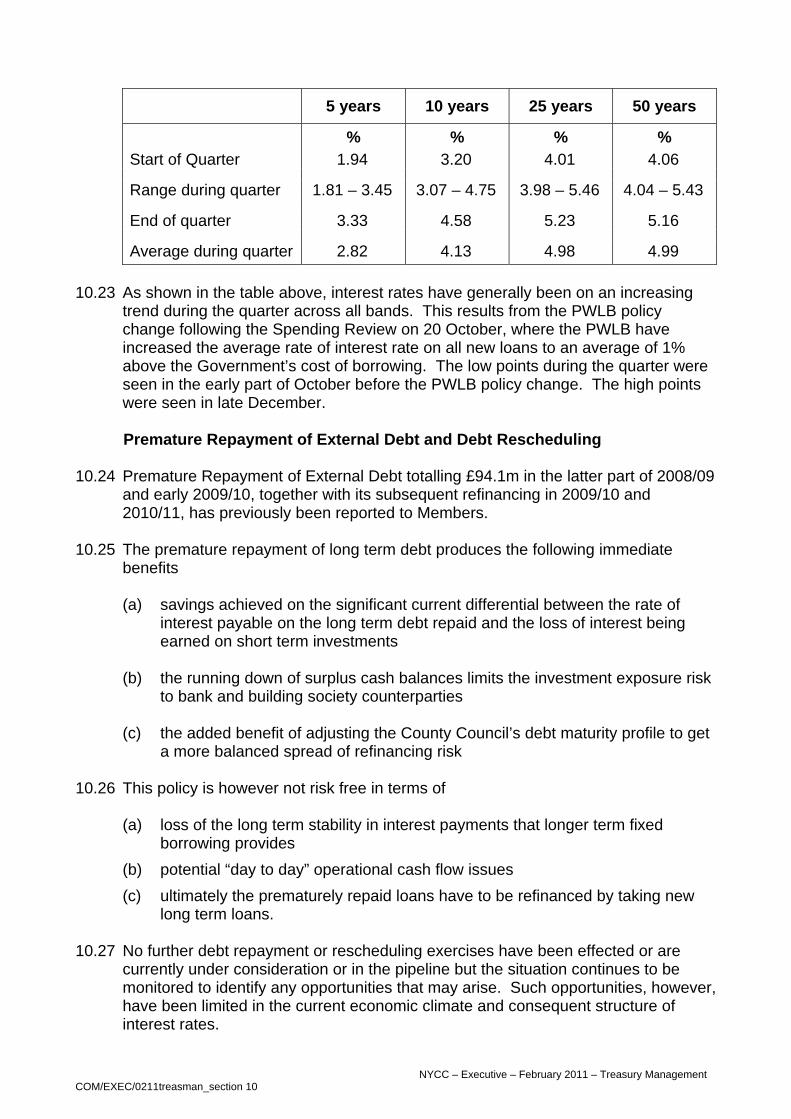
NYCC – Executive – February 2011 – Treasury Management COM/EXEC/0211treasman_section 10
5 years 10 years 25 years 50 years
% % % % Start of Quarter 1.94 3.20 4.01 4.06 Range during quarter 1.81 – 3.45 3.07 – 4.75 3.98 – 5.46 4.04 – 5.43 End of quarter 3.33 4.58 5.23 5.16 Average during quarter 2.82 4.13 4.98 4.99
10.23 As shown in the table above, interest rates have generally been on an increasing
trend during the quarter across all bands. This results from the PWLB policy change following the Spending Review on 20 October, where the PWLB have increased the average rate of interest rate on all new loans to an average of 1% above the Government’s cost of borrowing. The low points during the quarter were seen in the early part of October before the PWLB policy change. The high points were seen in late December.
Premature Repayment of External Debt and Debt Rescheduling 10.24 Premature Repayment of External Debt totalling £94.1m in the latter part of 2008/09
and early 2009/10, together with its subsequent refinancing in 2009/10 and 2010/11, has previously been reported to Members.
10.25 The premature repayment of long term debt produces the following immediate
benefits
(a) savings achieved on the significant current differential between the rate of interest payable on the long term debt repaid and the loss of interest being earned on short term investments
(b) the running down of surplus cash balances limits the investment exposure risk
to bank and building society counterparties (c) the added benefit of adjusting the County Council’s debt maturity profile to get
a more balanced spread of refinancing risk 10.26 This policy is however not risk free in terms of
(a) loss of the long term stability in interest payments that longer term fixed borrowing provides
(b) potential “day to day” operational cash flow issues (c) ultimately the prematurely repaid loans have to be refinanced by taking new
long term loans. 10.27 No further debt repayment or rescheduling exercises have been effected or are
currently under consideration or in the pipeline but the situation continues to be monitored to identify any opportunities that may arise. Such opportunities, however, have been limited in the current economic climate and consequent structure of interest rates.

NYCC – Executive – February 2011 – Treasury Management COM/EXEC/0211treasman_section 10
Internal Borrowing 10.28 The table in paragraph 10.43 below shows that internal capital borrowing (use of
surplus cash balances) to part fund the County Council’s Capital Financing Requirement was £57.7m at 31 March 2010.
10.29 The level of this internal capital borrowing depends on a range of factors including:
(a) premature repayment of external debt (b) timing of debt rescheduling exercises (c) the timing of taking out annual borrowing requirements (d) policy considerations on the relative impact of financing capital expenditure
from surplus cash balances compared with taking new external debt with the balance of external and internal borrowing being generally driven by market conditions.
10.30 Over the next three years investment rates are expected to continue to be below
long term borrowing rates. A value for money assessment would therefore indicate that value could be obtained by avoiding/delaying new borrowing and continuing to use internal cash balances to finance new capital expenditure or to replace maturing external debt. This would maximise short term savings and produce other benefits but is not risk free (as highlighted in paragraphs 10.25/10.26 above in relation to the Premature Repayment of External Debt).
10.31 This “Internal Capital Financing” option will therefore continue to be actively
considered and pursued on an ongoing basis in order to achieve short term savings and mitigate the credit risk incurred by holding investments in the market.
Prudential Indicators 10.32 It is a statutory duty for the County Council to determine and keep under review its
Affordable Borrowing Limits. 10.33 The Prudential Indicators for the three year period 2010/11 to 2012/13 were initially
approved by Executive on 2 February 2010 and adopted by County Council on 17 February 2011. These Indicators were subsequently updated to reflect the 2009/10 outturn position and other factors arising in Q1 and were reported to Members as part of the Q1 Performance Monitoring report on 24 August 2010.
10.34 None of the current Prudential Indicators were breached during Q3 in 2010/11. 10.35 An updated set of Prudential Indicators for the three year period 2011/12 to
2013/14, which also included an update for 2010/11, were approved by Executive on 8 February 2011 for subsequent consideration to County Council on 16 February 2011.
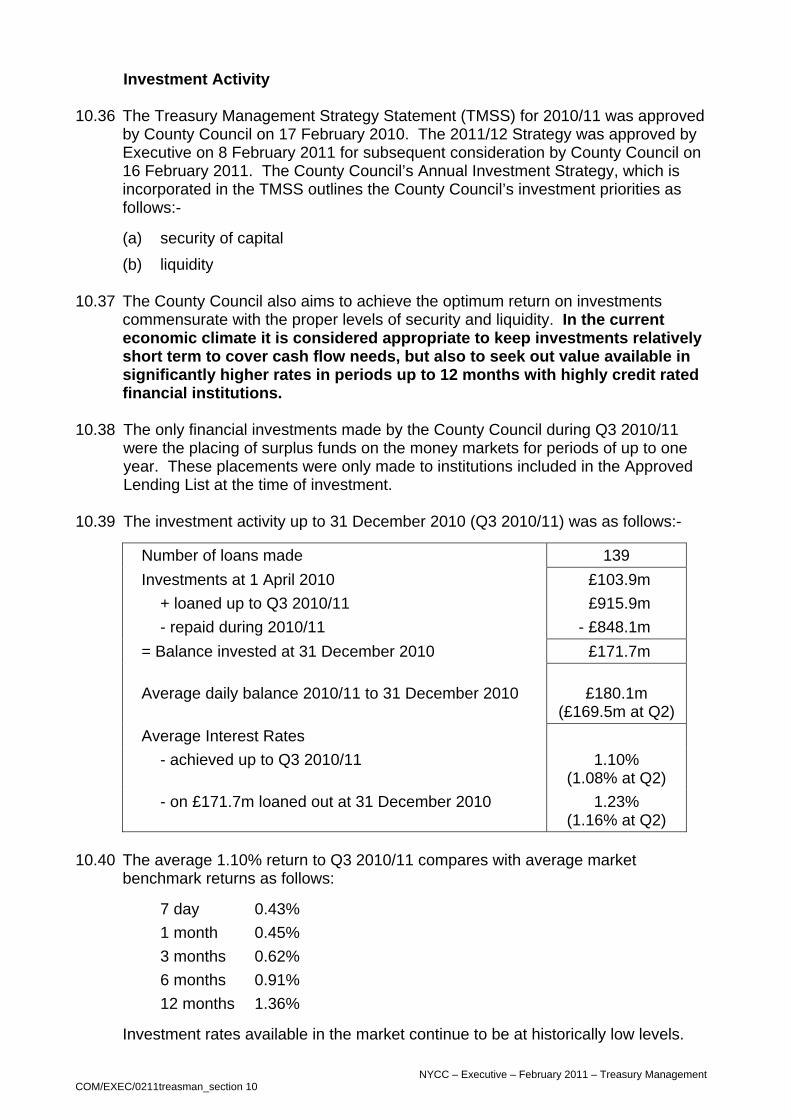
NYCC – Executive – February 2011 – Treasury Management COM/EXEC/0211treasman_section 10
Investment Activity 10.36 The Treasury Management Strategy Statement (TMSS) for 2010/11 was approved
by County Council on 17 February 2010. The 2011/12 Strategy was approved by Executive on 8 February 2011 for subsequent consideration by County Council on 16 February 2011. The County Council’s Annual Investment Strategy, which is incorporated in the TMSS outlines the County Council’s investment priorities as follows:-
(a) security of capital (b) liquidity
10.37 The County Council also aims to achieve the optimum return on investments
commensurate with the proper levels of security and liquidity. In the current economic climate it is considered appropriate to keep investments relatively short term to cover cash flow needs, but also to seek out value available in significantly higher rates in periods up to 12 months with highly credit rated financial institutions.
10.38 The only financial investments made by the County Council during Q3 2010/11
were the placing of surplus funds on the money markets for periods of up to one year. These placements were only made to institutions included in the Approved Lending List at the time of investment.
10.39 The investment activity up to 31 December 2010 (Q3 2010/11) was as follows:-
Number of loans made 139 Investments at 1 April 2010 £103.9m + loaned up to Q3 2010/11 £915.9m - repaid during 2010/11 - £848.1m = Balance invested at 31 December 2010 £171.7m
Average daily balance 2010/11 to 31 December 2010 £180.1m (£169.5m at Q2)
Average Interest Rates - achieved up to Q3 2010/11 1.10%
(1.08% at Q2) - on £171.7m loaned out at 31 December 2010 1.23%
(1.16% at Q2) 10.40 The average 1.10% return to Q3 2010/11 compares with average market
benchmark returns as follows:
7 day 0.43% 1 month 0.45% 3 months 0.62% 6 months 0.91% 12 months 1.36%
Investment rates available in the market continue to be at historically low levels.
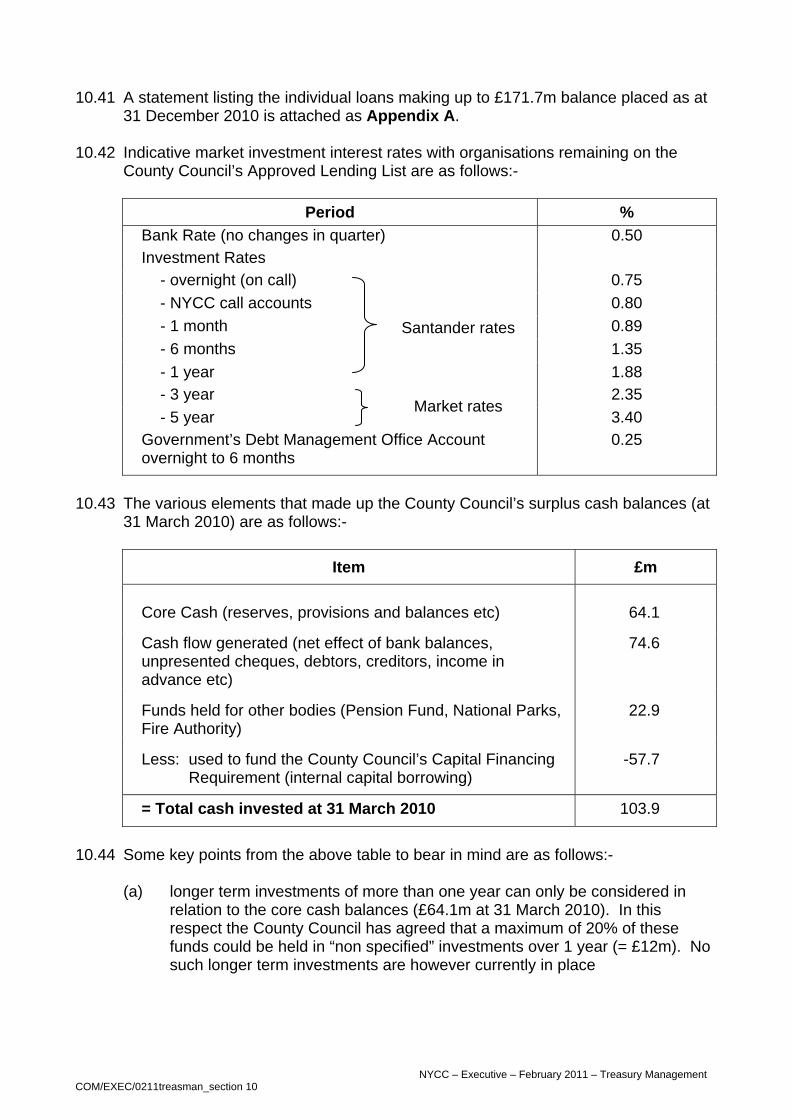
NYCC – Executive – February 2011 – Treasury Management COM/EXEC/0211treasman_section 10
10.41 A statement listing the individual loans making up to £171.7m balance placed as at
31 December 2010 is attached as Appendix A. 10.42 Indicative market investment interest rates with organisations remaining on the
County Council’s Approved Lending List are as follows:-
Period % Bank Rate (no changes in quarter) 0.50 Investment Rates
- overnight (on call) 0.75 - NYCC call accounts 0.80 - 1 month 0.89 - 6 months 1.35 - 1 year
Santander rates
1.88 - 3 year 2.35 - 5 year
Market rates 3.40
Government’s Debt Management Office Account overnight to 6 months
0.25
10.43 The various elements that made up the County Council’s surplus cash balances (at
31 March 2010) are as follows:-
Item £m Core Cash (reserves, provisions and balances etc) 64.1 Cash flow generated (net effect of bank balances,
unpresented cheques, debtors, creditors, income in advance etc)
74.6
Funds held for other bodies (Pension Fund, National Parks,
Fire Authority) 22.9
Less: used to fund the County Council’s Capital Financing
Requirement (internal capital borrowing) -57.7
= Total cash invested at 31 March 2010 103.9
10.44 Some key points from the above table to bear in mind are as follows:-
(a) longer term investments of more than one year can only be considered in relation to the core cash balances (£64.1m at 31 March 2010). In this respect the County Council has agreed that a maximum of 20% of these funds could be held in “non specified” investments over 1 year (= £12m). No such longer term investments are however currently in place
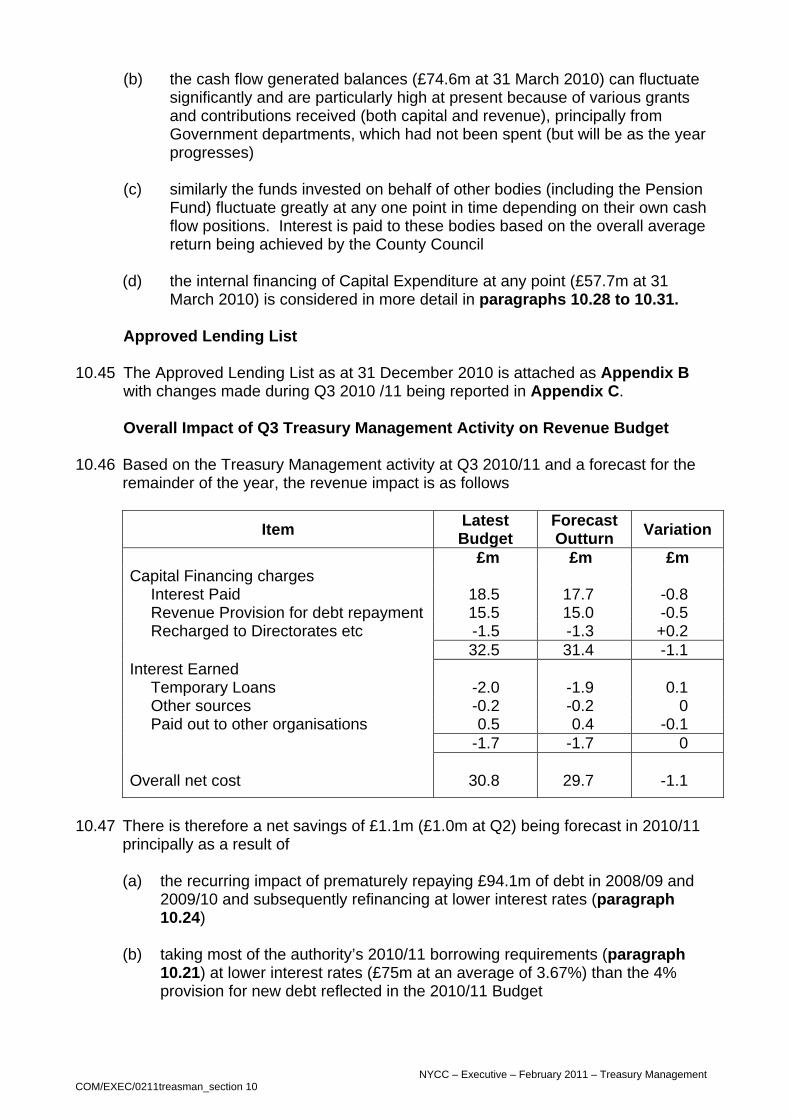
NYCC – Executive – February 2011 – Treasury Management COM/EXEC/0211treasman_section 10
(b) the cash flow generated balances (£74.6m at 31 March 2010) can fluctuate significantly and are particularly high at present because of various grants and contributions received (both capital and revenue), principally from Government departments, which had not been spent (but will be as the year progresses)
(c) similarly the funds invested on behalf of other bodies (including the Pension
Fund) fluctuate greatly at any one point in time depending on their own cash flow positions. Interest is paid to these bodies based on the overall average return being achieved by the County Council
(d) the internal financing of Capital Expenditure at any point (£57.7m at 31
March 2010) is considered in more detail in paragraphs 10.28 to 10.31. Approved Lending List 10.45 The Approved Lending List as at 31 December 2010 is attached as Appendix B
with changes made during Q3 2010 /11 being reported in Appendix C. Overall Impact of Q3 Treasury Management Activity on Revenue Budget 10.46 Based on the Treasury Management activity at Q3 2010/11 and a forecast for the
remainder of the year, the revenue impact is as follows
Item Latest Budget
Forecast Outturn Variation
£m £m £m Capital Financing charges
Interest Paid 18.5 17.7 -0.8 Revenue Provision for debt repayment 15.5 15.0 -0.5 Recharged to Directorates etc -1.5 -1.3 +0.2
32.5 31.4 -1.1 Interest Earned
Temporary Loans -2.0 -1.9 0.1 Other sources -0.2 -0.2 0 Paid out to other organisations 0.5 0.4 -0.1
-1.7 -1.7 0 Overall net cost 30.8 29.7 -1.1
10.47 There is therefore a net savings of £1.1m (£1.0m at Q2) being forecast in 2010/11
principally as a result of
(a) the recurring impact of prematurely repaying £94.1m of debt in 2008/09 and 2009/10 and subsequently refinancing at lower interest rates (paragraph 10.24)
(b) taking most of the authority’s 2010/11 borrowing requirements (paragraph
10.21) at lower interest rates (£75m at an average of 3.67%) than the 4% provision for new debt reflected in the 2010/11 Budget
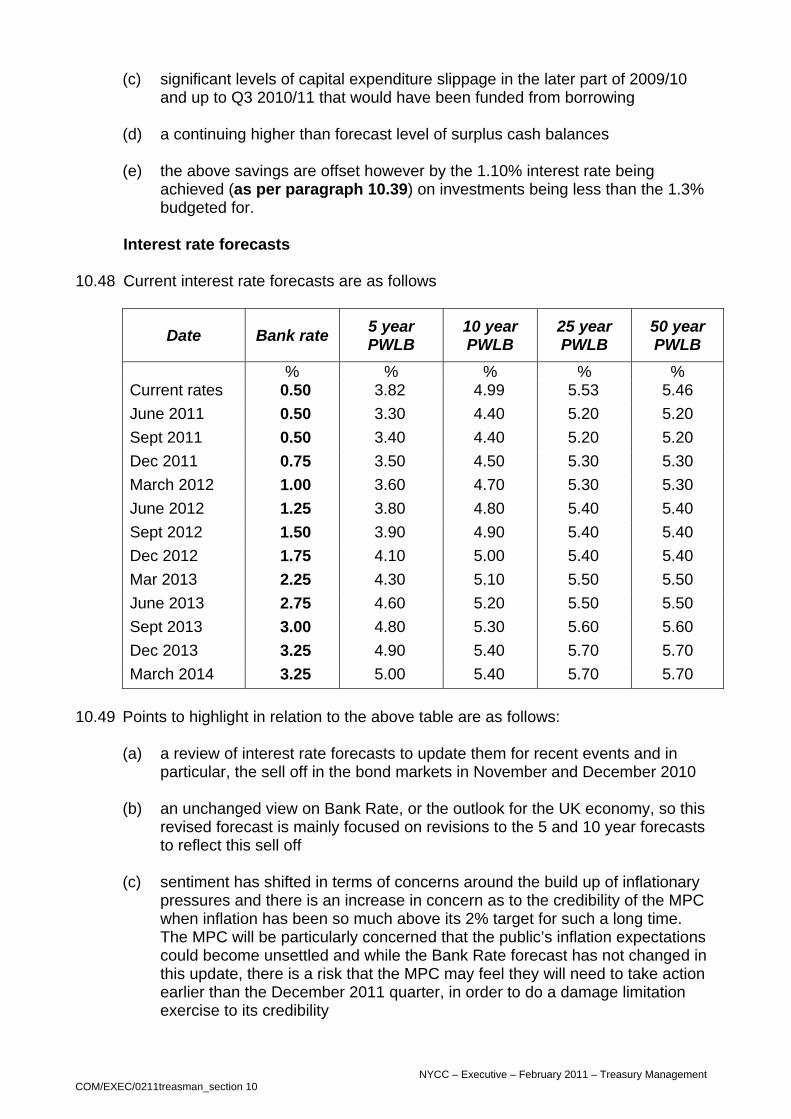
NYCC – Executive – February 2011 – Treasury Management COM/EXEC/0211treasman_section 10
(c) significant levels of capital expenditure slippage in the later part of 2009/10 and up to Q3 2010/11 that would have been funded from borrowing
(d) a continuing higher than forecast level of surplus cash balances (e) the above savings are offset however by the 1.10% interest rate being
achieved (as per paragraph 10.39) on investments being less than the 1.3% budgeted for.
Interest rate forecasts 10.48 Current interest rate forecasts are as follows
Date Bank rate 5 year PWLB
10 year PWLB
25 year PWLB
50 year PWLB
% % % % % Current rates 0.50 3.82 4.99 5.53 5.46 June 2011 0.50 3.30 4.40 5.20 5.20 Sept 2011 0.50 3.40 4.40 5.20 5.20 Dec 2011 0.75 3.50 4.50 5.30 5.30 March 2012 1.00 3.60 4.70 5.30 5.30 June 2012 1.25 3.80 4.80 5.40 5.40 Sept 2012 1.50 3.90 4.90 5.40 5.40 Dec 2012 1.75 4.10 5.00 5.40 5.40 Mar 2013 2.25 4.30 5.10 5.50 5.50 June 2013 2.75 4.60 5.20 5.50 5.50 Sept 2013 3.00 4.80 5.30 5.60 5.60 Dec 2013 3.25 4.90 5.40 5.70 5.70 March 2014 3.25 5.00 5.40 5.70 5.70
10.49 Points to highlight in relation to the above table are as follows:
(a) a review of interest rate forecasts to update them for recent events and in particular, the sell off in the bond markets in November and December 2010
(b) an unchanged view on Bank Rate, or the outlook for the UK economy, so this
revised forecast is mainly focused on revisions to the 5 and 10 year forecasts to reflect this sell off
(c) sentiment has shifted in terms of concerns around the build up of inflationary
pressures and there is an increase in concern as to the credibility of the MPC when inflation has been so much above its 2% target for such a long time. The MPC will be particularly concerned that the public’s inflation expectations could become unsettled and while the Bank Rate forecast has not changed in this update, there is a risk that the MPC may feel they will need to take action earlier than the December 2011 quarter, in order to do a damage limitation exercise to its credibility

NYCC – Executive – February 2011 – Treasury Management COM/EXEC/0211treasman_section 10
(d) in line with widespread comment that the Bank of England’s previous forecasts for growth were on the optimistic side, the November Inflation Report did downgrade the forecast for 2011 to about 2.3%. However, the Bank then slightly upgraded its forecast for growth in 2012 to around 3%, helped by the continuation of strong monetary policy stimulus through an exceptionally low Bank Rate and the current level of QE
(e) however, inherent in this optimistic forward looking view are major
assumptions around a continuation of healthy world growth rates. This dependency is due to a combination of negative factors that are likely to dampen the UK growth rate:-
• the public sector will be a negative contributor to the UK growth rate
• personal expenditure growth rates are likely to be weak
• many corporates and people will be focused on cutting back over-borrowing in the years of easy and cheap credit
• corporate and personal borrowing by borrowers seeking credit will be held back by banks caution in expanding credit when banks are faced with having to refinance huge sums of wholesale funding maturing over the next few years plus repaying all loans made by the Bank of England during the crisis.
(f) the suggested general trend beyond the next twelve months of rising gilt yields
and PWLB rates is expected to remain unchanged as market fundamentals must eventually re-establish the current divergence between the sheer volume of UK gilt issuance and the price of issue of new debt. Negative (or positive) developments in the EU sovereign debt crisis could significantly impact current safe haven flows of investor money into UK gilts and produce shorter term movements away from these central forecasts
(g) as there are significant potential downside risks to these forecasts and to the
pace of both UK and world recovery, caution is suggested for setting investment budgets
(h) any forecasts beyond a one year time horizon will be increasingly subject to
being significantly amended as and when world events and financial markets change.
Other Treasury Management Developments Removal of Supported Borrowing Approvals by the Government 10.50 Although this does not impact on 2010/11, a significant feature of the 2011/12
Provisional Local Government Finance Settlement announced on 13 December 2010 is that all Government capital approvals from 2011/12 are being funded from Capital Grants rather than the previous mix of grants and borrowing approvals.

NYCC – Executive – February 2011 – Treasury Management COM/EXEC/0211treasman_section 10
10.51 This change has significant implications on the County Council’s future Treasury Management operations and consequential Prudential Indicators in terms of:
• reduced annual borrowing requirement and consequential debt levels from
2011/12 by about £33m per annum, which was the approximate total of such borrowing approvals in recent years
• the potential for the annual Minimum Revenue Provision (MRP) for debt repayment exceeding the actual new borrowing requirement in the year resulting in a net debt repayment required with potential early repayment penalties (premiums)
• reduced capital financing costs (interest + MRP) which have been built into the 2011/12 revenue budget/MTFS
• significant impact on many Prudential Indicators Public Works Loan Board (PWLB) 10.52 Borrowing rates increased to 1% above the Government’s cost of borrowing as part
of the CSR announcement on 20 October. 10.53 Although this surprisingly and unwanted cost of borrowing was announced during
Q3 on 20 October 2010, it was covered in more detail in the Q2 report and the implications have been built into the 2011/12 Revenue Budget and MTFS.
Ireland 10.54 In November, the Irish Government confirmed that it had accepted a €85bn rescue
package from the EU and IMF. 10.55 As part of the package, the Irish Government has produced a detailed programme
of tax rises and spending cuts covering the next four years. The Irish Government has also affirmed its intention to restructure the Irish banking system, left with huge bad debts following the collapse of the country’s property market.
10.56 More generally, the operating environment for Irish banks remains highly volatile
and uncertain, and therefore asset quality and earnings performance in the sector is likely to remain extremely weak.
10.57 The three rating agencies have all downgraded their Sovereign Rating for Ireland
over the past year. 10.58 As previously reported to Members, Irish Banks and Building Societies were
removed from the County Council’s Approved Lending List in January 2009 and no funds have been invested with Irish organisations since that date.

NYCC – Executive – February 2011 – Treasury Management COM/EXEC/0211treasman_section 10
RECOMMENDATIONS 10.59 That Executive
(i) notes the position on the County Council’s Treasury Management activities during the third quarter of 2010/11
(ii) refers this report to the Audit Committee for their consideration as part of the
overall monitoring arrangements for Treasury Management.

NYCC – Executive – February 2011 – Treasury Management COM/EXEC/0211treasman_section 10
ANNEX F
TREASURY MANAGEMENT APPENDICES
Appendix A Analysis of investments placed as at 31 December 2010 Appendix B Approved Lending List with counterparty limits as at 31 December 2010 Appendix C Changes to the Approved Lending List during Q3 2010/11
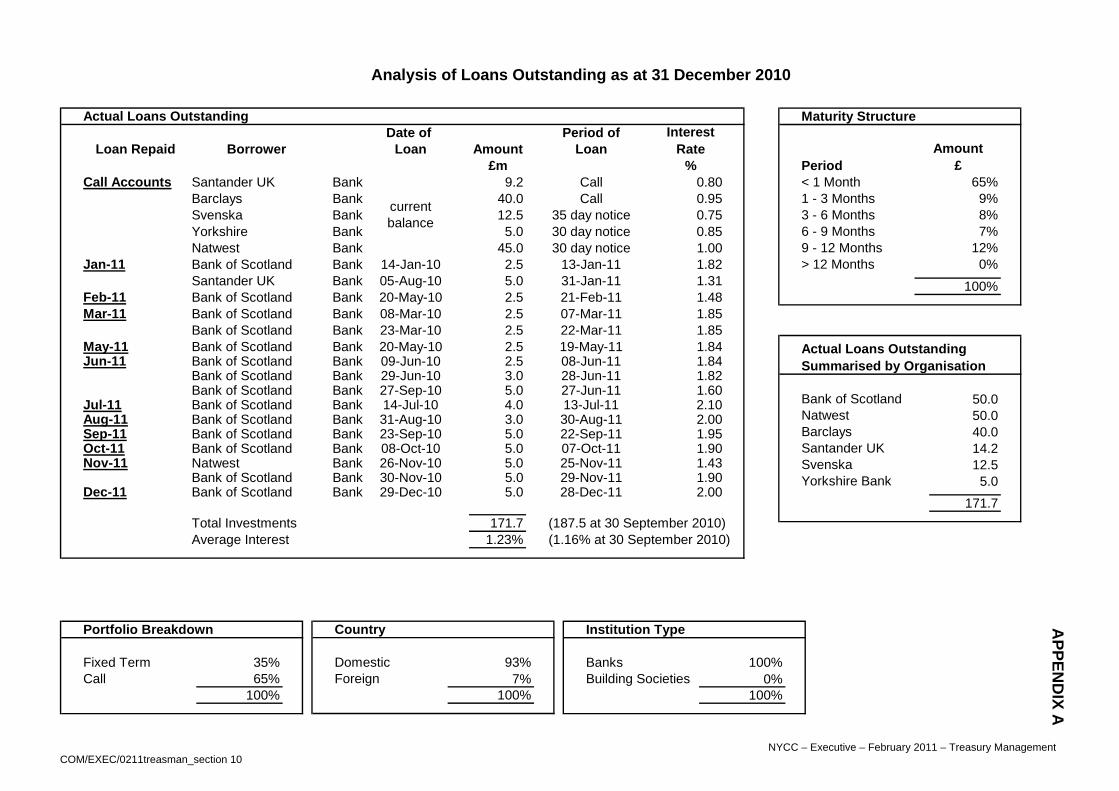
APPEN
DIX A
NYCC – Executive – February 2011 – Treasury Management 211treasman_section 10
Maturity Structure
PeriodAmount
£< 1 Month 65%1 - 3 Months 9%3 - 6 Months 8%6 - 9 Months 7%9 - 12 Months 12%> 12 Months 0%
100%
Bank of Scotland 50.0Natwest 50.0Barclays 40.0Santander UK 14.2Svenska 12.5Yorkshire Bank 5.0
171.7
Actual Loans OutstandingSummarised by Organisation
Analysis of Loans Outstanding as at 31 December 2010
Institution Type
Banks 100%Building Societies 0%
100%
Actual Loans OutstandingDate of Period of
Loan Repaid Borrower Loan Amount Loan£m %
Call Accounts Santander UK Bank 9.2 Call 0.80Barclays Bank 40.0 Call 0.95Svenska Bank 12.5 35 day notice 0.75Yorkshire Bank 5.0 30 day notice 0.85Natwest Bank 45.0 30 day notice 1.00
Jan-11 Bank of Scotland Bank 14-Jan-10 2.5 13-Jan-11 1.82Santander UK Bank 05-Aug-10 5.0 31-Jan-11 1.31
Feb-11 Bank of Scotland Bank 20-May-10 2.5 21-Feb-11 1.48Mar-11 Bank of Scotland Bank 08-Mar-10 2.5 07-Mar-11 1.85
Bank of Scotland Bank 23-Mar-10 2.5 22-Mar-11 1.85May-11 Bank of Scotland Bank 20-May-10 2.5 19-May-11 1.84Jun-11 Bank of Scotland Bank 09-Jun-10 2.5 08-Jun-11 1.84
Bank of Scotland Bank 29-Jun-10 3.0 28-Jun-11 1.82Bank of Scotland Bank 27-Sep-10 5.0 27-Jun-11 1.60
Jul-11 Bank of Scotland Bank 14-Jul-10 4.0 13-Jul-11 2.10Aug-11 Bank of Scotland Bank 31-Aug-10 3.0 30-Aug-11 2.00Sep-11 Bank of Scotland Bank 23-Sep-10 5.0 22-Sep-11 1.95Oct-11 Bank of Scotland Bank 08-Oct-10 5.0 07-Oct-11 1.90Nov-11 Natwest Bank 26-Nov-10 5.0 25-Nov-11 1.43
Bank of Scotland Bank 30-Nov-10 5.0 29-Nov-11 1.90Dec-11 Bank of Scotland Bank 29-Dec-10 5.0 28-Dec-11 2.00
Total Investments 171.7 (187.5 at 30 September 2010)Average Interest 1.23% (1.16% at 30 September 2010)
Interest Rate
current balance
Country
Domestic 93%Foreign 7%
100%
Portfolio Breakdown
Fixed Term 35%Call 65%
100%
COM/EXEC/0
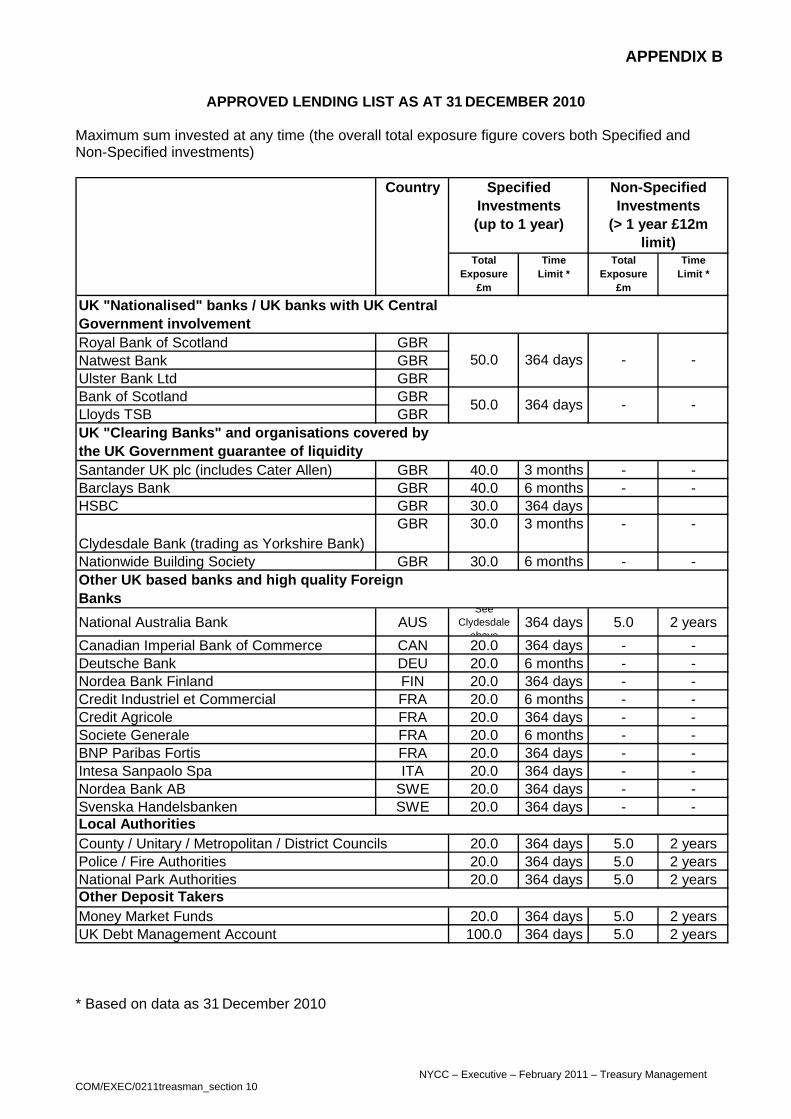
NYCC – Executive – February 2011 – Treasury Management COM/EXEC/0211treasman_section 10
Country
TotalExposure
£m
TimeLimit *
Total Exposure
£m
TimeLimit *
Royal Bank of Scotland GBRNatwest Bank GBRUlster Bank Ltd GBRBank of ScotlaLloyds TSB
Santander UKBarclays BankHSBC
Clydesdale BanNationwide Bui
National Austr
APPROVED LENDING LIST AS AT 31 DECEMBER 2010
Maximum sum invested at any time (the overall total exposure figure covers both Specified and Non-Specified investments)
nd GBRGBR
plc (includes Cater Allen) GBR 40.0 3 months - -GBR 40.0 6 months - -GBR 30.0 364 days
k (trading as Yorkshire Bank)GBR 30.0 3 months - -
lding Society GBR 30.0 6 months - -
alia Bank AUSSee
Clydesdale above
364 days 5.0 2 yearsrial Bank of Commerce CAN 20.0 364 days - -
DEU 20.0 6 months - -nland FIN 20.0 364 days - -l et Commercial FRA 20.0 6 months - -
FRA 20.0 364 days - -ale FRA 20.0 6 months - -
is FRA 20.0 364 days - -lo Spa ITA 20.0 364 days - -B SWE 20.0 364 days - -
delsbanken SWE 20.0 364 days - -itiesy / Metropolitan / District Councils 20.0 364 days 5.0 2 yearsthorities 20.0 364 days 5.0 2 yearsuthorities 20.0 364 days 5.0 2 years
Takers Funds 20.0 364 days 5.0 2 yearsgement Account 100.0 364 days 5.0 2 years
g Banks" and organisations covered by nment guarantee of liquidity
banks and high quality Foreign
50.0 364 days - -
Canadian ImpeDeutsche BankNordea Bank FiCredit IndustrieCredit AgricoleSociete GenerBNP Paribas FortIntesa SanpaoNordea Bank ASvenska HanLocal AuthorCounty / UnitarPolice / Fire AuNational Park AOther DepositMoney MarketUK Debt Mana
UK "Nationalised" banks / UK banks with UK Central Government involvement
UK "Clearinthe UK Gover
Other UK basedBanks
Non-Specified Investments
(> 1 year £12m limit)
50.0 364 days - -
Specified Investments(up to 1 year)
* Based on data as 31 December 2010
APPENDIX B
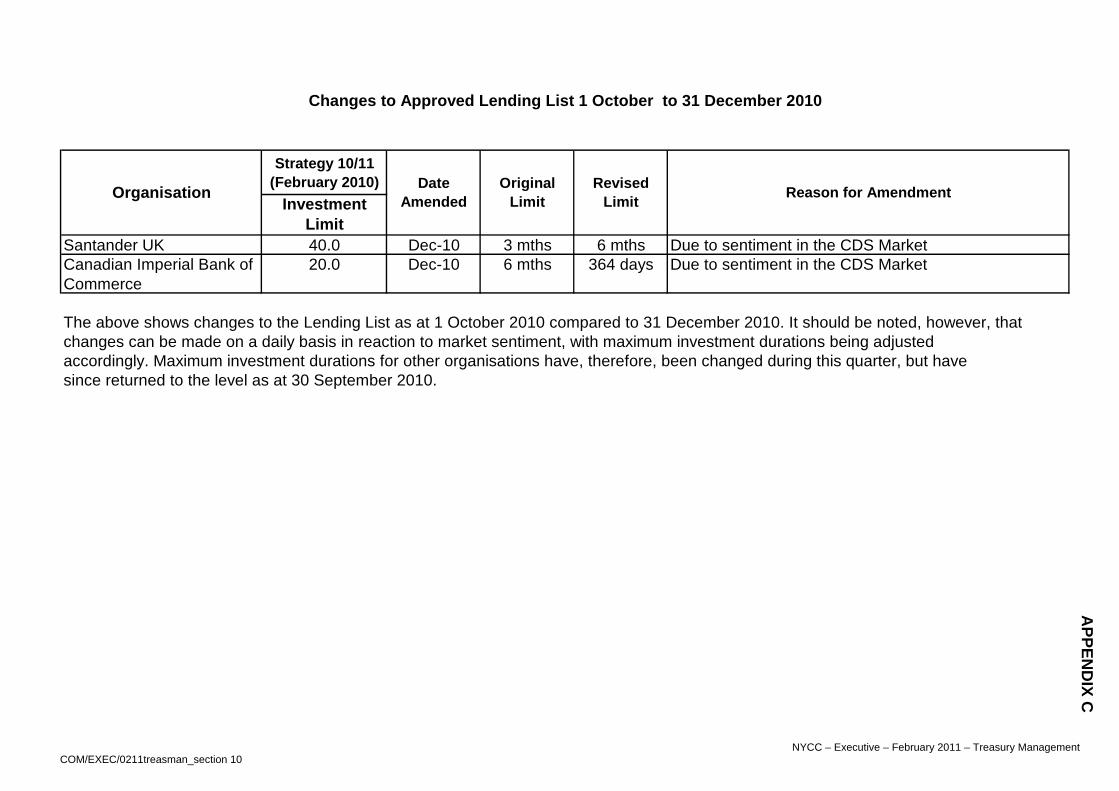
Strategy 10/11(February 2010)
Investment Limit
Santander UK 40.0 Dec-10 3 mths 6 mths Due to sentiment in the CDS MarketCanadian Imperial Bank of Commerce
20.0 Dec-10 6 mths 364 days Due to sentiment in the CDS Market
The above shows changes to the Lending List as at 1 October 2010 compared to 31 December 2010. It should be noted, however, that changes can be made on a daily basis in reaction to market sentiment, with maximum investment durations being adjustedaccordingly. Maximum investment durations for other organisations have, therefore, been changed during this quarter, but havesince returned to the level as at 30 September 2010.
Reason for Amendment
Changes to Approved Lending List 1 October to 31 December 2010
Organisation Date Amended
OriginalLimit
Revised Limit
APPEN
DIX C
NYCC – Executive – February 2011 – Treasury Management COM/EXEC/0211treasman_section 10

11.0 Legal Implications
There are no specific legal implications.
12.0 Consultation and Responses
This report has been the subject of full consultation with Directorates and is agreed by Management Board.
13.0 Conclusions and Recommendations
The County Council continues to perform well and demonstrate improvements in its services.
The recommendations have been made in the body of the report and are listed again here. The Executive is recommended to:
a. Note performance in the third quarter b. Consider the separate report on the Scrutiny review of the
Citizens’ Panel c. Note the Human Resources performance report and Appendix d. Note the latest position for Directorate budgets as
summarised in paragraph 7.5 e. Note the consequential forecast position of the General
Working Balance as detailed in paragraph 7.21 f. Approve the updated Capital Plan, summarised at Appendix
D which incorporates a number of specific refinements reported in paragraphs 8.13
g. Approve the funding arrangements for the scheme at Lower Greenfoot, Settle as detailed in paragraphs 8.13(b)
h. Agree that no action be taken at this stage to allocate any additional capital resources (paragraph 8.29)
i. Note progress to date on achieving the Budget savings required for 2010/11.
j. Note the position on the County Council’s Treasury Management activities during the third quarter of 2010/11
k. Refer this report to the Audit Committee for their consideration as part of the overall monitoring arrangements for Treasury Management.
Richard Flinton John Moore Chief Executive Officer Corporate Director Finance and Central Services 11 February 2011