Embed Size (px)
Citation preview

NORTH SHORE (CHICAGO MSA) COMMERCIAL REDEV OPPORTUNITY1528 Shermer Rd • Northbrook, IL 60062
Exclusively Listed by: Mitchell KivenSenior Associate / Director: National Retail [email protected]
1

N O N - E N D O R S E M E N T A N D D I S C L A I M E R N O T I C E
Confidentiality and DisclaimerThe information contained in the following Marketing Brochure is proprietary and strictly confidential. It is intended to be reviewed only by the party receiving it from Marcus & Millichap andshould not be made available to any other person or entity without the written consent of Marcus & Millichap. This Marketing Brochure has been prepared to provide summary, unverifiedinformation to prospective purchasers, and to establish only a preliminary level of interest in the subject property. The information contained herein is not a substitute for a thorough duediligence investigation. Marcus & Millichap has not made any investigation, and makes no warranty or representation, with respect to the income or expenses for the subject property, thefuture projected financial performance of the property, the size and square footage of the property and improvements, the presence or absence of contaminating substances, PCB's orasbestos, the compliance with State and Federal regulations, the physical condition of the improvements thereon, or the financial condition or business prospects of any tenant, or anytenant's plans or intentions to continue its occupancy of the subject property. The information contained in this Marketing Brochure has been obtained from sources we believe to be reliable;however, Marcus & Millichap has not verified, and will not verify, any of the information contained herein, nor has Marcus & Millichap conducted any investigation regarding these mattersand makes no warranty or representation whatsoever regarding the accuracy or completeness of the information provided. All potential buyers must take appropriate measures to verify all ofthe information set forth herein. Marcus & Millichap is a service mark of Marcus & Millichap Real Estate Investment Services, Inc. © 2018 Marcus & Millichap. All rights reserved.
SPECIAL COVID-19 NOTICE
All potential buyers are strongly advised to take advantage of their opportunities and obligations to conduct thorough due diligence and seek expert opinions as they may deem necessary,especially given the unpredictable changes resulting from the continuing COVID-19 pandemic. Marcus & Millichap has not been retained to perform, and cannot conduct, due diligence onbehalf of any prospective purchaser. Marcus & Millichap’s principal expertise is in marketing investment properties and acting as intermediaries between buyers and sellers. Marcus &Millichap and its investment professionals cannot and will not act as lawyers, accountants, contractors, or engineers. All potential buyers are admonished and advised to engage otherprofessionals on legal issues, tax, regulatory, financial, and accounting matters, and for questions involving the property’s physical condition or financial outlook. Projections and pro formafinancial statements are not guarantees and, given the potential volatility created by COVID-19, all potential buyers should be comfortable with and rely solely on their own projections,analyses, and decision-making.
Non-Endorsement NoticeMarcus & Millichap is not affiliated with, sponsored by, or endorsed by any commercial tenant or lessee identified in this marketing package. The presence of any corporation's logo or nameis not intended to indicate or imply affiliation with, or sponsorship or endorsement by, said corporation of Marcus & Millichap, its affiliates or subsidiaries, or any agent, product, service, orcommercial listing of Marcus & Millichap, and is solely included for the purpose of providing tenant lessee information about this listing to prospective customers.
ALL PROPERTY SHOWINGS ARE BY APPOINTMENT ONLY.PLEASE CONSULT YOUR MARCUS & MILLICHAP AGENT FOR MORE DETAILS.
NORTH SHORE (CHICAGO MSA) COMMERCIAL REDEV OPPORTUNITYNorthbrook, ILACT ID ZAB0370625
2

TABLE OF CONTENTS
SECTION
INVESTMENT OVERVIEW 01Offering SummaryRegional Map
Local Map
Aerial Photo
Parcel Map
FINANCIAL ANALYSIS 02Tenant Summary
Lease Expiration Chart
Operating Statement
Notes
Pricing Detail
Acquisition Financing
MARKET OVERVIEW 03Market Analysis
Demographic Analysis
NORTH SHORE (CHICAGO MSA) COMMERCIAL REDEV OPPORTUNITY
3

NORTH SHORE (CHICAGO MSA) COMMERCIAL REDEV OPPORTUNITY
4
INVESTMENT
OVERVIEW

#
EXECUTIVE SUMMARYOFFERING SUMMARY
MAJOR EMPLOYERS
EMPLOYER # OF EMPLOYEES
ALLSTATE 12,004
Allstate 5,677
Highland Ventures Ltd 4,204
Pregis LLC 4,000
Walgreens 2,838
Merit Health Systems LLC 2,600
Discovery Network 2,000
Glenbrook Hospital The 2,000
RDG Chicago Inc 2,000
Ul 1,848
Bowebellhowell 1,710
Ul LLC 1,680
DEMOGRAPHICS
1-Miles 3-Miles 5-Miles
2020 Estimate Pop 10,875 64,035 202,657
2010 Census Pop 10,972 63,608 201,897
2020 Estimate HH 3,993 24,691 76,882
2010 Census HH 4,027 24,481 76,435
Median HH Income $131,498 $126,810 $109,707
Per Capita Income $70,050 $75,892 $67,248
Average HH Income $190,650 $196,384 $176,840
VITAL DATA
Price $450,000Price/SF (Land) $32.28Lot Size 0.32 acre(s)
5
NORTH SHORE (CHICAGO MSA) COMMERCIAL REDEV OPPORTUNITY

OFFERING SUMMARY
100 Feet of Frontage on Shermer Road in Northbrook Ideal Demographics ($196,000 Average Household Income, +63,000
people within 3 miles) Proximity to Northbrook Metro Station (500 Feet Away) High Barrier to Entry Market Short Term Lease to Chiropractor in Place to Cover Costs During
Re-Positioning or Development New Development Should Return a Profit of 25% Upon a Disposition
INVESTMENT HIGHLIGHTS
Marcus & Millichap is pleased to present the opportunity to purchase the fee simple interest in 1528 Shermer Road in Northbrook, IL, a wealthy suburblocated 14 miles North of Chicago. The property consists of a two-unit, single story, commercial buildings on 0.32 Acres of land in downtown Northbrook,across the street from the Northbrook Metra Train Station. The property is ideal for a redevelopment or repositioning, as leases on newer construction,Class-A retail space in downtown Northbrook exceeds $30/sf NNN. Access to the property is easy and you can make a left or right turn onto Shermer Roadfrom its driveway. With 100 feet of frontage on Shermer, the site offers abundant visibility, which would be perfect for a retail or medical use. There iscurrently a small, single story, two tenant commercial building on the land, with one tenant currently in place, operating on a short-term lease, that couldeither be bought out or cash flowed to cover costs while a new owner repositions the parcel. There is also a separate building on the land that has plumbingand electrical service and is currently used as storage.
At a list price of $450,000, a new ground up development on the parcel should yield a return of around 25%, upon a disposition of the property. Pleasecontact the listing agent for more information on this ground up development model.
Alternatively, this is an ideal opportunity for a user who wants to control their own real estate while benefiting from the outstanding demographics of thislocation (Average Household Income exceeds $196,000 per year and there are over 63,000 people within a 3-mile radius).
Please contact Marcus & Millichap for more information about this property.
INVESTMENT OVERVIEW
6
NORTH SHORE (CHICAGO MSA) COMMERCIAL REDEV OPPORTUNITY

AERIAL PHOTO
7
NORTH SHORE (CHICAGO MSA) COMMERCIAL REDEV OPPORTUNITY
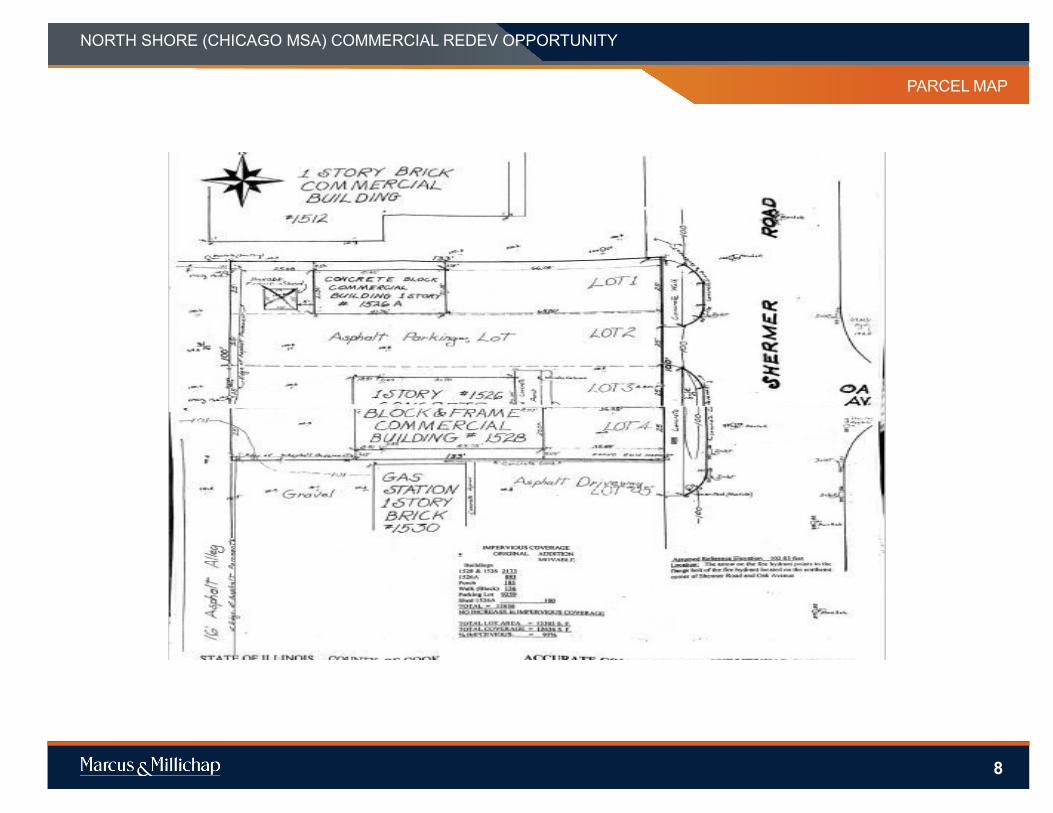
PARCEL MAP
8
NORTH SHORE (CHICAGO MSA) COMMERCIAL REDEV OPPORTUNITY
9
FINANCIAL
ANALYSIS
NORTH SHORE (CHICAGO MSA) COMMERCIAL REDEV OPPORTUNITY

FINANCIAL ANALYSISPRICING
10
NORTH SHORE (CHICAGO MSA) COMMERCIAL REDEV OPPORTUNITY
N/A
N/A

MARCUS & MILLICHAP ADVANTAGE
MARCUS & MILLICHAP CAPITAL CORPORATION CAPABILITIESMMCC—our fully integrated, dedicated financing arm—is committed to providing superior capital market expertise, precisely managed execution, and unparalleled access to capital sources providing the most competitive rates and terms.
We leverage our prominent capital market relationships with commercial banks, life insurance companies, CMBS, private and public debt/equity funds, Fannie Mae, Freddie Mac and HUD to provide our clients with the greatest range of financing options.
Our dedicated, knowledgeable experts understand the challenges of financingand work tirelessly to resolve all potential issues for the benefit of our clients.
Optimum financing solutions to enhance value
Enhanced control through investor qualification support
Enhanced control through MMCC’s ability to qualify investor finance contingencies
Enhanced control through MMCC’s ability to monitor investor/due diligence and underwriting to ensure timely, predictable closings
Enhanced control through quickly identifying potential debt/equity sources, processing, and closing buyer’s finance alternatives
WHY MMCC?
National platform operating
within the firm’s brokerage offices
$ 7.18 billion total national
volume in 2019
Access to more capital sources than any other
firm in the industry
Closed 1,994debt and equity
financings in 2019
11
NORTH SHORE (CHICAGO MSA) COMMERCIAL REDEV OPPORTUNITY

12
MARKET
OVERVIEW
NORTH SHORE (CHICAGO MSA) COMMERCIAL REDEV OPPORTUNITY

MARKET OVERVIEW
OVERVIEWCHICAGO
1
Chicago-Naperville-Elgin is one of the largest metros in the nation. Alsoknown as the Greater Chicagoland area, it is bounded to the east by LakeMichigan, expands over a 5,000-square-mile region in northeastern Illinoisand extends into Wisconsin and Indiana. The metro houses 9.6 millionpeople and comprises 14 counties. The city of Chicago contains 2.7 millionresidents. The greatest growth during the past 20 years occurred in thewestern portion of the region. In recent years, however, businesses arerelocating back into the city to attract young workers, supporting thedevelopment of high-rise residential and office towers in the downtownChicago.
MARKET OVERVIEW
METRO HIGHLIGHTS
THIRD-LARGEST METROPOLITAN AREAThe metro population trails only New York City and Los Angeles in size. Growth in the metro has slowed in recent years.
WEALTH OF INTELLECTUAL CAPITALThe number of corporate headquarters in Chicago is second only to New York City. There are 33 Fortune 500 companies based locally.
LARGE, DIVERSE EMPLOYMENT BASEThe Chicago metro employs 4.8 million workers in an array of industries, including the growing tech and logistics sectors.
NORTH SHORE (CHICAGO MSA) COMMERCIAL REDEV OPPORTUNITY

MARKET OVERVIEWMARKET OVERVIEW
2
TRANSPORTATION
The region’s transit network ranks among the largest and most efficient in the world.
The vast network of freeways, centralized location, a large rail-truck intermodal facility, and the Port of Chicago contribute to the metro’s position as a major distribution and logistics hub.
Chicago is the nation’s premier freight rail hub, with four carriers —BNSF, Union Pacific, CSX, and Norfolk Southern — that service the region.
Amtrak routes originate from Union Station, while the Metra commuter rail and the Chicago L provide passenger service throughout the metro area and beyond.
International airports include O’Hare, Midway and Gary/Chicago. Also 16 smaller airports also provide air service for the region.
Roughly OF ILLINOIS RESIDENTS LIVE IN THE SUBURBS OF CHICAGO, MANY OF WHOM COMMUTE INTO THE CITY FOR WORK40%
16.9Million TEUs
MOVED THROUGH METROIN 2018
3CHICAGO HAS
INTERNATIONALAIRPORTS
8FOR FREIGHT, PASSENGER
AND COMMUTER
RAIL LINES
NORTH SHORE (CHICAGO MSA) COMMERCIAL REDEV OPPORTUNITY

MARKET OVERVIEW
ECONOMY The metro has one of the biggest economies in the nation and
is buoyed by its distribution, finance, manufacturing operations and growing high-tech sectors.
Fortune 500 companies headquartered in the metro include Boeing, Walgreens, Allstate and McDonald’s.
The area is a major global tourist and convention destination. Last year, a record 57.7 million people visited the metro, supporting 500,600 jobs in the leisure and hospitality sector.
Large tech firms such as Amazon, Groupon and Google attract startup companies.
The workforce is considered one of the most diverse and well trained among major U.S. metros.
MAJOR AREA EMPLOYERS
Amazon.com, Inc.
Advocate Aurora Health
Walmart
Northwestern University
United Continental Holdings Inc.
American Airlines.
Walgreens Boots Alliance, Inc.
Abbott Labs
JPMorgan Chase
University of Chicago
3
* Forecast
SHARE OF 2019 TOTAL EMPLOYMENT
MANUFACTURING9%
GOVERNMENT
HEALTH SERVICESEDUCATION AND
+OTHER SERVICES
4%
LEISURE AND HOSPITALITY FINANCIAL ACTIVITIES
20%AND UTILITIES
TRADE, TRANSPORTATION CONSTRUCTION
PROFESSIONAL ANDBUSINESS SERVICES
2%INFORMATION
18%
4%
7%11% 10%
16%
NORTH SHORE (CHICAGO MSA) COMMERCIAL REDEV OPPORTUNITY

MARKET OVERVIEW
Chicago is the third most populous metro in the U.S. with 9.6 million residents. During the next five years, gains will remain below the U.S. rate of growth.
World-class education institutions including Northwestern University and the University of Chicago help provide a skilled labor pool. Nearly 36 percent of residents age 25 and older hold a bachelor’s degree and of these, 14 percent have also earned a graduate or professional degree, which is well above the national level.
Younger professionals moving to the market for employment provide a skilled workforce and contribute to a median age that is below that of the U.S. and a household income above the national level.
More people are renting as thousands of new apartments are completed. As a result, the local homeownership at 60 percent has declined in recent years.
QUICK FACTS
4
* Forecast
DEMOGRAPHICS
37.52019
MEDIAN AGE:
U.S. Median:38.1
$70,6002019 MEDIAN
HOUSEHOLD INCOME:
U.S. Median:$60,800
3.5M2019
HOUSEHOLDS:
Growth2019-2024*:0.8%
9.6M2019
POPULATION:
Growth2019-2024*:0.2%
NORTH SHORE (CHICAGO MSA) COMMERCIAL REDEV OPPORTUNITY

MARKET OVERVIEW
Sources: Marcus & Millichap Research Services; BLS; Bureau of Economic Analysis; Experian; Fortune; Moody’s Analytics; U.S. Census Bureau
5
QUALITY OF LIFE
The Chicago metro has something to offer every one of its residents and visitors,whether it is legendary blues and jazz music, cultural and educational venues,professional sports, dining, entertainment, shopping or recreational amenities.
The Chicago area’s relative affordability is largely due to its lower housing costs. Themedian home price is significantly less than in other cities of its size and is below that ofmany smaller cities, including Seattle and Denver.
Cultural activities and artistic venues underpin the metro’s cosmopolitan lifestyle. Theregion is home to various well-known museums, including the world-class FieldMuseum, Shedd Aquarium, Art Institute of Chicago and Adler Planetarium. The theaterscene rivals the world’s best, and troupes, dance companies, symphony orchestras andmusic venues abound.
29 MILESOF SHORELINE
$264,600MEDIAN HOME PRICE VARIOUS MUSUEMS
70
ARTS & ENTERTAINMENT
NORTH SHORE (CHICAGO MSA) COMMERCIAL REDEV OPPORTUNITY

18
Builders follow spending power to downtown. Continued white-collar job creation inChicago’s urban core remains a driving force of household formation and increasedconsumer spending. As a result, many retailers are targeting the city’s millennial-heavypockets like Fulton Market and West Loop for expansion plans. Quick-service and fast-casualrestaurants, in addition to clothing retailers, are occupying the new space; however,absorption lags new supply in the urban core as a whole, with development accelerating inrecent months. This is consequently slowing rent growth in some urban submarkets, but otherparts including North Michigan Avenue have experienced a surge in average asking rentsdue to the quality of available space on the market. Vacant boutique retail space with askingrents above $200 per square foot is skewing the small pool of marketed prices, dramaticallylifting the growth rate.
Softened leasing activity ebbing suburban rent growth. Retail construction continues totaper in Chicago’s suburbs as broader economic headwinds and the changing retaillandscape weigh on space demand. Reflective of this, the suburban average asking rentregistered negative changes each of the past two quarters, highlighted by double-digitpercentage cuts in parts of South and West Cook County. This contributed to thesuburbanwide year-over-year decrease of 2.7 percent at the end of June. With vacancysticking to an upward trend, rent growth may remain subdued in the coming months,maintaining a $10-plus spread between suburban and urban average asking rents.
• High-traffic areas in Arlington Heights and Schaumburg attracted a number ofinvestors in recent months as nearby suburban employment hubs continuedto grow, boosting consumer spending power in the area. With most price tagsin the $2 million to $7 million range, the buyer pool included a mix of privateand institutional investors.
• Value-add opportunities in communities surrounding Midway InternationalAirport remain prevalent, luring many yield-driven investors. Small retailcenters and outdated strip malls can generate cap rates between 8 and 9percent, well above the metro average. The majority of buyers for propertiesin these areas came from the East Coast; however, some were local.
• Single-tenant restaurants were highly sought after in recent months,particularly quick-service and fast-casual establishments. Sale prices in the $1million to $2 million range and cap rates hovering across the 6 percent realmserved as viable options to private investors seeking additional stability amidthe moderating economy.
Retail 2019 OutlookJob Creation Bringing Developers Downtown;Investors Still Finding Favorable Returns
CHICAGO METRO AREA
2.0 million sq. ft.
will be completed
0.5% increase in
asking rents
20 basis point
increase in vacancy
Construction:
Increased space availability continues toweigh on rent growth, keeping it under 1percent and putting the average asking rentat $17.37 per square foot.
A sustained slowdown in net absorption willpush vacancy up for the second consecutiveyear, rising 20 basis points to 6.7 percent in2019.
* Cap rates trailing 12 months through 2Q19Sources: CoStar Group, Inc.; Real Capital Analytics
Development will increase modestly this yearafter 1.9 million square feet was delivered2018. Three projects comprise a quarter ofthe expected square footage.
Vacancy:
Rents:
Investment Trends
NORTH SHORE (CHICAGO MSA) COMMERCIAL REDEV OPPORTUNITY

19
• The Chicago metro experienced steady employment growth, with 65,200 new jobs added over the past year. This expansion falls in line with the national trend during the same time.
• Notable increases in job growth were posted in business services, which added 12,500 jobs, and hospitality, with 9,900 positions. At the same time, the education and health services sector gained 4,200 jobs.
EMPLOYMENT
• Urban: The metro’s core received 600,000 square feet of space over the past year, a strong boost after only 335,000 square feet was delivered in the previous yearlong period.
• Suburban: Construction decreased slightly on an annual basis as 1.3 million square feet was completed since last June. This follows a trend of declining development, with construction volume dropping each of the past three 12-month periods.
CONSTRUCTION
• Urban: Net absorption in the urban core was negative 14,000 square feet during the past year, down substantially from 330,000 square feet in the previous year. This caused vacancy to inch up 70 basis points to 4.9 percent, still 170 basis points lower than the metrowide rate.
• Suburban: Vacancy also rose in the suburbs, with a 40-basis-point increase to 7 percent. Net absorption of negative 660,000 square feet contributed to this movement.
VACANCY
• Urban: The average asking rent ticked up 4.6 percent during the past year, putting the average per square foot at $26.89. This follows a spike in growth of 13 percent in the first quarter of 2019.
• Suburban: The Chicago suburbs are experiencing a decline in asking rents, logging two consecutive quarters of dropping rates, funneling the average price per square foot down to $15.24 at the end of the second quarter.
RENTS
CHICAGO METRO AREA
decrease in the average asking rent Y-O-Y
1.0%basis point decrease in vacancy Y-O-Y40square feet
completed Y-O-Y
1.9 millionincrease in total employment Y-O-Y
1.4%
* Forecast
2Q19 – 12-Month Trend
NORTH SHORE (CHICAGO MSA) COMMERCIAL REDEV OPPORTUNITY
20
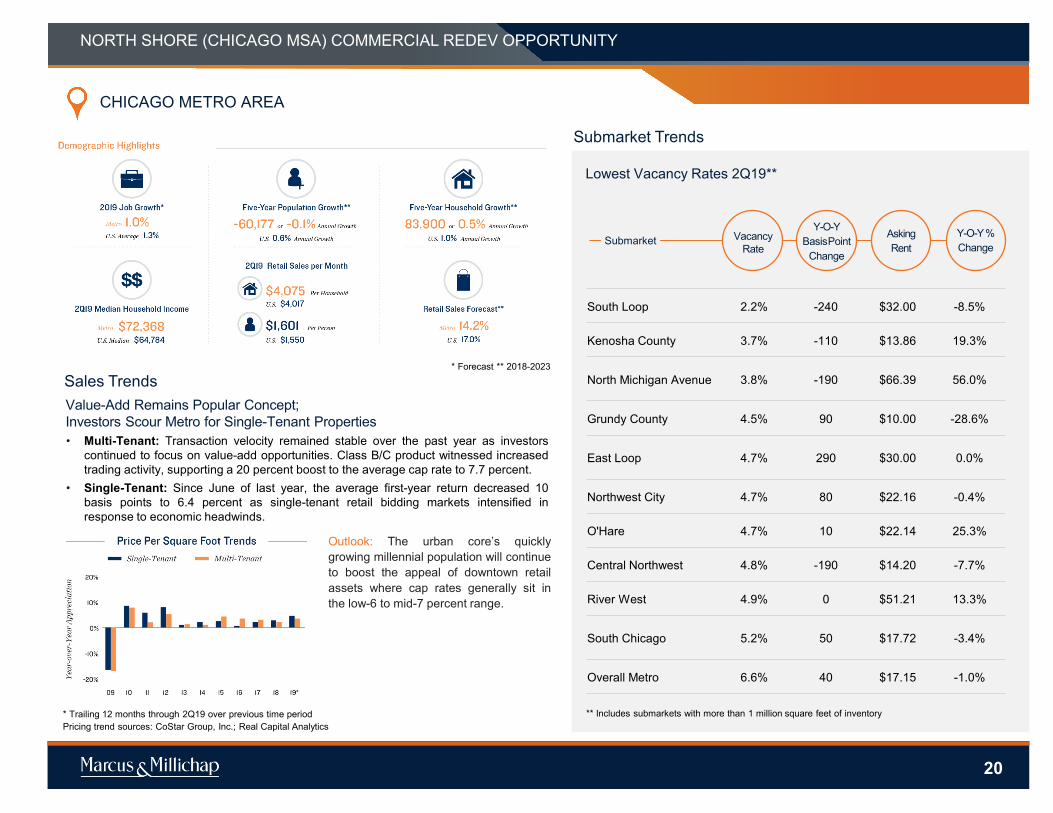
Value-Add Remains Popular Concept; Investors Scour Metro for Single-Tenant Properties
Outlook: The urban core’s quicklygrowing millennial population will continueto boost the appeal of downtown retailassets where cap rates generally sit inthe low-6 to mid-7 percent range.
VacancyRate
Y-O-YBasisPoint
ChangeSubmarket Asking
RentY-O-Y%Change
South Loop 2.2% -240 $32.00 -8.5%
Kenosha County 3.7% -110 $13.86 19.3%
North Michigan Avenue 3.8% -190 $66.39 56.0%
Grundy County 4.5% 90 $10.00 -28.6%
East Loop 4.7% 290 $30.00 0.0%
Northwest City 4.7% 80 $22.16 -0.4%
O'Hare 4.7% 10 $22.14 25.3%
Central Northwest 4.8% -190 $14.20 -7.7%
River West 4.9% 0 $51.21 13.3%
South Chicago 5.2% 50 $17.72 -3.4%
Overall Metro 6.6% 40 $17.15 -1.0%
Submarket Trends
Lowest Vacancy Rates 2Q19**
Sales Trends
CHICAGO METRO AREA
• Multi-Tenant: Transaction velocity remained stable over the past year as investorscontinued to focus on value-add opportunities. Class B/C product witnessed increasedtrading activity, supporting a 20 percent boost to the average cap rate to 7.7 percent.
• Single-Tenant: Since June of last year, the average first-year return decreased 10basis points to 6.4 percent as single-tenant retail bidding markets intensified inresponse to economic headwinds.
* Trailing 12 months through 2Q19 over previous time periodPricing trend sources: CoStar Group, Inc.; Real Capital Analytics
* Forecast ** 2018-2023
** Includes submarkets with more than 1 million square feet of inventory
NORTH SHORE (CHICAGO MSA) COMMERCIAL REDEV OPPORTUNITY

21
CHICAGO METRO AREA
• Fed drives rates lower, yet future policy still undecided. The Federal Reserve cut the overnight rate by 25 basispoints in September, the second reduction in 50 days amid muted inflationary pressure and continued tradetensions with China. Though the rate cut supports an extension of the economic growth cycle, the market remainscautious as the Fed declined to commit to additional rate cuts through the remainder of the year. While some Fedmembers are advocating on further reductions, others hold a different stance, citing positive economic indicatorslike sound retail spending, sustained job creation and strong consumer confidence as reasons to maintain thecurrent target rate. These factors have helped moderate recession risk, putting the 10-year Treasury back in theupper-1 percent range and above the two-year note following a yield-curve inversion in late August. Whilerecession risk remains, the economy’s solid foundation points to continued domestic growth in the near future.Global developments including the trade war with China as well as the progression of Brexit and its potentialaftermath will help determine future Fed decisions.
• Lenders shift focus to tenant blends as transforming sector opens new doors. The evolving nature of theretail sector is providing opportunities for investors and giving underwriters more confidence in the long-termoutlook of retail. Lending habits remain relatively conservative; however, a wide range of financing is available forstrong proposals. Underwriters are beginning to focus more on tenant mixes while emphasizing the inclusion oftenants with sustainable business models before they sponsor a deal. Active lenders include local, regional andnational banks, insurance companies, debt funds and CMBS lenders. Net-leased assets and premier, mixed-usestructures remain the most desirable asset types. Meanwhile, outlying malls and non-credit tenants will be heavilyscrutinized and underwritten in a conservative manner. Loan-to-value (LTV) ratios are in the 60 to 70 percent rangewith typical debt service coverage (DSC) ratios above 1.30x depending on borrower, asset and location factors.Mezzanine and bridge loan structures have been more frequently used in this environment, with owners financingcapital improvements at higher leverage ratios on short-term debt before seeking long-term financing options oncetheir operations have been stabilized.
Capital Markets
* Trailing 12 months through 2Q19Include sales $2.5 million and greaterSources: CoStar Group, Inc.; Real Capital Analytics
By DAVID G. SHILLINGTON, President, Marcus & Millichap Capital Corporation
NORTH SHORE (CHICAGO MSA) COMMERCIAL REDEV OPPORTUNITY

PROPERTY NAME
MARKETING TEAMDEMOGRAPHICS
Source: © 2019 Experian
Created on October 2020
POPULATION 1 Miles 3 Miles 5 Miles 2025 Projection
Total Population 10,765 63,752 202,185 2020 Estimate
Total Population 10,875 64,035 202,657 2010 Census
Total Population 10,972 63,608 201,897 2000 Census
Total Population 10,584 62,472 199,961 Current Daytime Population
2020 Estimate 13,648 98,643 265,901HOUSEHOLDS 1 Miles 3 Miles 5 Miles 2025 Projection
Total Households 3,968 24,816 77,111 2020 Estimate
Total Households 3,993 24,691 76,882Average (Mean) Household Size 2.68 2.53 2.61
2010 CensusTotal Households 4,027 24,481 76,435
2000 CensusTotal Households 3,805 22,945 74,400
Occupied Units2025 Projection 3,968 24,816 77,1112020 Estimate 4,249 26,494 82,551
HOUSEHOLDS BY INCOME 1 Miles 3 Miles 5 Miles 2020 Estimate
$150,000 or More 44.79% 43.26% 37.06%$100,000 - $149,000 17.47% 17.58% 16.90%$75,000 - $99,999 8.81% 9.75% 10.30%$50,000 - $74,999 9.84% 10.00% 11.82%$35,000 - $49,999 5.52% 5.71% 7.62%Under $35,000 13.56% 13.72% 16.32%
Average Household Income $190,650 $196,384 $176,840Median Household Income $131,498 $126,810 $109,707Per Capita Income $70,050 $75,892 $67,248
HOUSEHOLDS BY EXPENDITURE 1 Miles 3 Miles 5 MilesTotal Average Household Retail Expenditure $95,445 $94,659 $89,449 Consumer Expenditure Top 10 Categories
Housing $25,815 $25,453 $24,131Transportation $15,926 $15,797 $14,959Shelter $14,465 $14,347 $13,758Food $11,411 $10,989 $10,429Personal Insurance and Pensions $9,049 $8,897 $8,561Health Care $7,003 $7,168 $6,518Utilities $4,732 $4,747 $4,504Entertainment $4,313 $4,315 $4,039Household Furnishings and Equipment $3,712 $3,361 $3,146
Cash Contributions $3,026 $3,261 $2,741POPULATION PROFILE 1 Miles 3 Miles 5 Miles Population By Age
2020 Estimate Total Population 10,875 64,035 202,657Under 20 25.64% 21.72% 23.58%20 to 34 Years 10.18% 10.18% 13.32%35 to 39 Years 3.57% 3.79% 4.92%40 to 49 Years 13.87% 12.08% 12.68%50 to 64 Years 24.44% 24.31% 23.17%Age 65+ 22.31% 27.93% 22.32%Median Age 48.04 51.61 46.77
Population 25+ by Education Level2020 Estimate Population Age 25+ 7,618 47,632 145,833Elementary (0-8) 0.64% 0.96% 2.16%Some High School (9-11) 1.63% 1.79% 2.54%High School Graduate (12) 8.14% 10.48% 13.06%Some College (13-15) 11.33% 12.99% 13.94%Associate Degree Only 4.80% 4.02% 4.46%Bachelors Degree Only 37.36% 35.35% 32.88%Graduate Degree 35.77% 34.04% 30.13%
22
NORTH SHORE (CHICAGO MSA) COMMERCIAL REDEV OPPORTUNITY

IncomeIn 2019, the median household income for your selected geography is$131,498, compare this to the US average which is currently $62,990.The median household income for your area has changed by 53.75%since 2000. It is estimated that the median household income in yourarea will be $148,160 five years from now, which represents a changeof 12.67% from the current year.
The current year per capita income in your area is $70,050, comparethis to the US average, which is $34,935. The current year averagehousehold income in your area is $190,650, compare this to the USaverage which is $90,941.
PopulationIn 2019, the population in your selected geography is 10,875. Thepopulation has changed by 2.75% since 2000. It is estimated that thepopulation in your area will be 10,765.00 five years from now, whichrepresents a change of -1.01% from the current year. The currentpopulation is 48.23% male and 51.77% female. The median age of thepopulation in your area is 48.04, compare this to the US averagewhich is 38.21. The population density in your area is 3,454.76 peopleper square mile.
HouseholdsThere are currently 3,993 households in your selected geography. Thenumber of households has changed by 4.94% since 2000. It isestimated that the number of households in your area will be 3,968five years from now, which represents a change of -0.63% from thecurrent year. The average household size in your area is 2.68persons.
EmploymentIn 2019, there are 6,568 employees in your selected area, this is alsoknown as the daytime population. The 2000 Census revealed that87.43% of employees are employed in white-collar occupations in thisgeography, and 12.80% are employed in blue-collar occupations. In2019, unemployment in this area is 1.90%. In 2000, the average timetraveled to work was 33.00 minutes.
Race and EthnicityThe current year racial makeup of your selected area is as follows:86.13% White, 0.41% Black, 0.01% Native American and 11.24%Asian/Pacific Islander. Compare these to US averages which are:69.84% White, 12.88% Black, 0.20% Native American and 5.75%Asian/Pacific Islander. People of Hispanic origin are countedindependently of race.
People of Hispanic origin make up 3.14% of the current yearpopulation in your selected area. Compare this to the US average of18.38%.
PROPERTY NAME
MARKETING TEAM
HousingThe median housing value in your area was $483,470 in 2019,compare this to the US average of $221,068. In 2000, there were3,263 owner occupied housing units in your area and there were 541renter occupied housing units in your area. The median rent at thetime was $1,207.
Source: © 2019 Experian
DEMOGRAPHICS
23
NORTH SHORE (CHICAGO MSA) COMMERCIAL REDEV OPPORTUNITY

8 DEMOGRAPHICS
24
NORTH SHORE (CHICAGO MSA) COMMERCIAL REDEV OPPORTUNITY

www.MarcusMillichap.com
E X C L U S I V E L Y L I S T E D B Y :
Mitchell Kiven
Senior AssociateDirector - National Retail GroupChicago Downtown OfficeTel: (312) 624-7006Fax: (312) [email protected]: IL 475.164486