Embed Size (px)
Citation preview

August 2009
MEFEPO
North Sea Atlas Making the European Fisheries Ecosystem Plan Operational

2
Welcome to MEFEPO
“ The oceans and the seas sustain the livelihoods of hundreds of
millions of people, as a source of food and energy, as an avenue for
trade and communications and as a recreational and scenic asset for
tourism in coastal regions. So their contribution to the
economic prosperity of present and future
generations cannot be underestimated .”
Jose Manual Barroso,
President EU Commission
EU Green Paper on Maritime Policy, 2006

3
Welcome to MEFEPO
Preface
Welcome to the MEFEPO Atlas! This publication is intended for policy makers, managers and other
interested stakeholders. Its purpose is to provide a general ecosystem overview of the North Sea (NS)
Regional Advisory Council (RAC) area. We cannot cover all aspects of the complex North Sea ecosystem, but
we can highlight the key features and give a broad overview.
In the Atlas we have tried to make the science as clear and concise as possible. We have kept the technical
language to a minimum and presented the information through a blend of text, tables, figures and images.
There is a glossary of terms (p.76-77) and a list of more detailed scientific references (p.78-79), if you would
like to follow up certain issues.
The Atlas includes general summary information on the physical and chemical features, habitat types,
biological features, fishing activity and other human activities of the North Sea region. Background material
on five North Sea case study fisheries are presented (flatfish, sandeel, herring, mixed whitefish and
Nephrops). These are important case studies in the MEFEPO project.
Knowledge of the North Sea area is advanced compared with other areas (e.g. the Western Waters) and the
information used in this Atlas was collated from a dispersed literature including various national reports and
national research programmes. The International Council for the Exploration of the Sea (ICES), and the Oslo
Paris Commission (OSPAR) literature were often the main sources of information, supplemented by
published papers and various literature and reports.
The information presented in this North Sea Atlas is sourced from the Making European Fisheries Ecosystem
Plans Operational (MEFEPO) project “North Sea Technical Report”. There is also a GIS database (BETA
VERSION) that accompanies this Atlas. Further details can be obtained by contacting [email protected].
OSPAR will produce a new Quality Status Report for the northeast Atlantic in 2010 (last updated in 2000).
This will be a major source of new information for the North Sea. The MEFEPO North Sea Atlas will be
updated in 2012 at the end of the project to incorporate feedback from stakeholders and the new
information.
The MEFEPO partners hope you find this ATLAS useful and would welcome any feedback and comment.
Please forward any comments to [email protected].

4
Welcome to MEFEPO
Please cite as: Paramor, O.A.L., Allen, K.A., Aanesen, M., Armstrong, C., Hegland, T., Le Quesne, W., Piet, G.J., Raakær, J., Rogers, S., van Hal, R., van Hoof, L.J.W., van Overzee, H.M.J., and Frid C.L.J. (2009) MEFEPO North Sea Atlas. University of Liverpool. ISBN 0 906370 60 4
Every effort has been made to ensure the accuracy of the information
contained in this atlas. However the size of the document means that much
detail has had to be omitted and some simplifications have been made for
the sake of clarity. The Making the European Fisheries Ecosystem Plans
Operational project has produced a companion technical report that
contains more detail and full references to the original sources.
We have attempted to contact the copyright holders for all the information
in this document. However, if you are the copyright holder of information for
which we have inadvertently failed to acknowledge you, please contact us
([email protected]) so that we may correct this in future publications.
MEFEPO (Making the European Fisheries Ecosystem Plan Operational) is a group of ecologists,
economists, management experts and fisheries scientists who are trying to make ecosystem-
based fisheries management a reality in Europe.
MEFEPO partners:
(1) University of Liverpool, UK
(2) Instituto das Pescas de Investigação e do Mar, Portugal
(3) Institute for Marine Resources and Ecosystem Studies, part of Wageningen UR, Netherlands
(4) Université de Bretagne Occidentale, France
(5) Marine Institute, Ireland
(6) University of Tromsø, Norway
(7) Centre for Environment, Fisheries and Aquaculture Science, UK
(8) Innovative Fisheries Management - an Aalborg University Research Centre, Denmark
(9) Universitdade dos Acores, Portugal
(10) Instituto Español de Oceanografía, Spain
This North Sea Atlas was produced by the University of Liverpool, UK for the MEFEPO project.

5
Welcome to MEFEPO
Index
2-5 Introduction
6 Summary
7-9 The MEFEPO project
10-11 Depth
12-13 Currents
14-15 Surface temperature
16-17 Bottom temperature
18-19 Salinity
20-23 Nutrients
24-27 Sea floor habitats
28-31 Organisms in/on the sea floor
32-35 Plankton
36-37 Fish
38-41 Marine mammals
42-45 Sea birds
46-49 Distribution of human activities
50-53 Marine Protected Areas
54-57 Flatfish beam trawling
58-61 Industrial sandeel fishing
62-65 Herring fishing
66-69 Mixed whitefish demersal trawling
70-73 Nephrops/Prawn fishing

6
Summary
1. The North Sea is a marginal, shallow sea on the European continental shelf. It is more than 970 kilometres from north to south and 580 kilometres from east to west, with an area of around 750,000 square kilometres. The North Sea RAC area is larger, because it includes the Skagerrak and Kattegat which connect the North Sea proper to the Baltic. The North Sea is bordered by England, Scotland, Norway, Denmark, Germany, the Netherlands, Belgium and France. In the southwest, beyond the Straits of Dover, the North Sea becomes the English Channel which connects to the Atlantic Ocean. The North Sea is a fairly shallow coastal sea and depths in the southern basin do not exceed 50m. The northern areas are deeper but are still generally less than 200m except in the Norwegian Trough, in the north-east, which is the only region of very deep water.
2. The main inflow of water into the North Sea is from the North Atlantic into the northern basin. Water also enters from the English Channel, although this is a smaller, warmer and more saline flow than the northern inflow. The source and volume of water entering the North Sea is highly variable between seasons and years, and is strongly correlated to climatic conditions. Water leaves the North Sea via the Norwegian coastal current.
3. Climate has a major impact on marine waters through its influence on wind speed, rainfall, evaporation and heat exchange between the air and sea. In the North Sea surface temperatures follow a strong annual cycle caused by such climatic conditions although the temperature of bottom waters tends to be more stable and is largely affected by the water bodies entering the North Sea. In their recent climate change update, ICES stated that there “is great confidence within the scientific community that climate change is a reality”. The increase in greenhouse gasses has caused global warming of the atmosphere and ocean, rising sea levels and changing wind patterns. Surface and bottom temperatures have increased in the North Sea in the last 25 years and climate change is affecting the distribution of fish as they move to remain in their preferred temperature range.
4. The salinity of the North Sea is influenced by the large volume of freshwater entering from major European rivers. This is seen in the lower salinities of the south eastern North Sea. There is seasonal variation in the north east of the region influenced by strong seasonal variation in the volume and salinity of water flowing out of the Baltic due to the spring melt of freshwater ice. In coastal areas away from these influences the salinity is typically between 32 and 34.5.
5. The North Atlantic is the major source of nutrients for the North Sea; however the highest concentrations of nutrients enter the sea via rivers and 30% of the nitrogen entering the North Sea comes from the atmosphere. The principle nutrients of importance to marine life are nitrogen, usually in the form of nitrate, and phosphorous in the form of phosphate, but one group of microscopic plants, the diatoms, also require silicon. Nutrient levels in the North Sea and Baltic have increased as a result of human activity; both nitrate and phosphate are elevated but nitrate has increased proportionally more. As nitrate is generally the limiting plant nutrient in marine waters this implies a potential change in the ecology of the system at the base of the food chain with the power to propagate across the ecosystem.
6. Most of the North Sea seabed is made up of sediment of varying sizes. The marginal areas are eroding hard rock which often extends below the low tide level to form underwater rocky reefs and cliffs. This is most common in the northern North Sea where there are many offshore islands and rocky foreshores. In contrast, sandy beaches are more common in the south-eastern North Sea. As a result of the strong association between the physical nature of the sea floor and the organisms that live there, seabed habitat mapping exercises are now being used to predict the distribution of ecological assemblages of species.
Welcome to MEFEPO

7
Welcome to MEFEPO
7. The Continuous Plankton Recorder (CPR) monitors the ecology and distribution of plankton (microscopic organisms) in the North Sea. Changes have been observed in the plankton communities over the last five decades. As these changes have not been consistent across the whole area, small scale processes may have a significant effect on these populations. Phytoplankton (planktonic plants) abundance has increased in the north-western and eastern North Sea whilst diatoms and dinoflagellates have decreased in these regions but increased in the north-eastern North Sea. The total abundance and mix of species in the zooplankton of the North Sea has also changed during this time; overall in the north-eastern Atlantic there has been a 10 degree of latitude shift northward in species distributions, with southern species extending further north, and northerly species retreating.
8. The range of seafloor (benthic) habitats in the North Sea supports diverse and highly productive biological assemblages. The most common organisms on the sea floor are various species of marine bristle worms (polychaetes), burrowing clams (bivalve molluscs), sand shrimps (amphipods), sea urchins and brittlestars. Mobile scavengers, such as crabs, starfish and fish, range across the various habitats.
9. Over ten species of whales and dolphins are regularly sighted in the North Sea, although only the harbour porpoise, bottlenose dolphin, white-beaked dolphin and minke whale are considered to be truly resident species. In most regions, these species have become the subject of a growing eco-tourism industry. Two seal species breed within the North Sea, the harbour seal and the grey seal. Harbour seals occur throughout the North Sea, whereas grey seals almost exclusively occur around northern Britain.
10. The North Sea area is an important area year round for seabirds including several species of national and international conservation importance. Approximately 2.5 million pairs of sea birds from 28 different species breed on North Sea coasts. The coastal and offshore waters provide the birds with a rich supply of food. As predators, birds depend on available food resources and the health of seabird populations can give an indication of the condition of some fish stocks.
11. The North Sea is important at a European level for shipping, and contains some of the busiest shipping routes in the world. A significant proportion of western European imports and exports are transported by ship through the North Sea.
12. The communities surrounding the North Sea use it for cultural, recreational and tourism purposes. In the ten year period 1998-2008 tourist arrivals in the EU increased by almost 40% and a significant proportion of tourist activity is concentrated in the coastal zone.
13. Oil and gas extraction from the North Sea is a major economic activity. Although total oil production from the North Sea remains over 4 million barrels per day, North Sea oil production has declined since its peak in 1999. The expansion of offshore generation is widely supported as one of the key technologies to achieve Kyoto targets for emissions reduction. A large proportion of the existing and proposed European offshore wind turbine sites are located in the North Sea. As of 2008, across the EU, offshore wind farms have a capacity to produce 1,471 MW, which is predicted to rise to 37,441 MW by 2015.
14. Marine Protected Areas (MPAs) are a spatial management tool which controls or restricts human activities in a specific area or at a specific time. They are used for commercial and conservation purposes and there is good evidence that marine protected areas can lead to dramatic changes in stocks of >>

8
Welcome to MEFEPO
>> resident (not transitory) fish species when fishing is excluded . MPAs can be permanent or temporary and are strictly protected by European law. There are many existing restrictions on fishing activity in the North Sea including spatial areas, ‘boxes’, closed to the fishing of cod, herring, sprat, plaice, Norway pout or sandeels.
15. Case study - Flatfish Beam Trawling targets mainly plaice (Pleuronectes platessa) and sole (Solea vulgaris) which live on or close to the sea floor. The catches in 2008 of these two species were 49 744 ton-nes for plaice and 14 145 tonnes for sole.
16. Case study – The industrial sandeel fishery in the North Sea uses small mesh trawls, with a mesh size as small as 5mm. Sandeels spend most of their time in the sediment but move into the water column to feed. Average landings of sandeel in the North Sea in the last 20 years were 666 000 t and total landings in 2008 were 335 000 t.
17. Case study – Herring fisheries use pelagic trawls to catching shoals in the water column. Official catches of North Sea herring for human consumption were 219 100 tonnes in 2008.
18. Case study – The main species taken by the North Sea large mesh (>100 mm) otter trawl fleet are anglerfish, cod, plaice, saithe and whiting. The whitefish fishery has the highest impact in terms of both weight and numbers of cod removed in the North Sea. ICES classifies the cod stock as suffering reduced reproductive capacity and as being harvested unsustainably.
19. Case study - Landings of Nephrops have increased in recent years. The increased biomass is proba-bly due to better environmental conditions benefitting recruitment. The current levels of exploitation are considered sustainable.

9
Welcome to MEFEPO
The Ecosystem Approach
“The comprehensive integrated management
of human activities based on best available
scientific knowledge of the ecosystem and its
dynamics, in order to identify and take action
on influences which are critical to the health
of the marine ecosystems, thereby achieving
sustainable use of ecosystem goods and
services and maintenance of ecosystem
integrity.”
The MEFEPO project
MEFEPO are a group of ecologists, economists, management
experts and fisheries scientists that are trying to make
ecosystem based fisheries management work in Europe. In
recent years considerable effort has been devoted to
addressing the governance, scientific, social and economic
issues required to develop and introduce an ecosystem
approach to European marine fisheries. MEFEPO will seek to
harness and apply these efforts to real situations.
Fisheries management needs to support the ‘three pillars of
sustainability’ (ecological, social and economic). One of the
greatest challenges of management is searching for ways of
achieving these objectives simultaneously. The economic
and social pillars may be considered subsidiary to the
ecological pillar since the loss of an ecological resource base
will mean that no social and economic benefits can be
derived from the seas.
Fisheries Ecosystem Plans (FEPS)
In the US, Fisheries Ecosystem Plans (FEPs) were developed for further integration of the ecosystem approach in
fisheries management and as a tool to assist managers with considering the ecological, social and economic
implications of their management decisions. The EC FP5-funded European Fisheries Ecosystem Plan (EFEP)
project developed a FEP for European waters, using the North Sea as a case study. This project incorporated
social and political sciences, marine ecology, fisheries science and mathematical modelling to identify the effects
of fisheries management scenarios (including changes in effort, changes in gear types and spatial closures) on
the ecosystem and their acceptability to a broad range of marine stakeholders including fishers, fish processors,
managers, policy makers, scientists and environmentalists . The project also developed a step-wise framework
for the transition of management from the current regime to an ecosystem approach, and an outline of how the
FEP could be made operational within existing legislation.

10
North Sea Atlas
Regional Advisory Councils (RACs)
The RACs were introduced in 2004 to
provide ‘new forms of participation
by stakeholders’. They aim to
provide a formal mechanism for
communication between the
European Union and fisheries
stakeholders. Stakeholders include
f i s h i n g r e p r e s e n t a t i v e s ,
conservationists and other
organisations such as women's or
angling groups. Five of the RACs have
a regional focus whilst two are non-
regional and consider the pelagic
fisheries and distant water fisheries.
The MEFEPO project is using three
demersal RACs as case studies (see
map opposite). These are:
● North Sea (NS)
● North Western Waters (NWW)
● South Western Waters (SWW)
The focus of this Atlas is on the North
Sea (NS)
The North Sea is a marginal, shallow sea on the European continental shelf. It is more than 970 kilometres from north to south and 580 kilometres from east to west, with an area of around 750,000 square kilometres. The North Sea RAC area is larger, because it includes the Skagerrak and Kattegat.
The North Sea is surrounded by England, Scotland, Norway, Denmark, Germany, the Netherlands, Belgium and France. In the southwest, beyond the Straits of Dover, the North Sea becomes the English Channel which connects to the Atlantic Ocean.
The area is important for marine shipping; it is used for fishing and military purposes; minerals, oil and gas are
extracted; and it is a place for tourism. Lately ,it has also become important for renewable energy installations
such as wind farms.
The North Sea with depth contours (see also page 13) and selected
locations referred to in this report (Source: Rees et al., 2007)

11
Making the European Fisheries Ecosystem Plan Operational
MEFEPO
The three RAC areas used as MEFEPO case studies. From north to south these are: North Sea (NS), North Western Wa-
ters (NWW) and South Western Waters (SWW).
SWW
NWW NS

12
Water depth
The North Sea may be divided into three regions according to depth. These are:
● Southern Bight (51-54oN) with water depths of less than 40m,
● Central North Sea (54-57oN) with water depths of 40-100m (except for the
shallower areas on the Dogger Bank and along the western coastline of
Denmark),
● Northern North Sea (north of 57oN) (including an area of shelf water 100-
200m deep, and the Norwegian Channel with water depths from 200 to
>700m in the Skagerrak between Denmark and Norway).
’Layers’ of different temperature or salinity can be formed in the water column.
This process is called stratification. The layering tends to occur over the calmer,
warmer months when the top layer warms and is less mixed with the lower layer
because there is less wind and fewer storms to physically mix the water column.
The main stratification in the North Sea starts around May, beginning in the north,
and extending southwards as the season progresses to around 53.5 °N. South of
this area the strong tidal currents flowing through the relatively shallow water
keep the water column mixed all year around. Owing to the formation of layers,
mixing of nutrients is restricted, which in turn limits the availability of nutrients for
algae which grow in the upper, sunlit layers. During the stormier months, the
water column becomes mixed and uniform. This is an important process as it
provides nutrients for algae to grow in the top layer the following spring.
The depth of the water column is an important characteristic
of an area as it strongly affects:
● surface temperature
● bottom temperature
circulation patterns
Formation of thermocline, halocline and pycnocline
● natural levels of disturbance
● salinity
● the type of sea floor, e.g. mud or sand
● the distribution of biological organisms

13
The North Sea is a fairly shallow coastal sea and depths in the southern basin do not exceed 50m. The northern areas are deeper but are still generally less than 200m in the Norwegian Trough, in the north-east, which is the only region of very deep water. Deposits left by retreating glaciers produce offshore sand and gravel banks in the central region which are important spawning areas for a variety of fish species.

14
Currents and Circulation
Water enters the North Sea through two main routes:
● from the northern North Sea
- this is the main inflow of water into the North Sea
- water enters via the Fair Isle Channel and either the
northern North Sea Plateau or along the Norwegian
Trench
- inflow through this route is strongly correlated to
climatic conditions (the North Atlantic Oscillation)
● from the English Channel
- this a smaller, warmer and more saline flow than the
northern inflow
- water flow into the North Sea has increased significantly
through this route since 1958.
Water leaves the North Sea via the Norwegian
coastal current. This current is a combination
of wind-driven coastal water from the southern
North Sea, saline water from the western
North Sea and low salinity water from the
Baltic Sea outflow.
The source and volume of water entering the North Sea is highly
variable between seasons and years, and is strongly correlated to
climatic conditions (mainly the North Atlantic Oscillation).

15
Schematic diagram of circulation in the North Sea. Arrow width represent the magnitude of volume transport. Blue ar-
rows indicate the flow of Atlantic water and black arrows water of other types (Source: Turrell, 1992; OSPAR, 2000)
Central North Sea water
Jutl
and
co
asta
l wat
er
Chan
nel w
ater
Continental coastal water
South North Sea water
Dooley Current
Scottish
coastal w
ater
Fair Isle current
Atlantic water (west)
North North Sea water
No
rwegian co
astal water

16
Surface Temperature
We consider the effects of both surface and bottom temperatures separately because they affect very different
environments and systems.
Sea surface temperatures (SST) follow a strong annual cycle (see maps opposite). SST is affected by heating by
the sun and heating/cooling through contact with the air, which is accentuated during high wind conditions. It is
also influenced by mixing of surface water with deepwater caused by wind or tidal currents in shallow areas; by
the inflow of freshwaters, in particular cold water following the spring melting of ice and snow; and by the tem-
perature of water entering from the Atlantic and Channel, the temperature and volume of which vary interannu-
ally in response factors such as large scale atmospheric patterns such as the North Atlantic oscillation.
The temperature of surface waters varies more than the temperature of deeper waters as they are exposed to a
greater number of parameters. This means that there is more ‘disturbance’ in these areas and the organisms
need to be tolerant of a wide range of temperatures.
Changing temperature has implications
for the organisms which live in marine
habitats. Most marine organisms are cold
blooded and so changes in temperature
directly affect biological processes such as
their growth, metabolic rate and hence
food requirements. Temperature also
provides a cue for many organisms trig-
gering events such as migration or breed-
ing. As different species respond differ-
ently to changes in temperature, there is
the possibility that warming of the seas
may lead to biological events becoming
decoupled. For example, prey populations
may increase earlier in the year, while
other animals continue to breed as they
do now, so their larvae fail to synchronise
with the period of maximum food avail-
ability.
The temperature of the surface water also
affects organisms which require light
(such as the plant component of the
plankton) and their predators (such as fish
larvae and crustaceans in the plankton).
Over the entire North Sea, both summer and winter sea
surface temperatures have been increasing since the 1970s
with increased interannual variability in summer tempera-
tures also occurring. SST in the North Sea has been above its
long-term mean (1950-2008) in recent years, with the ex-
ception of win-
ter 1996. While
the years since
1989 have been
above the long-
term mean, no
clear rising
trend is visible;
instead an in-
crease (around
0.5 to 1.0 °C)
occurred at the
end of the
1980s after
which tempera-
tures stayed
high.
Summer (top) and winter (bottom) temperature anomalies,
1950-2002 in the northern North Sea. Anomalies produced by
subtracting the mean for the whole period.
Summer
Winter

17
Temperature in °C
The annual cycle of surface temperatures of marine waters in the North Sea (scale in degrees Celsius). (Source: BSH, 2008)

18
Bottom Temperature
The temperature of bottom waters (those near or on the sea bed) tends to be more stable than that on the sur-
face. It is largely affected by the water bodies entering the North Sea from the Atlantic Ocean. Cold water flows
into via northern North Sea and remains below the surface mixed layer . In the southern North Sea warmer water
enters the southern basin via the English Channel. The shallow nature of the southern basin and the English Chan-
nel and the strong tidal flows mean that this region is well mixed and bottom water temperatures follow those of
the surface waters.
Climate Change
Climate change is affecting the distribution
of fish as they move towards their pre-
ferred temperature range.
If the sea temperature increases, fish at the
northern limit of their temperature range
will have new, more northerly areas to
move into as formerly cold water becomes
more habitable. In contrast, fish at the
southern limit of their range will be forced
to move northwards to escape the rising
temperatures. Analyses indicate that this is
already happening (see opposite). Monthly near-bed temperatures in 2007. (Source:
Skjoldal, 2007)
The temperature of the sea bottom shows
strong seasonal patterns. Long term
variability is closely correlated with
circulation in the atmosphere and in
particular the pattern of wind, which in
turn is driven by variation in the
distribution of atmospheric pressure.
In the North Sea, the winter bottom
temperature has increased by 1·6 °C over
25 years, with a 1 °C increase in 1988-1989
alone. On average temperatures have
increased by between a quarter and half a
degree centigrade per decade.

19
Changes in distribution of red mullet (Mullus surmuletus) between 1977-1989 and 200-2005 in the North Sea. The upper left panel shows distribution in 1977-1989 and the upper right panel shows distribution in 2000-2005. The lower panel shows the change in distribution between the two periods; blue green colours indicate an increase in density, with dark colours indicating the largest change, and yellow and red colours indicate a decrease in density between the two periods with red indicating the largest changes. The upper panel graph shows the proportion of the total survey area where an increase and decrease occurred. (Source: Tasker, 2008)

20
Salinity
The average concentration of the
main ions in seawater (shown as parts
per thousand by weight) are:
Chloride (Cl-) 18.980
Sulphate (SO42-) 2.649
Bicarbonate (HCO3-) 0.140
Bromide (Br-) 0.065
Borate (H2BO3-) 0.026
Fluoride (F-) 0.001
Sodium (Na+) 10.556
Magnesium (Mg2+) 1.272
Calcium (Ca2+) 0.400
Potassium (K+) 0.380
Strontium (Sr2+) 0.013
Salinity is primarily controlled by mixing of waters of different
origins and so river run-off is a major factor, in enclosed regions
such as large bays evaporation and precipitation (rain!) can add
further short term variability.
Seawater contains trace amounts of every naturally occurring element and away from coastal inputs the relative
amounts of each element are remarkably constant – giving rise to the concept of the consistency of composition of
seawater. In coastal seas local inputs alter these balances, the chemistry of inflowing river water being influenced
by the local geology for example.
The salinity of the North Sea is influenced by the large volume
of freshwater entering from the major rivers draining Europe
and this is seen in the lower salinities of the south eastern
North Sea. There is seasonal variation in the north east of the
region influenced by strong seasonal variation in the volume
and salinity of water flowing out of the Baltic due to the spring
melt of freshwater ice . In coastal areas away from these influ-
ences the salinity is typically between 32 and 34.5.
Adaptation to saltwater.
The marine environment is saltier then the internal environment of marine organisms. So they tend to lose water and gain salt. Marine organisms have different methods of regulating this balance (osmosregulation).
Osmoconformers maintain their internal salinity such that is the same as their environment. Invertebrates, like starfish are osmoconformers. If they are placed in water more or less concentrated than seawater, their tissues shrink or swell, this damages their cells and they can die. Therefore, these organisms are not found in estuaries, or river mouths where fresh and salt water meet and the salinity fluctuates greatly.
Osmoregulators maintain their internal salinity lower than the environment. Elasmobranchs (e.g. sharks and rays) do this by increasing the amount of organic ions, mostly urea, to keep their total ion concentration comparable to saltwater. Fish, however, drink water and actively excrete concentrated salt. To achieve this, they have special cells that concentrate salt and then excrete it against the salinity gradient, which costs energy. Birds and reptiles have salt glands in the head, which secrete salt solutions.

21
The Great Salinity Anomaly
Variations in the climate in the North Atlantic
greatly influence the formation and fate of
waters produced by the melting of the ice
sheets of the Arctic each spring. Periodically
these factors come together to produce a body
of water of greater or less than ‘normal’ salin-
ity. In 1968 a unusually large amount of unusu-
ally low salinity water was formed in the Labra-
dor Sea and this ‘Great Salinity Anomaly’
moved around the North Atlantic over the next
14 years. It entered the North Sea with the
Atlantic inflow via the Shetland Gap in 1977
and reached the southern bight in 1979. The path of the 1968 Great Salinity Anomaly
(Source: Dickson et al., 1988).
Salinity in the North Sea at a depth of 10m during February (5 year intervals from 1951 to 1998).
(Source: Beare et al., 2002)

22
Nutrients
Marine plants need nutrients just as garden plants and crops do. The principle nutrients are nitrogen usually in the
form of nitrate and phosphorous in the form of phosphate, but one group of microscopic plants, the diatoms, also
require silicon.
In most marine areas nitrate is the nutrient in shortest supply, marine plants need 16 times more nitrogen than
phosphorous. However in some oceanic areas iron can be limiting while by late spring the diatoms may have used
up all the available silicon preventing their further growth and allowing other groups to bloom.
Nutrients enter the North Sea with the inflowing
Atlantic waters, from rivers, by discharges of nutri-
ent rich effluents from industrial processes, and
with human waste water (sewage).
The North Atlantic is a major source of nutrients
for the North Sea, however the highest concentra-
tions of nutrients enter the sea via rivers. Nutrient
concentrations in river water are often 50 times
higher than Atlantic water, so exceptionally high
concentrations of nutrients from human activities
are mainly found in coastal waters and semi-
enclosed estuaries, bays or fjords with limited wa-
ter exchange.
Given the importance of river inflows, variations in
nutrient inputs occur from year to year and closely
reflect patterns of river runoff, with higher inputs
in wet years. The inputs are proportional to the
amount of water discharged by the rivers. For ex-
ample, 75 % of the nitrogen, which enters the
coastal zone of the North Sea, flows in with the
river runoff of the Rhine and Elbe, the two largest
rivers.
Nutrients are exported from the water to the sedi-
ments, when plants and animals die for example,
but decomposers break down this organic material
and release nutrients back into the water (see dia-
gram). Resuspension of nutrients into the water
column also occurs by impacts on the sediment, for
example increased shear stress by storm events or
impacts of fishing gears.
Schematic of the cycle of nutrients in marine pelagic and benthic ecosystems
Zooplank-ton N P
Phyto-plankton
N P
Nutrients
N P
Dissolved organic matter
N P
Benthic N
Benthic P
Assimilation Grazing
Re
susp
en
sio
n
Sed
imen
tati
on
Excretion
Mineralisation Mortality
Mo
rtal
ity
Water
Sediment

23
70
84
112
210-420
210-
560
98
112 98
126
98
112
140
126
154
Distribution of NO3 (mg/l) in the North Sea surface water in winter (Source: Brockmann et al., 1988)

24
Trends in winter nitrate and phos-
phate concentrations, and N/P
ratio in coastal waters of the
North Atlantic, the Baltic Sea, the
North Sea and the Mediterranean.
Data from EEA.
Nutrient levels in the North Sea
and Baltic have increased as a
result of human activity; both
nitrate and phosphate are ele-
vated but nitrate has increased
proportionally more. As nitrate is
generally the limiting plant nutri-
ent in marine waters this implies a
potential change in the ecology of
the system at the base of the food
chain, and so with the power to
propagate across the ecosystem.
At present the scale of these changes is limited; the result of control measures introduced in the 1990s
but in some areas, such as enclosed bays, the effects can be seen
Around 30% of the nitrogen entering the North Sea comes from the atmos-
phere. Of this 81% is wet deposition, i.e. it is washed out by rain. Around 38%
of this nitrogen derives from agriculture and the remaining 72% from combus-
tion sources (Source: Hertel et al., 2002).
North Sea Atlas

25
Reductions in nitrogen and phosphorous inputs
from human activities achieved between 1985
and 1999/2000.
Long term increases in nitrates and phosphates
have been observed in the southern North Sea.
The increase in the south-eastern North Sea could
be related to the circulation dynamics as nitrate
levels are positively correlated to the inflow into
this area from the Channel (Leterme et al 2008).
Since the 1980s the level of nitrate flowing into the
seas from European rivers has remained unchanged
(below) while the introduction of control measures
has caused phosphate inputs to decline (EEA data).
Making the European Fisheries Ecosystem Plan Operational
MEFEPO

26
Sea Floor Habitats
The marginal areas around the North Sea are eroding
hard rock which often extends below the low tide level to
form underwater rocky reefs and cliffs. These are most
common in the northern North Sea where offshore is-
lands and rocky foreshores are common, in contrast to
the sandy beaches in the south-eastern North Sea.
In the southern North Sea rocky
coasts are limited in extent and
Helgoland is the only rocky island.
In some places boulders and the
shells or tubes of marine organ-
isms also form undersea reefs.
Most of the North Sea seabed is made up of sediment of varying sizes. Gravel, shingle, sand and mud are descrip-
tive terms that describe sediments composed of increasingly smaller particles. In many places the sediments are
moved by waves and currents and this tends to result in sediments that are fairly uniform in size. In other loca-
tions historic, for example glacial, deposition of sediments of one size is now being added to by particles of a dif-
ferent size. These are referred to as poorly sorted sediments, an example would be a gravel bank deposited by
the retreating glaciers at the end of the last ice age that is now having modern mud deposited on it. This results
in ‘muddy-gravel’.
Cullercoats, UK
Helgoland, Germany

27
Sediment map of English Channel and North Sea, modified by Carpentier et al. (2008). Detailed coverage of the Dutch
Maritime area added by MARGIS project (Larsonneur et al., 1982; Augris et al., 1995; Duphorn et al. 1970; Figge, 1981;
British Geological Survey, (BGS) 1977-1993; Danish Geological Survey (GEUS), 1992).

28
North Sea Atlas
There have been several initiatives to map the marine landscapes and habitats of the North Sea. Landscape classifi-
cations are based on physical information such as the sediment size, the strength of water currents and depth ,
whilst habitat classifications include information on both the physical and biological characteristics of an area.
As a result of the strong association between the physical nature of the sea floor environment and the
species of organisms that live there, seabed habitat mapping exercises are also being used to predict
the distribution of ecological assemblages of species. While it is possible to fly an aeroplane or a satel-
lite over the Earth and accurately map the main terrestrial habitats this is not the case for the sea floor.
The nearest equivalent is to use echo sounders to acoustically map the seafloor, The basic premise is
that different types of sediment or rock covered in seaweed will send back different types of echo. This
approach has had some success but acoustic mapping of the seafloor is very expensive (in ship time)
and challenges remain in matching sound signatures to habitat types and getting sufficiently detailed
data to identify habitats that naturally occur as patches e.g. deep water corals, rocky reefs.
The distribution of marine landscapes around the UK derived from the combination of sediment and
bathymetry maps with information on tidal stress and a limited amount of ground truthing.

29
Marine landscape maps are
currently the most detailed
maps at large scales (see
figures). Whilst several
North Sea countries have
produced marine landscape
maps for some or all of their
national waters (e.g. UK, The
Netherlands, France and
Belgium) there is not yet
complete coverage across
the North Sea.
Marine landscapes of the Dutch sector of the North Sea showing the seafloor
characterized by combinations of sediment and depth data with limited
additional information on the distribution of mobile features and the tidal
current stress. The landscapes are therefore less integrated that those predicted
in the UK map but based on the same information.
The distribution of marine landscapes in the Belguim part of the North
Sea derived from acoustic surveys and classifying different types of
seabed (1-17) primarily on the basis of their acoustic properties.
Making the European Fisheries Ecosystem Plan Operational
MEFEPO

30
Organisms in/on the sea floor
The majority of the North Sea floor is covered by
sediments of various sizes. These support often
diverse and highly productive biological assem-
blages. The main organisms are various species of
marine bristle worms (Polychaetes), burrowing
clams (bivalve molluscs), sand shrimps
(amphipods), sea urchins and brittlestars. Various
species of mobile scavengers, such as crabs, starfish
and fish, range across the various habitats.
A single square metre of North Sea muddy sea-
floor may contain over 6000 individuals from
over 300 species making these systems compara-
ble to tropical forests in terms of biodiversity and
temperate pastures in terms of productivity.
Bottom dwelling organisms are essentially static, at least as adults, and can be categorised into ecological com-
munities. Petersen carried out a wide ranging survey of the shallower parts of the North Sea using a quantitative
grab sampling technique in 1914-1922, and classified the benthos into seven distinct 'communities'. He implied
no biological linkages between the species in these 'communities', merely that they tended to occur together in
space. More recent studies in the North Sea have confirmed the link between particular assemblages of species
and the distribution of sediment types and other physical factors, principally temperature, depth and bottom
current stress (Source: Duineveld et al., 1991, Kunitzer et al., 1992) and these distributions have remained
broadly similar over a period of 14 years (Source: Rees, 2007). The most recent surveys using advanced statisti-
cal techniques identify 20 different ecological assemblages (map opposite). These analyses highlight the impor-
tance of physical factors in controlling seafloor ecology and have provided the impetus to develop predictions of
the distribution of seabed areas that share similar environmental conditions. These are referred to as marine
landscapes (see p26).

31
Distribution of the 20 ecological assemblages of sea floor organisms identified in the North Sea in 2000. Each assemblage
represents a different mix of species of sea floor inhabiting animals and sites with the same symbol (i.e. belonging to the
same cluster) contain similar types of species, in similar abundances. (Source: Rees et al., 2007)

32
In shallow water, where light penetrates, hard substrates such as cliffs and reefs are
colonised by seaweeds especially the large brown seaweeds of the kelp family that float
up creating an underwater forest with shade adapted red algae growing as an under-
story and harbouring an array of mobile animals.
North Sea Atlas
In deeper water the kelps are un-
able to grow and shade adapted
red algae persist but in deeper
water still they too become light
limited. Beyond this point, known
as the circa-littoral zone, animals
dominate and the reefs are car-
peted in a living carpe of animals
including sponges, hydroids
(pictured opposite), bryozoans
(horny corals) and clams. These
animals are all ‘filter-feeders’ a
collective term for organism that
feed by filtering microscopic food
particles from the water column.
Burrowing bivalves

33
Seaweed ‘forests’ are similar to those on land with
the larger plants forming the ‘canopy’ and lots of
smaller ‘shrubs’ beneath. These areas support a high
diversity and density of animals due to the physical
complexity of the habitat.
Boulders and gravels may also support a community including attached algae
and/or filter-feeding animals. Any finer particles deposited in between the large
ones will also be colonised by worms and other burrowing forms. The fauna of
such habitats if often ephemeral, comprising fast growing and rapidly breeding
species. This is the result of storms that moves the sediment, and any deposi-
tion of sediment onto the large particles will causing widespread mortality.
Anemone on sea floor. These animals are
related to jellyfish and capture particles
using ‘stinging cells’ on their tentacles!
Brittlestar
Making the European Fisheries Ecosystem Plan Operational
MEFEPO

34
Plankton is the collective term given to those organisms that drift in the sea, too small
and too weak to swim against the currents. Most plankton are microscopic, bacteria,
single celled animals and plants but also include a large number of animals some of
which are visible to the naked eye and include jellyfish up to 2 metres long.
Plankton include plants and animals that pass their whole lives drifting in the water but
also the larvae of many invertebrates and fish that live as adults on the seafloor. Jelly
fish occupy the seafloor as larvae and become plankton when they become adults.
Plankton are ecologically important as pho-
tosynthetic bacteria and single celled plants
(phytoplankton) are the base of the ocean
food chain. They in turn are consumed by
microscopic and planktonic consumers and
in these in turn become food for fish. Some
of these animals and plants will die and sink
carrying organic material to the sea floor
and so fuelling the sea floor ecosystem.
Plankton
The Continuous Plankton Recorder (CPR) Survey's marine
monitoring programme collects data from the North Atlantic
and North Sea on the ecology and biogeography of plankton.
The unique dataset provides a wide range of environmental
and climatic indicators and is used by marine scientists and
policy makers to address management issues such as harmful
algal blooms, pollution, climate change and fisheries.
The phytoplankton (plant component of plankton) community
has been studied since 1958 and has shown changes in this
period. These changes have not been consistent across the
North Sea which indicates the importance of smaller scale
processes.
Phytoplankton abundance has increased in the north-western
and eastern North Sea whilst diatoms and dinoflagellates have
decreased in these regions and increased in the north-eastern
North Sea. (Source: Leterme et al., 2008).

35
A
M
LR C
LG
R
HE
Continuous Plankton Recorder tow routes sampled during 1999.

36
North Sea Atlas
It is now widely accepted that a major
change in the pattern and dynamics of
phytoplankton in the North Sea
occurred around the mid-late 1980s.
This is often referred to as a regime
shift and appears to reflect a change in
the patterns of climate in the North
Atlantic and the changed phytoplank-
ton dynamics has knock on effects in
zooplankton and fish populations
Mean annual phytoplankton colour and a contoured plot of
monthly means of phytoplankton colour averaged for the
period 1946-2002 (Source: Reid et al., 1998).
This diagram shows that while the total
abundance has changed, so has the mix of
species in the zooplankton of the North Sea.
The different colours reflect different mixes
of species. The shift to a generally ‘blue’ pat-
tern after 1985/86 reflects the regime shift
but also coincides with a decline in recruit-
ment (the white line) in gadoid fish—cod,
haddock, whiting. This shows how environ-
mental signals (the regime shift) effect
phytoplankton, zooplankton and conditions
for fish larvae.
Total numbers of copepods in the North Sea has
shown a long term decline over the last 50 years.
0
2
4
6
8
10
12
1960 1970 1980 1990 2000
Gadoid outburst
0
1
2
3
-1
-2
-3
Mo
nth
s
Pla
nkt
on
an
om
alie
s P
C1
Year

37
Some species of phytoplankton can produce toxins that they secrete into the surrounding water to deter
predators. Under some circumstances, that are not yet fully understood, these species can increase to high
densities and produce high levels of
toxins. These are known as harmful
algal blooms (HABs). The toxins can
affect species including fish, seals and
birds and can also affect humans who
ingest contaminated shellfish or fish.
Examples include those connected
with Paralytic Shellfish Poisoning
(PSP).
It would appear that the frequency of
such HABs is increasing but it is diffi-
cult to be sure this is not simply the
result of better reporting. In temper-
ate seas a phytoplankton bloom oc-
curs every spring, generally followed
by a smaller peak in autumn. The size
of the bloom will be determined by
seasonal changes in light penetration
and nutrient content of the water
column through mixing and turbu-
lence followed by nutrient depletion
as phytoplankton blooms. HABs may
be related to water surface temperatures in spring, as early seasonal stratification may favour phytoplank-
ton, growth in the water column (Source: Joint et al., 1997). In the Atlantic area there has been a large in-
crease in HAB events associated with changes in salinity, sea surface temperature and wind speed.
Known harmful and detrimental phytoplankton taxa recorded by the CPR survey in the North Atlantic and around UK coastal waters at a temporal reso-lution of one month.
Species/genus Associated harmful/detrimental
effects
Time-series
Ceratium furca Hypoxia/anoxia 1948-
Coscinodiscus wallesii Production of mucilage 1st recorded 1947 (invasive)
Dinophysis spp Diarrhectic shellfish poisoning (DSP). 1948-
Gonyaulux spp Unspecified toxicity 1965-
Noctiluca scintillans Discolouration and hypoxia/anoxia 1981-
Phaeocysttis spp Production of foam and mucilage. Hypoxia/anoxia.
1946-(presence/absence)
Prorocentrum micans Diarrhectic shellfish poisoning (DSP). Discolouration and hypoxia/anoxia
1948-
Pseudo-nitzschia spp Amnesic shellfish poinsoning (ASP) 1948-
Nitzschia closterium (now cylindrotheca)
Production of foam and mucilage. Hypoxia/anoxia.
1948-
Chaetoceros spp Gill clogging 1948-
Skeletonema costatum Gill clogging 1948-
Zooplankton diversity is highest in the south-eastern
part of the North Sea, south of the Flamborough Front.
The northern areas tend to be dominated by species
with an affinity for the Atlantic Ocean and which have
been carried into the North Sea by the Atlantic inflow.
Major shifts in the composition and timing of zooplank-
ton population dynamics have occurred in recent years.
Overall in the north-eastern Atlantic there has been a
10 degree latitude shift northward in species distribu-
tions, with southern species extending further north
and northerly species retreating.
Biodiversity of marine copepods in the North Atlantic
as measured by taxonomic richness (Source: Beaug-
rand et al., 2000).
Making the European Fisheries Ecosystem Plan Operational
MEFEPO

38
Fish
Over 230 fish species are known to inhabit the North
Sea. A distinction can be made between those mainly
living in the water column (pelagic) and those living on or
near the bottom (demersal species). Some fish remain
more or less stationary, while others show a distinct mi-
gratory behaviour. A seasonal migration from feeding
areas to spawning areas occurs in many species. This can
be within the North Sea (e.g. plaice), or to areas outside
the North Sea (e.g. herring) or even up rivers (e.g. eel).
The most dominant fish species in biomass is
the Lesser sandeel (Ammodytes marinus). Other
dominant species are sprat (Sprattus sprattus)
and dab (Limanda limanda) (Yang 1982).
Schooling
Some pelagic species like herring, form an
interactive social group, called a shoal or
school. The difference between the two is
how tight the organisation is. Within a such a
school, the fish synchronize their swimming
so that all fish move at the same speed and in
the same direction. Schooling behaviour
makes fish vulnerable to fishing as a whole
school can be caught at once.
Feeding
Most demersal species eat benthic organisms whereas
some, mainly pelagic, fish species eat zooplankton.
However, most species are generalists, which feed on a
range of different species, sometimes even their own.
Feeding methods differ, some species filter the water
for food, others dig in the sediment, hunt actively or lay
still on the bottom waiting for prey that pass by.

39
Fish species richness is lowest in the central North Sea and highest in Scottish waters, the Kattegat and the
Channel. Species with a more northern distribution reach their greatest diversity in waters typically deeper
than 100m and species with a more southern distribution in waters less of 50m. The left map above shows
northern species and the right map Southern species.
A specific group of fish are the
Elasmobranchs. These are
cartilaginous fish, meaning they have
skeletons made of cartilage instead of
bone (bony fish are teleosts). In the
North Sea, elasmobranchs consists of
about 7 shark species and 10 ray and
skate species. These species are
especially vulnerable to fishing
because they have a low reproductive
rate and a long maturation time. In
the North Sea they are primarily
caught and landed as by-catch
species, but some small inshore
fisheries target rays and skates. The
figure shows the average number of
elasmobranchs after 20 hauls of the
international bottom trawl survey
(Source: IBTS, 1977-2004).
Estimated average number of
elasmobranch species
+ 0 to 0.1
0.1 to 2
2 to 3
3 to 4
4 to 5
5 to 15

40
Marine Mammals
The marine mammals of the North Sea include whales, dolphins and seals. As some
of the largest and most charismatic animals inhabiting the North Sea they are often
the focus of much public interest. Although they were once subject to extensive
commercial hunting, those days have passed and only a few countries, including
Norway and Iceland, still hunt whales. In most regions they have become the
subject of a growing eco-tourism industry.
While the great whales eat plankton
the toothed whales and seals are top
predators, sitting at the apex of marine
food webs. Therefore the health of
these marine mammal populations
does not only depend on the extent of
direct impacts on their populations,
but they also rely on healthy food webs
to support them.

41
Estimated distribution and abundance of Harbour porpoise, June 2005. (Source: Project SCANS-II, supported by the EU
LIFE Nature programme under project LIFE04NAT/GB/000245 and by the governments of all range states: Belgium, Den-
mark, France, Germany, Ireland, The Netherlands, Norway, Poland, Portugal, Spain, Sweden and the UK).

42
North Sea Atlas
Whales and Dolphins
Over ten species of whales and dolphins are regularly sighted in the North Sea, al-
though only four of these are considered to be truly resident species.
Harbour porpoise
Bottlenose dolphin
White-beaked dolphin
Minke whale
Of these the harbour porpoise is the most abundant species of whale or dolphin. Esti-
mates from 2005 suggest that there are over 250 000 harbour porpoise in the North
Sea and Channel.
Whales and dolphins have variable diets; eating fish, squid and sea floor animals.
They tend to be opportunistic feeders, with their diet consisting of what is locally
available. However the main areas of distribution have changed over time, this is
thought to reflect climate and fishing induced changes in food availability.
The primary agreement addressing the conservation of whales and dolphins is the Agreement on
the Conservation of Small Cetaceans of the Baltic and North Seas (ASCOBANS), which came into
force in 1994. The main threat to whales and dolphins is accidental entanglement in fishing gear
which can lead to drowning if the animals can not surface to breathe. Other threats include pollu-
tion, acoustic disturbance and potential conflicts with fisheries for food resources.

43
Seals
Two seal species breed within the North Sea, the harbour seal and the grey seal (pictured below). Both
species are coastal due to the need for haul out sites, although they can make extensive at sea foraging
trips. Harbour seals occur throughout the North Sea, whereas grey seals almost exclusively occur around
northern Britain.
Both species have undergone large changes in population numbers over the last century. The low point in
population numbers was in the 1970s when a combination of hunting and pollution had reduced the popu-
lations to low levels, since when numbers of both species have increased considerably.
The harbour seal population has been significantly effected by two outbreaks of the phocine distemper
virus (PDV) in 1998 and 2002. The impact of the PDV outbreaks are illustrated by counts of seal numbers in
the Wadden Sea.
Harbour seal numbers in
the Wadden Sea. NL- Neth-
erlands; DK- Denmark, Nds-
Niedersachsen; SH-
Schleswig-Holstein. (Source:
Wadden Sea Secretariat,
Trilateral Seal Expert Group,
2008).
Making the European Fisheries Ecosystem Plan Operational
MEFEPO

Seabirds
Seabirds are one of the most noticeable components of the
North Sea ecosystem. Approximately 2.5 million pairs of sea
birds, made up of 28 different species, breed on coasts in
the region. As predators they depend on available food
resources and the health of seabird populations can give an
indication of the condition of some fish stocks.
Sandeels form an important part of the diet of many seabirds in the North
Sea, especially during the breeding season. Different species show varying
sensitivity to sandeel numbers depending on how easily they can use
alternative prey. Black-legged kittiwakes are considered especially sensitive
to changes in sandeel availability as they can only forage close to breeding
colonies and have limited diving ability. Therefore kittiwakes are limited in
their ability to catch suitable alternative prey and are sensitive to local
sandeel availability. Kittiwake breeding success tends to decline in areas
when local sandeel abundance drops around breeding colonise. This is
illustrated in the figure on the opposite page, which shows the relationship
between sandeel stock biomass and the average number of chicks reared
per nest for Foula, Shetland Isles.
Several years of the poorest breeding success on record have occurred
since 2003. This may be caused by climate change, as it is thought that
climate change effects sandeel breeding success in the North Sea (see page
58), although the impact of fisheries on sandeel stocks is uncertain.
Climate change could cause long term effects on the distribution and
abundance of seabirds around the North Sea through impacts on seabird
ecology and in particular effects on the food resources of seabirds.

45
Breeding season distribution of kittiwakes. The estimated relative abundance of kittiwakes during June and July based
on at sea observations compiled between 1979 - 2006 (Source: European Seabirds at Sea, data made available by Joint
Nature Conservation Committee, Royal Society for the Protection of Birds, DHI, Norwegian Institute for Nature Re-
search, FTZ & Vogelwarte Helgoland, Netherlands Seabird Group, Research Institute for Nature and Forest (INBO),
IMARES, University College Cork, Royal Netherlands Institute for Sea Research (NIOZ), Texel).

46
North Sea Atlas
Number of breeding pairs of seabirds off northeast Britain (thousands) (Source: ICES, 1999).
There have been big changes to the numbers of seabirds over the last century, mainly due to the changes
in fishing and discarding over this period. It was estimated that in the 1990s discards (including offal)
from fishing boats made up 30% of the total diet of seabirds in the North Sea. The changes in the size and
composition of seabird community are illustrated by changes in the scavenging seabird community off
northeast Britain (see figure) The fulmar has shown the greatest increase in numbers and area of distri-
bution over this time. Future changes in discarding practices could affect sea bird populations.
European Shag

47
Breeding success of kittiwakes, Rissa tridactyla, at Foula in relation to estimated biomass of Shetland sandeels.
(Furness 2007)
Kittiwake © Oscar Bos
The increase in seabirds feeding on dis-
cards and offal generally favours larger
scavenging species. Increases in large scav-
enging seabirds sometimes cause reduc-
tions in smaller seabirds breeding in the
same area through competition for nesting
sites or direct predation. For example in
the early 1950s in the German Wadden Sea
terns comprised 60% of the seabird com-
munity and large gulls 40%. By the early
1980s the seabird community was domi-
nated by large gulls which made up 83% of
the breeding population.
Given the high public interest in seabirds
they are often used a ‘barometer’ of eco-
system health and the public have been
encouraged to contribute to the monitor-
ing of their populations. While there has
been a growing body of internationally
coordinated effort to record seabird num-
bers and spatial patterns at sea, counts at
breeding sites provide a long term record
of population health. Around the British
Trust for Ornithology organizes regular
estuarine, coastal and breeding colony
counts and these data are then made
available to researchers and monitoring
programmes.
Making the European Fisheries Ecosystem Plan Operational
MEFEPO

48
The North Sea is surrounded by densely populated developed countries with long maritime
histories. The North Sea has been a centre for a range of human activities over the centuries and
wars have been fought over control of the strategic shipping lanes that cross the North Sea. To
this day the North Sea remains an important area at the European level for shipping, extractive
industries and cultural pass times. A new chapter in human relations with the North Sea may be
opening as it is increasingly viewed as a source for renewable energy generation.
Distribution of Human Activities
Oil and gas
Oil and gas extraction from the North Sea is a major economic activity. The main areas for oil
extraction are in the northern North Sea in the UK and Norwegian sectors. The main area for gas
extraction is in the shallower southern North Sea in the UK, Dutch and Danish sectors. Although
total oil production from the North Sea remains over 4 million barrels per day, North Sea oil pro-
duction has declined since its peak in 1999.
Offshore wind farms
The first offshore wind turbines were installed at Vindeby in Denmark in 1991. As of 2008
across the EU offshore wind farms have a capacity to produce 1,471 MW, which is predicted to
rise to 37,441 MW by 2015 (EWEA). A large proportion of the existing and proposed European
sites are located in the North Sea. The expansion of offshore generation is widely supported as
one of the key technologies to achieve Kyoto targets for emissions reduction. The European
Commission’s 2008 Strategic Energy Review supported the vision of a large expansion in
offshore power generation and the development of a North Sea offshore grid. The
establishment of significant offshore wind farms around the North Sea should be viewed as a
realistic prospect.

49
Location of oil and gas installations in the North Sea (Source: Clarkson Research Services Limited for data on the oil and gas
installations, windfarm data is from OSPAR).

50
North Sea Atlas
Tourism
Tourism is a rapidly expanding industry within the European Union, in the ten year period 1998-2008, tourist
arrivals in the European Union increased by almost 40% and a significant proportion of the tourist activity is
concentrated in the coastal zone.
The impacts from tourism on the marine environment are concentrated in coastal areas, although limited im-
pacts extend offshore. The main impact from tourism is related to habitat loss and modification due to coastal
development. There can be further direct impacts on coastal habitats by intense use of sensitive habitats such
as wetlands and coastal dunes. Direct offshore impacts are mainly related to boating activities. Recreation fish-
ing, and in cases diving, can cause direct removals of organisms from the ecosystem.
The impacts of tourism are not all negative. Tourism can provide an important source of income to coastal ar-
eas, and tourism that depends on good environmental status provides incentives to protect or improve environ-
mental status.
Aquaculture
Marine aquaculture of fish or shellfish is un-
dertaken by most states bordering the North
Sea. Salmon is the main finfish cultured in the
North Sea although an increasing range of
species, such as cod and turbot, is likely to be
cultured as production and husbandry prac-
tices improve. Shellfish culture in the North
Sea is confined to molluscs, including blue
mussels, oysters and scallops. Marine aqua-
culture can have a number of impacts on the
marine environment; the main impacts are
nutrient release, chemicals applied for
‘medicinal’ purposes, compromise of natural
population structure due to genetic interac-
tion between wild populations and escaped
farm conspecifics, and farmed sites acting as
a source of pathogens.

51
Shipping
The North Sea contains some of the busiest shipping routes in the world, a significant proportion of
western European imports and exports of goods and materials are transported by ship through the
North Sea. Shipping, and its attendant infrastructure and activities, can have a number of impacts due
to routine and exceptional events. The impacts of shipping are increasingly regulated. For example the
use of tributyltin antifoulants (TBTs) has been increasingly restricted under both international (IMO)
and regional (EU) regulations. Under EC regulation 782/2003 from 1st January 2008 the application of
TBT based antifouling paints on EU flagged vessels has been banned, and ships with TBT based paints
are banned from visiting EU ports. The North Sea has been established as a Special Area under MAR-
POL Annex I (oil) establishing a code of conduct for tankers travelling through Special Area waters.
Oil tanker traffic in 2004.
Source: UNEP/GRID-Europe
Aggregate extraction
Aggregates extracted from the North Sea are an important source of material for
the construction industry. In 2006 87.5 million tonnes of marine aggregates were
extracted by countries bordering the North Sea (European Aggregates Industry).
Aggregate dredging can have a number of direct and indirect effects on sea floor
communities due to direct removal of organisms and material, resuspension of ma-
terial and possible alteration in sediment transport. The extent and duration of im-
pacts varies depending on local sediment types and natural levels of disturbance.
Aggregate extraction only occurs in localised licensed areas, and although local im-
pacts can be notable the impact on a regional level is limited.
Making the European Fisheries Ecosystem Plan Operational
MEFEPO

52
Marine Protected Areas
Marine Protected Areas (MPAs) are a spatial management tool
which controls or restricts human activities over a specific
area. They are used for a variety of purposes including:
Commercial purposes
- to protect a commercial species
Conservation
- of a non-commercial species protected by legislation
- of a habitat protected by legislation
MPAs have been used to protect fish stocks in several ways. These include:
Time-limited restrictions on fishing to protect juvenile fish (e.g. Plaice Box)
Time-limited restrictions on fishing to protect spawning grounds
Real time closures to protect high densities of undersized fish
Time-limited restrictions to protect other ecosystem components (e.g. Sandeel Box)
There is good evidence that marine protected areas from which fishing is
excluded can lead to dramatic changes in stocks of resident (not transient) fish.
This evidence comes from studies of reef fish in the tropics but also non-
migratory and territorial fish and shellfish, including lobsters, wrasse and rays in
the NE Atlantic. These studies have shown no benefits to species which are
mobile or migratory and modelling studies suggest that very large areas would
need to be closed to fishing before direct benefits occur for these species.
Protection of areas of habitat that provide high quality feeding or breeding
grounds will of course be beneficial, but such indirect effects may not be easy
to measure.

53
Cod boxes Herring boxes
Shetland box Sprat boxes
Norway Pout box Plaice box
Sandeel box
Fishery Exclusion Areas (‘boxes’) in the North Sea. Fishery exclusion areas are a fisheries management tool whereby a
sea area is closed (either permanently or seasonally) to a certain fishing gear or vessel size, or for a certain target spe-
cies usually for the purpose of fish stock management or recovery.

54
North Sea Atlas
The designation of SAC sites broadly follows this
process:
National agencies nominate a site
National government approve the candidate
SAC (cSAC)
Impact assessments
Public consultation
National agencies revise and amend the cSAC
Habitats considered ‘threatened and declining’
by OSPAR:
Coral reefs
Intertidal Mytilus edulis (blue mussel)
beds on mixed and sandy sediments
Intertidal mudflats
Littoral chalk communities
Lophelia pertusa reefs
Maerl beds
Modiolus modiolus (horse mussel) beds
Ostrea edulis (native oyster) beds
Sabellaria spinulosa reefs
Sea-pen and burrowing megafauna
communities
Zostera (seagrass) beds
Habitats protected under the Habitats Directive
Open sea and tidal areas
1110 Sandbanks which are slightly covered by
sea water all the time
1130 Estuaries
1140 Mudflats and sandflats not covered by sea-
water at low tide
1150 * Coastal lagoons
1160 Large shallow inlets and bays
1170 Reefs
1180 Submarine structures made by leaking
gases
* indicates priority habitats
MPAs can be permanent (e.g. to protect an area
of coral reef) or temporary (seasonal or real
time) (e.g. to protect spawning stocks or aggre-
gations of juvenile fish).
The most common types of MPA used for con-
servation purposes in the North Sea are those
designated as Special Areas of Conservation
(SAC) or Special Protection Areas (SPAs). SACs
are strictly protected sites designated under
Article 3 of the EC Habitats Directive and SPAs
are strictly protected sites classified in accor-
dance with Article 4 of the EC Birds Directive.
These sites are used to protect specific habitat
types (e.g. ‘reefs’ or ‘sandbanks which are
slightly covered by sea water all the time’) or
the habitats of certain species (e.g. grey seal or
harbour porpoise).
Puffins on the Farne Islands

55
In May 1992 European Union g o v e r n m e n t s adopted legislation designed to protect the most seriously threatened habitats and species across E u r o p e . T h i s legislation is called the Habitats Directive and complements the Birds Direct ive adopted in 1979. At the heart of both these Directives is the creation of a network of sites called Natura 2000. The EU marine Natura 2000 network
will be made up of both SACs and SPAs. These sites are in the process of being designated, but the network should be designated completely by 2010 and management implemented by 2012
Although not covered by the Natura 2000 network, the Norwegian fisheries management
regime has developed a comprehensive set of management measures over several
decades, including the use of a variety of MPAs. Some of these area based measures were
originally introduced for reasons other than protecting biodiversity, i.e. protection of small
scale static gear fisheries from the competition of large scale trawlers, but have in some
cases provided decades of protection. Area based management measures have so far
been introduced to Norwegian fisheries for protection of spawning grounds, juvenile fish
(permanent and seasonal closures) and vulnerable bottom habitats (i.e. coral reefs); for
rebuilding of depleted stocks (i.e. coastal cod, redfish, sandeel) or as a management
measure for stationary stocks (i.e. lobster and seaweed); and to reduce competition
between gears and fleets. Areas are designed according to their specific regulatory needs,
while at the same time seeking to minimize the regulatory burden to fishers. Generally
speaking the following parameters are addressed:
physical extension of area, coordinates, depth contours
should restrictions be permanent (long term) or temporal (short term)?
should restrictions apply all year or to specific periods of the year?
should restrictions be gear, fleet or fishery specific?
Making the European Fisheries Ecosystem Plan Operational
MEFEPO

56
Flatfish Beam Trawling
The main target flatfish species are:
Plaice (Pleuronectes platessa)
Minimum landing size of 27cm
Sole (Solea vulgaris)
Minimum landing size of 24 cm
The beam trawl is dragged along the sea floor. Tickler chains are used to disturb
and chase the target species up in the water column, where upon they are
caught in the net. Two groups of beam trawlers are classified:
>300 hp—max. 2000 hp and 2×12 metre beams (excluded from the 12
miles zone and the plaice box)
<300 hp, and 2×4.5 metre beams
Total Landings in the North Sea in 2008
(largest part are landings of the beam trawl):
Plaice 48 875 tonnes
Sole 14 145 tonnes
The average distribution for 1997-2004 of both groups of beam trawlers is shown in the figure opposite. It is con-
centrated in the southern North Sea. The distribution has changed over the years: from the 1970s to 1990s, effort
was concentrated from the coastal and offshore areas of the southern North Sea into coastal areas of Germany
and Denmark, and northern offshore areas of the Doggerbank and the central North Sea. Since the 1990s, effort
has become more concentrated in more southern fishing areas.
The changes reflect a change in the targeting from sole to plaice in the 1970, and back to sole in the 1990s and
seems partially driven by the availability and market prices of both species (Source: Rijnsdorp et al., 2008).

57
Average Beam trawl effort for 1997-2004 based on international data collated within the EU-project MAFCONS (Source:
Greenstreet et al., 2007).
Legend
Effort in hours
0
1 - 250
251 - 500
501 - 1000
1001 - 5000
5001 - 10000
10001 - 25000
25001 - 52652

58
The Dutch beam trawl fleet is one of the major operators in the mixed flatfish fishery in the North Sea. The
Dutch fishery has decreased in recent years. In 2008, a further 23 large Dutch beamtrawers were decommis-
sioned. A part of this decrease
is counteracted by an increase
in technical efficiency of around
1.65% a year (Source: Rijnsdorp
et al., 2008). An other part of
the decrease is compensated by
reflagging Dutch vessels to the
UK. Approximately 85% of
plaice landings from the UK
(England and Scotland) is
landed into the Netherlands by
Dutch vessels fishing on the UK
register.
North Sea Atlas
A cyclical pattern with a period of 6.8 years is visible in the
economic fluctuations of the Dutch beam trawl fishery. The oil
crisis’ around 1974 and 1982 are visible as dips in the profit.
Peaks in profit coincided with the recruitment of exceptionally
strong year classes born in 1963 (sole and plaice), 1985
(plaice), 1987 (sole), 1996 (plaice) and 1997 (sole).
Change in the total capacity of the Dutch fleet (1000 hp) rela-
tive to the previous year and the net result of the fishery
(Source: Rijneveld & de Wilde, 1987; Rijnsdorp et al., 2008).
Plaice Box:
To reduce the discarding of undersize
plaice, an area in the main nursery
area of the species is closed to the
larger beam trawlers (group1). During
1989-1993, the box was closed only
during the second and third quarter,
in 1994 also in the fourth quarter and
since 1995 the whole year round. A
reduced growth rate in plaice and
possibly a higher rate of natural mor-
tality may have counteracted the
reduction in fishing effort (Source:
Pastoors et al., 2000).
Developments in the Dutch fleet of demersal motor trawlers since 1945: num-
ber of vessels (dashed line), total engine power (‘000 hp, heavy line), number
of Euro-cutters (225–300 hp: ◊) and number of large trawlers (~2000 hp: ▲)
(Source: Rijnsdorp et al., 2008).

59
Ecosystem effects of fishing:
As the trawls are dragged along the sea floor, they have a well docu-
mented impact on the animals that live on or in the sea floor. These
include worms, burrowing bivalves and soft corals. These sea floor ani-
mals are often damaged or exposed to predators and scavengers who
feed in the tracks of the trawl immediately after the gear has passed.
Some sea floor animals are more resilient to the effects of fishing than
other though and some even benefit from fishing (e.g. the scavengers).
Landings:
Other landed species are flatfish species e.g. turbot (Psetta maxima), brill (Scophthalmus rhombus), dab (Limanda
limanda) and lemon sole (Microstomus kitt); Roundfish species e.g. cod, haddock, whiting, monkfish (Lophius pis-
catorius), tub gurnard (Trigla lucerna) and sea bass (Dicentrarchus labrax); Skates and rays e.g. thornback ray (Raja
clavata); Molluscs e.g. common whelk (Buccinum undatum) and Crabs e.g. edible crab (Cancer pagurus).
Discarding:
Fish and benthic species of non-commercial interest are
discarded, as well as undersize commercial species.
Discard estimates of undersized plaice in the Dutch
beam trawl were 54% in weight and 82% in numbers, for
sole this was 23% to 29% in numbers and 10% to 13% in
weight (Source: Van Helmond & Van Overzee, 2008).
The overall discard rate is estimated at 71%–95%.
Survival rates of discards were estimated at less then
10% for sole and plaice (Source: Van Beek et al., 1990).
Risks for the beam trawl fishery are high fuel prices, relatively low stock numbers of plaice and sole, pressure
of public opinion and NGOs, mainly owing to the impact on seabed habitat and high discards rates.
A development in the fishery is to change gears and methods, to reduce fuel consumption and lower the im-
pact on the ecosystem:
Outrigging: instead of two beams, using two trawls which are connected to each other.
Fly-shooting: anchor seine fishing in deeper water. An anchor is set with a fishing line, the boat then sails
in a circle while releasing the net and the other fishing line. When returning to the anchor, the second
fishing line is hauled. The flatfish are thereby driven into the net by the fishing lines as they roll along the
sea floor.
Pulse trawling: a beamtrawl, without tickler chains, because an electric pulse is used to scare the fish up.
This reduces impact to the seabed and fuel consumption.
Sumwing: A wing like beam, which fly’s above the seabed. Shoes of the original beam trawl are no longer
needed. This reduces impact to the seabed and fuel consumption
The first two methods are mainly for catching plaice, the other two also catch sole.
Making the European Fisheries Ecosystem Plan Operational
MEFEPO

60
Industrial Sandeel Fishing
The main target species are:
Lesser sandeel (Ammodytes marinus)
Small sandeel (Ammodytes tobianus)
Great sandeel (Hyperoplus lanceolatus)
Smooth sandeel (Gymnammodytes semisquamatus)
The industrial sandeel fishery in the North Sea is
predominantly practiced by Denmark and Norway.
The fishery uses small mesh trawls, with a mesh
size as small as 5mm. Average landings of sandeel
in the North Sea in the last 20 years were 666 000
tonnes and total landings in 2008 were 335 000
tonnes (Source: ICES, 2008a).
The areas in which sandeel fisheries have occurred in recent years are shown in the figure opposite. These areas
are closely related to well-oxygenated bottom substrates consisting of gravel or coarse sand as the sandeel spend
most of the year submerged in ventilated sea beds only to emerge into the water column briefly in the winter
and for an extended period in spring and summer to feed. Sandeels are a non-migratory residential species
associated with a defined habitat , in which the spatial distribution of adults and juveniles overlap.

61
Spatial distribution of sandeel fishing grounds in the North Sea (Source: INEXFISH, 2008).

62
North Sea Atlas
The sandeel fishery is the largest single species fishery in the North Sea. In tonnes, it is the largest segment of
the Danish fisheries (Source: STECF, 2008). Before 2002, the Danish industrial fleet involved fully or partly more
than 300 vessels and involved around 1,000 persons on board the boats. This fleet has changed through time,
with a tendency towards fewer and larger vessels. This change was especially apparent in 2005, when only 98
Danish vessels participated in the fishery, compared to 200 vessels in 2004. The introduction of individual trad-
able quotas (ITQ) accelerated the change towards fewer and larger vessels, and in 2008 only 83 vessels partici-
pated (Source: ICES, 2008a). In 2006 only 6 Norwegian vessels were allowed to participate in an experimental
sandeel fishery in the Norwegian EEZ. In 2007 and 2008, 41 and 42 Norwegian vessels with individual quotas
participated. From 2002 to 2008 the average gross registered tonnage per trip in the Norwegian fleet increased
from 269 to 507t. Since 1998 only 7 of the Norwegian vessels remained unaltered, all others were extended or a
larger engine was installed.
Recruitment failure:
The number of young sandeels settling in 2002 was a historically low. Subsequently, the spawning
stock biomass fell to a critically low level. It has been suggested that early egg production in the
planktonic copepod Calanus finmarchicus, a principle food item for juvenile sandeels, is critical to the
survival of sandeel larvae,
and that climate-
generated shifts in the
distribution and breeding
of Calanus has lead to a
mismatch in timing
between food availability
and the early life
history of lesser sandeels
(Source: Van Deurs et al.,
2009). This may be a key
contributing factor to the
decline in sandeel
biomass. Year
Rec
ruit
men
t o
f sa
nd
eels
at
age
0 (
bill
ion
s)
Sandeels in the
North Sea: Total
international fishing
effort and Catch per
unit of effort
(CPUE). Values for
2007 only represent
first half of year.

63
Landings of the industrial fish-
ery are reduced to extract
meal and oil that are princi-
pally used as aquaculture feed
but also to feed animals in
agriculture. Some oil is added
to human food such as bis-
cuits and margarine.
By-catch
The sandeel fishery is generally considered a “clean” fishery with little
by-catch. If there is by-catch, the undersized and non-consumption spe-
cies are landed for reduction purposes, while some human consump-
tion species are landed as such. A concern is that the by-catch of under-
sized human consumption species leads to a decrease in later catches
of the consumption species.
Management — Area closures:
Removal of sandeels may potentially cause food
deprivation for predators such as larger fish, sea-
birds and marine mammals. To preserve enough
sandeel for coastal breeding populations of birds,
all commercial fishing in the Firth of Forth area
has been prohibited since 2000, except for a
maximum of 10 boat days in each of May and
June for stock monitoring purposes. The closure
was maintained for three years and was ex-
tended to 2009. There is presently no decision on
whether a full commercial sandeel fishery will be
reopened in the Firth of Forth area.
Time closures
The sandeel fishery is a seasonal fishery. Since
2005, Danish vessels have not been allowed to
fish sandeels before 31st of March. Fishing with
trawler gear with a mesh size <16mm is prohib-
ited from the 1st of August until the end of the
year.
Within the allowed period for sandeel fishing,
the Danish and the Norwegians have closed the
fisheries in recent years. Denmark closed the
fishery from 16th of May to 8th of June 2007 and
Norway from 6th of May to 16th of May.
Effort management
An effort management regime was introduced by the Fisheries Council in 2004. The level of fishing effort
allowed is determined by the strength of incoming sandeel recruitment (as measured by sampling in win-
ter-spring), replacing the previous blanket TAC approach. In the worst case scenario (at lowest recruit-
ment) effort can be zero.
Making the European Fisheries Ecosystem Plan Operational
MEFEPO

64
Herring Fishing
The main target species is:
Herring (Clupea harengus)
Minimum landing size of 20 cm
Herring fisheries take place with pelagic trawls catching
shoals of the target species. The shoals are located with
the use of echo-sounding equipment. The echogram pro-
vides information on the location, size and position of a
shoal in the water column, which makes this fishery very
efficient in targeting fish. Theoretically, the use of echo-
sounding equipment should result in low by-catch.
Landings:
Official catches of North Sea
herring for human consump-
tion were 219 100 tonnes in
2008.
Distribution of the fishery
Landings data of herring for the years 2000 to 2004 are presented in the figure opposite. Most of the landings are
from the Northern North Sea. The stock is fished throughout the year, with peak catches between October and
March. Landings of herring in the autumn are predominantly from off Orkney and Shetland , Buchan, off Peter-
head, northwest of the Dogger Bank and from the coastal waters of eastern England. Landings in the spring are
concentrated off the Lincolnshire and East Anglia coasts in the south-western North Sea. During the summer and
early autumn, landings are greatest in the north-western North Sea, around Shetland and Orkney, and in the
western central North Sea (Source: ICES fishmap).

65
Herring landings 2000 to 2004 redrawn from WGECO 2006 database collated and provided by the STECF subgroup STGST-
Cod Recovery Plan (Source: STECF, 2005).
Legend
landings in tonnes
0.0
0.0 - 4.0
4.0 - 15.0
15.0 - 60.0
60.0 - 250.0
250.0 - 900.0
900.0 - 3000.0
3000.0 - 12307.578

66
North Sea Atlas
Stocks
The North Sea herring is not a single stock; it consists of multiple sub-populations. The main sub-populations are
the autumn spawners which spawn along the English and Scottish Coast. Another sub-population, the Downs her-
ring, spawns in winter in the Channel. There is also a spring spawning sub-population that occurs mainly inshore.
Besides these sub-populations, Atlanto-Scandic herring and Skagerrak/Baltic herring can also be caught in the
North Sea in smaller numbers.
Population development
The North Sea herring stock collapsed in
the mid 1970s, and the fishery was closed
in 1977. It reopened in 1981 and since
then a yearly TAC is determined based on
ICES advise.
Low recruitment
In the last years the recruitment of North Sea herring (year classes 2002‐
2006) has been below average. The estimates of the 2008 assessment
indicate a very small 2007 year class.
Time series of Recruitment of North Sea herring (Source: ICES, 2008b).
0
1
2
3
4
5
1960 1970 1980 1990 2000 2010
Bio
mas
s (1
06
ton
ne
s)
Year
Time series of Spawning stock biomass of North Sea herring
(solid line) and total biomass (dotted line) (Source: ICES 2008b).

67
Management:
A clear management plan is defined for North Sea herring, which is agreed upon by most of the scientific,
governmental and fisheries community. The plan, agreed between the EU and Norway, was adopted in
December 1997 and last amended in November 2007. It states that effort should be made to maintain the
spawning stock biomass (SSB) of North Sea Autumn Spawning herring above 800 000 tonnes. Above 1.5
million tonnes, the TAC will be based on a fishing mortality of 0.25 for adult and 0.05 for juvenile herring.
When SSB falls below 1.5 million, the fishing mortality will have to be linearly reduced. As long as SSB is
above 800 000 tonnes, a TAC deviation of more than 15% between two subsequent years should be
avoided, however, the TAC might be reduced by more than 15% if the parties consider this appropriate.
Habitat:
Herring lay their eggs in dense beds on the sea bed
and need specific, gravely substrates to spawn. This
makes herring particularly susceptible to anthropo-
genic activities affecting the sea bed such as off-
shore oil and gas industries, gravel extraction and
eutrophication causing oxygen depletion.
Marine Stewardship Council:
A large number of the companies fishing for North Sea Herring have been given the
Marine Stewardship Council (MSC) certificate. The MSC certification process
recognizes and rewards willingness to fish sustainable and certified fisheries are
subject to a rigorous assessment against standardised principles and criteria.
It is however a commercial initiative and benefits certified fisheries through higher
prices and a larger market.
Economics :
The EU as a whole is a net-exporter of herring, which is a relatively
cheap product (AER 2008). The low value per weight is counteracted
by the large amounts landed. The Dutch herring-processing industry
consists of approximately 15 companies with an industry turnover of
€115 million. The industry turnover has remained virtually the same
since 2000, but it fell in real terms due to general inflation over this
period (14%), (Source: Productschap vis, 2008).
Making the European Fisheries Ecosystem Plan Operational
MEFEPO

68
Mixed white fish demersal trawling
The whitefish trawl fishery mainly uses otter trawls, these are
large roughly cone shaped nets. The mouth of the net is held
open by the ‘otter boards’ as the net is pulled through the wa-
ter. Weighted bobbins along the footrope keep the bottom of
the mouth in contact with the sea floor and floats along the
headrope hold the top of the mouth open. Rockhopper trawls
are specially adapted to work on rough ground. The distance
between otter boards is between 60-120 metres and the whole
under-surface of the net may come into contact with the sub-
strate. The main mesh size in the whitefish fishery is ≥120 mm.
Distribution of the fishery:
Effort distribution of the otter trawl targeting whitefish for the years 1997 to 2004 is presented in the figure oppo-
site. Most of the landings are taken from the Northern North Sea. The fishery with ≥120 mm mesh is dominated
by UK, Danish and German vessels. Smaller segments of the fishery include a 70-79 mm French whiting fishery in
the Eastern Channel, extending into the southern North Sea and a 90-99 mm Danish and Swedish fishery centred
in the Skagerrak, extending into the eastern North Sea.
Demersal fish are those that live close
to the sea floor and include species
such as cod and haddock.
The otter trawl fishery catches the
largest number and weight of cod in
the North Sea.
There are two sectors within the
North Sea otter trawl fishery, the
large mesh and small mesh fleets. The
large mesh fleets targets whitefish,
the small mesh fleet targets Nephrops
but also takes whitefish as a bycatch.
Different regulations cover the differ-
ent sectors of the fishery.

69
Average Otter trawl effort on fish for 1997-2004 based on international data collated within the EU-project MAFCONS
(Source: Greenstreet et al., 2007).
Legend
Effort in hours
0
1 - 250
251 - 500
501 - 1000
1001 - 5000
5001 - 10000
10001 - 25000
25001 - 52652

70
North Sea Atlas
2007 catches (tonnes) of the main species by all otter trawls
>100mm mesh for the North Sea, eastern Channel and Skagerrak
(ICES areas IIIA, IV and VIId) (Source: STCEF)
0
20000
40000
60000
80000
100000
120000
The whitefish fishery has the highest impact in terms of both
weight and numbers of cod removed in the North Sea (Source:
STECF, 2008). Based on the most recent estimate of SSB (in 2008)
and fishing mortality (in 2007), ICES classifies the cod stock as suf-
fering reduced reproductive capacity and as being harvested unsus-
tainably. The general perception of cod abundance remains un-
changed, with a historical low in 2006. SSB has shown an increase
since then but remains below Blim.
The main species taken by the North Sea large mesh (>100 mm)
otter trawl fleet are:
Anglerfish Lophius species
Cod Gadus morhua
Saithe Pollachius virens
Haddock Melanogrammus aeglefinus
Whiting Merlangius merlangus
Plaice Pleuronectes platessa
Haddock, whiting and Nephrops are predominantly taken by the
UK otter trawl fleet. Saithe is mainly caught by the Norwegian
fleet. No single nation dominates the cod catch.

71
Cod Recovery Plan
The North Sea cod stock has been declining since the early 1970s (see figure below). Since the mid 1980s the cod stock has been below the precautionary limit set by ICES scientists. Below this limit, it is expected that the North Sea cod stock suffers from reduced reproductive output.
The stock dropped to such a low level that in 2001, for the first time, the official ICES advice was for there to be no catch of cod in the following year. The Cod Recovery Plan was developed in response to the de-clining cod stocks and first introduced in 2002. The Cod Recovery Plan has been modified since its initial inception and a ‘new’ version was introduced from 1st January 2009.
The Cod Recovery Plan for the North Sea cod stock covers the greater North Sea, eastern Channel and Skagerrak (ICES areas IIIa, IV and VIId). The objective of Cod Recovery Plan is for the North Sea cod spawning stock to reach the precautionary limit of 150 000t. The Cod Recovery Plan regulates total ef-fort, days at sea and the gears used. Additional days at sea can be gained by engaging in cod avoidance activities, this includes gear modifications and avoid areas with high concentrations of young cod. Fishing mortality applied to cod has been declining since the introduction of the plan, and there are in-
creasing numbers of juvenile cod, but the increase in juveniles has yet to show up in the adult numbers.
Spawning stock size and fishing mortality applied to North Sea cod. (Source: EC Fisheries, 2009)
Making the European Fisheries Ecosystem Plan Operational
MEFEPO

72
Nephrops / Prawn Fishing
Crown Copyright
Discards:
Trawling for Nephrops results in
bycatch and discards of other
species, including cod, haddock,
and whiting. The energy
available from discards could
potentially provide scavengers
on the fishing grounds with 37%
of their energetic requirements.
This is probably sufficient to
allow larger populations of these
scavengers to exist than would
otherwise be possible (Source:
Catchpole et al., 2006).
Initiatives are in place to reduce
the discard problem, for example
by including the use of 110 mm
square mesh panels in 80 mm
gear, allowing small fish to
escape.
The Nephrops fishery utilises mainly demersal trawls with
a mesh size of 70-99mm. Other mesh sizes are also used
and different rules apply to different net constructions in
different Economic zones.
The crustacean Nephrops (Nephrops norvegicus). Minimum landing size
varies according to the area in which they are caught.

73
Average Otter trawl effort on Nephrops for 1997-2004 based on International data collated within the EU-project (Source:
Greenstreet et al., 2007).
Legend
Effort in hours
0
1 - 250
251 - 500
501 - 1000
1001 - 5000
5001 - 10000
10001 - 25000
25001 - 52652
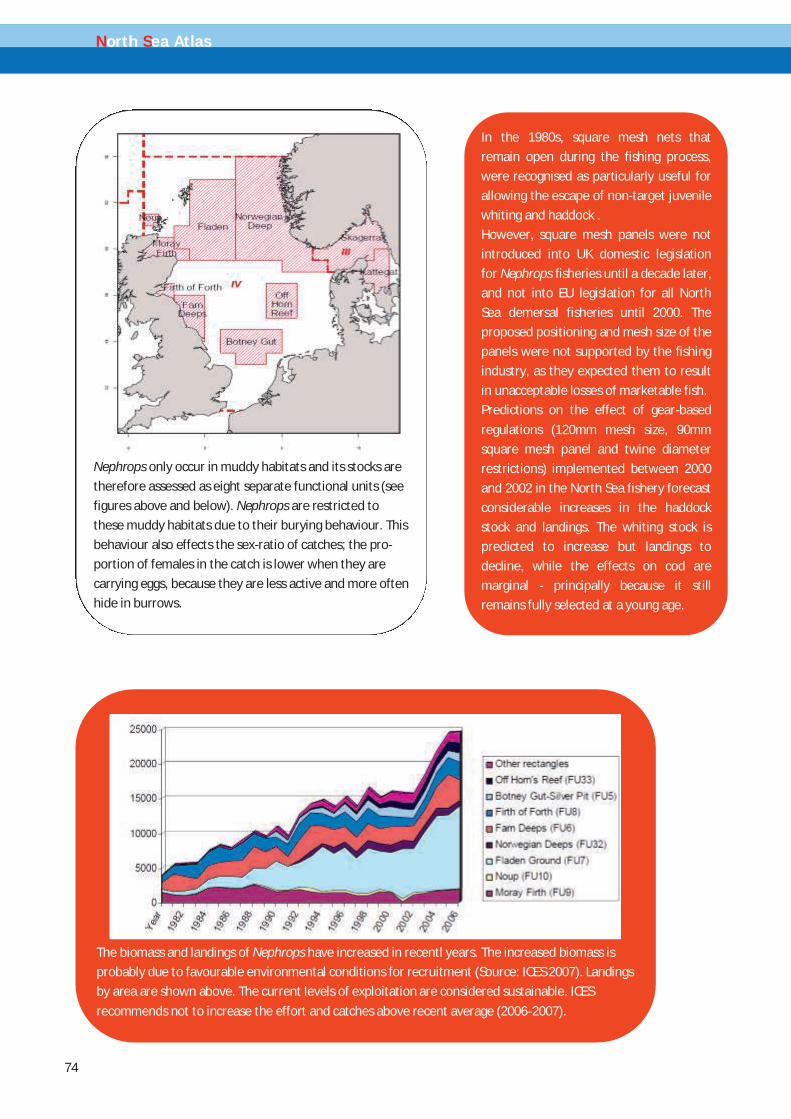
74
North Sea Atlas
The biomass and landings of Nephrops have increased in recentl years. The increased biomass is
probably due to favourable environmental conditions for recruitment (Source: ICES 2007). Landings
by area are shown above. The current levels of exploitation are considered sustainable. ICES
recommends not to increase the effort and catches above recent average (2006-2007).
Nephrops only occur in muddy habitats and its stocks are
therefore assessed as eight separate functional units (see
figures above and below). Nephrops are restricted to
these muddy habitats due to their burying behaviour. This
behaviour also effects the sex-ratio of catches; the pro-
portion of females in the catch is lower when they are
carrying eggs, because they are less active and more often
hide in burrows.
In the 1980s, square mesh nets that
remain open during the fishing process,
were recognised as particularly useful for
allowing the escape of non-target juvenile
whiting and haddock .
However, square mesh panels were not
introduced into UK domestic legislation
for Nephrops fisheries until a decade later,
and not into EU legislation for all North
Sea demersal fisheries until 2000. The
proposed positioning and mesh size of the
panels were not supported by the fishing
industry, as they expected them to result
in unacceptable losses of marketable fish.
Predictions on the effect of gear-based
regulations (120mm mesh size, 90mm
square mesh panel and twine diameter
restrictions) implemented between 2000
and 2002 in the North Sea fishery forecast
considerable increases in the haddock
stock and landings. The whiting stock is
predicted to increase but landings to
decline, while the effects on cod are
marginal - principally because it still
remains fully selected at a young age.

75
North Sea Ecosystem Overview
Physics
Bathymetry
The North Sea is a shallow sea on the European continental shelf connected to the Atlantic Ocean in the north and the English Channel in the south west. Mostly less than 50m deep although deepest areas reach 200m.
Circulation
Water enters from the North Atlantic into the northern North Sea and from the English Channel in the southern basin and leaves via the Norwegian coastal current. The main flow is thus anti-clockwise but with a number of branches from the main currents.
Temperature
Surface temperatures increased by around 0.5 to 1.0 °C above the long term mean at the end of the 1980s, after which temperatures stayed high. Winter bottom temperature has increased by 1·6 °C over the last 25 years, with a 1 °C increase in 1988-1989 alone. Climate change is affecting the distri-
Salinity
Salinity is influenced by freshwater inputs from major European rivers and seasonal inputs in the north-east due to the spring melt of freshwater ice. In coastal areas away from these influences the salinity is typically between 32 and 34.5.
Nutrients
Nutrient levels in the North Sea and Baltic have increased as a result of human activity; both nitrate and phosphate are elevated but nitrate has increased proportionally more. As nitrate is generally the limiting plant nutrient in marine waters, this implies a potential change in the ecology of the system
Biology
Plankton
Phytoplankton abundance has increased generally in the north-western and eastern North Sea whilst diatoms and dinoflagellates have decreased in these regions and increased in the north-eastern North Sea. Overall in the north-eastern Atlantic there has been a 10 degree of latitude shift north-ward in zooplankton species distributions, with southern species extending further north and north-erly species retreating.
Benthos, larger invertebrate, biogenic habi-tats
The main benthic organisms are various species of marine bristle worms (Polychaetes), burrowing clams (bivalve molluscs), sand shrimps (amphipods), sea urchins and brittlestars. Various species of mobile scavengers, such as crabs, starfish and fish, range across the various habitats. The dominant habitats are comprised of sediment, muds in deeper waters, and sandier sediments in shallow areas but there are significant areas of gravels deposits.
Fish Community
Over 230 species of fish occur in the North Sea, of which 11 are the main targets of fisheries for hu-man consumption and three are targets of industrial fisheries. The fish community is under pressure from these fisheries and climate change. Despite these pressures, no extinctions have occurred in recent years and diversity has actually increased due to species extending their ranges from southern or Atlantic waters.
Birds, Mammals
Over ten species of whales and dolphins are regularly sighted in the North Sea. Although they were once subject to extensive commercial hunting, only a few countries, including Norway and Iceland, still hunt whales. In most regions these species have become the subject of a growing eco-tourism industry. The harbour seal and the grey seal both breed within the North Sea. Harbour seals occur throughout the North Sea, whereas grey seals almost exclusively occur around northern Britain.
Approximately 2.5 million pairs of sea birds, from 28 different species, breed on coasts in the region. Several years of the poorest breeding success on record have occurred since 2003. It is thought that climate change could cause long term effects on the distribution and abundance of seabirds around the North Sea through impacts on seabird ecology and in particular effects on the food resources of seabirds. Increases in large scavenging seabirds due to increased availability of fisheries discards sometimes cause reductions in smaller seabirds breeding in the same area through competition for nesting sites or direct predation.
Environmental signals & implications
There has been steady warming of sea surface and bottom temperatures in the North Sea. There has also been a northward shift in the distribution of some fish such as an increase of red mullet (Mullus surmuletus) populations around British coasts. Climate-generated shifts in the distribution and breed-ing of a planktonic copepod may have lead to a mismatch in timing between food availability and the early life history of lesser sandeels, which may be a key contributing factor to a decline in sandeel biomass.
Fishery effects on benthos and fish communi-ties
Fisheries remove biomass from the North Sea food web from human consumption and non-consumptive use, In addition, demersal gears capture a range of other species which are discarded, this is often a significant proportion of their catch. The discards change pathways in the food web as they are beneficial for scavengers (such as crabs and some seabirds) but available food for fish preda-tors is decreased, (e.g. the effect of sandeel catch on food availability for Black-legged kittiwakes and harbour porpoise). Besides the effects on biological components, demersal gears also affect the sea-bed habitats and seabed structures.
Making the European Fisheries Ecosystem Plan Operational
MEFEPO

76
North Sea Atlas
Glossary
Benthic Related to the bottom of the sea or to the organisms that live on it, including the surface sediment and the first sub-surface layers
Demersal Dwelling at or near the bottom of the sea or other body of water
Intertidal (zone) Coastal area exposed to the air at low tide and submerged at high tide
North Atlantic Oscillation A large scale fluctuation in atmospheric pressure between the subtropical (Azores) high and the polar (Icelandic) low
Osmosregulation The control of the levels of water and mineral salts in the blood
Pelagic Related to or inhabiting that region of the sea which consists of open water of any depth, independent of both the shore and the sea floor
Stratified Arranged in layers or strata
Acoustic surveys Acoustic surveys use sound waves emitted from a "transducer" to estimate the density of plankton and fish shoals. The survey vessel tows the transducer under water, which is linked to an echo sounder in the vessel which records the shoals of fish as "marks" on a screen or paper trace. The density of these marks is used to calculate total biomass of a stock.
Biomass Measure of the quantity, usually by weight in metric tons (2,205 pounds = 1 metric ton), of a stock at a given time.
Bycatch Refers to discarded catch (see Discards) plus incidental catch not purposely targeted by the fishermen.
CPUE /Catch Per Unit of Effort The catch of fish, in numbers or in weight, taken by a defined unit of fishing effort. Also called catch per effort, fishing success, or availability.
Discard Discards are defined as that part of the catch returned to the sea as a result of economic, legal or other considerations.
Discard rate The percentage (or proportion) of the total catch which is discarded.
Ecosystems are composed of living animals, plants and non living structures that exist together and ‘interact’ with each other. Ecosystems can be very small (the area around a boulder), they can be medium sized (the area around a coral reef) or they can be very large (the Irish Sea or even the eastern Atlantic).
Elasmobranchs Fish, such as skates, rays, sharks and dogfish, whose skeletons are cartilagenous rather than boney (as in the teleost species such as cod, whiting, plaice and herring).
Emergency Measures Measures adopted by the EU prior to the introduction of cod and hake as part of the recovery plan.
Exploitation rate The proportion of a population at the beginning of a given time period that is caught during that time period (usually expressed on a yearly basis). For example, if 720,000 fish were caught during the year from a population of 1 million fish alive at the beginning of the year, the annual exploitation rate would be 0.72.
Fishing Effort The total fishing gear in use for a specified period of time. When two or more kinds of gear are used, they must be adjusted to some standard type
Fishing Mortality Deaths in a fish stock caused by fishing.
Gadoids An important family of food fish, including cod, haddock, rocklings, hake, whiting, blue whiting and ling. Usually characterised by the presence of a barbel on the chin.
Fleet A physical group of vessels sharing similar characteristics in terms of technical features and/or major activity (e.g. the Irish beam trawler fleet < 300 hp, regardless of which species or species groups they are targeting).
Fishery Group of vessel voyages targeting the same (assemblage of) species and/or stocks, using similar gear, dur-ing the same period of the year and within the same area (e.g. the Irish flatfish-directed beam trawl fishery in the Irish Sea).
ICES International Council for the Exploration of the Seas –Ireland shares the Total Allowable Catches TACs for many stocks we exploit with our European Union partners. Because of this international dimension many stocks need to be assessed in an international fora such as ICES. (see: http://www.ices.dk/)
Inshore fisheries There are various definitions of inshore fisheries including those fisheries that are conducted within 12 miles of the shore, including demersal, pelagic, shellfish and sea angling fisheries.
Management Plan An agreed plan to mange a stock. With defined objectives, implementation measures, review processes and stakeholder agreement and involvement.
MPA / Marine Protected Area A conservation area in the sea usually designated for the protection and mainte-nance of biological diversity and natural and cultural resources.
77
Natural Mortality Deaths in a fish stock caused by predation, illness, pollution, old age, etc., but not fishing.
OSPAR The Oslo and Paris Commissions, which have the objective of protecting the Northeast Atlantic against pollu-tion. Member countries range from Finland to Portugal and Iceland.
Quota A portion of a total allowable catch (TAC) allocated to an operating unit, such as a Vessel class or size, or a country.
Recovery Plan This is a multi-annual plan to recover seriously depleted stock. The plans general involve agreed Har-vest control Rules, Technical Measures, effort controls and various control and enforcement measures.
Recruitment The amount of fish added to the exploitable stock each year due to growth and/or migration into the fishing area. For example, the number of fish that grow to become vulnerable to the fishing gear in one year would be the recruitment to the fishable population that year. This term is also used in referring to the number of fish from a year class reaching a certain age. For example, all fish reaching their second year would be age 2 recruits.
Relative Abundance An estimate of absolute abundance; usually stated as some kind of index; for example, the average catch per tow on a survey.
SACs Special Areas of Conservation, sites designated under the European Community Habitats Directive, to protect internationally important natural habitats and species.
Sample A proportion or a segment of a fish stock or other population which is removed for study, and is assumed to be representative of the whole. The greater the size of the samples, the greater the confidence that the infor-mation obtained is a true reflection of the status of a stock.
STECF The Scientific Technical and Economic Committee on Fisheries. Established by the European Commission and comprises fisheries scientists and economists from the member states. The role of STECF is to advise the Euro-pean Commission on scientific, technical and economic issues related to the management of fisheries resources that are exploited worldwide by members of the European Union.
Stock A "stock" is a population of a species living in a defined geographical area with similar biological parameters (e.g. growth, size at maturity, fecundity etc.) and a shared mortality rate. A thorough understanding of the fish-eries biology of any species is needed to define these biological parameters.
SSB / Spawning Stock Biomass The total weight of all sexually mature fish in the population. The size of SSB for a stock depends on abundance of year classes, the exploitation pattern, the rate of growth, fishing and natural mortality rates, the onset of sexual maturity and environmental conditions.
Sustainable yield The number or weight of fish in a stock that can be taken by fishing without reducing the stock biomass from year to year, assuming that environmental conditions remain the same.
TAC / Total Allowable Catch The total regulated catch from a stock in a given time period, usually a year.
Whitefish Term used to describe demersal species such as cod, plaice, ray etc., as opposed to pelagic or salmonid species.
Year class (or cohort) Fish in a stock born in the same year. For example, the 1987 year class of cod includes all cod born in 1987, which would be age 1 in 1988. Occasionally, a stock produces a very small or very large year class which can be pivotal in determining stock abundance in later years.
Acknowledgements
We are grateful to Ellen Kenchington, Euan Dunn, Benoît Guerin, Peter Gullestad and Sean O'Donoghue for very
useful comments on an earlier version of the Atlas.
As stated in the introduction, much of the material used in the Atlas is sourced from published material from
the International Council for the Exploration of the Seas (ICES) and the Oslo Paris Commission (OSPAR). We
acknowledge this input as the work of an extensive scientific community.
Every effort has been made to ensure the accuracy of the information contained in this atlas. We have
attempted to contact the copyright holders for all the information in this document. However, if you are the
copyright holder of information for which we have inadvertently failed to acknowledge you, please contact us
([email protected]) so that we may correct this in future publications.
Making the European Fisheries Ecosystem Plan Operational
MEFEPO

78
North Sea Atlas
References Augris, C., Clabaut, P. & Tessier, B. (1995) Le domaine marin côtier du Nord-Pas de Calais: Carte des formations super-ficielles au 1:100,000. IFREMER/Région Nord-Pas de Calais/Université de Lille I.
Beare, D.J., Batten, S., Edwards, M. And Reid, D.G (2002) Prevalence of boreal Atlantic, temperate Atlantic and neritic zooplankton in the North Sea between 1958 and 1998 in relation to temperature, salinity, stratification inten-sity and Atlantic inflow. Journal of Sea Research 48, 29– 49.
Beaugrand, G., Reid, P.C., Ibañez, F. and Planque, B. (2000) Biodiversity of North Atlantic and North Sea calanoid copepods. Marine Ecology Progress Series 204, 299-303.
Brockmann, U., Billen, G. & Gieskes, W. W. C. (1988) ‘North Sea nutrients and eutrophication’ in Salomons, W., Bayne, B. L., Duursma, E.K. & Förstner, U. Pollution of the North Sea: an assessment. Springer-Verlag, Berlin. pp. 348-389
BSH 2008 http://www.bsh.de/de/Meeresdaten/Beobachtungen/Meeresoberflaechentemperatur/anom.jsp#SSTM Date accessed 17th July 2009.
Carpentier, A. E. A. (2008) Eastern Channel Habitat Atlas for Marine Resource Management (CHARM 2). INTERREG IIIa, in prep. http://charm.canterbury.ac.uk/.
Dickson, R. R., Meincke, J., Malmberg, S.-A. & Lee, A. J. (1988) The "great salinity anomaly" in the Northern North Atlantic 1968-1982. Progress In Oceanography, 20, 103-151.
Duineveld, G. C. A., Künitzer, A., Niermann, U., de Wilde, P. A. W. J. & Gray, J. S. (1991) The macrobenthos of the North Sea. Netherlands Journal of Sea Research, 28, 53-65.
Duphorn, K., Grahle, H. O., Schneider, H. & (Eds.) (1970) International Quaternary Map of Europe, Sheet 6, scale 1:2 500 000, Hannover, Bundesanstalt für Bodenforschung and UNESCO, INQUA-Commission for the International Qua-ternary Map of Europe.
EC Fisheries (2009) http://ec.europa.eu/fisheries/press_corner/press_releases/graphs_07_88_en.pdf Date accessed 31st July 2009.
EEA 2009 http://dataservice.eea.europa.eu/atlas/viewdata/viewpub.asp?id=677 Date accessed 17th July 2009.
EIONET 2009 http://biodiversity.eionet.europa.eu/activities/Natura_2000/Natura_2000_network_Dec_2008_300dpi.jpg Date accessed 17th July 2009.
EWEA - European Wind Energy Association. http://www.ewea.org/
Figge, K. (1981) Karte der Sedimentverteilung in der Deutschen Bucht. Begleitheft zu BSH(Bundesamt fur Seeschiffahrt und Hydrographe) Karte Nr. 2900.
Furness, R.W. (2007) Responses of seabirds to depletion of food fish stocks. Journal of Ornithology 148, S247-S252
Greenstreet, S. P. R., Robinson, L. A., Piet, G. J., Craeymeersch, J., Callaway, R., Reiss, H., & Ehrich, S. (2007) The eco-logical disturbance caused by fishing in the North Sea. FRS Collaborative Report, 04/07. 169 pp.
Hertel, O., Ambelas Skjøth, C., Frohn, L.M., Vignati, E., Frydendall, J., De Leeuw, G., Schwarz, U., Reis, S. (2002) As-sessment of the atmospheric nitrogen and sulphur inputs into the North Sea using a Lagrangian model. Physics and Chemistry of the Earth 27, 1507-1515
ICES (1999) Diets of seabirds and consequences of changes in food supply. ICES Cooperative Research report 232. ICES, Copenhagen. pp66.
ICES (2007) Report of the Working Group on the Assessment of Demersal Stocks in the North Sea and Skagerrak (WGNSSK). pp.
ICES (2008a) Report of the Working Group on Ecosystem Effects of Fishing Activities (WGECO), May 6-13 2008, Co-penhagen, Denmark. ICES CM 2008/ACOM:41. 269
ICES (2008b) Report of the Herring Assessment Working Group South of 62 N (HAWG), 11-19 March 2008, ICES Head-quarters, Copenhagen. ICES CM 2008/ACOM:02.
ICES-FishMap. http://www.ices.dk/marineworld/ices-fishmap.asp
INEXFISH (2008) North Atlantic Case Study, A spatially and temporally explicit analysis of beam-trawling on sandeel fishing grounds in the North Sea. WP 3 Annexes 1 Proposal/Contract no.: FP6- 022710 Incorporating extrinsic drivers into fisheries management.

79
JNCC 2009 http://images.google.nl/imgres?imgurl=http://www.jncc.gov.uk/images/figure_1a.jpg&imgrefurl=http://www.jncc.gov.uk/page-2118&usg=__fIj6vh-NZJTsRog-D0-jy0L1MhA=&h=594&w=600&sz=62&hl=nl&start=2&um=1&tbnid=eFi2IWO8oPAMNM:&tbnh=134&tbnw=135&prev=/images%3Fq%3Dmarine%2Blandscape%2Bfeatures%2Bin%2BUK%2Bseas%26hl%3Dnl%26um%3D1 Date accessed 17th July 2009.
Kunitzer, A., Basford, D., Craeymeersch, J. A., Dewarumez, J. M., Dorjes, J., Duineveld, G. C. A., Eleftheriou, A., Heip, C., Herman, P., Kingston, P., Niermann, U., Rachor, E., Rumohr, H. & Dewilde, P. A. J. (1992) The Benthic Infauna of the North-Sea - Species Distribution and Assemblages. ICES Journal of Marine Science, 49, 127-143.
Larsonneur, C., P. , Bouysse, P. & Auffret, J. P. (1982) The superficial sediment of the English Channel and its western approaches. Sedimentology. Sedimentology, 29, 851-864.
Leterme, S.C. and Pingree, R.D. (2008) The Gulf Stream, rings and North Atlantic eddy structures from remote sensing (Altimeter and SeaWiFS). Journal of Marine Systems 69, 177-190.
Leterme, S.C., Pingree, R.D., Skogen, M.D., Seuront, L., Reid, P.C., Attril, M.J. (2008) Decadal fluctuations in North Atlantic water inflow in the North Sea between 1958-2003: Impacts on temperature and phytoplankton populations. Oceanologia, 50, 59-72
MESH 2009a http://www.searchmesh.org/PDF/GMHM4_Dutch_Marine_landscape_Map.pdf Date accessed 17th July 2009.
MESH 2009b http://www.searchmesh.net/pdf/Ugent_Belgian_marine_landscape.pdf Date accessed 17th July 2009.
Pastoors, M. A., Rijnsdorp, A. D. & Van Beek , F. A. (2000) Effects of a partially closed area in the North Sea ("plaice box") on the stock development of plaice. ICES Journal of Marine Science, 57, 1014-1022.
Productschap Vis. http://www.pvis.nl/
Rees, H. L., Eggleton, J. D., Rachor, E., Vanden Berghe, E. & (ed.) (2007) Structure and dynamics of the North Sea ben-thos. ICES Cooperative Research Report, 288. ICES: Copenhagen, Denmark. ISBN 87-7482-058-3. 258 + annexes.
Reid, P.C., Planque, B. and Edwards, M. (1998) Is observed variability in the long-term results of the Continuous Plankton Recorder survey a response to climate change? Fisheries Oceanography 7, 282-288.
Rijnsdorp, A. D., Poos, J. J., Quirijns, F. J., Hille Ris Lambers, R., de Wilde, J. W. & den Heijer, W. M. (2008) The arms race between fishers. Journal of Sea Research, 60, 126-138.
Skjoldal, H. R. (Ed.) (2007) ICES/EuroGOOS North Sea Pilot Project – NORSEPP, Update report on North Sea conditions - 2nd quarter 2007. Institute of Marine Research Bergen, Norway
STECF (2005) Report of the first and fourth meetings of the subgroup on review of stocks. (SGRST-05-01 and SGRST-05-04) of the Scientific, Technical and Economic Committee for Fisheries (STECF). Evaluation of the cod recovery plan. Ispra, 13-17 June and 19-21 September 2005 http://stecf.jrc.cec.eu.int/events_list.php?sg=&y=2005&pl=1&o=ASC
STECF (2008) Preparation of annual economic report (SGECA 08-02),COPENHAGEN, 21-25 APRIL 2008.
STECF (2008b) Preparation of annual economic report (SGECA 08-02),COPENHAGEN, 21-25 APRIL 2008.
Tasker, M. L. & (Ed.) (2008) The effect of climate change on the distribution and abundance of marine species in the OSPAR Maritime Area. ICES Cooperative Research Report 293. 45pp.
Trilateral Seal Expert Group (2008) Aerial Surveys of Harbour Seals in the Wadden Sea in 2008:Back to Pre-epizootic Level, and Still Growing: Wadden Sea Harbour Seal Population in 2008. http://www.waddensea-secretariat.org/news/news/Seals/Annual-reports/seals2008.html.
Turrell, W. R. (1992) New hypotheses concerning the circulation of the northern North-Sea and its relation to North-Sea fish stock recruitment. ICES Journal of Marine Science, 49, 107-123.
UNEP/GRID United Nations Environment Programme http://www.grida.no/
Van Beek, F. A., Van Leeuwen, P. I. & Rijnsdorp, A. D. (1990) On the survival of plaice and sole discards in the otter-trawl and beam-trawl fisheries in the North Sea. Netherlands Journal of Sea Research, 26, 151-160.
Van Deurs, M., Van Hal, R., Tomczak, M. T., Jónasdóttir, S. H. & Dolmer, P. (2009) Recruitment of lesser sandeel Am-modytes marinus in relation to density dependence and zooplankton composition. Marine Ecology Progress Series, 381, 10.3354/meps07960 249-258.
Van Helmond, A. T. M. & Van Overzee, H. M. J. (2008) Discard sampling of the Dutch beam trawl fleet in 2007. CVO Report 08.008.
Making the European Fisheries Ecosystem Plan Operational
MEFEPO

80
MEFEPO Making the European Fisheries Ecosystem Plan Operational
For further information about the project, please visit our website:
www.liv.ac.uk/marinebiology/mefepo.html
Or email:
This study has been carried out with financial support from the Commission of the European
Communities (FP7-KBBE-2007-1 project no. 212881). It does not necessarily reflect its views
and in no way anticipates the Commission’s future policy in this area.
MEFEPO Partners