Embed Size (px)
Citation preview

Technical Advisory Committee Meeting
Gene Yagow
Virginia Tech, Biological Systems Engineering Department
May 20, 2015
North Fork Catoctin Creek Data for the Benthic Stressor Analysis
1

2 NF Catoctin Creek Monitoring Stations
Upper NFC: 2.55-mile segment
Lower NFC: 4.43-mile segment
0
10
20
30
40
50
60
70
80
90
100
Jan-06 Jan-08 Jan-10 Jan-12 Jan-14 Jan-16
Vir
gin
ia S
CI
1ANOC000.42 1ANOC004.38 1ANOC009.37
Basis for Impairment
VSCI = Virginia Stream Condition Index
5
Healthy
Impaired

VSCI Metrics – Upper NFC 6
StationID
Collection Date
05
/06
/10
11
/02
/10
10
/05
/11
11
/12
/14
FamTotTaxa 13 16 8 14
FamEPTTax 9 7 5 6
%Ephem 35.9 15.1 46.4 25.5
%PT - Hydropsychidae 34.9 17.9 12.7 10
Fam%Scrap 15.1 11.3 10.9 21.8
%Chiro 12.3 21.7 0.0 13.6
Fam%2Dom 36.8 37.7 73.6 47.3
FamHBI 3.8 4.8 3.7 4.6
%Ephem Score 58.5 24.6 75.6 41.5
%PT-H Score 98.1 50.4 35.8 28.1
%Chironomidae Score 87.7 78.3 100.0 86.4
Fam Richness Score 59.1 72.7 36.4 63.6
Fam EPT Score 81.8 63.6 45.5 54.6
Fam %Scraper Score 29.3 21.9 21.1 42.3
Fam %2Dom Score 91.3 90.0 38.1 76.2
Fam %MFBI Score 91.6 76.2 92.7 79.5
Family VSCI 74.7 59.7 55.6 59.0
VSCI Rating Excellent Stressed Stressed Stressed
- Primary biological effects.
Individual VSCI Raw Metric Values
Individual VSCI Metric Scores
1ANOC009.37

VSCI Metrics – Lower NFC 7
StationID
Collection Date
06
/06
/06
12
/14
/06
05
/01
/07
04
/09
/08
11
/03
/08
03
/24
/09
10
/20
/09
05
/06
/10
11
/02
/10
10
/05
/11
11
/12
/14
10
/05
/11
04
/17
/12
12
/03
/12
11
/14
/14
FamTotTaxa 10 16 19 14 17 15 14 11 8 13 15 14 17 16 14
FamEPTTax 5 6 8 5 7 8 5 6 5 5 4 7 6 6
%Ephem 41.2 7.4 26.4 2.9 8.4 4.6 42.3 52.5 0.0 18.2 5.5 34.6 50.0 12.7 16.4
%PT - Hydropsychidae 3.5 46.3 5.5 6.8 10.3 10.9 1 14.9 10.9 7.3 3.6 4.5 48.2 10
Fam%Scrap 5.9 8.4 5.5 9.7 13.1 18.2 52.6 10.9 1.0 25.5 29.1 52.7 23.6 10.9 12.7
%Chiro 3.5 3.2 20.9 60.2 31.8 20.9 7.2 14.9 5.9 1.8 20.9 0.0 22.7 5.5 22.7
Fam%2Dom 74.1 44.2 44.6 72.8 59.8 42.7 52.6 45.5 92.1 56.4 47.3 63.6 40.9 56.4 56.4
FamHBI 4.4 3.5 5.2 5.7 5.3 5.2 5.0 3.5 5.2 4.9 5.5 5.0 4.2 3.5 4.8
%Ephem Score 67.2 12.0 43.0 4.8 13.7 7.4 69.0 85.6 0.0 29.7 8.9 56.4 81.6 20.8 26.7
%PT-H Score 9.9 100.0 15.3 19.1 28.9 30.6 2.9 41.7 0.0 30.6 20.4 10.2 12.8 100.0 28.1
%Chironomidae Score 96.5 96.8 79.1 39.8 68.2 79.1 92.8 85.2 94.1 98.2 79.1 100.0 77.3 94.6 77.3
Fam Richness Score 45.5 72.7 86.4 63.6 77.3 68.2 63.6 50.0 36.4 59.1 68.2 63.6 77.3 72.7 63.6
Fam EPT Score 45.5 54.6 72.7 45.5 63.6 72.7 45.5 54.6 0.0 45.5 45.5 36.4 63.6 54.6 54.6
Fam %Scraper Score 11.4 16.3 10.6 18.8 25.4 35.2 100.0 21.1 1.9 49.3 56.4 100.0 45.8 21.1 24.7
Fam %2Dom Score 37.4 80.6 80.1 39.3 58.1 82.8 68.5 78.7 11.5 63.1 76.2 52.6 85.4 63.1 63.1
Fam %MFBI Score 83.0 95.1 70.7 63.4 69.5 70.3 74.0 95.8 71.2 74.9 66.5 74.3 85.0 96.3 76.2
Family VSCI 49.5 66.0 57.2 36.8 50.6 55.8 64.5 64.1 26.9 56.3 52.6 61.7 66.1 65.4 51.8
VSCI Rating Stressed Good StressedSevere
StressStressed Stressed Good Good
Severe
StressStressed Stressed Good Good Good Stressed
- Primary biological effects.
Individual VSCI Raw Metric Values
Individual VSCI Metric Scores
1ANOC000.42 1ANOC004.38

Benthics Inventory – Upper NFC
8
05
/06
/10
11
/02
/10
10
/05
/11
11
/12
/14
Capniidae Shredder 1 2
Perlidae Predator 1 3 6
Isonychiidae Filterer 2 6 12 43 15
Nemouridae Shredder 2 5
Perlodidae Predator 2 26
Taeniopterygidae Shredder 2 3 7
Philopotamidae Collector 3 3 14 8 2
Tipulidae Shredder 3 5
Uenoidae Scraper 3 2
Baetidae Collector 4 9 1
Elmidae Scraper 4 1 7 3 6
Ephemerellidae Collector 4 11
Heptageniidae Scraper 4 12 3 8 13
Psephenidae Scraper 4 3 2 1
Corydalidae Predator 5 2 3
Ancylidae Scraper 6 3
Chironomidae (A) Collector 6 13 23 15
Crangonyctidae Collector 6 10 1
Hydracarina 6 2
Hydropsychidae Filterer 6 12 17 38 37
Simuliidae Filterer 6 3
Asellidae Collector 8 3
Tricladida (unknown) Collector 8 3 1
Coenagrionidae Predator 9 1
Lumbricidae Collector 10 2
Oligochaeta unknown unknown 1
74.67 59.72 55.64 59.01
- Dominant 2 species in each sample.
VSCI: Optimal > 60; suboptimal < 50 (VADEQ, 2006).
VSCI
1ANOC009.37
Family
Functional
Family
Group
Tolerance
Value

Benthics Inventory – Lower NFC
9
06
/06
/06
12
/14
/06
05
/01
/07
04
/09
/08
11
/03
/08
03
/24
/09
10
/20
/09
05
/06
/10
11
/02
/10
10
/05
/11
11
/12
/14
10
/05
/11
04
/17
/12
12
/03
/12
11
/14
/14
Capniidae Shredder 1 12 3 16
Perlidae Predator 1 3 4 2 4 14 1
Isonychiidae Filterer 2 25 3 3 2 3 7 27 4 20 7 13
Nemouridae Shredder 2 4 3
Perlodidae Predator 2 1 2
Taeniopterygidae Shredder 2 30 1 5 5 36 9
Aeshnidae Predator 3 1 2 1 1 1 1
Philopotamidae Collector 3 2 2 3 2 1 12 4 2 1
Tipulidae Shredder 3 1 5 2 1 1 2 4 1 1 2 2
Uenoidae Scraper 3 3 1
Baetidae Collector 4 8 6 3 2 19 7 1 20
Caenidae Collector 4 4 14 1 5 1
Elmidae Scraper 4 2 7 3 4 7 15 6 1 5 5 15 12 2 6
Ephemerellidae Collector 4 3 1
Heptageniidae Scraper 4 2 3 6 1 32 7 11 2 37 10 6 5
Psephenidae Scraper 4 6 3 12 4 1 2 1
Corixidae Predator 5 87
Corydalidae Predator 5 2 1 1 1
Dryopidae Shredder 5 1 1 1 1 3 1 1
Gyrinidae Predator 5 1 1 6
Ancylidae Scraper 6 17 2
Ancylidae Scraper 6 1 7 4 2 1
Chironomidae (A) Collector 6 3 3 21 62 34 23 7 15 6 2 23 25 6 25
Empididae Predator 6 4 3
Hydracarina 6 3 6
Hydropsychidae Filterer 6 38 12 11 1 30 19 19 9 50 29 33 37
Simuliidae Filterer 6 2 10 28 13 2 24 1 3 26 1
Lymnaeidae Scraper 7 6 1 1
Asellidae Collector 8 1 1
Corbiculidae Filterer 8 1 1 1 2
Corbiculidae Filterer 8 3 1
Lumbriculidae Collector 8 1 2 3 1 2
Naididae Collector 8 5 6
Physidae Scraper 8 1 1 1
Tricladida (unknown) Collector 8 1 3 2
Chironomidae (B) Collector 9 2
Coenagrionidae Predator 9 1 1 6 1 2
Lumbricidae Collector 10 1 1
Ephemeridae unknown unknown 2
Gammaridae unknown unknown 2
Hydracarina (unknown) unknown unknown 2 1
Hydroptilidae unknown unknown 3
Oligochaeta unknown unknown 8
Sialidae unknown unknown 3
49.54 66.02 57.24 36.78 50.59 55.8 64.53 64.08 26.87 56.29 52.64 61.68 66.09 65.38 51.77
- Dominant 2 species in each sample.
VSCI: Optimal > 60; suboptimal < 50 (VADEQ, 2006).
6 additional taxa were identified with only 1 organism in all samples.
VSCI
1ANOC000.42 1ANOC004.38
Family
Functional
Family
Group
Tolerance
Value

Stressor Analysis
Benthic impairment does not specify
pollutant(s)
Review existing data
Weight-of-evidence approach
Identify potential sources
10

Interaction of Multiple Stressors
Sources: Residential Agriculture
Insufficient stream buffers
Forest Harvesting
Stressors:
Causes: Effects: Shift in benthic macroinvertebrate community
Altered food
source
Loss of bank
habitat
Embeddedness; loss of in-stream
habitat
Groundwater
Organic Enrichment
Nutrient Enrichment
Unstable stream banks
Faulty or improper wastewater discharge
Stream bank trampling by
livestock
Erosion
Nitrates
Increased sedimentation
11

Landuse 12

Landuse Summary
13
Lower Upper Total
LU Category
1 Corn Row Crop 91.54 169.07 260.61
4 Sorghum Row Crop 0.27 0.90 1.17
5 Soybeans Row Crop 62.60 122.81 185.41
21 Barley Row Crop 2.24 0.54 2.78
24 Winter Wheat Row Crop 12.42 4.23 16.65
26 W. Wht./Soy. Dbl. Crop Row Crop 3.61 0.98 4.59
27 Rye Row Crop 0.09 0.36 0.45
28 Oats Row Crop 0.09 0.00 0.09
29 Millet Row Crop 0.00 3.15 3.15
36 Alfalfa PastureHay 0.61 4.61 5.22
37 Other Pasture/Hays PastureHay 578.02 640.35 1,218.37
44 Other Crops Specialty Crops 0.72 0.36 1.08
59 Seed/Sod Grass Specialty Crops 0.18 0.54 0.72
61 Fallow/Idle Cropland PastureHay 4.67 8.46 13.13
62 Pasture/Grass PastureHay 590.65 657.38 1,248.03
68 Apples Specialty Crops 0.17 1.26 1.43
111 NLCD - Open Water Water 14.13 9.99 24.12
121 NLCD - Developed/Open Space Pervious_LDI 105.12 172.73 277.86
122 NLCD - Developed/Low Intensity LDI 9.73 18.51 28.24
123 NLCD - Developed/Medium Intensit MDI 0.99 0.99 1.98
131 NLCD - Barren Barren 0.09 0.00 0.09
141 NLCD - Deciduous Forest Forest 585.32 2,070.82 2,656.14
142 NLCD - Evergreen Forest Forest 27.59 48.72 76.31
143 NLCD - Mixed Forest Forest 2.70 2.61 5.31
152 NLCD - Shrubland PastureHay 1.60 5.49 7.09
171 NLCD - Grassland Herbaceous PastureHay 0.44 1.45 1.89
190 NLCD - Woody Wetlands Forest 3.77 4.14 7.91
195 NLCD - Herbaceous Wetlands Forest 0.27 0.18 0.45
219 Greens Specialty Crops 0.00 0.09 0.09
235 Dbl. Crop Barley/Sorghum Row Crop 0.09 0.00 0.09
237 Dbl. Crop Barley/Corn Row Crop 0.00 0.27 0.27
254 Dbl. Crop Barley/Soybeans Row Crop 2.68 1.19 3.87
Total Area (ha): 2,104.50 3,954.30 6,058.80
NASS
CodeNASS Land Use Class
Area (ha)
Source: USDA-NASS 2012 Cropland Data Layer

Known Permitted Sources
VPDES Individual Permits - none
Industrial Stormwater General Permits – none
SFH domestic sewage discharge permits – 5
No current permits for biosolids land application
14

Pollution Response (PReP) Reports 15
Incident Date Site Name Incident Type Original Call Incident Description
07/13/99 Route 287 Petroleum Vehicle Accident - hydraulic fluid spill
05/02/01 Hillsboro VDOT Petroleum
Discovered at night - bull dozer set on fire, released hydraulic fluid
to land only, VDOT and State Police investigating VDOT clean up
area. No further action required.
05/03/06 Hawkins WaterFailing multi-flow system used for church/antique shop/house &
possibly another connection house/convenience store.
06/29/07 Charles Planck Fish Kill Fish kill in private pond. 12-15 dead fish.
10/26/12 Biosolids/Poultry Liter Storage Biosolids Stored biosolids or poultry manure
05/17/13 Biosolids - Wheatland area Biosolids Toxic odor
03/04/14 Poultry Litter Storage Agriculture Uncovered poultry litter storage
06/27/14 Propane Release --Bulldozer struck 500-gal underground propane tank, estimated 400-
gal released.

DEQ Monitoring Data
No Temperature WQS exceedances
No pH WQS exceedances
3 stream tests for dissolved metals – no exceedances
of any applicable human health or aquatic life criteria
05/01/07: partial suite of dissolved metals
06/03/13 and 09/19/13: full suite of dissolved metals
16

Field Dissolved Oxygen Data 17
0
2
4
6
8
10
12
14
16
Jan-00 Jan-02 Jan-04 Jan-06 Jan-08 Jan-10 Jan-12 Jan-14 Jan-16
Dis
solv
ed O
xyge
n, m
g/L
1ANOC000.42 1ANOC004.38 1ANOC007.28 1ANOC009.13 1ANOC009.37
Class III Min Instantaneous WQS

Field Specific Conductivity 18
0
50
100
150
200
250
300
350
400
Jan-00 Jan-02 Jan-04 Jan-06 Jan-08 Jan-10 Jan-12 Jan-14 Jan-16
Spe
cifi
c C
on
du
ctiv
ity,
µm
ho
s/cm
1ANOC000.42 1ANOC004.38 1ANOC007.28 1ANOC009.13 1ANOC009.37
Note the increasing trend over time.

Nitrogen Data 19
0
0.2
0.4
0.6
0.8
1
1.2
1.4
1.6
1.8
Jan-00 Jan-02 Jan-04 Jan-06 Jan-08 Jan-10 Jan-12 Jan-14 Jan-16
Nit
rate
-N, m
g/L
1ANOC000.42 1ANOC004.38 1ANOC009.13
0
0.2
0.4
0.6
0.8
1
1.2
Jan-00 Jan-02 Jan-04 Jan-06 Jan-08 Jan-10 Jan-12 Jan-14 Jan-16
Tota
l Kje
ldah
l N, m
g/L
1ANOC000.42 1ANOC004.38 1ANOC009.13
0
0.5
1
1.5
2
2.5
Jan-00 Jan-02 Jan-04 Jan-06 Jan-08 Jan-10 Jan-12 Jan-14 Jan-16
Tota
l Nit
roge
n, m
g/L
1ANOC004.38 1ANOC007.28 1ANOC009.37
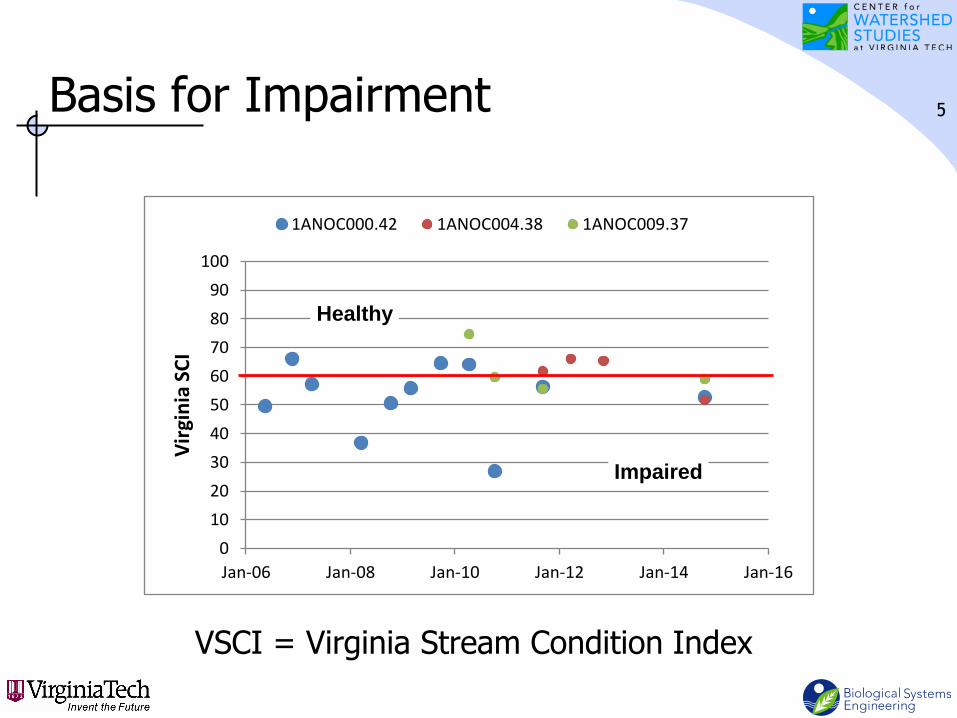
Phosphorus Data 20
0
0.01
0.02
0.03
0.04
0.05
0.06
0.07
0.08
0.09
0.1
Jan-00 Jan-02 Jan-04 Jan-06 Jan-08 Jan-10 Jan-12 Jan-14 Jan-16
Ort
ho
-ph
osp
ho
rus,
mg/
L
1ANOC000.42 1ANOC004.38 1ANOC009.13
0
0.05
0.1
0.15
0.2
0.25
0.3
Jan-00 Jan-02 Jan-04 Jan-06 Jan-08 Jan-10 Jan-12 Jan-14 Jan-16
Tota
l Ph
osp
ho
rus,
mg/
L
1ANOC000.42 1ANOC004.38 1ANOC007.28 1ANOC009.13 1ANOC009.37

Sediment-Related Data 21
0
20
40
60
80
100
120
Jan-00 Jan-02 Jan-04 Jan-06 Jan-08 Jan-10 Jan-12 Jan-14 Jan-16
Tota
l Su
spen
ded
So
lids,
mg/
L
1ANOC000.42 1ANOC004.38 1ANOC007.28 1ANOC009.13 1ANOC009.37
0
10
20
30
40
50
60
70
80
Jan-00 Jan-02 Jan-04 Jan-06 Jan-08 Jan-10 Jan-12 Jan-14 Jan-16
Turb
idit
y, m
g/L
1ANOC000.42 1ANOC004.38 1ANOC007.28 1ANOC009.37
Relative Bed Stability Metrics StationID Date Slope % Bedrock % Sand + Fines Embeddedness LRBS*
1ANOC000.42 11/12/14 0.22 9.5% 53.3% 76.2 -0.520
1ANOC004.38 11/14/14 0.18 5.7% 19.0% 54.5 0.586
1ANOC009.37 11/12/14 1.06 3.8% 11.4% 44.2 0.247
* LRBS > -0.5 indicates a normal sediment load;
LRBS < -1.0 indicates excessive sediment load.

Bacteria Data 22
0
500
1000
1500
2000
2500
3000
3500
4000
4500
Jan-00 Jan-02 Jan-04 Jan-06 Jan-08 Jan-10 Jan-12 Jan-14 Jan-16
Esch
eric
hia
co
li, m
g/L
1ANOC000.42 1ANOC004.38 1ANOC007.28 1ANOC009.37
DEQ Ambient Monitoring Data LWW Ambient Monitoring Data, 2005-2009
0
2000
4000
6000
8000
10000
12000
Mar-05 Mar-06 Mar-07 Mar-08 Mar-09 Mar-10E.
co
li, c
fu/1
00
mL
NOCO09.13 NOCO00.42 NOCO04.38
Catoctin Creek • Fecal Coliform TMDL (2002) • Implementation Plan (2004)

StationID
CollDate 05
/06
/10
11
/02
/10
10
/05
/11
11
/12
/14
Channel Alteration 18 18 20 18
Bank Stability1 18 15 18 16
Vegetative Protection1 18 15 18 14
Embeddedness 14 17 16 12
Channel Flow Status 19 12 17 14
Frequency of riffles (or bends) 19 18 18 18
Riparian Vegetative Zone Width1 11 9 12 8
Sediment Deposition 12 17 18 12
Epifaunal Substrate / Available Cover 18 17 18 18
Velocity / Depth Regime 20 10 18 14
10-Metric Total Habitat Score2 167 148 173 144
- Marginal or Poor habitat metric rating.1 Metric is the sum of scores for both the left and right banks.2 Total Habitat Score: optimal > 150; suboptimal < 120.
1ANOC009.37
Benthic Habitat Metrics 23
Upper NF Catoctin Creek
Lower NF Catoctin Creek StationID
CollDate 06
/06
/06
12
/14
/06
05
/01
/07
04
/09
/08
11
/03
/08
03
/24
/09
10
/20
/09
05
/06
/10
11
/02
/10
10
/05
/11
11
/12
/14
10
/05
/11
04
/17
/12
12
/03
/12
11
/14
/14
Channel Alteration 16 17 16 13 16 16 17 19 19 16 18 18 19 18 19
Bank Stability1 10 9 9 4 6 4 12 3 6 9 11 12 8 9 10
Vegetative Protection1 8 9 5 4 7 4 11 5 7 7 12 13 14 12 16
Embeddedness 17 13 12 13 14 9 14 11 15 12 14 13 12 7 13
Channel Flow Status 13 15 16 18 14 17 16 19 10 20 15 18 11 18 14
Frequency of riffles (or bends) 15 15 13 13 13 11 13 8 9 14 13 10 15 13 13
Riparian Vegetative Zone Width1 7 7 6 2 7 7 9 9 7 6 13 12 15 14 18
Sediment Deposition 14 8 10 10 8 7 5 8 8 9 10 13 10 8 11
Epifaunal Substrate / Available Cover 16 16 11 13 13 13 15 13 14 15 12 13 15 10 14
Velocity / Depth Regime 14 13 13 10 10 10 10 13 10 15 15 15 15 13 14
10-Metric Total Habitat Score2 130 122 111 100 108 98 122 108 105 123 133 137 134 122 142
- Marginal or Poor habitat metric rating.1 Metric is the sum of scores for both the left and right banks.2 Total Habitat Score: optimal > 150; suboptimal < 120.
1ANOC004.381ANOC000.42

Streamflow 24
0
100
200
300
400
500
600
700
800
900
1000
Feb-12 Apr-12 Jun-12 Aug-12 Oct-12
Dis
char
ge, c
fs
1638420 01638386 01638395
Short-term monitoring
0
5
10
15
20
25
30
0
20
40
60
80
100
120
Apr-01 Apr-03 Apr-05 Apr-07 Apr-09 Apr-11 Apr-13 Apr-15
Mo
nth
ly A
vera
ge P
reci
p, i
n/m
on
Mo
nth
ly A
vera
ge D
aily
Flo
w, c
fs
Flow Precip
Long-term monitoring
Period of record: 07/01/01 - 03/30/15 (5,002 days)
121 days: daily average flow < 0.1 cfs 394 days: daily average flow < 1.0 cfs
Average daily flow: 24.52 cfs Median daily flow: 12.0 cfs.
Source: DEQ monthly flow (01638386, 01638395) and daily USGS flow (01638420)
Source: Monthly Average Daily Flow at USGS01638420 - Route 681 near Waterford
01638386: nr. 1ANOC009.37 01638395: nr. 1ANOC007.28 01638420: nr. 1ANOC000.42
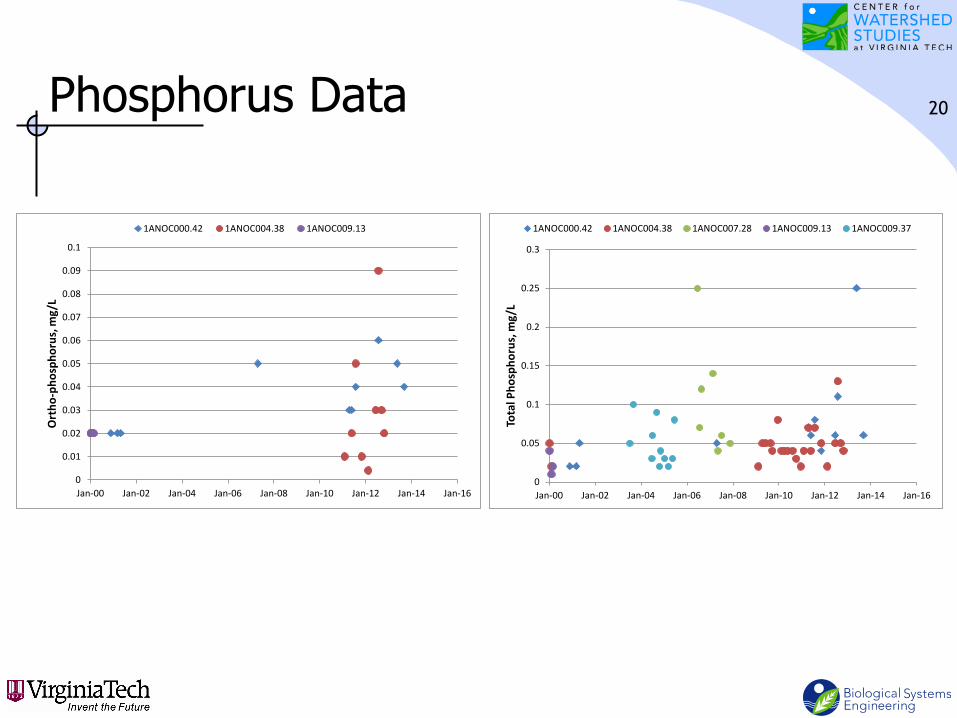
Streamflow (cont.) 25
0
1
2
3
4
5
6
7
8
9
10
0
10
20
30
40
50
1 2 3 4 5 6 7 8 9 10 11 12
Ave
. Mo
nth
ly A
ve. P
reci
p, i
n/m
on
Ave
. Mo
nth
ly A
ve. D
aily
Flo
w, c
fs
Month
Flow Precip
Source: USGS Average Monthly Average Daily Flow, USGS01638420, 2001-2014

Flow/Hydrologic Modifications
8 dams in DCR inventory
2 reported water withdrawals
Town of Purcellville
Moutoux Orchards
Town of Hillsboro water supply
26
ID Name of Dam Dam Owner
Classification
Description
Length of
Impoundment
(ft)
Year
Completed
10712 Godfrey Dam M H F LLC Significant 842 1956
10719 J.T. Hirst Dam Town of Purcellville Significant 600 1962
00297 Upper Godfrey Dam M H F LLC Significant 519 1990
00300 15164 Berlin Pike Dam Faith & Family foundation Inc. Low 1,754 1990
10775 Shanondale Road Dam Williams, Michael & Gina Schaecher Significant 575
10776 Ashbury Church Road Dam Baker, Daniel L Significant 1,376
10777 Koerner Lane Dam Michie, Thomas H & Jean Ann R/S Significant 561
10731 Upper Purcellville Dam Town of Purcellville Significant 1,165 1940

Reported Water Withdrawals 27
0.000
0.050
0.100
0.150
0.200
0.250
0.300
2000 2002 2004 2006 2008 2010 2012 2014
Ave
rage
Wat
er W
ith
dra
wal
Rat
es (
MG
D)
COOPER SPRING FROM JT HIRST RESERVOIR Moutoux Orchard
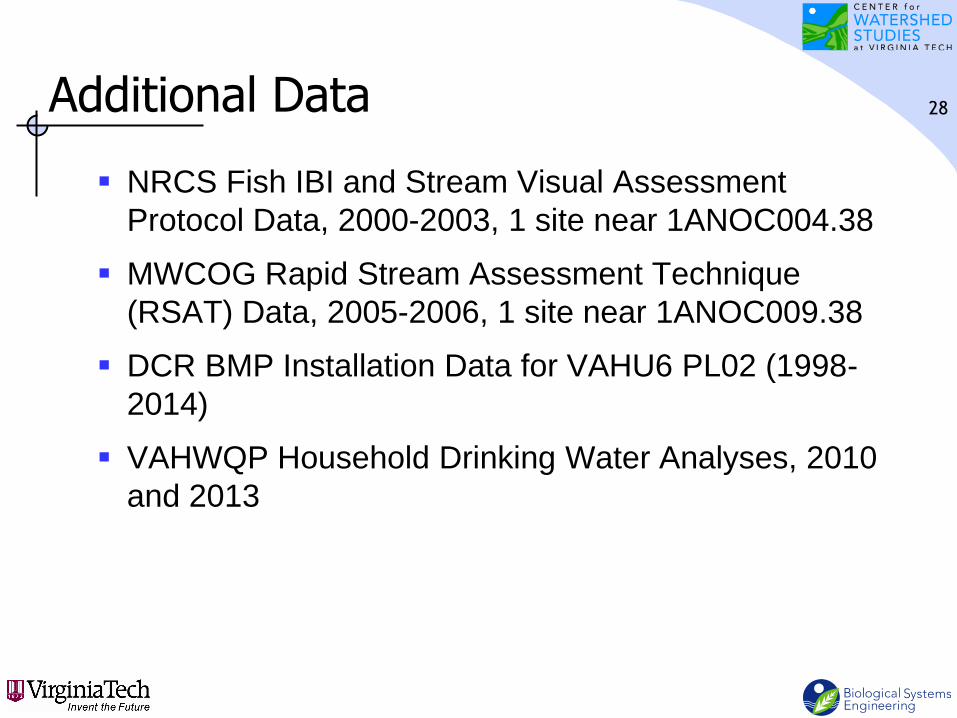
Additional Data
NRCS Fish IBI and Stream Visual Assessment
Protocol Data, 2000-2003, 1 site near 1ANOC004.38
MWCOG Rapid Stream Assessment Technique
(RSAT) Data, 2005-2006, 1 site near 1ANOC009.38
DCR BMP Installation Data for VAHU6 PL02 (1998-
2014)
VAHWQP Household Drinking Water Analyses, 2010
and 2013
28

Preliminary Eliminated Stressors
Ammonia
pH
Temperature
Dissolved Oxygen
Dissolved Metals
29

Preliminary Possible Stressors
Conductivity
Sediment
Nutrients
Flow/hydrologic modifications
30

0
10
20
30
40
50
60
70
80
90
100
Jan-06 Jan-08 Jan-10 Jan-12 Jan-14 Jan-16
Vir
gin
ia S
CI
1ANOC000.42 1ANOC004.38 1ANOC009.37
Stressor Analysis Example
VSCI = Virginia Stream Condition Index
31
Healthy
Impaired

Events between 05/06/10 and 11/02/10
Habitat metrics
Upper NFC: embeddedness 14 to 17; flow
status 19 to 12; velocity/depth regime 20 to 10
Lower NFC: embeddedness 11 to 15; flow
status 19 to 10
3rd lowest flow in August
September 3-28, 2010: no flow recorded
September 30, 2010: 4.53” rainfall
32

0
100
200
300
400
500
600
700
Jan
-10
Feb
-10
Mar
-10
Ap
r-1
0
May
-10
Jun
-10
Jul-
10
Au
g-1
0
Sep
-10
Oct
-10
No
v-1
0
De
c-1
0
Dis
char
ge, c
fs
33
0
10
20
30
40
50
60
70
80
0 5 10 15 20 25 30
VSC
I
30-day median flow, cfs
1ANOC000.42 1ANOC004.38 1ANOC009.37
Flow vs. VSCI
Context of the 4.53” Rainfall Event
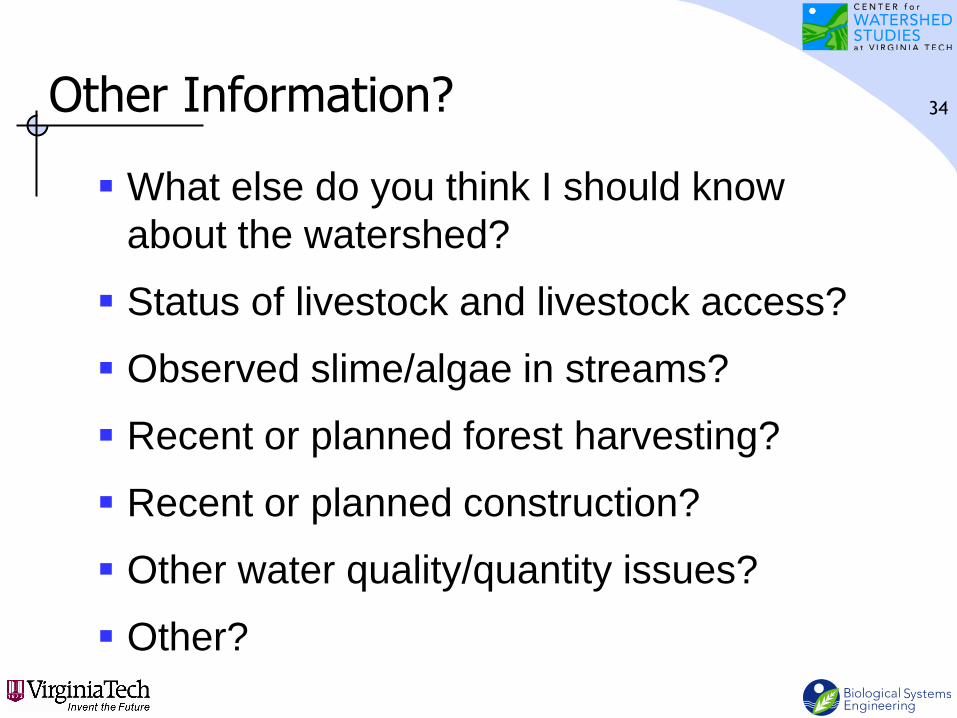
Other Information?
What else do you think I should know
about the watershed?
Status of livestock and livestock access?
Observed slime/algae in streams?
Recent or planned forest harvesting?
Recent or planned construction?
Other water quality/quantity issues?
Other?
34

Contact Information
Gene Yagow
Biological Systems Engr. Dept.
306 Seitz Hall (0303)
Virginia Tech
Blacksburg, VA 24061
540-231-2538
35


![…MODEL ROLE STRESSOR… [R.T. HAMDANI, S.NG]](https://img.pdfslide.us/doc/110x75/6157d301ce5a9d02d46f7dcb/model-role-stressor-rt-hamdani-sng.jpg)