Embed Size (px)
Citation preview
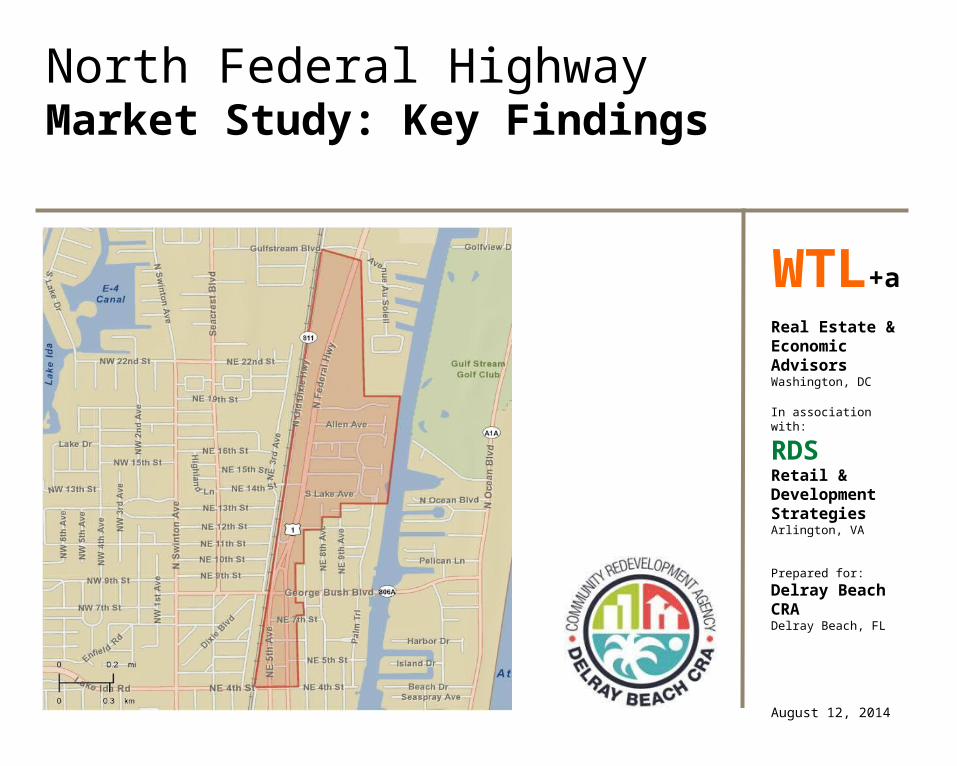
North Federal HighwayMarket Study: Key Findings
Real Estate & Economic AdvisorsWashington, DC
In association with:
RDSRetail & Development StrategiesArlington, VA
Prepared for:
Delray Beach CRADelray Beach, FL
August 12, 2014
WTL+a

Objectives of the Market Study
Update 1999 market study of revitalization & redevelopment potentials
Analyze demographic & economic characteristics
Evaluate real estate market trends & conditions
Measure real estate market potentials, estimate absorption/phasing for key uses:
Residential
Speculative/multi-tenant office
Lodging/hotel
Retail & food service
Guide public decisions about zoning, additional infrastructure & other public improvements along the corridor

Study Area Context
Study Area

Study Area Land Uses
206 acres
46+/- acres & 375,000 SF of “workplace” uses:
153,300 SF retail (41%)
126,000 SF auto-related (34%)
38,400 SF warehouse (10%)
30,100 SF demolished (8%)
18,200 SF restaurants/food service (5%)
8,800 SF office (2%)
5.6 vacant acres in demolished uses (excludes Swap Shop site)
515 housing units
47% owner-occupied
34% renter-occupied
19% “unoccupied”
Traffic volumes in 2013 averaged 26,600 vehicles per day

Proposed Development Projects Beachway Motel: 13 rooms
St. George site:
38 townhouses
Mid-2015 delivery
Southgate Motel: 29 rooms
Goodwill of Delray: 1,518 SF addition
Delray Preserve:
188 proposed MF units (22 units/acre)
Borton Volvo: 17,226 SF auto-related
2645 North Federal:
11,311 SF professional & medical office space
Gulfstream Villas: 15 townhouse units

Key Market FindingsDemographics (2000-2013)
Very strong population growth in Palm Beach County: 1.3 million residents
Population increased by 214,500 in 72,700 new HHs
Delray Beach: 61,800 residents
Added 1,780 residents = 820 HHs
Limited growth next 5 years: 855 residents in <300 HHs
Since 2000, Boca, Boynton & West Palm growing significantly faster than Delray (9,700 to 21,000 new residents)
Study area’s population stable; new housing will add new residents
Compared to City, the study area:
More affluent (annual HH incomes of $79,600 vs. $66,600)
Spend more on retail ($20,700 vs. $17,500)
Spend more on Food & Beverage ($6,700 vs. $5,700)
Has fewer unoccupied & vacant housing units

Key Market FindingsEconomic Profile
619,000 jobs in Palm Beach County
Economy in recovery from 2007—2009 recession (49,500 jobs lost)
20,200 new jobs created past 3 years
Strongest job growth in Professional Services, Health Care; mirrors national trends
Delray Beach contains 34,700 jobs: 6% of County
Jobs-to-population ratio: 0.58
45% of jobs in Services; 27% in Retail
19% of all jobs in Retail sector are in restaurants
Key Market FindingsEconomic Profile
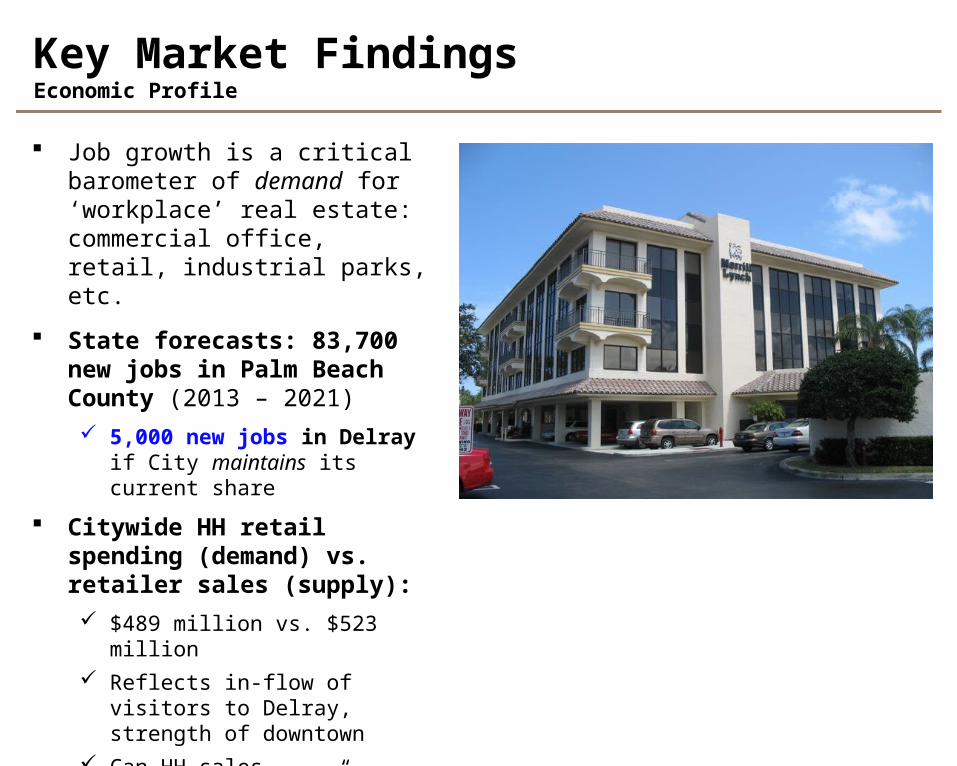
Job growth is a critical barometer of demand for ‘workplace’ real estate: commercial office, retail, industrial parks, etc.
State forecasts: 83,700 new jobs in Palm Beach County (2013 – 2021)
5,000 new jobs in Delray if City maintains its current share
Citywide HH retail spending (demand) vs. retailer sales (supply):
$489 million vs. $523 million
Reflects in-flow of visitors to Delray, strength of downtown
Can HH sales (“opportunity gap”) in specific categories be recaptured?

Key Market FindingsHousing Market Performance
Delray Beach housing inventory:
34,100 units (38% single-family; 52% multi-family)
8,200+ unoccupied units reflects heavy seasonal occupancy
“True Vacancy” (i.e., empty & available) is low: 6.5%, suggesting stabilized occupancies
Median value: $141,000 (study area: $224,200)
Annual housing starts (2005-2013):
Palm Beach County: 4,800 units per year (62% single-family)
Delray Beach: 255 units per year (61% multi-family)
Confirms market-response to moderate-density product such as stacked-flats
Multi-family rental trends:
Higher rents achieved in Delray than Boynton ($1.57 PSF vs. $1.07 PSF)
Higher vacancy rates in Delray than Boynton (9.8% vs. 3.9%)
All comparables defined by industry as “Class A” quality

Key Market FindingsOffice & Retail Market Performance
Delray Beach office inventory (2006-2013):
2.9 million SF in 301 buildings; comprises mix of “garden” buildings & industry-standard suburban office parks
Accounts for 12% of County’s 24 million SF inventory
Overall vacancies have jumped since 2006: from 8% to 26.5%
Significant challenges of negative absorption (leasing): (677,000) SF vacated since 2006
Office Depot HQs relocation to Boca responsible for weakened market statistics
Job growth in office-using sectors is critical
Delray Beach retail inventory (2013):
3.9 million SF in multiple property types
Accounts for 9% of County’s 44.4 million SF inventory
239,000 SF of net absorption in 2013
Strengthening regional role as retail destination
$35 million in recaptured Grocery spending: Trader Joe’s (10,000 SF) & Fresh Market (20,000 SF)

Key Market FindingsOffice & Retail Market Performance

Key Market FindingsOffice & Retail Market Performance

Key Market FindingsHotel Market Performance
Delray Beach hotel supply:
887 rooms in 7 properties (as defined by STR): comprises 6.5% share of County’s 13,600+ rooms
Inventory includes 95-room Fairfield Inn under construction
Since 2010, annual occupancies have fluctuated between 58% & 70%
4-year average occupancies: 64.9%, suggests roomnight demand is at threshold for financing new construction (65% to 72%)
Colony Hotel & Crane’s Beach Hotel do not report performance to STR
Solid annual growth in average daily rates (ADRs): $127 (2010) to $145 (2014)

What We HeardStakeholder Interviews
Study area lacks identity/brand; does not benefit from economic engine & strong identity of downtown
Land uses characteristic of aging, low-density suburban commercial corridors in south Florida
In transition:
Land values increasing due to proximity to downtown
Private investment in high-quality residential
Difficult to attract commercial re-investment at current low rents
Values driven by perceived future uses
‘Hot button’ issues: increasing residential densities; introduction of rental housing (turnover)
Largest contiguous parcels are all auto-oriented uses
How to capture spending from high-income HHs (e.g., Gulf Stream)

What We HeardStakeholder Interviews
Desire for independent, “boutique” retail in walkable district
Narrow lot depths, fragmented ownership/parcel assemblage, adjacent rail line complicate development
Challenges of current densities/zoning:
Will not support significant retail
Precludes ‘Pineapple Grove-type’ development (i.e., surface parking required)
Costs of structured parking too high w/o additional revenues
Is there opportunity to ‘cluster’ new retail (e.g., at George Bush Blvd.)?
How can public improvements & other public policies be used to:
Enhance marketability
Generate private commercial investment
Create pedestrian-friendly areas?

Key Market FindingsMarket Directions
Retail & Food Service Success of Atlantic Avenue has created strong regional destination & identity
Challenges of maintaining specialty retail in a strong food & beverage market, higher rents
Study area retail potentials:
Affected by distance & quality of pedestrian space
Width of North Federal Highway limits easy creation of walkable retail environment
Limited residential densities cannot support walkable retail cluster on its own
Significant competitive environment & higher densities in Boynton Beach
Transitional uses characteristic of South Florida commercial strips
Several buildings worthy of preservation & re-use; “character-giving”

Key Market FindingsMarket Directions
Market-rate Housing Forecasts suggest limited near-term population & HH growth
Near-term demand likely captured by planned projects (e.g., ZOM)
Transitional land uses in study area suggest opportunities for moderate-density infill residential development & selected mixed-use
Parcel size, ownership priorities & consolidation potential affect opportunities for multi-family housing
Increased residential densities will be critical to support new retail in study area:
Each new resident = 4 to 7 SF
Each new office worker = 2 to 5 SF
Each visitor = 0.5 to 1.5 SF

Key Market FindingsMarket Directions
Professional Office/Business Services State (DEO) employment forecasts suggest near-term growth:
Retail/Food Service
Professional Services & Finance/Insurance & Real Estate
Job growth in office-using sectors critical to generating near-term demand
If 2,000 of 5,000 new jobs are office-using = 400,000 SF
Current office vacancies = 793,000 SF
Current zoning in most of Delray Beach (& study area) restricts higher-density office development
Suggests small-scale “garden” product & tenant mix
Limited market potentials in the near-term (3 to 5 years)

Key Market FindingsMarket Directions
Hotel/Lodging Sustained annual occupancies meet
threshold required by capital markets for financing new construction (65% to 72%)
Fairfield Inn may delay near-term feasibility of new hotel in study area
Key planning question:
Where is best location for future hotel product in Delray Beach?
Locational characteristics that enhance marketability (e.g., Hyatt Place, Fairfield)
Future feasibility studies will be required to warrant conventional financing & determine product type (i.e., business vs. leisure)
Next Steps
Solicit public feedback tonight & continue stakeholder outreach
Estimate potential market demand by use & range (e.g., low/high)
Suggest potential phasing & development strategies
Consider linkages to downtown (e.g., branding/marketing, land uses)
Consider both natural market growth & “induced” markets
Prepare draft Market Study report by 9/15 for CRA review
Submit final Market Study report by 9/30

Q & A

Demographic/Economic ProfileSelected Municipalities in Palm Beach County
As % of As % of Forecast As % of2000 County 2013 County 2020 County Growth Rate Gain/(Loss)
Population Trends (Permanent Residents Only) (1)Palm Beach County 1,131,191 1,345,652 1,465,300 1.3% 214,461
Delray Beach 60,020 5.3% 61,801 4.6% 66,640 4.5% 0.2% 1,781
Boca Raton 74,764 6.6% 86,041 6.4% 91,679 6.3% 1.1% 11,277 Boynton Beach 60,389 5.3% 70,131 5.2% 76,144 5.2% 1.2% 9,742 Gulf Stream 716 0.1% 974 0.1% 963 0.1% 2.4% 258 Briny Breezes 411 0.0% 420 0.0% 885 0.1% 0.2% 9 Highland Beach 3,775 0.3% 3,572 0.3% 3,917 0.3% -0.4% (203) Ocean Ridge 1,636 0.1% 1,798 0.1% 1,927 0.1% 0.7% 162 West Palm Beach 82,103 7.3% 103,038 7.7% 113,131 7.7% 1.8% 20,935
2020 Growth Rate Gain/(Loss)Population Forecasts (1)Delray Beach 66,640 0.6% 4,839 Palm Beach County 1,465,300 0.7% 119,648
www.pbcgov.com/pzb/planning/population/countyprofile.pdf
Source: Palm Beach County Department of Planning, Zoning & Building; WTL+a, July 2014.
(1) Population estimates by the Palm Beach County Department of Planning, Zoning, and Building. Population reflects permanent residents only, and does not include temporary residents. Thus, figures do not precisely match Census figures or ESRI estimates in other tables.
Change: 2013-2020
Change: 2000-2013

Demographic & Economic ProfileCity of Delray Beach
2010 2012 % Dist. 2017 % Dist. No. CAGR %Demographic ProfilePopulation 60,522 60,243 61,098 855 0.28%Households 27,193 27,247 27,538 291 0.21%Avg. HH Size 2.18 2.17 2.18 Median Age 46.0 46.9 48.8 Race White 39,768 39,374 65% 39,007 64% (367) -0.2% Black 16,961 16,848 28% 17,353 28% 505 0.6% American Indian 122 124 0% 138 0% 14 2.2% Asian, Pacific Islander 1,142 1,220 2% 1,485 2% 265 4.0% Other 1,490 1,569 3% 1,820 3% 251 3.0% Two or More Races 1,039 1,108 2% 1,296 2% 188 3.2% Hispanic (1) 5,769 6,107 10% 7,305 12% 1,198 3.6%Age Distribution 0-14 8,017 7,875 13% 7,780 13% (95) -0.2% 15-24 6,578 6,352 11% 5,883 10% (469) -1.5% 25-34 7,522 7,438 12% 7,424 12% (14) 0.0% 35-44 7,308 6,972 12% 6,739 11% (233) -0.7% 45-54 8,727 8,343 14% 7,633 12% (710) -1.8% 55-64 8,079 8,399 14% 8,754 14% 355 0.8% 65-74 6,143 6,516 11% 7,928 13% 1,412 4.0% 75+ 8,148 8,346 14% 8,954 15% 608 1.4%Average HH Income 66,636$ 76,119$ 2.7%Median HH Income 45,855$ 53,803$ 3.2%
Change: 2012-2017

Demographic & Economic ProfileCity of Delray Beach
2010 2012 % Dist. 2017 % Dist. No. CAGR %Housing ProfileOwner-occupied 18,189 17,764 18,190 426 0.5% % of Total 53% 52% 52.1%
Renter-occupied 9,004 9,483 9,348 (135) -0.3% % of Total 26% 28% 26.8%
Unoccupied 6,963 7,079 7,377 298 0.8% % of Total 20% 21% 21.1%Total Units: 34,156 34,326 34,915 589 0.3%
Median Value 140,692$ 165,644$ 3.3%Average Value 209,916$ 223,971$ 1.3%
(1) Persons of Hispanic origin are a subset of other race categories; therefore, totals do not add.
Source: ESRI Business Analyst; WTL +a, July 2014.
Change: 2012-2017

Demographic & Economic ProfileStudy Area
2010 2012 % Dist. 2017 % Dist. No. CAGR %Demographic ProfilePopulation 746 759 798 39 1.01%Households 401 410 427 17 0.82%Avg. HH Size 1.86 1.85 1.87 Median Age 45.8 46.4 47.7 Race White 693 701 92% 725 91% 24 0.7% Black 23 24 3% 29 4% 5 3.9% American Indian 3 3 0% 4 1% 1 5.9% Asian, Pacific Islander 8 8 1% 11 1% 3 6.6% Other 5 6 1% 7 1% 1 3.1% Two or More Races 15 17 2% 23 3% 6 6.2% Hispanic (1) 54 60 8% 80 10% 20 5.9%Age Distribution 0-14 83 83 11% 85 11% 2 0.5% 15-24 47 48 6% 45 6% (3) -1.3% 25-34 89 90 12% 94 12% 4 0.9% 35-44 144 141 19% 141 18% - 0.0% 45-54 139 136 18% 129 16% (7) -1.1% 55-64 135 143 19% 155 19% 12 1.6% 65-74 71 79 10% 102 13% 23 5.2% 75+ 39 41 5% 47 6% 6 2.8%Average HH Income 79,643$ 95,634$ 3.7%Median HH Income 51,889$ 61,418$ 3.4%
Change: 2012-2017
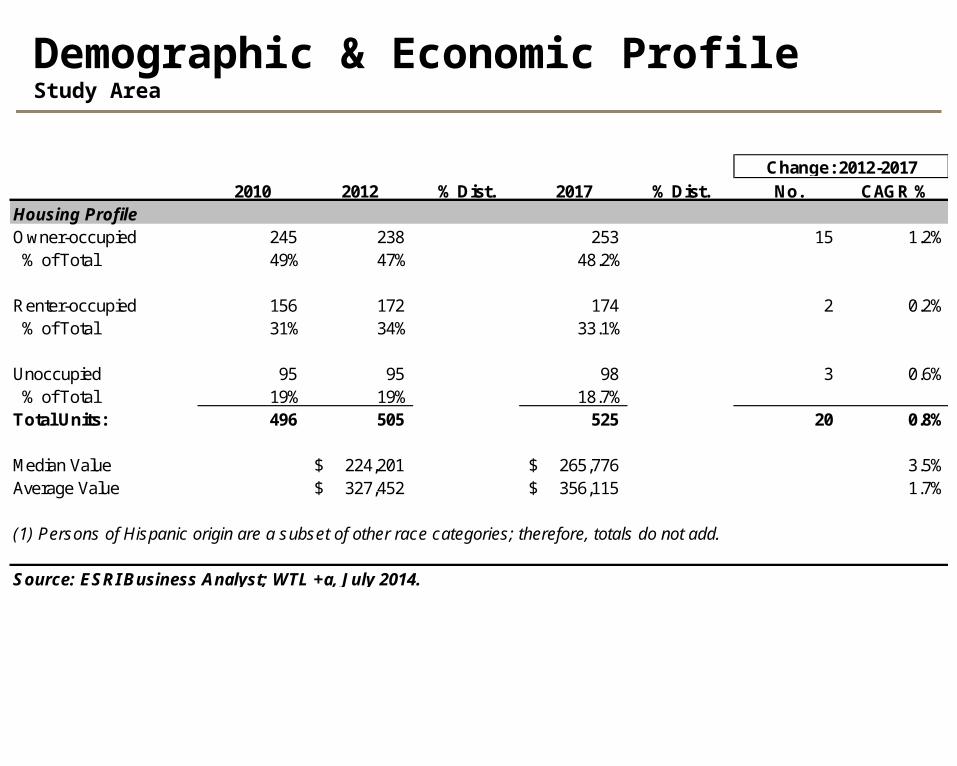
Demographic & Economic ProfileStudy Area
2010 2012 % Dist. 2017 % Dist. No. CAGR %Housing ProfileOwner-occupied 245 238 253 15 1.2% % of Total 49% 47% 48.2%
Renter-occupied 156 172 174 2 0.2% % of Total 31% 34% 33.1%
Unoccupied 95 95 98 3 0.6% % of Total 19% 19% 18.7%Total Units: 496 505 525 20 0.8%
Median Value 224,201$ 265,776$ 3.5%Average Value 327,452$ 356,115$ 1.7%
(1) Persons of Hispanic origin are a subset of other race categories; therefore, totals do not add.
Source: ESRI Business Analyst; WTL +a, July 2014.
Change: 2012-2017

Demographic & Economic ProfileAnnual Household Spending, 2012
City of Study Delray Beach Area
Total Households (2012) 27,247 410
Apparel & Accessories
Men's Wear 252$ 310$
Women's Wear 437 529
Children's Wear 241 305
Footwear 192 234
Watches & Jewelry 145 179
Apparel Products & Services 145 175
Subtotal: 1,413$ 1,732$
Computers
Computers & Hardware 191$ 234$
Software & Accessories 41 51
Subtotal: 232$ 285$
Entertainment & Recreation
Membership Fees for Clubs 159$ 194$
Fees for Participant Sports 114 139
Admission to Movie/Theatre/Opera/Ballet 147 184
Admission to Sporting Events 58 75
Fees for Recreational Lessons 105 138
Dating Services 0 1
Subtotal: 584$ 730$
TV/Video/Audio
Cable & Satellite TV Services 837$ 952$
Televisions 151 184
Satellite Dishes 1 2
VCRs, Video Cameras & DVD Players 12 15
Miscellaneous Video Equipment 8 10
Video Cassettes & DVDs 33 41
Video Game Hardware/Accessories 24 31
Video Game Software 27 35
Streaming/Downloaded Video 3 5
Rental of Video Cassettes & DVDs 25 32
Installation of Televisions 1 1
Audio 104 132
Rental & Repair of TV/Radio/Audio 4 5
Subtotal: 1,232$ 1,444$
City of StudyDelray Beach Area
Other Entertainment
Pets 599$ 690$
Toys & Games 126 157
Recreational Vehicles & Fees 196 238
Sports/Recreation/Exercise Equipment 139 175
Photo Equipment & Supplies 71 90
Reading 150 172
Catered Affairs 23 31
Subtotal: 1,304$ 1,553$
Food & Alcohol
Food at Home 4,721$ 5,517$
Food Away from Home 2,995 3,629
Alcoholic & Non-alcoholic Beverages 954 1,147
Subtotal: 8,671$ 10,293$
Household Furnishings & Equipment
Household Textiles 100$ 119$
Furniture 449 556
Floor Coverings 23 28
Major Appliances 260 299
Housewares 61 73
Small Appliances 43 49
Luggage 8 10
Telephones & Accessories 45 57
Lawn & Garden 410 444
Housekeeping Supplies 673 774
Maintenance & Remodeling Materials 246 288
Subtotal: 2,318$ 2,697$
Health & Personal Care
Non- & Prescription Drugs 605$ 637$
Optical 79 92
Personal Care Products 425 501
School Supplies 172 213
Smoking Products 456 519
Subtotal: 1,737$ 1,962$
TOTAL:
Total Annual Spending 476,571,555$ 8,485,631$
Per Household 17,491$ 20,697$
As % of Average HH Income 22.0% 26.0%

Demographic & Economic ProfileCounty Employment Trends, 1995-2014
Industry Sector 1995 2000 2005 Amount CAGR % 2007 2009 2011 2012 2013 Amount CAGR %In 000sMining & Logging - - - - - - - - 0.2 0.2 Construction 26.7 34.9 45.2 18.5 5.4% 45.5 27.6 23.3 24.3 25.7 (19.8) -9.1%Manufacturing 26.7 28.8 19.9 (58.1) -2.9% 19.2 16.3 14.9 15.4 15.7 (3.5) -3.3%Transp/Comm/Trade/Utilities 78.0 94.4 103.6 89.5 2.9% 106.8 97.3 97.7 99.9 101.4 (5.4) -0.9%Trade Wholesale 14.1 17.5 22.3 8.2 4.7% 23.9 21.8 21.0 21.4 21.6 (2.3) -1.6% Retail 56.6 68.6 72.0 15.4 2.4% 73.3 66.6 67.9 69.5 70.6 (2.7) -0.6%Information 9.3 12.4 11.1 1.8 1.8% 11.0 9.5 9.1 9.2 9.2 (1.8) -2.9%Financial Activities 28.1 36.7 40.0 11.9 3.6% 40.7 35.2 36.1 36.9 37.5 (3.2) -1.4%Services Professional & Business 38.7 77.4 95.9 40.2 9.5% 97.3 83.3 87.0 91.2 93.3 (4.0) -0.7% Education/Health Services 55.7 64.4 75.6 24.8 3.1% 78.8 80.1 82.9 83.2 83.1 4.3 0.9% Leisure & Hospitality 50.8 58.0 69.6 47.5 3.2% 73.2 68.3 70.0 73.3 75.5 2.3 0.5% Other Services 22.1 25.0 28.2 6.1 2.5% 28.2 27.0 27.6 28.4 24.0 (4.2) -2.6%Government 51.2 57.0 64.9 13.7 2.4% 66.5 65.8 62.5 62.0 61.3 (5.2) -1.4%
Total (In 000s): 458.0 575.1 648.3 190.3 3.5% 664.4 598.8 600.0 614.7 619.0 (45.4) -1.3%
Change During Period: 117.1 73.2 16.1 (65.6) 1.2 14.7 4.3
Change: 1995-2005 Change: 2007-2013

Demographic & Economic ProfileCounty Employment Forecasts, 2010-2020
Employment Category 2013 % Dist. 2021 % Dist. Total CAGR
Agriculture/Mining/ConstructionAgriculture 6,580 5,971 (609) -1.2%Mining 200 239 39 0.0%Construction 25,670 34,439 8,769 3.7%
Subtotal: 32,450 5.5% 40,649 6.1% 8,808 2.9%
Manufacturing Durable Goods Manufacturing 11,113 12,268 1,155 1.2% Non-Durable Goods Manufacturing 4,599 4,322 (277) -0.8%
Subtotal: 15,712 2.7% 16,590 2.5% 878 0.7%
Transportation/Communications/Public UtilitiesPublic Utilities 1,443 1,546 103 0.9%Transportation & Warehousing 7,637 8,134 497 0.8%
Subtotal: 9,080 1.5% 9,680 1.4% 600 0.8%
Wholesale & Retail TradeWholesale Trade 21,643 24,463 2,820 1.5%Retail Trade 70,628 77,779 7,151 1.2%
Subtotal: 92,271 15.7% 102,242 15.3% 9,971 1.3%
Change: 2013-2021

Demographic & Economic ProfileCounty Employment Forecasts, 2010-2020
Employment Category 2013 % Dist. 2021 % Dist. Total CAGR
Information 9,227 1.6% 9,579 1.4% 352 0.5%
Finance/Insurance/Real EstateFinance & Insurance 22,955 24,182 1,227 0.7%Real Estate, Rental & Leasing 14,517 16,861 2,344 1.9%
Subtotal: 37,472 6.4% 41,043 6.1% 3,571 1.1%
ServicesProfessional, Scientific & Technical Services 40,948 50,362 9,414 2.6%Management of Companies & Enterprises 8,758 9,739 981 1.3%Administrative & Waste Management 43,546 51,040 7,494 2.0%Educational Services 8,655 11,025 2,370 3.1%Health Care & Social Assistance 74,403 90,272 15,869 2.4%Arts, Entertainment & Recreation 15,984 18,734 2,750 2.0%Accommodation & Food Services 59,540 66,892 7,352 1.5%Other Services (Except Government) 24,035 26,039 2,004 1.0%
Subtotal: 275,869 47.0% 324,103 48.4% 48,234 2.0%
Government 61,265 10.4% 68,809 10.3% 7,544 1.5%
Self-Employed & Unpaid Family Workers 53,046 9.0% 57,421 8.6% 4,375 1.0%
TOTAL: 586,392 670,116 83,724 1.7%Annual Increase (Rounded): 10,500
Change: 2013-2021
Source: Florida Agency for Workforce Innovation; WTL +a, July 2014.

Demographic & Economic ProfileCity of Delray Beach Businesses & Employment, 2012
NAICS Category No. % of Total No. % of Total
Mining & Natural Resources 143 2.1% 439 1.3%Construction 399 5.7% 2,302 6.6%Manufacturing 193 2.8% 1,140 3.3%Transportation & Warehousing 142 2.0% 600 1.7%Communications 56 0.8% 207 0.6%Utilities 17 0.2% 64 0.2%Wholesale & Retail Trade 1,294 18.6% 9,369 27.0%
Wholesale 333 1,300 Retail 961 8,069 - Home Improvement 40 332 - General Merchandise 11 419 - Food Stores 86 877 - Auto Dealers/Gas Stations 90 1,435 - Apparel & Accessory Stores 91 284 - Furniture/Home Furnishings 107 418 - Eating & Drinking Places 244 1,556 - Miscellaneous & Non-store Retail 292 2,748
Finance/Insurance/Real Estate 703 10.1% 2,895 8.3%Services 3,990 57.2% 15,822 45.5%
- Hotel/Lodging 33 581 - Automotive Services 136 433 - Motion Pictures & Amusements 179 786 - Health Services 564 2,981 - Legal Services 122 396 - Educational Institutions 62 1,696 - Other Services 2,894 8,949
Government 38 0.5% 1,903 5.5%TOTAL: 6,975 100.0% 34,741 100.0%
City of Delray Beach:2012 Total Employment: 34,741 As % of County Employment 5.9%
2012 Population: 60,243 Jobs/Population Ratio: 0.58
Source: ESRI Business Analyst; Dun & Bradstreet, Inc.; WTL +a, July 2014
Businesses Employees

Demographic & Economic ProfileCity of Delray Beach Businesses & Employment, 2012
% of Total % Share of % of Total % Share of Study Area City Study Area City
NAICS Category No. Businesses by Type No. Employees by Type
Mining & Natural Resources 4 2.0% 2.8% 6 0.7% 1.4%Construction 13 6.4% 3.3% 54 6.7% 2.3%Manufacturing 5 2.5% 2.6% 9 1.1% 0.8%Transportation & Warehousing 4 2.0% 2.8% 11 1.4% 1.8%Communications 1 0.5% 1.8% 1 0.1% 0.5%Utilities 1 0.5% 5.9% 1 0.1% 1.6%Wholesale & Retail Trade 41 20.2% 3.2% 242 30.1% 2.6%
Wholesale 8 17 Retail 33 225 - Home Improvement 1 6 - General Merchandise - - - Food Stores 1 48 - Auto Dealers/Gas Stations 3 66 - Apparel & Accessory Stores 3 6 - Furniture/Home Furnishings 6 15 - Eating & Drinking Places 7 33 - Misc & Non-store Retail 12 52
Finance/Insurance/Real Estate 19 9.4% 2.7% 64 8.0% 2.2%Services 115 56.7% 2.9% 408 50.8% 2.6%
- Hotel/Lodging 1 8 - Automotive Services 4 16 - Motion Pictures & Amusemts 6 17 - Health Services 15 63 - Legal Services 4 7 - Educational Institutions 2 82 - Other Services 83 216
Government - 0.0% 0.0% 7 0.9% 0.4%TOTAL: 203 100.0% 2.9% 803 100.0% 2.3%
North Federal Highway Study Area Analysis:
2012 Total Employment: 803
As % of City-Wide Employment 2.3%
2012 Population: 759
Jobs/Population Ratio: 1.06
EmployeesBusinesses

Demographic & Economic ProfileCity of Delray Beach: Retail “Recapture” Opportunities
Demand Supply "Recapture"
Retail Category (HH Spending) (Store Sales) Opportunity
General Merchandise Stores
Department Stores Excl Leased Depts. 39,949,545$ 54,628,645$ (14,679,100)$
Other General Merchandise Stores 68,269,834 8,073,860 60,195,974
Subtotal: 108,219,379$ 62,702,505$ 45,516,874$
Clothing & Accessories Stores
Clothing Stores 33,696,863$ 20,814,383$ 12,882,480$
Shoe Stores 5,600,293 5,927,795 (327,502)
Jewelry, Luggage, Leather Stores 5,480,136 3,061,927 2,418,209
Subtotal: 44,777,292$ 29,804,105$ 14,973,187$
Furniture & Home Furnishings Stores
Furniture Stores 8,575,969$ 10,691,276$ (2,115,307)$
Home Furnishing Stores 7,843,822 26,210,712 (18,366,890)
Subtotal: 16,419,791$ 36,901,988$ (20,482,197)$
Electronics & Appliance Stores
Appliances, TVs, Electronics Stores 18,526,082$ 8,063,787$ 10,462,295$
Subtotal: 18,526,082$ 8,063,787$ 10,462,295$
Leisure & Entertainment
Sporting Goods Stores 10,104,651$ 11,313,438$ (1,208,787)$
Books, Periodicals & Music 4,699,737 3,561,074 1,138,663
Subtotal: 14,804,388$ 14,874,512$ (70,124)$
Food Services & Drinking Places
Full-Service Restaurants 34,151,987$ 48,733,318$ (14,581,331)$
Limited-Service Eating Places 29,837,361 20,591,965 9,245,396
Special Food Services 2,748,200 2,764,146 (15,946)
Drinking Places -Alcoholic Beverages 4,902,345 12,792,607 (7,890,262)
Subtotal: 71,639,893$ 84,882,036$ (13,242,143)$

Demographic & Economic ProfileCity of Delray Beach: Retail “Recapture” Opportunities
Demand Supply "Recapture"
Retail Category (HH Spending) (Store Sales) Opportunity
Food & Beverage Stores
Grocery Stores 107,825,925$ 72,730,801$ 35,095,124$
Specialty Food Stores 2,971,821 5,000,766 (2,028,945)
Beer, Wine & Liquor Stores 4,748,198 3,620,203 1,127,995
Subtotal: 115,545,944$ 81,351,770$ 34,194,174$
Health & Personal Care Stores
Health & Personal Care Stores 57,233,703$ 123,854,661$ (66,620,958)$
Subtotal: 57,233,703$ 123,854,661$ (66,620,958)$
Building Material, Garden Equipment Stores
Building Materials & Supplies 19,889,370$ 23,841,250$ (3,951,880)$
Lawn & Garden Equipment & Supplies 3,257,464 1,416,666 1,840,798
Subtotal: 23,146,834$ 25,257,916$ (2,111,082)$
Miscellaneous Store Retailers
Florists 836,985$ 1,682,071$ (845,086)$
Office Supplies, Stationery, Gift Stores 5,959,525 31,360,233 (25,400,708)
Used Merchandise Stores 1,438,314 2,714,888 (1,276,574)
Other Miscellaneous Retail Stores 10,320,047 19,046,483 (8,726,436)
Subtotal: 18,554,871$ 54,803,675$ (36,248,804)$
TOTAL:
HH Demand vs. Retail Sales 488,868,177$ 522,496,955$ (33,628,778)$
(2)

Real Estate Market ConditionsHousing Profile
Amount % Amount %Unoccupied Housing Units By StatusUnoccupied for Other Reasons
Rented (Not Occupied) 1,201 20% 19 20%For Sale Only 721 12% 23 25%Sold (Not Occupied) 96 2% 3 3%Seasonal/Recreational 3,898 66% 48 52%For Migrant Workers 1 0% - 0%
Subtotal: 5,917 72% 93 78%True Vacancies
Other Vacant 1,096 48% 8 30%Vacant, For Rent 1,201 52% 19 70%
Subtotal: 2,297 28% 27 23%
Total Unoccupied Units: 8,214 120
TRUE VACANCY:
Vacant Units 2,297 27
True Vacancy Rate 6.5% 5.3%
City of Delray Beach Study Area

Real Estate Market ConditionsHousing Profile
Amount % Amount %Housing Units By Structure
Detached 13,325 38% 195 38%Attached 3,307 9% 102 20%2 Units 1,243 4% 46 9%3 or 4 Units 4,615 13% 26 5%5 to 9 Units 2,875 8% 71 14%10 to 19 Units 3,155 9% 27 5%20 to 49 Units 3,019 9% 46 9%50+ Units 3,281 9% - 0%Mobile Home/Other 267 1% - 0%
Total Units: 35,087 100% 513 100% Group Quarters Population
College Housing - 0% - 0%Military Quarters - 0% - 0%Correctional - 0% - 0%Juvenile 5 0% - 0%Nursing Home 575 2% - 0%Other Facilities 563 2% 1 0%Non-group Quarters 33,944 97% 512 100%
Total Units: 35,087 100% 513 100%% of Population in Group Quarters: 3.3% 0.2%
Source: Nielsen Claritas 2014 Estimates; American Community Survey; WTL+a, July 2014.
City of Delray Beach Study Area

Real Estate Market ConditionsHousing Starts, 2004-2013
Municipality 2005 2006 2007 2008 2009 2010 2011 2012 2013 All Starts Ann'l Avg.Delray BeachSingle-family Units 319 116 113 38 28 21 54 44 153 886 98 Multi-family Units
2-Unit MF Structures 4 8 - - - - - - 2 14 1.6 3- & 4-Unit MF Structures - 4 3 - - - 4 - 4 15 1.7 5+ Unit MF Structures 40 252 90 55 217 144 62 517 - 1,377 153
Subtotal: 44 264 93 55 217 144 66 517 6 1,406 156
TOTAL-Delray Beach: 363 380 206 93 245 165 120 561 159 2,292 255 As % of Palm Beach County 3% 5% 7% 4% 17% 11% 5% 12% 3% 5%
Change: 2005-2013

Real Estate Market ConditionsMarket Performance of Selected MF Complexes
Year BuiltClass & Current Unit No. of Size Monthly Rent
Project/Location Height Vacancy Type Units (In SF) Rent Per SF
1. The Franklin 2013 7.8% 1 BR 48 866 1,733$ 2.00$ 320 Franklin Club Drive Class A 2 BR 92 1,469 1,970 1.34 Delray Beach 3 floors 3 BR 40 1,616 2,377 1.47
180 1,341 1,997$ 1.49$
2. Worthing Place 2010 5.1% 1 BR 81 1,002 1,908$ 1.90$ 32 SE 2nd Avenue Class A 2 BR 128 1,214 2,779 2.29 Delray Beach 6 floors 3 BR 8 1,390 3,088 2.22
217 1,141 2,465$ 2.16$
3. Water's Edge @ Delray 1998 0.0% 1 BR 56 905 1,144$ 1.26$ 500 North Congress Avenue Class A 2 BR 84 1,083 1,257 1.16 Delray Beach 3 floors 3 BR 8 1,227 1,400 1.14
148 1,023 1,222$ 1.19$

Real Estate Market ConditionsMarket Performance of Selected MF Complexes
Year BuiltClass & Current Unit No. of Size Monthly Rent
Project/Location Height Vacancy Type Units (In SF) Rent Per SF
4. Blu Atlantic 2014 6.4% 1 BR 46 768 1,219$ 1.59$ 5550 Nepsa Way Class A 2 BR 88 1,080 1,459 1.35 Delray Beach 3 floors 3 BR 37 1,303 1,699 1.30
171 1,044 1,446$ 1.38$
5. Alta Congress 2013 19.0% Studio 1 537 1,195$ 2.23$ 250 Congress Park Drive Class A 1 BR 98 760 1,355 1.78 Delray Beach 4 floors 2 BR 189 1,200 1,858 1.55
3 BR 81 1,446 2,435 1.68 369 1,135 1,849$ 1.63$
Selected MF Rentals - Delray Beach Studio 1 537 1,195$ 2.23$ 1 BR 329 860 1,472 1.71 2 BR 581 1,209 1,865 1.54 3 BR 174 1,396 2,200 1.58
Total/Weighted Average: 1,085 1,137 1,796 1.58$

Real Estate Market ConditionsAll Workplace Uses, 2014
Total Net CurrentAbsorption (In SF) Average
No. of Bldgs. Inventory (In SF) In SF % Vacant 2006-1Q/2014 Lease Rate
Retail 439 5,167,230 218,993 4.2% (24,162) 27.05$
Office 301 2,994,576 793,379 26.5% (677,345) 21.76$
Without Office Depot Closing (227,345)
Industrial 166 2,573,437 233,217 9.1% (177,881) 6.81$
Citywide Total: 906 10,735,243 1,245,589 11.6% (879,388)
Source: CoStar, Inc.; WTL+a, July 2014.
Inventory Vacancy

Real Estate Market ConditionsOffice Market Performance, 2006-2014
2006 2007 2008 2009 2010 2011 2012 2013 1Q/2014 Total Ann'l Avg. %City of Delray BeachInventory 3,130,115 3,128,015 3,128,015 3,062,773 3,094,923 3,094,923 3,073,278 2,994,576 2,994,576 (135,539) No. of Buildings 315 314 314 304 304 304 302 301 301 (14) Vacant Stock (1) 261,402 384,545 555,343 1,076,355 1,003,790 951,752 898,095 786,852 793,379 531,977 Vacancy Rate 8.4% 12.3% 17.8% 35.1% 32.4% 30.8% 29.2% 26.3% 26.5% 15.5%Total Net Absorption (1) (9,829) (125,243) (170,798) (586,254) 104,715 52,038 32,012 32,541 (6,527) (677,345) (82,102) Without Closing of Office Depot (25,261) Years of Positive Net Absorption Only 55,327 Construction Deliveries - - - - - - - - - - Average Rental Rate (2) 23.46$ 23.25$ 22.57$ 23.23$ 22.70$ 21.24$ 21.04$ 21.10$ 21.76$ -1.1%
Years to Stabilized (95%) Occupancy:
Years of Positive Net Absorption Only 13.6
Change: 2006-1Q/2014

Real Estate Market ConditionsRetail Market Performance, 2006-2014
2006 2007 2008 2009 2010 2011 2012 2013 1Q/2014 Total Ann'l Avg. %
Inventory 5,167,452 5,258,917 5,375,650 5,228,517 5,250,488 5,254,452 5,180,664 5,178,256 5,167,230 (222) No. of Buildings 466 467 473 451 447 448 444 441 439 (27) Total Available Space (1) 263,881 208,270 434,607 470,910 486,449 442,185 363,447 337,024 339,454 75,573 Vacancy Rate 5.1% 4.0% 8.1% 9.0% 9.3% 8.4% 7.0% 6.5% 6.6% 3.7%Total Net Absorption (1) (58,076) 149,155 (115,230) (138,801) 55,630 13,250 46,169 34,039 (10,298) (24,162) (2,929) Years of Positive Net Absorption Only 59,649 Construction Deliveries - - - - - - - - - - Average Rental Rate (2) 24.04$ 24.46$ 24.63$ 24.15$ 21.07$ 15.63$ 17.50$ 23.37$ 27.05$ 1.7%
Years to Stabilized (95%) Occupancy:
Based on Average Annual Absorption (Years with Positive Absorption, Only) 5.4
Change: 2006-1Q/2014