Embed Size (px)
Citation preview
North East Vision 2020: A Reality Check Gorky Chakraborty1
Look East Policy (LEP) has been India’s grandiose design to re‐orient its place in the
post‐Soviet world order. This policy, albeit without a white paper has been seamlessly
entwined with many different dimensions, foreign policy, trade, defence, security, strategic,
to name a few. Programmatically, ‘Look East’ meant looking eastward for fostering newer
ties with the immediate neighbours of South East Asia. North East India offered the alibi for
realising such aspirations. Ironically, although the LEP in its present form got initiated during
1991, it was only in 2008 that North East India appeared in related policy formulation with
the launch of NER Vision Document 2020. This document identified the problems of the
region to the post‐partition (1947) peripheral‐trap of North East which isolated the region
and exacerbated its socio‐economic backwardness vis‐a‐vis ‘mainland’ India. Infrastructure
development, border trade and better governance are highlighted as the way out for
ushering inclusive growth in the region. This paper analyses these aspects of the Vision
Document and its recommended modus operandi for changing the economic situation of
NER by comparing it with the present ‘reality’ of the region. But what are the macro‐
economic indicators of the region? What can be the volume of trade with its present basket
of tradable items? Can the flourishing informal trade be formalised? Is the region capable of
generating its own financial resources? Will these peripheries be ‘partners’ or ‘passages’ for
economic co‐operation? The paper thereby assess the role of North East in India’s Look East
Policy
I Introduction
For a region and its people who paid enormous price in terms of insurgency, turmoil
and dislocation1 to make sure that their voices are heard, if not understood, at the corridors
of power, a ‘vision’ for their growth and development must have been an important
recognition. The document named “North Eastern Region: Vision 2020”(henceforth referred
as vision document) launched during July 2008 emphasises six development components,
namely, self‐governance and participatory development, creation of development
opportunities, developing sectors with comparative advantage, capacity building of people
and institutions, create hospitable climate for investment and building infrastructure
through public investments2. The 600 pages of the vision document spread over three
volumes emphasizes increase in connectivity and creation of employment opportunities
through state investment in infrastructure and reiterates that private investment is to be
encouraged in natural resource harnessing, agriculture and tourism3.
What is stated above as a development agenda is perhaps nothing new in terms of
policy prescription but what sounds to be a departure from the stereotypical framework of
analogy of the Indian state seems the recognition that NER was entrapped within a
territorial bound during the post‐partition period which had adverse consequences for the
region. This adversity, according to the Vision Document, has to be minimised through
1Associate Professor, Institute of Development Studies Kolkata (IDSK), Salt Lake, Kolkata
border trade with the neighbouring countries. It categorically states that border trade will
increase the livelihood prospects for agricultural producers, traders and small business
people as well as end the geo‐political isolation of the region4. Moreover, in terms of the
cultural arena, the document accepts that the people of the North East not only have a
unique culture but also have commonality with the people in the neighbouring countries.
Accordingly, initiatives should be taken for promotion of tourism, communication, trade
fairs and sporting events for greater contacts among people within the extended region5.
The vision document expresses optimism that its agenda for development will elevate NER
to the position of national economic eminence that it occupied during the time of
independence. A process of inclusive growth through inclusive governance will change the
socio‐economic condition for the better. Economic prosperity will improve the life of the
people and therefore insurgency can be minimised. Thus, NER will become the arrowhead
of India’s Look East Policy.
But can the region’s engagement with its neighbours in the sphere of trade and
commerce improve the life of its people? What are the economic fundamentals of the
region which can maximise gains through trade? Does the macro‐economic trend of the
region suggest some positive trends which can be sustained through the agenda spelt in the
vision document? This paper intends to understand these questions in the backdrop of the
vision document. An outline of the macro‐economic trends of the NER is analysed briefly in
the next section. The issue of border trade of the region with Bangladesh and Myanmar are
analysed thereafter. Aspects related with poverty, human development, infrastructure and
the grant of resources from the Central to the State governments are dealt with in the
subsequent section. The paper concludes by briefly comparing the vision agenda with the
economic reality in contemporary NER and highlights the difference between the intent and
practice so far.
II Macro‐Economic Indicators of North East India
The overall economic foundation of NER is analysed through selective macro‐
economic indicators e.g. the Absolute and Per Capita growth rates of NSDP (Net State
Domestic Product), the composition of different sectors and accompanying sub‐sectors that
contribute to NSDP and their changes over the years. What has been the unemployment
pattern in NER? Is it similar to the Indian scenario? In our analysis various secondary sources
have been used, namely, EPW’s Domestic Product of the States in India, 51st, 55th and the
61st Rounds survey of NSSO, Census of India, North Eastern Council Basic Statistics and the
North Eastern Development Finance (NEDFi) Data Bank.
a) Trends in Absolute NSDP
Absolute NSDP figures are at constant prices. The overall growth rate of the seven
states and the region are given in Table I. Growth rates are considered in four time periods,
from 1980‐81 to 1990‐91 (the pre‐liberalization period), 1991‐92 to 1999‐2000 (the first
decade under liberalization), thirdly for the entire time period from 1980‐81 to 2005‐06 and
then for the post‐liberalization phase from 1991‐92 to 2005‐06.
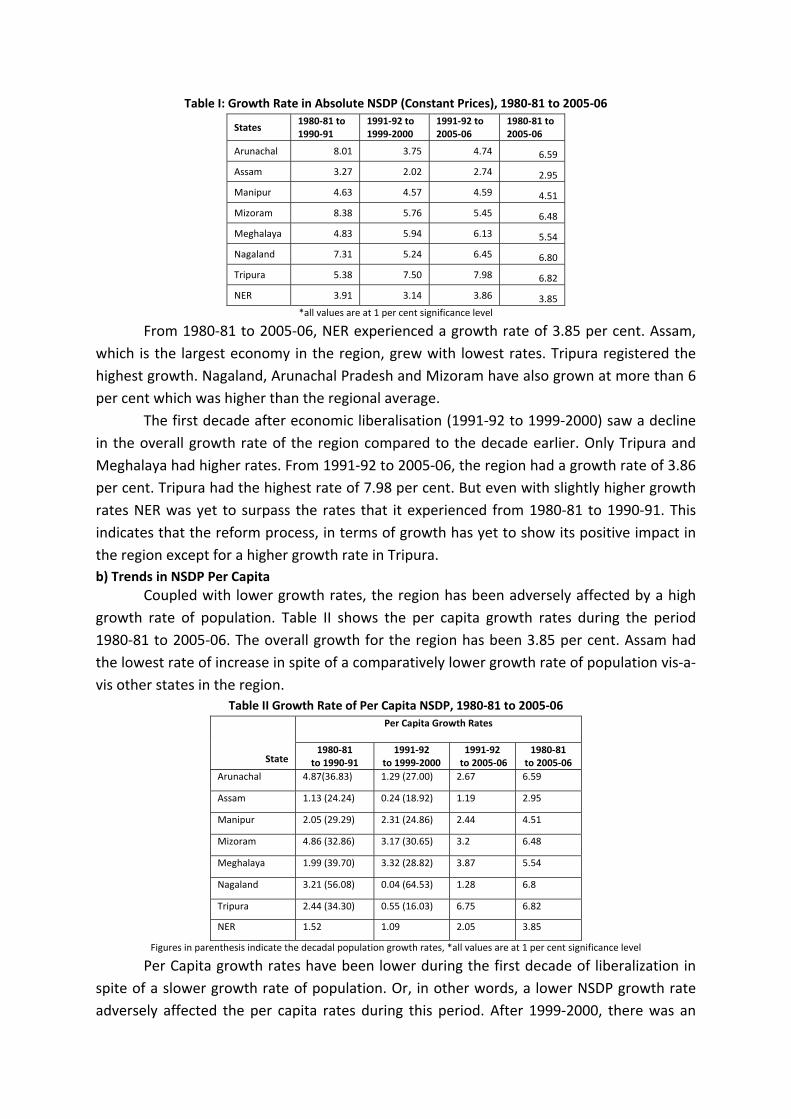
Table I: Growth Rate in Absolute NSDP (Constant Prices), 1980‐81 to 2005‐06
States 1980‐81 to 1990‐91
1991‐92 to 1999‐2000
1991‐92 to 2005‐06
1980‐81 to 2005‐06
Arunachal 8.01 3.75 4.74 6.59
Assam 3.27 2.02 2.74 2.95
Manipur 4.63 4.57 4.59 4.51
Mizoram 8.38 5.76 5.45 6.48
Meghalaya 4.83 5.94 6.13 5.54
Nagaland 7.31 5.24 6.45 6.80
Tripura 5.38 7.50 7.98 6.82
NER 3.91 3.14 3.86 3.85
*all values are at 1 per cent significance level
From 1980‐81 to 2005‐06, NER experienced a growth rate of 3.85 per cent. Assam,
which is the largest economy in the region, grew with lowest rates. Tripura registered the
highest growth. Nagaland, Arunachal Pradesh and Mizoram have also grown at more than 6
per cent which was higher than the regional average.
The first decade after economic liberalisation (1991‐92 to 1999‐2000) saw a decline
in the overall growth rate of the region compared to the decade earlier. Only Tripura and
Meghalaya had higher rates. From 1991‐92 to 2005‐06, the region had a growth rate of 3.86
per cent. Tripura had the highest rate of 7.98 per cent. But even with slightly higher growth
rates NER was yet to surpass the rates that it experienced from 1980‐81 to 1990‐91. This
indicates that the reform process, in terms of growth has yet to show its positive impact in
the region except for a higher growth rate in Tripura.
b) Trends in NSDP Per Capita
Coupled with lower growth rates, the region has been adversely affected by a high
growth rate of population. Table II shows the per capita growth rates during the period
1980‐81 to 2005‐06. The overall growth for the region has been 3.85 per cent. Assam had
the lowest rate of increase in spite of a comparatively lower growth rate of population vis‐a‐
vis other states in the region. Table II Growth Rate of Per Capita NSDP, 1980‐81 to 2005‐06
State
Per Capita Growth Rates
1980‐81 to 1990‐91
1991‐92 to 1999‐2000
1991‐92 to 2005‐06
1980‐81 to 2005‐06
Arunachal 4.87(36.83) 1.29 (27.00) 2.67 6.59
Assam 1.13 (24.24) 0.24 (18.92) 1.19 2.95
Manipur 2.05 (29.29) 2.31 (24.86) 2.44 4.51
Mizoram 4.86 (32.86) 3.17 (30.65) 3.2 6.48
Meghalaya 1.99 (39.70) 3.32 (28.82) 3.87 5.54
Nagaland 3.21 (56.08) 0.04 (64.53) 1.28 6.8
Tripura 2.44 (34.30) 0.55 (16.03) 6.75 6.82
NER 1.52 1.09 2.05 3.85
Figures in parenthesis indicate the decadal population growth rates, *all values are at 1 per cent significance level
Per Capita growth rates have been lower during the first decade of liberalization in
spite of a slower growth rate of population. Or, in other words, a lower NSDP growth rate
adversely affected the per capita rates during this period. After 1999‐2000, there was an
increase in per capita rates due to the positive effects of lower population growth and
higher NSDP growth rates. Other than Nagaland (which shows the highest rate of decadal
population growth), all other states show a higher NSDP per capita during this period.
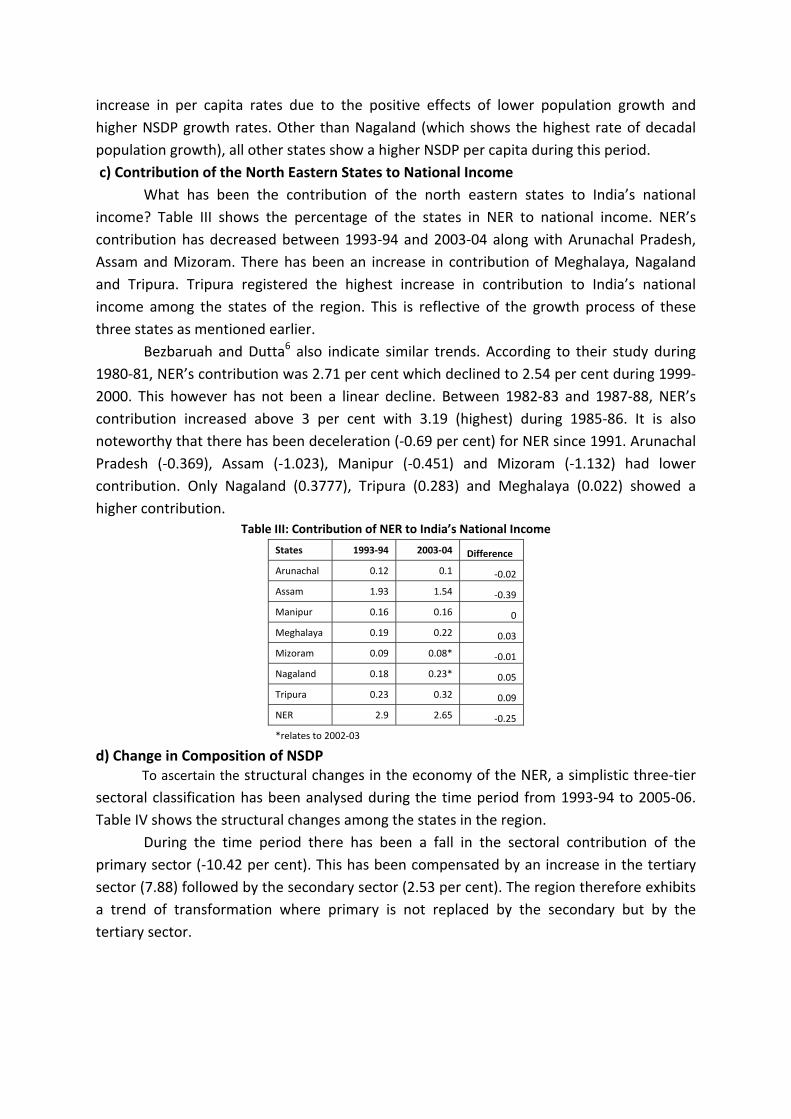
c) Contribution of the North Eastern States to National Income
What has been the contribution of the north eastern states to India’s national
income? Table III shows the percentage of the states in NER to national income. NER’s
contribution has decreased between 1993‐94 and 2003‐04 along with Arunachal Pradesh,
Assam and Mizoram. There has been an increase in contribution of Meghalaya, Nagaland
and Tripura. Tripura registered the highest increase in contribution to India’s national
income among the states of the region. This is reflective of the growth process of these
three states as mentioned earlier.
Bezbaruah and Dutta6 also indicate similar trends. According to their study during
1980‐81, NER’s contribution was 2.71 per cent which declined to 2.54 per cent during 1999‐
2000. This however has not been a linear decline. Between 1982‐83 and 1987‐88, NER’s
contribution increased above 3 per cent with 3.19 (highest) during 1985‐86. It is also
noteworthy that there has been deceleration (‐0.69 per cent) for NER since 1991. Arunachal
Pradesh (‐0.369), Assam (‐1.023), Manipur (‐0.451) and Mizoram (‐1.132) had lower
contribution. Only Nagaland (0.3777), Tripura (0.283) and Meghalaya (0.022) showed a
higher contribution. Table III: Contribution of NER to India’s National Income
States 1993‐94 2003‐04 Difference
Arunachal 0.12 0.1 ‐0.02
Assam 1.93 1.54 ‐0.39
Manipur 0.16 0.16 0
Meghalaya 0.19 0.22 0.03
Mizoram 0.09 0.08* ‐0.01
Nagaland 0.18 0.23* 0.05
Tripura 0.23 0.32 0.09
NER 2.9 2.65 ‐0.25
*relates to 2002‐03
d) Change in Composition of NSDP To ascertain the structural changes in the economy of the NER, a simplistic three‐tier
sectoral classification has been analysed during the time period from 1993‐94 to 2005‐06.
Table IV shows the structural changes among the states in the region.
During the time period there has been a fall in the sectoral contribution of the
primary sector (‐10.42 per cent). This has been compensated by an increase in the tertiary
sector (7.88) followed by the secondary sector (2.53 per cent). The region therefore exhibits
a trend of transformation where primary is not replaced by the secondary but by the
tertiary sector.
Table IV Percentage Change in Percentage Composition of
Sectoral Contribution to NSDP, 1993‐94 to 2004‐05
State Primary
Secondary Tertiary
Arunachal Pradesh ‐17.27 4.07 13.20
Assam ‐11.13 0.22 10.91
Manipur ‐9.93 8.91 1.02
Meghalaya 0.84 2.50 ‐3.34
Mizoram ‐8.95 4.45 4.49
Nagaland 11.55 ‐1.50 ‐10.05
Tripura ‐16.55 15.59 0.95
NER ‐10.42 2.53 7.88
Among the states three different trends were observed in terms of structural changes.
First, Arunachal Pradesh and Assam follow the regional trend where there has been a
significant reduction in the contribution of the primary sector. This is mainly compensated
by an increase in the tertiary sector followed by the secondary sector. On the other,
Nagaland and Meghalaya exhibit a reverse trend. Nagaland shows a noticeable increase in
the contribution of the primary sector with a significant fall in the tertiary sector. There was
also shrinkage in the secondary sector but at a much smaller scale. In Meghalaya, the
decline in the share of the tertiary sector has been mainly compensated by the secondary
sector and marginally by the primary sector. Thirdly, Tripura, Manipur and Mizoram show
another trend where a fall in the primary sector is mainly compensated by an increase in the
tertiary sector. In Mizoram, however, a decrease in the primary sector is equally
compensated by the other two sectors.
So there are diverse trends of sectoral changes among the states of NER and this has
to be considered while framing policies for development of the region.
e) Changes in the sub‐sectors’ contribution to the NSDP
There has been a decrease in the contribution of the primary sector and its sub‐
sectors in NER. Table V presents the sub‐sectoral details in the primary sector. Within the
primary sector, decrease in the contribution of agriculture has been highest compared to
the other sub‐sectors. Similar trends are observed in all the states of the region except
Nagaland and Meghalaya. In Nagaland there has been a marked increase in the share of
contribution of agriculture to the NSDP from 20.80 to 34.3 per cent while for Meghalaya
there has been an increase in the share of mining and quarrying from 3.38 to 8.66 per cent.
This has led to the rise in the share of primary sector for both these states. Table V: Contribution of Primary Sector to NSDP in NER, 1993‐94 & 2004‐05 (In percentage)
Sector/
State
Arunachal Assam Manipur Meghalaya Mizoram Nagaland Tripura NER
1 2 1 2 1 2 1 2 1 2 1 2 1 2 1 2
Primary* 48.3 31.1 48.0 36.9 37.8 27.9 32.0 32.8 33.2 24.2 25.8 37.4 38.0 21.4 43.8 33.4
Agr’ture 34.5 24.3 37.2 28.9 31.1 23.1 26.0 22.3 27.7 22.5 20.8 34.3 31.4 19.3 34.3 26.8
Frst & Log 11.4 4.30 2.19 1.78 3.54 1.87 1.46 1.20 3.71 0.58 4.63 2.48 2.70 1.12 2.83 1.74
Fishing 0.91 1.07 2.62 2.10 3.14 2.94 1.11 0.69 1.66 1.11 0.35 0.50 3.27 0.53 2.37 1.64
M & Q 1.41 1.34 5.97 4.12 ‐ ‐ 3.38 8.66 0.12 0.07 ‐ 0.09 0.61 0.46 4.31 3.18
1&2 indicates 1993‐94 &2004‐05, *Share of Primary Sector to total NSDP
Table VI shows the sub‐sectoral analysis of the secondary sector. The growth of the
secondary sector in NER is primarily led by an increase in the contribution of construction. It
is interesting to note that during 1993‐94, both construction and manufacturing contributed
equally in the region. But where the share of manufacturing has fallen significantly during
2004‐05, construction has surged ahead. The decrease in the share of manufacturing does
not augur well for the fundamentals of an economy.
Table VI: Contribution of Secondary Sector to NSDP in NER, 1993‐94 & 2004‐05 (In percentage)
Sector/
State
Arunachal Assam Manipur Meghalaya Mizoram Nagaland Tripura NER
1 2 1 2 1 2 1 2 1 2 1 2 1 2 1 2
Secon’ry* 21.3 25.4 13.3 13.5 15.7 24.6 11.8 14.4 9.45 13.9 12.2 10.7 8.1 23.7 13.1 15.6
Manuf. 3.12 2.27 8.42 7.80 7.39 8.88 2.57 2.65 2.74 0.86 3.0 0.65 3.27 1.57 6.85 5.57
Regd. ‐ ‐ 6.34 5.90 0.19 0.21 0.88 1.53 1.10 0.34 0.67 0.43 0.86 0.67 4.43 3.64
Unregd. 3.12 2.27 2.08 1.90 7.20 8.67 1.69 1.13 1.64 0.52 2.33 0.22 2.40 0.90 2.41 1.92
Const’on 20.2 22.5 4.95 5.62 7.31 15.7 7.55 11.2 7.09 11.8 8.1 10.7 6.72 20.3 6.27 9.70
Ele,Gs,WS ‐2.0 0.64 ‐0.1 0.17 1.03 0.05 1.77 0.48 ‐0.3 1.21 1.14 ‐0.7 ‐1.8 1.88 ‐ 0.39
1&2 indicates 1993‐94 &2004‐05, *Share of Secondary Sector to total NSDP
This trend is similarly reflected among majority of the states in the region. Only in
Manipur and marginally in the case of Meghalaya, there has been an increase in the
contribution of the manufacturing sector. Construction, on the other hand, shows a
completely different trend among all the states of the region. Tripura exhibits the highest
increase in share of construction followed by Manipur. The sub‐sector contribution of
electricity, gas and water supply is minimal and shows a negative trend indicating a higher
rate of depreciation compared to value addition.
Among the various sub‐sectors of the tertiary sector as shown in Table VII ‘other’
services including public administration have been the largest component, except Assam.
This has been a common pattern during the entire time period of our study. Public
expenditure, especially by the central government, plays a significant role in this category. In
other words, instead of market, the state plays an important role in increasing the
contribution of the tertiary sector. Trade, hotels and restaurants contribute the maximum
after the category of other services. It has been same for all the states in the region during
1993‐94 except Nagaland where transport, storage and communication happen to be the
second largest sub‐sector. It has remained similar in 2004‐05; the only change is that
Arunachal Pradesh has joined Nagaland in the growth of this sub‐sector. In Mizoram, real
estate, dwellings and business services have increased significantly during the time period
and is the second largest contributor in the tertiary sector. Financial services did not play an
important role in terms of a significant contribution to income of the states in the region.
Only in Assam it contributed 6 per cent of NSDP.
Table VII: Sectoral Contribution of Tertiary Sector to NSDP in NER, 1993‐94 & 2004‐05 (In percentage)
Sector/
State
Arunachal Assam Manipur Meghalaya Mizoram Nagaland Tripura NER
1 2 1 2 1 2 1 2 1 2 1 2 1 2 1 2
Tertiary* 30.3 43.5 38.5 49.5 46.4 47.4 56.1 52.7 57.3 61.8 61.9 51.8 53.7 54.7 43.0 50.9
Transp’t,
Sto’age,
Com’tion
3.60 8.18 2.45 5.76 3.43 4.97 3.31 5.22 1.13 2.12 16.5 17.8 4.53 9.58 3.60 6.91
Trade/
Hotel/
Resta’nt
6.64 3.86 17.7 17.8 12.1 9.23 14.7 15.7 16.4 9.28 6.17 5.37 16.9 11.2 15.9 14.4
B’nk, Ins 1.22 2.61 3.08 5.93 1.67 2.58 2.23 3.55 1.06 2.72 1.35 1.24 2.25 2.65 2.64 4.48
Real Este,
Dwel’ngsB
uss Serv
2.0 2.09 2.97 3.30 3.53 3.59 13.6 8.70 11.3 14.6 12.4 9.15 2.13 3.16 4.43
4.86
Pub Admn 9.62 14.9 5.51 6.47 13.6 14.2 13.6 11.5 15.2 19.8 18.1 11.9 12.8 14.2 8.33 9.76
Others
7.22 11.7 6.89 10.2 11.9 12.8 8.55 7.99 12.1 13.1 7.26 6.28 15.0 13.8 8.13 10.5
1&2 indicates 1993‐94 &2004‐05, *Share of Tertiary Sector to total NSDP
III Sectoral Contribution of Labour in NER In this section we deal with the workforce associated with each sector of the
economy in NER and its contribution to the NSDP. A comparative analysis of the sectoral
contribution and the workforce employed helps to understand the quality of growth in
various sectors. Table VIII provides the sectoral contribution of labour from 1993‐94 to
2004‐05.
It is observed that workforce engaged in the primary sector has declined marginally
in both rural and urban areas. But the contributions of primary sector to NSDP have
declined at a much higher rate. This suggests that the sectoral contribution in value terms
has declined with almost the same amount of workforce, which indicates that there is
disguised unemployment in the primary sector and a significant reduction in workforce
engaged here will in fact not reduce the output of this sector. In fact, it might augment
productivity of the sector. The secondary sector has increased its contribution to the NSDP
but has failed to create employment opportunities in the region. There has been a marginal
increase in rural workforce engaged in this sector while in urban areas there has been a
decline. On the other hand, although the tertiary sector grew at a higher rate compared to
the other sectors there has been a marginal increase in the workforce involved in this
sector, where the urban areas excelled over the rural areas.
It is therefore evident that in NER those sectors which had higher contribution to
NSDP failed to create employment opportunities in consonance with their growth while the
sector that contributed less failed to shed‐off the workforce involved. In this regard a
disaggregated analysis of each sector will be meaningful.
Table VIII: Contribution of Labour in NER, 1993‐94 to 2004‐05 (In percentage) Sector/Population/Year 1993‐94 1999‐2000 2004‐05
Primary
NSDP
43.82 39.65 33.40
RuralUrban
75.60 75.12 74.19
15.3 12.6 14.42
Secondary
NSDP
13.12 13.11 15.65
RuralUrban
6.2 5.8 7.37
14.7 12.7 14.0
Tertiary
NSDP
43.07 47.24 50.95
RuralUrban
18.2 19.2 18.4
70.2 74.6 71.6
Within the primary sector, contribution of agriculture and Mining & Quarrying
(M&Q) declined along with the workforce involved. But there are two trends here. While in
Nagaland, there has been a positive correlation between increase in contribution and
workforce involved in agriculture, in Manipur, there has been an inverse relationship i.e. the
contribution of agriculture declined, but workforce involved increased. Again, urban
workforce involved in agriculture increased in the region mainly due to an increase in
Arunachal Pradesh and Nagaland. On the other, M&Q has declined both in terms of
contribution and employment generation in NER. This sub‐sector is important only for
Assam and Meghalaya. In Assam there has been a decline in contribution as well as
employment over the years but in Meghalaya both have increased positively. It is also
observed that M & Q is located in urban areas in Assam whereas it is rural in Meghalaya i.e.
in Assam it is quarrying (supplies to the construction sector) and in Meghalaya it is mining. Table IX: Sub‐sectoral Composition of Labour in the Primary Sector (In percentage)
States Arunachal Assam Manipur Meghalaya Mizoram Nagaland Tripura NER
Sub‐sectors 1 2 3 1 2 3 1 2 3 1 2 3 1 2 3 1 2 3 1 2 3 1 2 3
Agriculture 35 32 24 37 34 29 31 26 23 26 27 22 28 22 23 21 28 34 31 25 19 34 31 27
Rural 87 83 82 79 68 75 64 76 70 87 87 83 89 86 87 76 80 79 48 46 43 76 75 74
Urban 8 9 11 3 1 1 29 28 28 3 1 0 41 30 36 6 8 13 6 3 4 14 12 14
M & Q 1 1 1 6 6 4 0 0 0 3 6 9 0.1 1 0 0 0 0 1 1 1 4 4 3
Rural 0 0 0 0 0 0 0 1 1 1 1 1 0 0 0 1 0 0 0 0 0 0 0 0
Urban 0 0 0 6 1 1 0 0 0 0 0 0 0.2 2 0 1 0 0 0 0 0 2 0 0
1, 2 &3 indicates 1993‐94, 1999‐2000 &2004‐05 (50th, 55
th & 61
st NSSO Rounds)
Table X: Sub‐sectoral Composition of Labour in the Secondary Sector (In percentage)
1, 2 &3 indicates 1993‐94, 1999‐2000 &2004‐05 (50th, 55
th & 61
st NSSO Rounds)
For NER, within the secondary sector, construction and manufacturing have failed to
create employment significantly. While in manufacturing there has been a decline for both
contribution and as well as employment, in construction an increase in NSDP contribution
has failed to generate employment except marginally in rural areas. The sub‐sector,
electricity, gas and water supply had little contribution to make in the region.
In Arunachal Pradesh, Assam and Tripura, a decline in contribution of the manufacturing
sector has been followed by a decline in workforce engaged in both rural and urban areas.
On the other, Mizoram and Nagaland exhibit an increase in workforce involved in
manufacturing in spite of a decline in their contribution. In Manipur, an increase in its
contribution has resulted in a decline in employment in rural areas and a marginal increase
in urban areas.
Among the states, manufacturing has shown a declining trend for all except Manipur in
terms of NSDP contribution. Workforce involved in this sector has declined in Arunachal
Pradesh, Assam and Tripura in both rural and urban areas. Meghalaya, Mizoram and
Nagaland exhibit an increase in workforce in manufacturing activities despite a fall in its
contribution to NSDP. In Manipur, contribution of the manufacturing sector has increased
with a substantial fall in rural employment and only a marginal rise in urban areas.
Although construction has contributed significantly in terms of NSDP among the states in
the region, yet in terms of employment it has hardly contributed significantly.
‘Other’ services contributed one fifth to one fourth of the NSDP in the tertiary sector
where public administration played the major role. Among the states it contributed one‐
fifth to one‐half of the NSDP. Workforce involved in this sub‐sector has declined over the
years but still it continued to be the most significant sector of employment generation,
particularly in the urban areas of NER. In Meghalaya more than 63 per cent of the total
urban workforce was engaged in this sub‐sector whereas in Arunachal Pradesh and Tripura
it was nearly 50 per cent. This shows the importance of government spending even in
tertiary sector of NER, which otherwise is supposed to be market‐driven.
States Arunachal Assam Manipur Meghalaya Mizoram Nagaland Tripura NER
Sub‐sectors 1 2 3 1 2 3 1 2 3 1 2 3 1 2 3 1 2 3 1 2 3 1 2 3
Manuf 3.1 2.8 2.3 8.4 8.5 7.8 7.4 8.3 8.9 2.6 2.1 2.6 2.7 1.2 0.9 3 0.8 0.6 3.3 1.9 1.6 6.8 6.2 5.6
Rural 0.8 2.8 0.4 3.5 4 3.1 12.3 7.4 8.6 1 0.7 3.7 0.5 1 0.9 0.2 0.6 2.1 5.4 4 5.1 3.4 2.9 3.4
Urban 13.3 0.4 3.6 10 7.2 9.8 14.4 11 14.8 2.2 3.8 6 4.4 3.8 5.2 4.1 6.2 6.6 8.7 3.7 7.8 8.2 5.1 7.7
E,G &WS ‐2 2.3 0.6 ‐0.1 ‐0.5 0.2 1 0.3 0.05 1.8 0.5 0.5 ‐0.4 0.7 1.2 1.1 0 ‐1 ‐2 0.2 1.9 0 ‐0 0.4
Rural 0.8 0.3 0.9 0.3 0.1 0.1 0.3 0 0 0.3 0 0.4 0.1 0 0 0.2 0.7 0.4 0.2 0 0 0.3 0.2 0.3
Urban 3.6 1.8 0.2 0.6 0.6 2.7 1.1 0 0 0.5 0.3 1.6 0.3 0 0 0.4 0.7 1.3 0.2 0.3 0.2 1 0.5 0.9
Constr 20.2 15 23 4.9 3.9 5.6 7.3 12 15.7 7.5 9.4 11 7.1 12 12 8.1 10 11 6.7 13 20.3 6.3 6.9 9.7
Rural 2.6 4.4 4 0.7 1.8 2.5 2.8 0.9 3.1 1.6 1.6 2.2 1.2 1.1 1 1.8 0.8 1.7 6.8 8 11.4 2.5 2.7 3.7
Urban 9.3 11 8.1 2.8 5.2 5.5 2.6 4.2 4.4 8 8 4.9 4.8 9.4 5.1 7.8 5.2 3.5 2.8 4.1 6.4 5.5 7.1 5.4
Trade, Hotels and Restaurant have been a declining yet significant contributor to the
NSDP in the region. The employment component of this sub‐sector was comparatively
higher especially in the urban areas. In these areas it has increased from 19.5 to 24.4 per
cent from 1993‐94 to 2004‐05 despite a fall in its contribution to the state’s income in the
region. Among the states, NSDP contribution of this sub‐sector has increased only in
Meghalaya with a significant fall in employment from 25.2 to 15.2 per cent in the urban
areas and a small increase in rural areas. Among the other states, trade, hotel and
restaurant have added to the employment generation process both in rural and urban areas
despite a falling contribution.
Transport, storage and communication have shown an increasing trend both in terms
of contribution to the NSDP and generation of employment in the region. It was similar for
all the north eastern states. Nagaland had the highest contribution from this sub‐sector
while Meghalaya had similar employment pattern in rural and urban areas for the people
involved in this sub‐sector. Assam had the highest employment in this sub‐sector comprising
13 per cent of the urban workforce in the state. In fact, it was the main source of
employment for the urban workforce in Assam (next to those engaged in the aggregated
sub‐sector “other services”).
Financial services exhibit a rising trend though these did not contribute much to the
state’s income. Except for Assam, where its contribution has risen to nearly 6 per cent of
NSDP, no other state earns sizeable contribution from this sub‐sector. In terms of
employment, this sub‐sector shows a lower employment generation vis‐à‐vis income
generation. In fact, rural employment is insignificant and the urban employment shows a
declining trend.
From the above analysis it is evident that agriculture continues to be the largest
employer in the rural areas of all the states in the region. In the urban areas, the broad
based aggregated sub‐sector termed ‘other’ services in the tertiary sector happen to be the
largest employer. Other than this, trade, hotels and restaurants happens to be the (second)
largest employer of the urban workforce in the region. Nowhere, manufacturing occupies a
significant position in employment generation in NER.
Table XI: Sub‐sectoral Composition of Labour in the Tertiary Sector (In percentage)
States
Sub‐sectors
Trade, Hot, Res R U
TransportStorage, Comn R U
Fin Srv R U
Other Srv R U
Arunachal
1 6.6 0.2 15 3.6 1.6 5.3 1.2 0.4 2.9 18.8 6.8 42.5
2 5.1 0.6 33.5 6.2 0.1 1 2.1 0.2 0.9 28.4 8.1 42.5
3 3.9 2.3 23.2 8.2 0.6 2.3 2.6 0.6 1.3 28.8 9.2 50.2
Assam
1 17.7 6.9 29 2.4 13 7.5 3.1 0.2 2 15.4 7.7 38.6
2 14.2 8.1 30 1.5 2.7 8.3 5.9 0.3 5.6 21.4 15 36.6
3 17.8 9 27.6 5.8 2.4 13 5.9 0.2 2.3 20 8.1 33.4
Manipur
1 12.2 4.5 13.7 3.4 1.5 3.1 1.7 0.9 2.2 29.1 14 33.3
2 11.2 3.7 19.9 3.5 1.4 3.6 1.7 0.2 1.2 32.3 11 31.2
3 9.2 6.6 20 5 2.1 4 2.6 0.2 1.3 30.6 9.5 27.3
Meghalaya
1 14.7 3.8 25.2 3.3 3.8 1.7 2.2 0 1.8 35.8 5.8 56.9
2 15 4.2 22.2 3.2 4.2 4.8 2.8 0.2 0.9 32.4 5 56.2
3 15.7 5.5 15.2 5.2 5.5 5 3.5 0 1.6 28.2 4.1 63.5
Mizoram
1 16.5 1.9 14.6 1.1 0.1 1.3 1.1 0.1 2 49.4 9 31.4
2 10.5 3 18.7 1.4 0.1 1.3 1.1 0.1 2 49.4 9 31.4
3 9.3 3.5 17.2 2.1 0.5 2.7 2.7 0.2 1.2 47.7 6.5 32.4
Nagaland
1 6.2 4.5 22 16.5 0.6 3.7 1.3 0 1.7 37.9 17 53.5
2 5.6 2.8 24.6 13.7 1.3 0.3 1.1 0.1 2.1 35.7 14 65.4
3 5.4 4.9 40.4 17.8 1.4 5.1 1.2 0.3 0.8 27.4 10 29.4
Tripura
1 17 10.7 17.3 4.5 3.2 6 2.2 0 3.9 30 26 53.8
2 15 12 25 4.4 2.3 4.9 2.4 0.1 2.8 33 28 57
3 11.2 10.9 27.2 9.6 3.7 4.3 2.6 0.2 2.1 20.9 12 44.5
NER
1 15.9 4.7 19.5 3.6 1.3 4.1 2.6 0.2 2.1 20.9 12 44.5
2 13.1 4.9 22.9 3 1.3 3.7 4.4 0.2 2.2 26.8 13 45.8
3 14.4 6.1 24.4 6.9 1.7 5.1 4.5 0.2 1.5 25.2 10 40.6
1, 2 &3 indicates 1993‐94, 1999‐2000 &2004‐05 (50th, 55
th & 61
st NSSO Rounds)
In such a scenario of skewed employment what is the quantum of unemployment in
the region. In the next section we deal with this issue in detail.
IV Unemployment in NER
Unemployment data generated by NSSO have been included in this analysis. The 50th
(1993‐94), 55th (1999‐2000) and 61st (2004‐05) rounds have been compared to understand
the unemployment scenario in NER vis‐à‐vis India. The three different categories of
unemployment 'the usual status (adjusted)’ indicating the number of persons unemployed
for a reference period of 365 days in both the usual principal and subsidiary status (ps+ss);
‘weekly status’ indicating persons who were unable to find work in a short period of 7 days
during the period of survey and ‘daily status’ indicating the unemployment scenario during
the day of the survey have been considered in this section along with unemployment among
youths (15‐29 age group) and educated among the states in North East India.
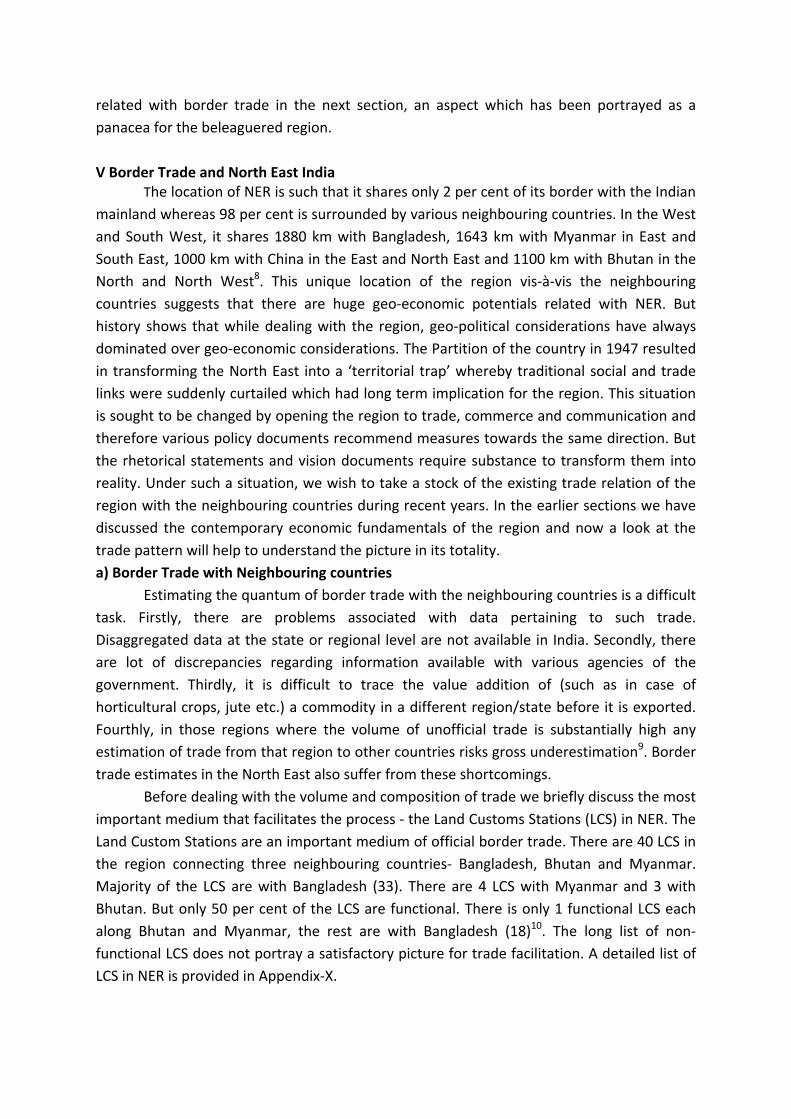
A comparative analysis of the usual status rural unemployment during the three
rounds in Figure‐I shows that there has been an increase in the rates for India whereas in
the North East there has been a steady decline (for the rates see Appendix‐I). But the rate in
the region continues to be higher than in India. In NER, Tripura, Assam and Nagaland
exhibited a higher rate compared to India. In fact, there has been a phenomenal increase in
Tripura which has inflated the average for the region. On the other, Figure‐II shows that the
scenario is opposite in the urban areas. There has been an increase in the rates of usual
urban unemployed in NER during the three survey rounds whereas the Indian rate has
remained the same (Appendix‐I & II). During 1993‐94, the urban rates were similar in NER
and India but thereafter these have increased steeply in the region. Similar to the rural
areas, Tripura also exhibits a trend of rapid increase in urban unemployed during 2004‐05.
Figure I: Usual Status (Adjusted) Unemployment in Rural Areas
Figure II: Usual Status (Adjusted) Unemployment in Urban Areas
It is usually agreed that when most of the people have regular wage employment,
the usual status and the weekly and/or daily status unemployment rates do not diverge.
This is usually the case among the advanced industrial nations. But in economies which are
comparatively less industrialised, these rates vary substantially7. Comparing the usual rates
of unemployment along with the weekly and the daily rates is therefore a worthy exercise in
our analysis also.
When we compare the usual status with the weekly status unemployment rates, it is
observed that there are divergences between these two rates, where the weekly rates are
comparatively higher. For NER, the weekly rates are higher in the urban areas compared to
the rural. Tripura had the highest rates in the category of weekly status unemployment
among the states in the region. However Appendix‐III & IV reveal that the divergence of
0.00
2.00
4.00
6.00
8.00
10.00
1993‐94 1999‐00 2004‐05
% of usual unemployment‐persons
NER/Rural
India/Rural
0.00
2.00
4.00
6.00
8.00
10.00
1993‐94 1999‐00 2004‐05
% of usual unemployment‐persons
NER/Urban
India/Urban
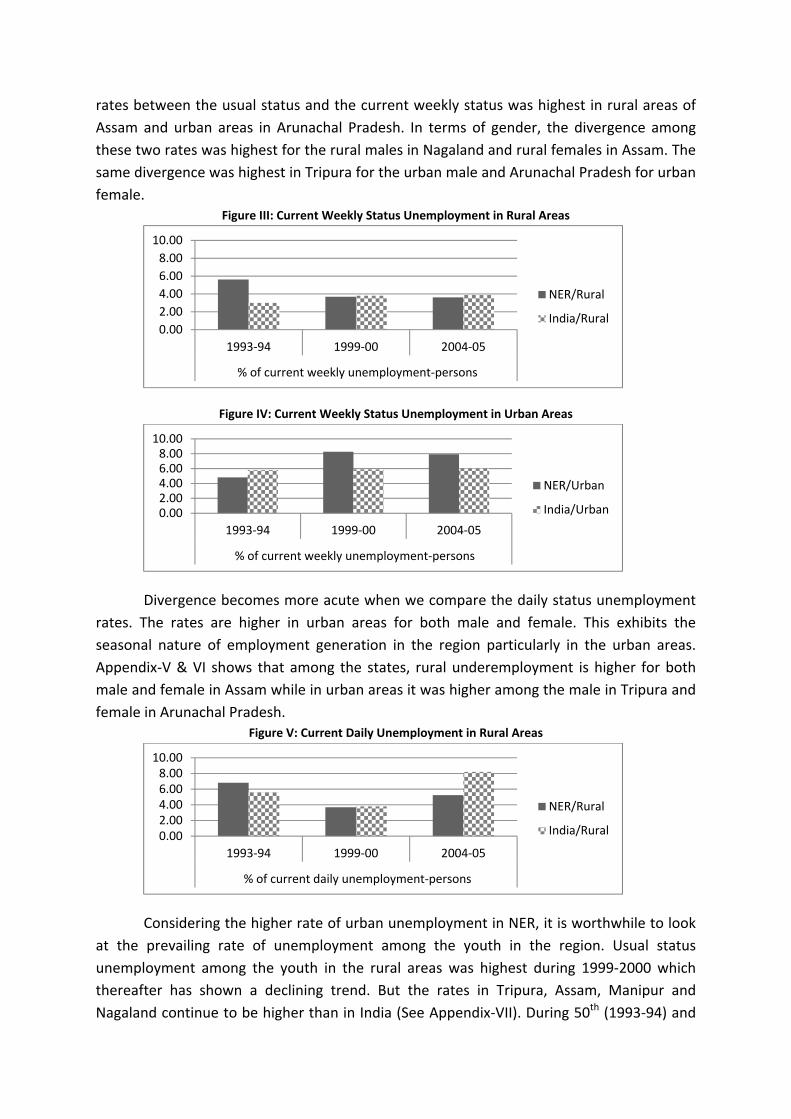
rates between the usual status and the current weekly status was highest in rural areas of
Assam and urban areas in Arunachal Pradesh. In terms of gender, the divergence among
these two rates was highest for the rural males in Nagaland and rural females in Assam. The
same divergence was highest in Tripura for the urban male and Arunachal Pradesh for urban
female. Figure III: Current Weekly Status Unemployment in Rural Areas
Figure IV: Current Weekly Status Unemployment in Urban Areas
Divergence becomes more acute when we compare the daily status unemployment
rates. The rates are higher in urban areas for both male and female. This exhibits the
seasonal nature of employment generation in the region particularly in the urban areas.
Appendix‐V & VI shows that among the states, rural underemployment is higher for both
male and female in Assam while in urban areas it was higher among the male in Tripura and
female in Arunachal Pradesh. Figure V: Current Daily Unemployment in Rural Areas
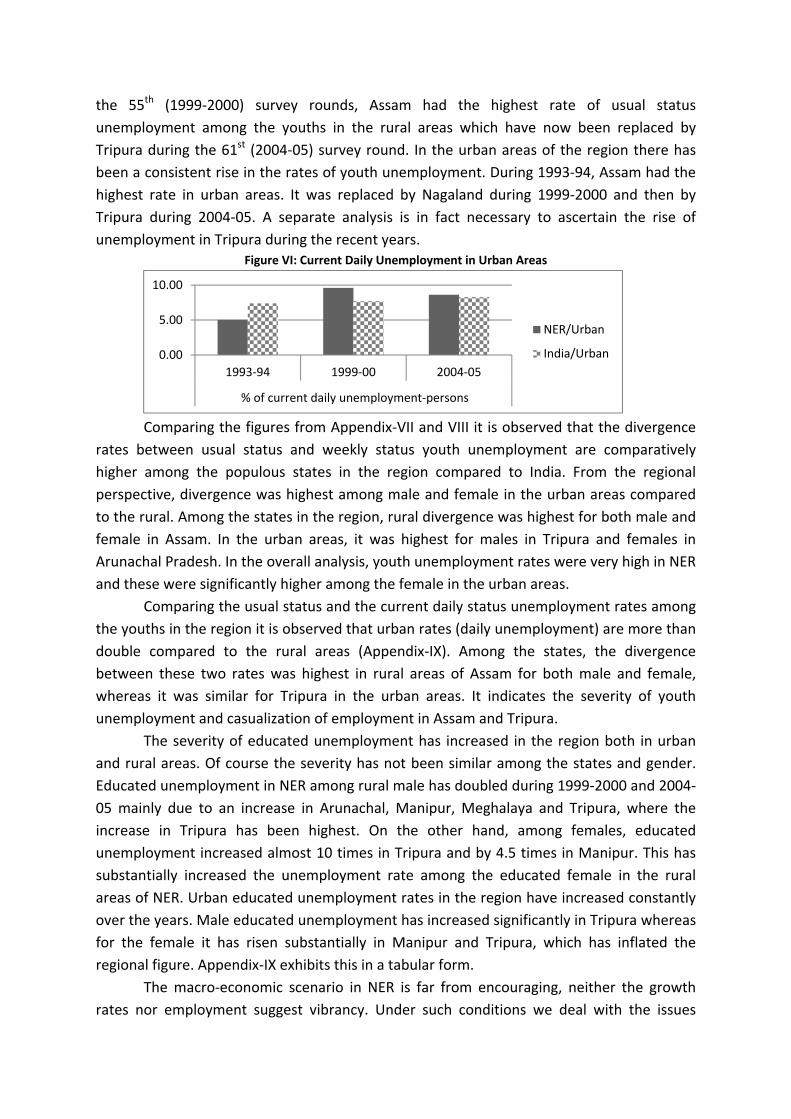
Considering the higher rate of urban unemployment in NER, it is worthwhile to look
at the prevailing rate of unemployment among the youth in the region. Usual status
unemployment among the youth in the rural areas was highest during 1999‐2000 which
thereafter has shown a declining trend. But the rates in Tripura, Assam, Manipur and
Nagaland continue to be higher than in India (See Appendix‐VII). During 50th (1993‐94) and
0.00
2.00
4.00
6.00
8.00
10.00
1993‐94 1999‐00 2004‐05
% of current weekly unemployment‐persons
NER/Rural
India/Rural
0.002.004.006.008.00
10.00
1993‐94 1999‐00 2004‐05
% of current weekly unemployment‐persons
NER/Urban
India/Urban
0.002.004.006.008.00
10.00
1993‐94 1999‐00 2004‐05
% of current daily unemployment‐persons
NER/Rural
India/Rural
the 55th (1999‐2000) survey rounds, Assam had the highest rate of usual status
unemployment among the youths in the rural areas which have now been replaced by
Tripura during the 61st (2004‐05) survey round. In the urban areas of the region there has
been a consistent rise in the rates of youth unemployment. During 1993‐94, Assam had the
highest rate in urban areas. It was replaced by Nagaland during 1999‐2000 and then by
Tripura during 2004‐05. A separate analysis is in fact necessary to ascertain the rise of
unemployment in Tripura during the recent years. Figure VI: Current Daily Unemployment in Urban Areas
Comparing the figures from Appendix‐VII and VIII it is observed that the divergence
rates between usual status and weekly status youth unemployment are comparatively
higher among the populous states in the region compared to India. From the regional
perspective, divergence was highest among male and female in the urban areas compared
to the rural. Among the states in the region, rural divergence was highest for both male and
female in Assam. In the urban areas, it was highest for males in Tripura and females in
Arunachal Pradesh. In the overall analysis, youth unemployment rates were very high in NER
and these were significantly higher among the female in the urban areas.
Comparing the usual status and the current daily status unemployment rates among
the youths in the region it is observed that urban rates (daily unemployment) are more than
double compared to the rural areas (Appendix‐IX). Among the states, the divergence
between these two rates was highest in rural areas of Assam for both male and female,
whereas it was similar for Tripura in the urban areas. It indicates the severity of youth
unemployment and casualization of employment in Assam and Tripura.
The severity of educated unemployment has increased in the region both in urban
and rural areas. Of course the severity has not been similar among the states and gender.
Educated unemployment in NER among rural male has doubled during 1999‐2000 and 2004‐
05 mainly due to an increase in Arunachal, Manipur, Meghalaya and Tripura, where the
increase in Tripura has been highest. On the other hand, among females, educated
unemployment increased almost 10 times in Tripura and by 4.5 times in Manipur. This has
substantially increased the unemployment rate among the educated female in the rural
areas of NER. Urban educated unemployment rates in the region have increased constantly
over the years. Male educated unemployment has increased significantly in Tripura whereas
for the female it has risen substantially in Manipur and Tripura, which has inflated the
regional figure. Appendix‐IX exhibits this in a tabular form.
The macro‐economic scenario in NER is far from encouraging, neither the growth
rates nor employment suggest vibrancy. Under such conditions we deal with the issues
0.00
5.00
10.00
1993‐94 1999‐00 2004‐05
% of current daily unemployment‐persons
NER/Urban
India/Urban
related with border trade in the next section, an aspect which has been portrayed as a
panacea for the beleaguered region.
V Border Trade and North East India The location of NER is such that it shares only 2 per cent of its border with the Indian
mainland whereas 98 per cent is surrounded by various neighbouring countries. In the West
and South West, it shares 1880 km with Bangladesh, 1643 km with Myanmar in East and
South East, 1000 km with China in the East and North East and 1100 km with Bhutan in the
North and North West8. This unique location of the region vis‐à‐vis the neighbouring
countries suggests that there are huge geo‐economic potentials related with NER. But
history shows that while dealing with the region, geo‐political considerations have always
dominated over geo‐economic considerations. The Partition of the country in 1947 resulted
in transforming the North East into a ‘territorial trap’ whereby traditional social and trade
links were suddenly curtailed which had long term implication for the region. This situation
is sought to be changed by opening the region to trade, commerce and communication and
therefore various policy documents recommend measures towards the same direction. But
the rhetorical statements and vision documents require substance to transform them into
reality. Under such a situation, we wish to take a stock of the existing trade relation of the
region with the neighbouring countries during recent years. In the earlier sections we have
discussed the contemporary economic fundamentals of the region and now a look at the
trade pattern will help to understand the picture in its totality.
a) Border Trade with Neighbouring countries
Estimating the quantum of border trade with the neighbouring countries is a difficult
task. Firstly, there are problems associated with data pertaining to such trade.
Disaggregated data at the state or regional level are not available in India. Secondly, there
are lot of discrepancies regarding information available with various agencies of the
government. Thirdly, it is difficult to trace the value addition of (such as in case of
horticultural crops, jute etc.) a commodity in a different region/state before it is exported.
Fourthly, in those regions where the volume of unofficial trade is substantially high any
estimation of trade from that region to other countries risks gross underestimation9. Border
trade estimates in the North East also suffer from these shortcomings.
Before dealing with the volume and composition of trade we briefly discuss the most
important medium that facilitates the process ‐ the Land Customs Stations (LCS) in NER. The
Land Custom Stations are an important medium of official border trade. There are 40 LCS in
the region connecting three neighbouring countries‐ Bangladesh, Bhutan and Myanmar.
Majority of the LCS are with Bangladesh (33). There are 4 LCS with Myanmar and 3 with
Bhutan. But only 50 per cent of the LCS are functional. There is only 1 functional LCS each
along Bhutan and Myanmar, the rest are with Bangladesh (18)10. The long list of non‐
functional LCS does not portray a satisfactory picture for trade facilitation. A detailed list of
LCS in NER is provided in Appendix‐X.
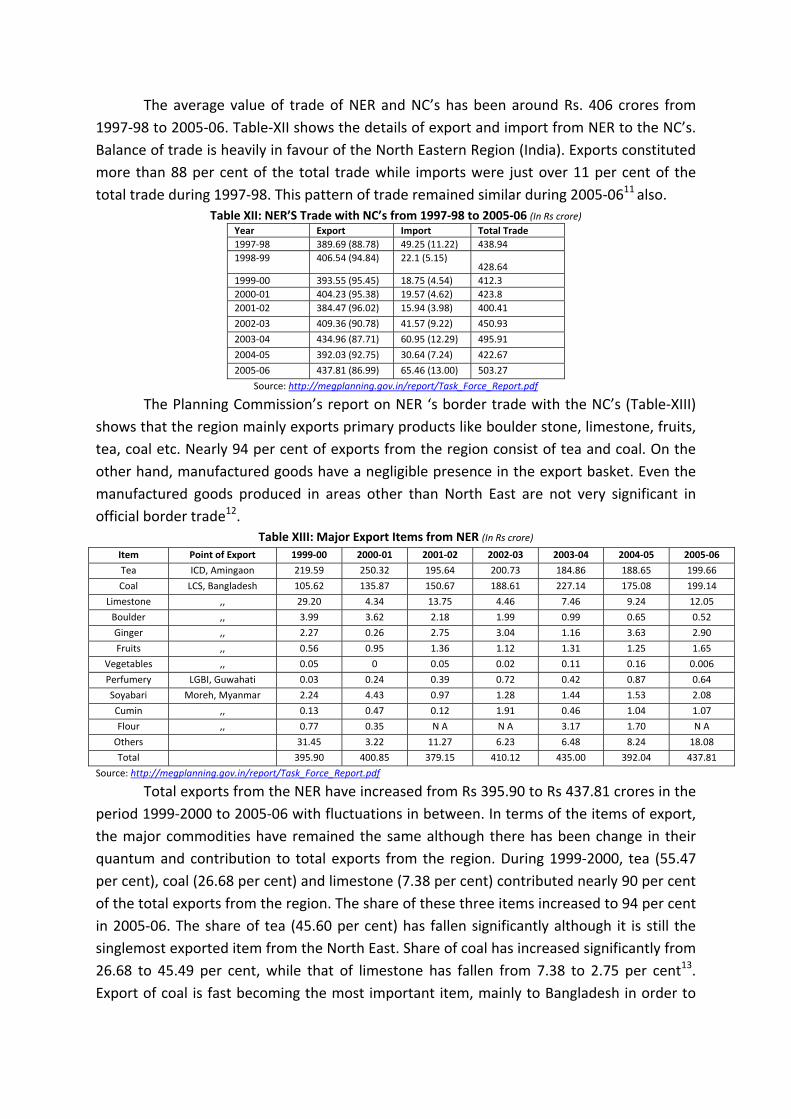
The average value of trade of NER and NC’s has been around Rs. 406 crores from
1997‐98 to 2005‐06. Table‐XII shows the details of export and import from NER to the NC’s.
Balance of trade is heavily in favour of the North Eastern Region (India). Exports constituted
more than 88 per cent of the total trade while imports were just over 11 per cent of the
total trade during 1997‐98. This pattern of trade remained similar during 2005‐0611 also. Table XII: NER’S Trade with NC’s from 1997‐98 to 2005‐06 (In Rs crore)
Year Export Import Total Trade
1997‐98 389.69 (88.78) 49.25 (11.22) 438.94
1998‐99 406.54 (94.84) 22.1 (5.15)428.64
1999‐00 393.55 (95.45) 18.75 (4.54) 412.3
2000‐01 404.23 (95.38) 19.57 (4.62) 423.8
2001‐02 384.47 (96.02) 15.94 (3.98) 400.41
2002‐03 409.36 (90.78) 41.57 (9.22) 450.93
2003‐04 434.96 (87.71) 60.95 (12.29) 495.91
2004‐05 392.03 (92.75) 30.64 (7.24) 422.67
2005‐06 437.81 (86.99) 65.46 (13.00) 503.27
Source: http://megplanning.gov.in/report/Task_Force_Report.pdf
The Planning Commission’s report on NER ‘s border trade with the NC’s (Table‐XIII)
shows that the region mainly exports primary products like boulder stone, limestone, fruits,
tea, coal etc. Nearly 94 per cent of exports from the region consist of tea and coal. On the
other hand, manufactured goods have a negligible presence in the export basket. Even the
manufactured goods produced in areas other than North East are not very significant in
official border trade12. Table XIII: Major Export Items from NER (In Rs crore)
Item Point of Export 1999‐00 2000‐01 2001‐02 2002‐03 2003‐04 2004‐05 2005‐06
Tea ICD, Amingaon 219.59 250.32 195.64 200.73 184.86 188.65 199.66
Coal LCS, Bangladesh 105.62 135.87 150.67 188.61 227.14 175.08 199.14
Limestone ,, 29.20 4.34 13.75 4.46 7.46 9.24 12.05
Boulder ,, 3.99 3.62 2.18 1.99 0.99 0.65 0.52
Ginger ,, 2.27 0.26 2.75 3.04 1.16 3.63 2.90
Fruits ,, 0.56 0.95 1.36 1.12 1.31 1.25 1.65
Vegetables ,, 0.05 0 0.05 0.02 0.11 0.16 0.006
Perfumery LGBI, Guwahati 0.03 0.24 0.39 0.72 0.42 0.87 0.64
Soyabari Moreh, Myanmar 2.24 4.43 0.97 1.28 1.44 1.53 2.08
Cumin ,, 0.13 0.47 0.12 1.91 0.46 1.04 1.07
Flour ,, 0.77 0.35 N A N A 3.17 1.70 N A
Others 31.45 3.22 11.27 6.23 6.48 8.24 18.08
Total 395.90 400.85 379.15 410.12 435.00 392.04 437.81
Source: http://megplanning.gov.in/report/Task_Force_Report.pdf
Total exports from the NER have increased from Rs 395.90 to Rs 437.81 crores in the
period 1999‐2000 to 2005‐06 with fluctuations in between. In terms of the items of export,
the major commodities have remained the same although there has been change in their
quantum and contribution to total exports from the region. During 1999‐2000, tea (55.47
per cent), coal (26.68 per cent) and limestone (7.38 per cent) contributed nearly 90 per cent
of the total exports from the region. The share of these three items increased to 94 per cent
in 2005‐06. The share of tea (45.60 per cent) has fallen significantly although it is still the
singlemost exported item from the North East. Share of coal has increased significantly from
26.68 to 45.49 per cent, while that of limestone has fallen from 7.38 to 2.75 per cent13.
Export of coal is fast becoming the most important item, mainly to Bangladesh in order to
meet the rising demand of the household and the industrial sector. Other items of export
show marginal changes over the years.
Imports to NER mainly consist of manufactured products and processed food items
like fish, dry ginger, yellow peas, cement, multi‐wall paper sacks, laminated poly bags,
machinery equipment and parts, mustard, soya and pamolein oil. These items comprise 50
per cent of the imports to the region.
b) NER‐Myanmar Trade
NER shares 1643 kms border with Myanmar. Four states of the region ‐ Arunachal
Pradesh (520 kms), Mizoram (510 kms), Manipur (398 kms) and Nagaland (215 kms) ‐ share
their borders with Myanmar. Both the regions enjoyed age old trade relations.
Contemporary border trade with Myanmar involves three areas, the Champhai border in
Mizoram, Lungwa border in Nagaland and the Moreh‐Tamu sector in Manipur. However,
the major part of trade takes place through the Moreh‐Tamu sector due because of the
better infrastructural facilities available in this area.
To facilitate official trade The Indo‐Myanmar Border Trade Agreement was signed on
January 21, 1994. Accordingly, Moreh was transformed into a Land Custom Station on April
12, 1995. The Indo‐Myanmar Border Trade Agreement introduced a three tier trade
system14
i) Traditional Free Exchange: where locally produced items up to US $1000 are
allowed to be exchanged between the indigenous people residing up to 40 kms on
either side of the border with simple documentation without any GR formalities.
ii) Barter Trade: where 22 agreed items up to US $20,000 can be traded with GR
formalities and payment of customs duties. The items include locally produced
agricultural items and minor forest produces. (See Appendix‐XI for list of items)
iii) Normal Trade: trade is allowed here under the Letter of Credit System as per the
EXIM Policy guidelines
As mentioned, Indo‐Myanmar formal trade has been mainly in the Moreh‐Tamu
sector. Analysis of data in this sector reveals that after the initial spurt in trading activities
there has been a sharp fall in the volume of trade. In the period 1995‐96 to 1997‐98 there
has been a sharp increase in the total volume of trade in this sector, where both exports
and imports increased considerably. Total volume of trade rose from Rs 15.84 to Rs 62.35
crores, exports increased from Rs 10.45 to Rs 25.16 crores whereas imports increased
sharply from Rs 5.39 to Rs 37.19 crores. Thereafter, there has been a substantial decline in
trade15.
One of the earliest studies16 related to border trade between NER and Myanmar
shows that out of the total exports of about Rs 30 crores in 1996‐97 nearly 80 per cent
consisted of manufactured goods and the rest were agro‐horticultural products. Most of the
manufactured items that were traded through Moreh originated from outside NER.
Similarly, agricultural and horticultural products imported from Myanmar originated from
outside the country. This shows that the Moreh‐Tamu sector is a transit route through
which goods originating from outside the sector are exchanged.
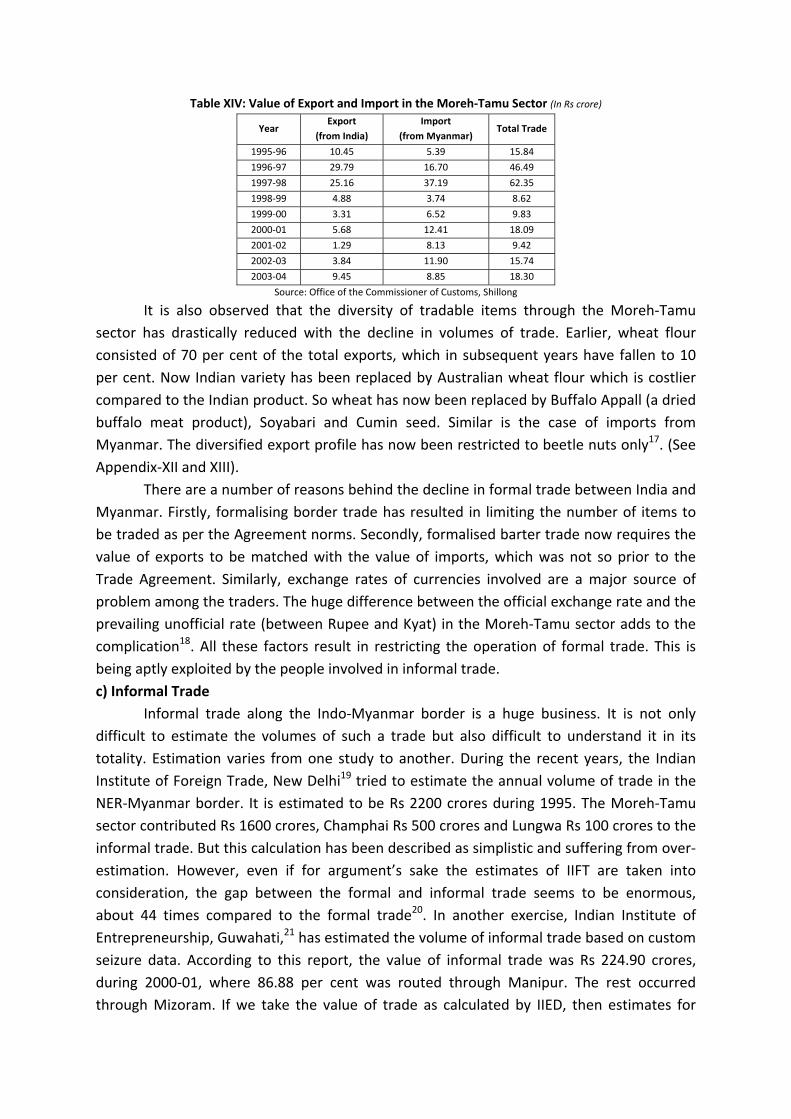
Table XIV: Value of Export and Import in the Moreh‐Tamu Sector (In Rs crore)
Year Export
(from India)
Import
(from Myanmar) Total Trade
1995‐96 10.45 5.39 15.84
1996‐97 29.79 16.70 46.49
1997‐98 25.16 37.19 62.35
1998‐99 4.88 3.74 8.62
1999‐00 3.31 6.52 9.83
2000‐01 5.68 12.41 18.09
2001‐02 1.29 8.13 9.42
2002‐03 3.84 11.90 15.74
2003‐04 9.45 8.85 18.30
Source: Office of the Commissioner of Customs, Shillong
It is also observed that the diversity of tradable items through the Moreh‐Tamu
sector has drastically reduced with the decline in volumes of trade. Earlier, wheat flour
consisted of 70 per cent of the total exports, which in subsequent years have fallen to 10
per cent. Now Indian variety has been replaced by Australian wheat flour which is costlier
compared to the Indian product. So wheat has now been replaced by Buffalo Appall (a dried
buffalo meat product), Soyabari and Cumin seed. Similar is the case of imports from
Myanmar. The diversified export profile has now been restricted to beetle nuts only17. (See
Appendix‐XII and XIII).
There are a number of reasons behind the decline in formal trade between India and
Myanmar. Firstly, formalising border trade has resulted in limiting the number of items to
be traded as per the Agreement norms. Secondly, formalised barter trade now requires the
value of exports to be matched with the value of imports, which was not so prior to the
Trade Agreement. Similarly, exchange rates of currencies involved are a major source of
problem among the traders. The huge difference between the official exchange rate and the
prevailing unofficial rate (between Rupee and Kyat) in the Moreh‐Tamu sector adds to the
complication18. All these factors result in restricting the operation of formal trade. This is
being aptly exploited by the people involved in informal trade.
c) Informal Trade
Informal trade along the Indo‐Myanmar border is a huge business. It is not only
difficult to estimate the volumes of such a trade but also difficult to understand it in its
totality. Estimation varies from one study to another. During the recent years, the Indian
Institute of Foreign Trade, New Delhi19 tried to estimate the annual volume of trade in the
NER‐Myanmar border. It is estimated to be Rs 2200 crores during 1995. The Moreh‐Tamu
sector contributed Rs 1600 crores, Champhai Rs 500 crores and Lungwa Rs 100 crores to the
informal trade. But this calculation has been described as simplistic and suffering from over‐
estimation. However, even if for argument’s sake the estimates of IIFT are taken into
consideration, the gap between the formal and informal trade seems to be enormous,
about 44 times compared to the formal trade20. In another exercise, Indian Institute of
Entrepreneurship, Guwahati,21 has estimated the volume of informal trade based on custom
seizure data. According to this report, the value of informal trade was Rs 224.90 crores,
during 2000‐01, where 86.88 per cent was routed through Manipur. The rest occurred
through Mizoram. If we take the value of trade as calculated by IIED, then estimates for
informal trade is 10 times more than the formal trade in the Manipur sector. In a separate
estimation, also based on custom seizure data, Bezbaruah22 has calculated the volume of
informal trade at Rs 227.73 crores for the year 2003‐04. According to his estimates, Manipur
contributed about 80 per cent to the value of informal trade. Here, the volume of informal
trade will be more than 12 times higher than formal trade. Thus although there are huge
variations in the estimation of the value of informal trade, it is very clear that formal trade
represents only a small portion of the total trade between NER and Myanmar and the bulk
of trading takes place through informal channels.
d) Route and Composition of Informal Trade
Myanmar has borders with four North Eastern states but informal trade mainly takes
place through Manipur and partly through Mizoram. In other areas, strict border vigilance
to curb insurgency as well as the poor economic condition of the people on either side of
the border resulting in little demand for imported consumer goods are some of the reasons
for the absence of informal trade23. Along the routes used for informal trade, Moreh in
Manipur and Champhai in Mizoram are most active. It is a group‐functioning activity
through wide ranging networks from the local agents at the border to those at the
marketing centres. See Appendix‐XIV and XV.
There can be several reasons for informal trade between these two regions. First,
although geographically they are divided through political boundaries of the nation state
they continue to enjoy a shared ethnic boundary (with varying degrees) and so what
appears to be international trade for New Delhi is nothing but traditional trade for these
people. In fact, political boundaries have severed their normal economic ties leading to
shortages and higher prices24. Secondly, the demarcation between the formal and informal
trade becomes thin because of widespread involvement of people from different walks of
life, such as politicians, bureaucrats, security personnel, enforcement agencies as well as
other people from civil society. Thirdly, trade with Myanmar is more often a transit trade of
goods and commodities produced in other countries, which creates conditions for informal
trade.
Commodities and items entering from Myanmar vary widely. Among them
agricultural and forest products such as agar woods, pulses, groundnuts, betelnuts, gems,
precious stones originate from Myanmar, while other goods ranging from electrical and
electronics, textiles and footwear, cosmetics and toiletry as well as high value metals and
other stationaries are from other South East Asian nations. Moreover, drugs, narcotics as
well as arms comprise an important (which is yet to be properly estimated) component of
informal trade through these borders. On the other hand, informal exports to Myanmar
include manufactured items such as motor cycles, bicycles, agricultural implements, paints,
baby food, medicines, fuel etc. Chemicals used as inputs for producing narcotics also
comprise an important item of informal exports from the North East25
During 2003‐04, composition of imports from Myanmar comprised about 50 per cent
electronics and electrical equipment. Textiles and footwear were the second biggest items
of imports, at over 17 per cent. There were various other categories of items that were
imported from Myanmar but their share was much less compared to these two categories.
In this regard, it is interesting to note that there was a difference in the import profile of the
two states of Manipur and Mizoram through which the informal items entered from
Myanmar. While in Manipur, electronics & electrical items comprised the largest
component of imports, along with generator sets, inverters and inverter batteries mainly to
meet the local requirements in the state where power shortage is a severe menace. On the
other hand, a better‐off state like Mizoram shows preference for textiles and footwear. It is
also observed that recently Mizoram is slowly becoming the preferred route for informal
imports vis‐à‐vis Manipur because of the prevailing adverse law and order situation in the
latter26.
e) NER‐Bangladesh Trade
NER and Bangladesh have shared age old social, economic and cultural ties. Partition
of the country disrupted these ties yet communication prevailed. NER and Bangladesh share
a boundary of 1880 km marked by land and rivers. Four north eastern states namely Tripura,
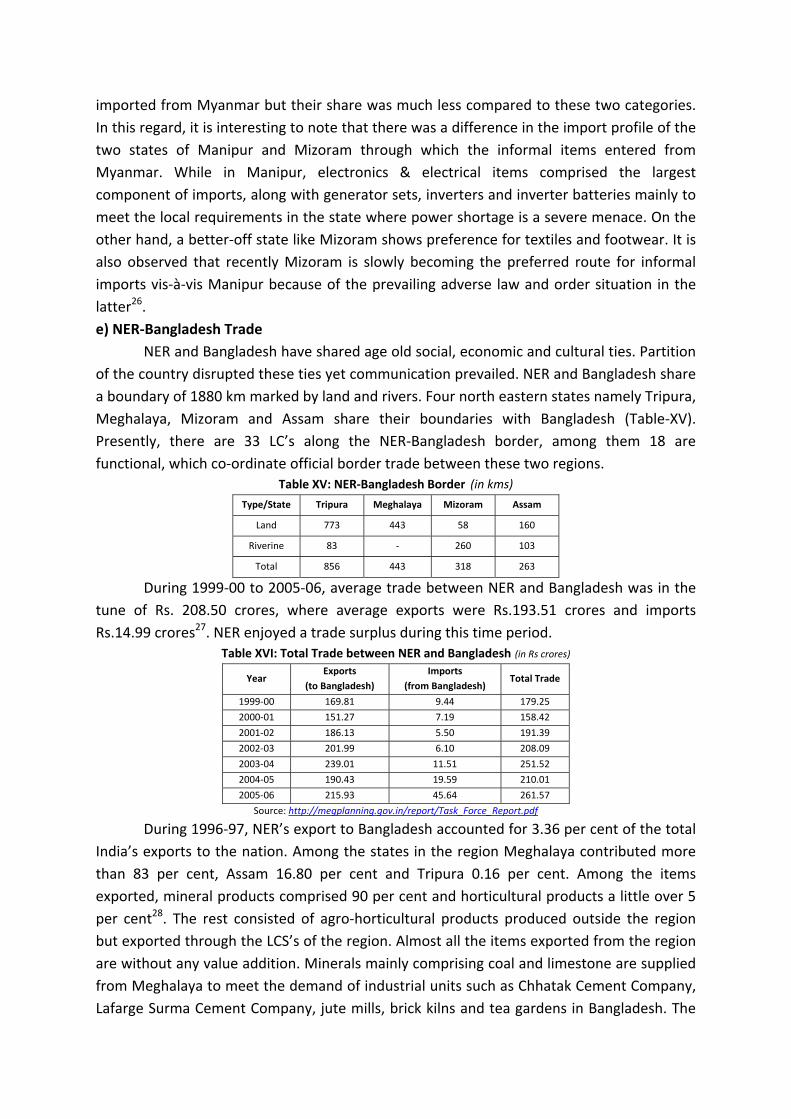
Meghalaya, Mizoram and Assam share their boundaries with Bangladesh (Table‐XV).
Presently, there are 33 LC’s along the NER‐Bangladesh border, among them 18 are
functional, which co‐ordinate official border trade between these two regions. Table XV: NER‐Bangladesh Border (in kms)
Type/State Tripura Meghalaya Mizoram Assam
Land 773 443 58 160
Riverine 83 ‐ 260 103
Total 856 443 318 263
During 1999‐00 to 2005‐06, average trade between NER and Bangladesh was in the
tune of Rs. 208.50 crores, where average exports were Rs.193.51 crores and imports
Rs.14.99 crores27. NER enjoyed a trade surplus during this time period. Table XVI: Total Trade between NER and Bangladesh (in Rs crores)
Year Exports
(to Bangladesh)
Imports
(from Bangladesh) Total Trade
1999‐00 169.81 9.44 179.25
2000‐01 151.27 7.19 158.42
2001‐02 186.13 5.50 191.39
2002‐03 201.99 6.10 208.09
2003‐04 239.01 11.51 251.52
2004‐05 190.43 19.59 210.01
2005‐06 215.93 45.64 261.57
Source: http://megplanning.gov.in/report/Task_Force_Report.pdf
During 1996‐97, NER’s export to Bangladesh accounted for 3.36 per cent of the total
India’s exports to the nation. Among the states in the region Meghalaya contributed more
than 83 per cent, Assam 16.80 per cent and Tripura 0.16 per cent. Among the items
exported, mineral products comprised 90 per cent and horticultural products a little over 5
per cent28. The rest consisted of agro‐horticultural products produced outside the region
but exported through the LCS’s of the region. Almost all the items exported from the region
are without any value addition. Minerals mainly comprising coal and limestone are supplied
from Meghalaya to meet the demand of industrial units such as Chhatak Cement Company,
Lafarge Surma Cement Company, jute mills, brick kilns and tea gardens in Bangladesh. The
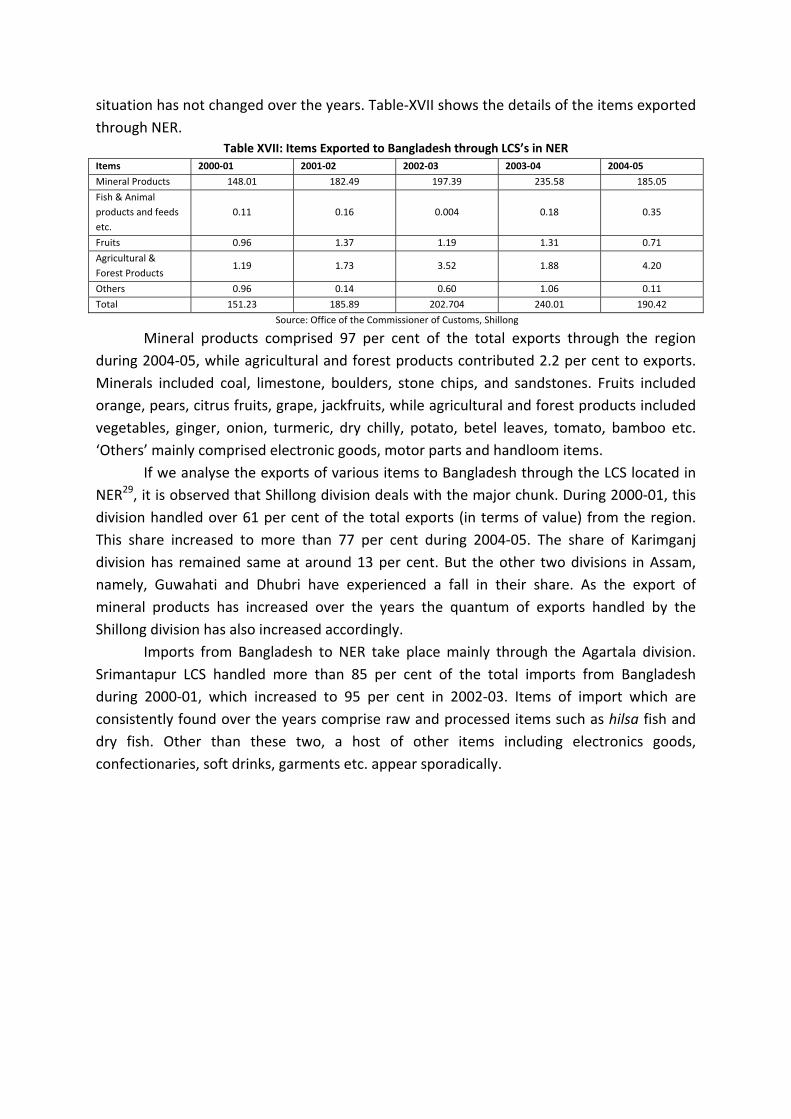
situation has not changed over the years. Table‐XVII shows the details of the items exported
through NER. Table XVII: Items Exported to Bangladesh through LCS’s in NER
Items 2000‐01 2001‐02 2002‐03 2003‐04 2004‐05
Mineral Products 148.01 182.49 197.39 235.58 185.05
Fish & Animal
products and feeds
etc.
0.11 0.16 0.004 0.18 0.35
Fruits 0.96 1.37 1.19 1.31 0.71
Agricultural &
Forest Products 1.19 1.73 3.52 1.88 4.20
Others 0.96 0.14 0.60 1.06 0.11
Total 151.23 185.89 202.704 240.01 190.42
Source: Office of the Commissioner of Customs, Shillong
Mineral products comprised 97 per cent of the total exports through the region
during 2004‐05, while agricultural and forest products contributed 2.2 per cent to exports.
Minerals included coal, limestone, boulders, stone chips, and sandstones. Fruits included
orange, pears, citrus fruits, grape, jackfruits, while agricultural and forest products included
vegetables, ginger, onion, turmeric, dry chilly, potato, betel leaves, tomato, bamboo etc.
‘Others’ mainly comprised electronic goods, motor parts and handloom items.
If we analyse the exports of various items to Bangladesh through the LCS located in
NER29, it is observed that Shillong division deals with the major chunk. During 2000‐01, this
division handled over 61 per cent of the total exports (in terms of value) from the region.
This share increased to more than 77 per cent during 2004‐05. The share of Karimganj
division has remained same at around 13 per cent. But the other two divisions in Assam,
namely, Guwahati and Dhubri have experienced a fall in their share. As the export of
mineral products has increased over the years the quantum of exports handled by the
Shillong division has also increased accordingly.
Imports from Bangladesh to NER take place mainly through the Agartala division.
Srimantapur LCS handled more than 85 per cent of the total imports from Bangladesh
during 2000‐01, which increased to 95 per cent in 2002‐03. Items of import which are
consistently found over the years comprise raw and processed items such as hilsa fish and
dry fish. Other than these two, a host of other items including electronics goods,
confectionaries, soft drinks, garments etc. appear sporadically.
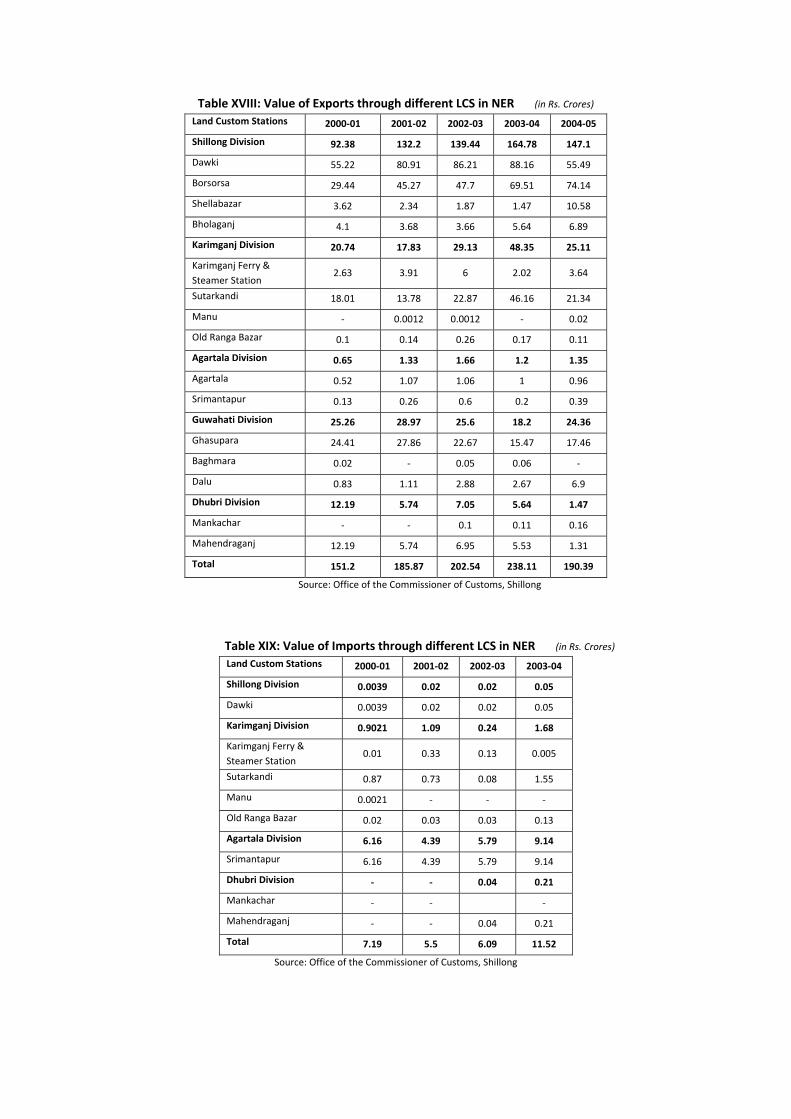
Table XVIII: Value of Exports through different LCS in NER (in Rs. Crores) Land Custom Stations 2000‐01 2001‐02 2002‐03 2003‐04 2004‐05
Shillong Division 92.38 132.2 139.44 164.78 147.1
Dawki 55.22 80.91 86.21 88.16 55.49
Borsorsa 29.44 45.27 47.7 69.51 74.14
Shellabazar 3.62 2.34 1.87 1.47 10.58
Bholaganj 4.1 3.68 3.66 5.64 6.89
Karimganj Division 20.74 17.83 29.13 48.35 25.11
Karimganj Ferry &
Steamer Station 2.63 3.91 6 2.02 3.64
Sutarkandi 18.01 13.78 22.87 46.16 21.34
Manu ‐ 0.0012 0.0012 ‐ 0.02
Old Ranga Bazar 0.1 0.14 0.26 0.17 0.11
Agartala Division 0.65 1.33 1.66 1.2 1.35
Agartala 0.52 1.07 1.06 1 0.96
Srimantapur 0.13 0.26 0.6 0.2 0.39
Guwahati Division 25.26 28.97 25.6 18.2 24.36
Ghasupara 24.41 27.86 22.67 15.47 17.46
Baghmara 0.02 ‐ 0.05 0.06 ‐
Dalu 0.83 1.11 2.88 2.67 6.9
Dhubri Division 12.19 5.74 7.05 5.64 1.47
Mankachar ‐ ‐ 0.1 0.11 0.16
Mahendraganj 12.19 5.74 6.95 5.53 1.31
Total 151.2 185.87 202.54 238.11 190.39
Source: Office of the Commissioner of Customs, Shillong
Table XIX: Value of Imports through different LCS in NER (in Rs. Crores) Land Custom Stations 2000‐01 2001‐02 2002‐03 2003‐04
Shillong Division 0.0039 0.02 0.02 0.05
Dawki 0.0039 0.02 0.02 0.05
Karimganj Division 0.9021 1.09 0.24 1.68
Karimganj Ferry &
Steamer Station 0.01 0.33 0.13 0.005
Sutarkandi 0.87 0.73 0.08 1.55
Manu 0.0021 ‐ ‐ ‐
Old Ranga Bazar 0.02 0.03 0.03 0.13
Agartala Division 6.16 4.39 5.79 9.14
Srimantapur 6.16 4.39 5.79 9.14
Dhubri Division ‐ ‐ 0.04 0.21
Mankachar ‐ ‐ ‐
Mahendraganj ‐ ‐ 0.04 0.21
Total 7.19 5.5 6.09 11.52
Source: Office of the Commissioner of Customs, Shillong
f) Informal Trade
There are several probable reasons for the growth of informal trade between NER
and Bangladesh. The unmanned, unprotected and less than properly demarcated borders
create ideal conditions which are exploited for informal trade. Secondly, the linguistic and
cultural homogeneity of the people residing on either side of the border sometimes creates
conditions where law enforcing agencies find it difficult to locate people involved in informal
trade. Thirdly, the depreciation of the Indian Rupee in 1991 resulted in a spurt to informal
trade as Indian goods particularly food grains became cheaper and therefore exported to
Bangladesh. Similar was the case with fish, where particular varieties from Andhra Pradesh
were exported informally through NER to Bangladesh.
NCAER30(1995) conducted a study related to informal trade covering 3 districts each
from Assam and Tripura (other than 9 districts of West Bengal) and then generalised their
findings at the state level. According to this study, the value of informal trade in Assam was
Rs. 35.50 crores and the same for Tripura was Rs. 8.10 crores. The study identified sugar as
the single most important commodity of informal trade followed by printed saris along the
Karimganj sector in Assam. In other districts of Assam and Tripura, wood and timber‐based
products were the major commodities informally exported to Bangladesh. In terms of the
group of commodities, food and live animals comprised 40 per cent from Assam, while in
Tripura, forest products comprised more than 52 per cent of all the commodities exported
informally.
RIS31(1996) conducted a study titled India’s Border Trade with Select Neighbouring
Countries where they quantified the value of exports at Rs. 42010 lakh (Rs.42.01 crores) and
imports at Rs. 13162 lakh (Rs. 13.16 crores). The study found that exports from NER were
higher through Mizoram and Meghalaya whereas through Assam and Tripura imports were
prominent. Tripura and Assam were the main states in the region through which informal
trade was practised.
There are a few other studies concerned with the volume and composition of
informal trade. Bakht32 (1996) estimated that informal exports to India were at least 6 times
higher than legal exports thereby showing the huge quantum of informal trade. On the
other, Rahman33 (2004) calculates that illegal imports and exports are as large as their
formal counterparts. He states that illegal exports from Bangladesh to the NER are limited to
few high value items such as gold. Halder34 (2008) estimates the ratio of legal to illegal
import from India at 1:1.5. Notwithstanding the variety of estimates provided by scholars
about the quantum, direction and composition of informal trade it is easily understood that
there exists a huge network of informal trade between Bangladesh and the NER.
g) Route and Composition of Informal Trade
Scope for Informal trade in areas where the functional LCS are located is limited
because of the presence of vigilance and enforcement authorities. But there is a lot of scope
for informal trade in the adjacent areas of functional LCS and non‐functional LCS due to the
operation of various syndicates on both sides of the border. It is sometimes puzzling to find
that the items included under formal trade are also found in informal trade. This may be
because of quota and restriction on the quantum of items to be traded. There are thus
limitations in case of formal trade but as the market for such items is bigger, there is
therefore a lot of scope for informal trade. Moreover, it is also possible that the items which
are traded informally are those which have escaped the vigil of the enforcement authorities
as well.
Informal exports from NER to Bangladesh include spices (23 per cent), textiles (13
per cent), sugar (12 per cent), pharmaceutical products (10 per cent), processed food (9 per
cent), cereals (8 per cent), fish (6 per cent) and fruits (3 per cent). On the other hand,
informal imports from Bangladesh comprise electronic items (20 per cent), jute (15 per
cent), plastic products (10 per cent), palm oil (7 per cent), spices (4 per cent), textiles and
fish (4 per cent each) 35. See Appendix‐XVI
The amount of seizures of informally traded goods and commodities can be used as
an indicative measure for ascertaining the quantum of informal trade. They provide some
insight regarding informal trade. According to the Commissioner of Customs, Shillong, from
2000‐01 to 2004‐05 there were 36,983 cases of seizure in NER where the total value
involved was Rs. 3785.35 lakhs. The value of seizure per case works out to Rs. 10,235 which
indicates that there is trade of valuable items in the region36. A list of informally traded
items is provided in the Appendix‐ XVII as per the records of Customs officials of Shillong.
h) Border Haats
There can be a perceptional hiatus related to border between the nation‐state and
its people. In a terrain which is inhabited by people of similar socio‐cultural traits, the
border is a marker of spatial categories for the nation‐states where two nations are
separated, but for the people who find themselves separated, it is a line where they can
meet their ethnic counterparts. Here, trading activities for the nation‐state will be a case for
border trade embedded in the paradigm of international trade but for the people, it will be
a traditional practice where they share their surplus goods and commodities. This scenario
is common among many borders around the world and is more so among the foothills in
various places in north east India. This has also been an age old practise through various
haats between the hills of Meghalaya and the plains of Bangladesh (especially Sylhet). Large
number of haats developed as an age‐old practice for trade and commerce between these
two regions. It is estimated that during 1876‐77, total import from the Khasi and Jaintia Hills
was Rs 1,576,483. Rice was the principal commodity imported followed by fish and dry fish,
clothes, salt, tea, coffee, liquor, country soaps etc. On the other hand, potato was the
principal exports from the hills, worth Rs 501,250 followed by limestone, cotton, lac, betel
nuts and leaves, oranges etc. Total exports were estimated to be Rs 1,603,53037.
But redrawing of political boundaries in 1947 changed the situation. Trade was
restricted if not totally stopped as the Khasi Hills and the Sylhet Plains were located on two
different sides of the international border. Even then limited trade operations in the form of
haats continued till 1971 when they were completely closed and trade abandoned. It has
resulted in great hardship for the people of both the regions who earlier being cut off from
the centres of trade within their own nations, found themselves to be isolated from their
traditional trade routes also. However, in order to survive and meet the basic requirements
of life, people in these areas tried to maintain barter trade in a limited way through the
border haats of the Meghalaya‐Bangladesh border.
Recently there has been lot of hue and cry in Meghalaya in general and the Khasi
dominated areas in particular for the recognition of these border haats, so that the people
on either side can once again fully revive their age old traditional trading links. In a
memorandum submitted to the President of India during in 2001, the Khasi people urged for
Constitutional recognition of these haats for exporting items such as areca nut, papaya,
various types of citrus fruits, jackfruit, broomstick, bay leaves, rice, pulses and other
seasonal fruits in exchange of fish, eggs and fresh vegetables and seasonal fruits from the
Sylhet plains. The memorandum stated that the present system of declaring an area as
export and import route will not solve the problem of the thousands of poor people as they
are not in a position to involve themselves in the intricacies of international trade. According
to the memorandum, the people just wanted to barter one or two baskets of their
perishable items in exchange for fish etc. through these haats. It is noteworthy that this
memorandum identified more than 33 haats (name and location of the haats are included
in the Appendix‐XVIII) which according to them should be constitutionally recognised and
opened up for trading. These haats are all far off from the main markets, located at a
distance of 80 to 110 kms from the trading centres38.
Trading through these border haats will certainly bring about minimum relief to the
people in these areas on both sides of the border. According to press reports, India and
Bangladesh are about to sign an agreement allowing makeshift bazars at haats on their
common border to boost bilateral trade. The agreement proposes to allow an individual to
trade up to US$50 with both Indian and Bangladeshi currencies where farm and homemade
items produced within 10 kms radius of the border haats would be allowed to be traded.
These haats are proposed to be set up within 75 meters of the border. Trading at these
markets will not be taxed and will initially function once a week. Initially two haats will be
set up, one, at north eastern Sunamganj and the other at north western Kurigram along the
India Bangladesh border39. While this proposal for opening up of two border haats seems to
be a welcome step, its success will depend how they are made operational reflecting the
aspiration and participation of the people concerned from both sides of the border.
VI Other Indicators
After analysing the economic fundamentals and the trade situation in the NER, we
deal with some other important indicators related to the region. In this section we deal with
the aspects of poverty, human development as well as the status of infrastructure so as to
understand the impact of the development process. The revenue generation issues of the
concerned states and the central assistance provided to them will also be discussed briefly.
a) Poverty Estimates
The poverty estimates used here are based on the data generated by the Planning
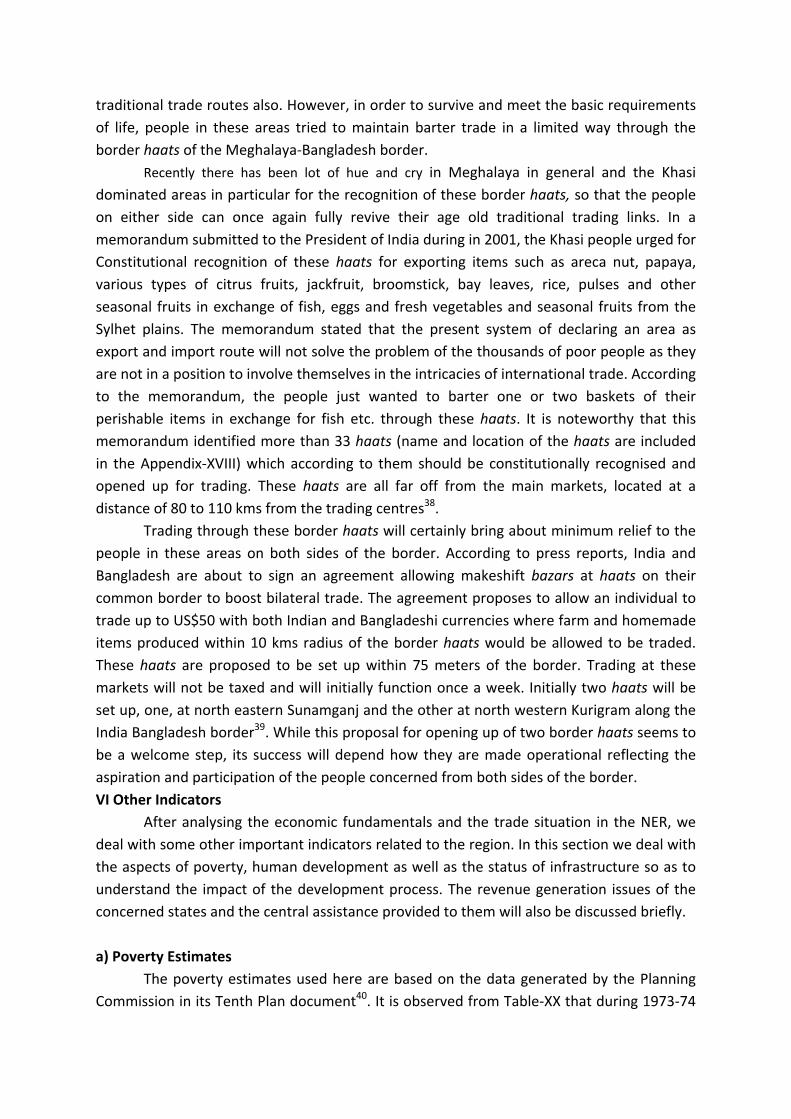
Commission in its Tenth Plan document40. It is observed from Table‐XX that during 1973‐74
and in 1983, the states in the region were better off compared to the all India rate. Poverty
ratios in NER were lower. But during 1993‐94, the poverty estimates in the region showed a
deteriorating trend. Except Manipur and Mizoram, all other states show a higher poverty
ratio vis‐à‐vis India. The same trend continued during 1999‐2000. In other words, from
1973‐74 to 1983 all the states in the region were better off compared to the all India
average but during 1993‐94 and 1999‐2000 except Mizoram, all other states became worse
off. Table XX: Percentage of Population Below Poverty Line
States 1973‐74 1983 1993‐94 1999‐00
Arunachal 51.93 40.88 39.35 33.47
Assam 51.21 40.47 40.86 36.09
Manipur 49.96 37.02 33.78 28.54
Meghalaya 50.20 38.81 37.92 33.87
Mizoram 50.32 36.00 25.66 19.47
Nagaland 50.81 39.25 37.92 32.67
Tripura 51.00 40.03 39.01 34.4
NER 50.77 38.92 36.35 31.21
All India 54.88 44.48 35.97 26.10
Source: Xth Plan Document, Planning Commission
If we compare the decline in poverty during different time periods it is evident that
from 1973‐74 to 1983, decline was highest both for the region and India. From 1983 to
1993‐94, poverty reduction was lowest, both for the region and India. But in terms of
percentage decline, NER fared much worse than India. In the subsequent period although
the depressive trend of 1983‐94 was reversed India fared much better compared to the
NER. In the overall analysis from 1973‐74 to 1999‐2000, the rate of decline in poverty was
19.56 per cent for the region while it was over 28 per cent for India.
For rural and urban poverty estimates the Planning Commission has a bizarre logic of
substituting the rates of Assam with that of all other states in the region. The fact is that the
rate of urbanisation varies widely e.g. Mizoram has 50 per cent urban population while in
Assam it is less than 13 per cent. In such a scenario it is not judicious to substitute the rate
of Assam for all other states in the region. According to the estimates of the Commission,
rural poverty was 52.67 per cent in NER and 56.44 per cent in India during 1973‐74 which
declined to 42.60 and 45.65 per cent in 1983. Thereafter, whereas the urban poverty rates
in the region declined by one‐third, those in rural areas declined much slowly. In fact, rural
poverty rates in NER, which were lower than the national rates, became higher in the post‐
1983 period. Poverty, according to the estimates of the Planning Commission, was a rural
phenomenon in the north eastern region. Among the states in the region, poverty reduction
was highest in Mizoram (30.85 per cent) from 1973‐74 to 1999‐2000, which was higher than
the decline in national average. Assam had the lowest rate of decline during the same time
period.
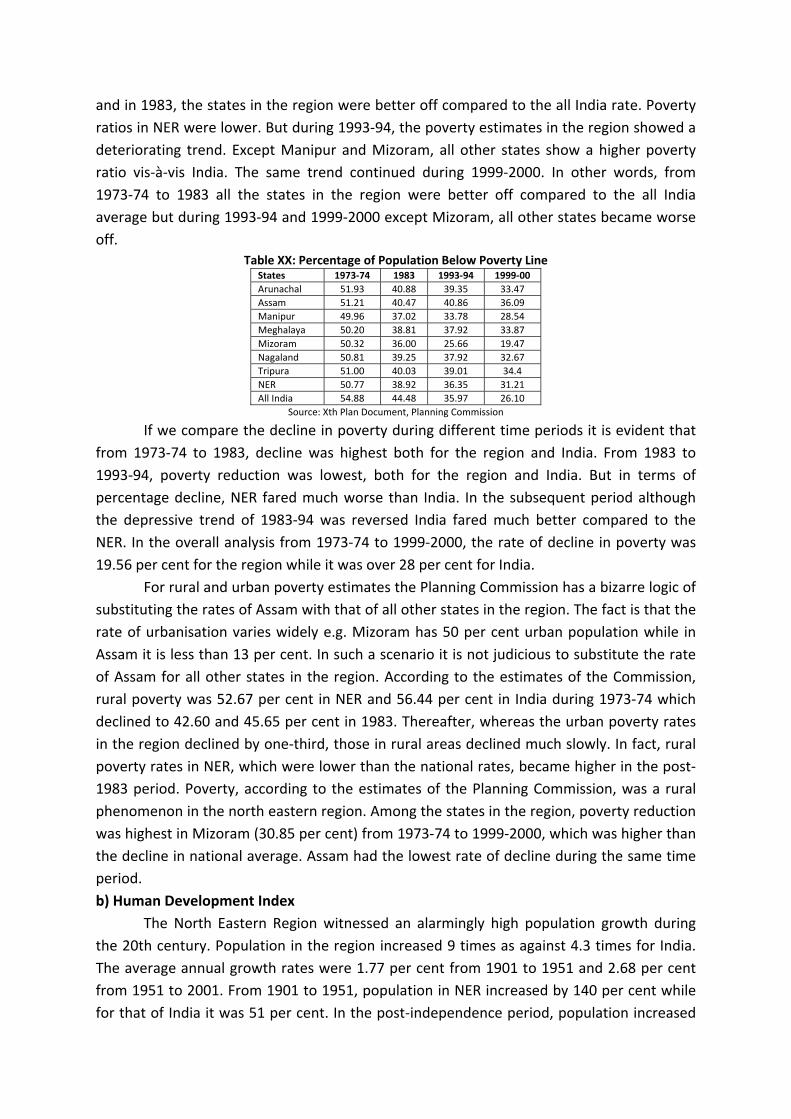
b) Human Development Index
The North Eastern Region witnessed an alarmingly high population growth during
the 20th century. Population in the region increased 9 times as against 4.3 times for India.
The average annual growth rates were 1.77 per cent from 1901 to 1951 and 2.68 per cent
from 1951 to 2001. From 1901 to 1951, population in NER increased by 140 per cent while
for that of India it was 51 per cent. In the post‐independence period, population increased
by 275 per cent against the national average of 185 per cent. Migration to the region has
been an important contributing factor to the rapid increase in population in the region41. In
such a scenario it is worthwhile to look briefly at the various human development
components of the region. Few selected indicators have been considered e.g. total fertility
rate, literacy, gender difference in literacy, sex ratio, and infant mortality rate. Estimation on
these measures leading to a composite human development index has not been undertaken
since these measures are very limited considering the wide ranging issue of Human
Development Index. Table XXI: Selected Human Development Indicators in NER
Indicators Year A P Asm Mnp Mgh Mzo Nag Trp India
Total Fertility Rates
1998 2.52 3.2 3.04 4.57 2.89 3.77 N A 3.2
2005‐06 3 2.4 2.8 3.8 2.9 3.7 2.2 2.7
Literacy (%)
2001 54.34 63.25 70.53 62.56 88.8 66.6 73.19 65.38
2011 66.95 73.18 79.85 75.48 91.6 80.1 87.75 74.04
Male Literacy (%)
2001 65.43 75.23 80.33 71.18 92.5 76 82.42 75.85
2011 73.69 78.81 86.49 77.17 93.7 83.3 92.18 82.14
Female Literacy (%)
2001 40.23 51.85 61.46 50.43 86.8 56.9 64.33 54.16
2011 59.57 67.27 73.17 73.78 89.4 76.7 83.15 65.46
Gender Difference In Literacy (%)
2011 14.12 11.54 13.32 3.39 4.32 6.6 9.03 16.68
Sex Ratio (Total Population)
1991 859 923 958 955 921 886 945 927
2001 893 935 974 972 935 900 948 933
2011 920 954 987 986 975 931 961 940
Sex Ratio (0‐6 age)
2001 964 965 957 973 964 964 966 927
2011 960 957 934 970 971 944 953 914
Infant Mortality Rate
1998‐99 63 69 37 89 37 42 44 67
2004‐05 61 66 30 45 34 38 52 57
Source: 1998‐99 data are from NFHS‐I and 2004‐05 data are from NFHS‐III, literacy rates are accessed from
http://www.census2011.co.in/literacy.php other data relate to The Planning Commission’s, Xth Plan Document
During 1991‐2001, the highest growth rate of population among the states in India
has been registered in Nagaland (4.97 per cent) followed by Manipur (2.63 per cent) and
Meghalaya (2.62 per cent). Migration from within India as well as from outside must have
played an important part in this growth rate but the Total Fertility Rates of these states in
the region have also added to this rise. In demographic studies where a TFR of 2.1 is
considered to be the replacement level of fertility, or in other words the desired rate for
population stabilisation42, none of the states in NER have achieved this level. Tripura is the
only state near to the stabilisation level with a TFR of 2.2, which is in fact lower than the
national rate. Assam has also a lower level of TFR. But states like Nagaland, Mizoram,
Manipur and Arunachal Pradesh have still a long way to go before reaching the ideal TFR
level.
In NER, Arunachal Pradesh, Assam and Meghalaya had lower literacy rates than India
in 2001. Mizoram has been the second most literate state in the country. During 2011,
Meghalaya has moved ahead and is now above the India average. This has been possible
mainly due to a higher rise among the female literates. In fact, among the states, the highest
increase (14.56 per cent) in literacy rates between the two census periods has been in
Tripura. It is also interesting to note that while Arunachal Pradesh, Assam and Meghalaya
have lower male literacy compared to India, in case of female literacy, only Arunachal has a
lower rate. The gender differences among all the states in NER are lower than in India and
Meghalaya has the least gender difference in literacy among all the states in India. This
certainly indicates lesser discrimination of the girl child in the North East in terms of access
to education.
Whereas four states namely Arunachal Pradesh, Assam, Mizoram and Nagaland had
a lower sex ratio than India during 1991, it has improved thereafter. During 2011, Arunachal
and Nagaland have lower sex ratio than the national average. But both the states have
remarkably improved their overall sex ratio during the last two decades. Sex ratio among
the 0‐6 age group was higher among all the states in the region compared to India. When
this ratio declined in almost all the states in India, Mizoram showed an increasing rate from
964 to 971 per thousand. This is certainly an encouraging attribute for human development
in the region.
The infant mortality rates were higher in Arunachal Pradesh, Assam and Meghalaya
vis‐à‐vis India during NFHS‐II43 in 1998‐99. During NHFS‐III44 in 2005‐06, Meghalaya has
reduced its IMR by half, which is now lower than India’s rate. Arunachal Pradesh and Assam
have higher rates in NER. But a disturbing trend is observed in the case of Tripura where
there has been an increase in the IMR from 44.2 to 52 during NFHS‐I & III. This needs to be
studied analytically in order to identify and rectify the impediments which are adversely
affecting the infant mortality rate in the state.
An overall analysis shows that the human development indicators of the region are
comparatively better compared to its economic indicators. As per the Planning
Commission’s Human Development Report 2001, there has been noteworthy progress in
Assam. While the state stagnated at the 26th position in the listing of all the Indian state
from 1981 to 1991, its ranking improved to 14th position during 2001. But due to the non‐
availability of data pertaining to 2001, the HDI ranking of other states could not be
ascertained. However, there are studies45 (2005) which place Mizoram (0.79), Nagaland
(0.77), Manipur (0.707) and Arunachal Pradesh (0.617) above the all India rates (0.612)
whereas Tripura (0.608), Meghalaya (0.585) and Assam (0.534) remain below the national
average. However, all the states in NER are placed in the Medium Human Development
Category States.
c) Index of Production and Consumption Dependency
Estimating the production and consumption share of agricultural, horticultural and
animal products of NER and comparing them with the all India estimates would have
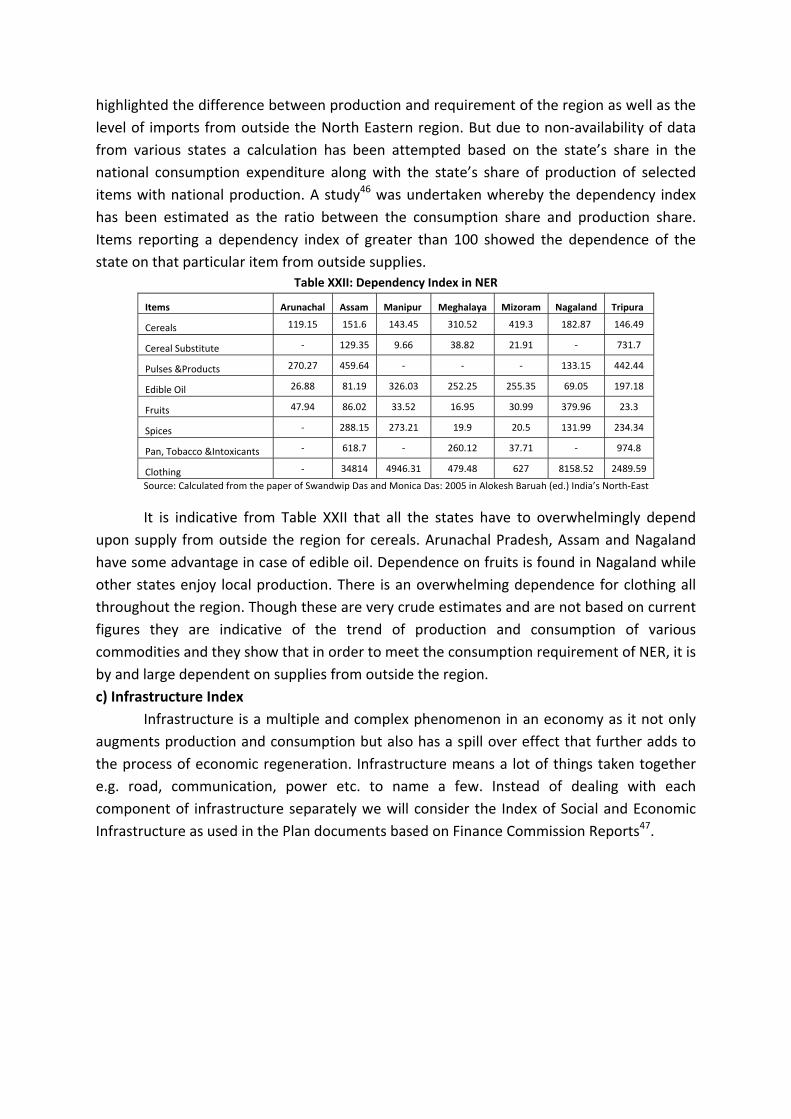
highlighted the difference between production and requirement of the region as well as the
level of imports from outside the North Eastern region. But due to non‐availability of data
from various states a calculation has been attempted based on the state’s share in the
national consumption expenditure along with the state’s share of production of selected
items with national production. A study46 was undertaken whereby the dependency index
has been estimated as the ratio between the consumption share and production share.
Items reporting a dependency index of greater than 100 showed the dependence of the
state on that particular item from outside supplies. Table XXII: Dependency Index in NER
Items Arunachal Assam Manipur Meghalaya Mizoram Nagaland Tripura
Cereals 119.15 151.6 143.45 310.52 419.3 182.87 146.49
Cereal Substitute ‐ 129.35 9.66 38.82 21.91 ‐ 731.7
Pulses &Products 270.27 459.64 ‐ ‐ ‐ 133.15 442.44
Edible Oil 26.88 81.19 326.03 252.25 255.35 69.05 197.18
Fruits 47.94 86.02 33.52 16.95 30.99 379.96 23.3
Spices ‐ 288.15 273.21 19.9 20.5 131.99 234.34
Pan, Tobacco &Intoxicants ‐ 618.7 ‐ 260.12 37.71 ‐ 974.8
Clothing ‐ 34814 4946.31 479.48 627 8158.52 2489.59
Source: Calculated from the paper of Swandwip Das and Monica Das: 2005 in Alokesh Baruah (ed.) India’s North‐East
It is indicative from Table XXII that all the states have to overwhelmingly depend
upon supply from outside the region for cereals. Arunachal Pradesh, Assam and Nagaland
have some advantage in case of edible oil. Dependence on fruits is found in Nagaland while
other states enjoy local production. There is an overwhelming dependence for clothing all
throughout the region. Though these are very crude estimates and are not based on current
figures they are indicative of the trend of production and consumption of various
commodities and they show that in order to meet the consumption requirement of NER, it is
by and large dependent on supplies from outside the region.
c) Infrastructure Index
Infrastructure is a multiple and complex phenomenon in an economy as it not only
augments production and consumption but also has a spill over effect that further adds to
the process of economic regeneration. Infrastructure means a lot of things taken together
e.g. road, communication, power etc. to name a few. Instead of dealing with each
component of infrastructure separately we will consider the Index of Social and Economic
Infrastructure as used in the Plan documents based on Finance Commission Reports47.
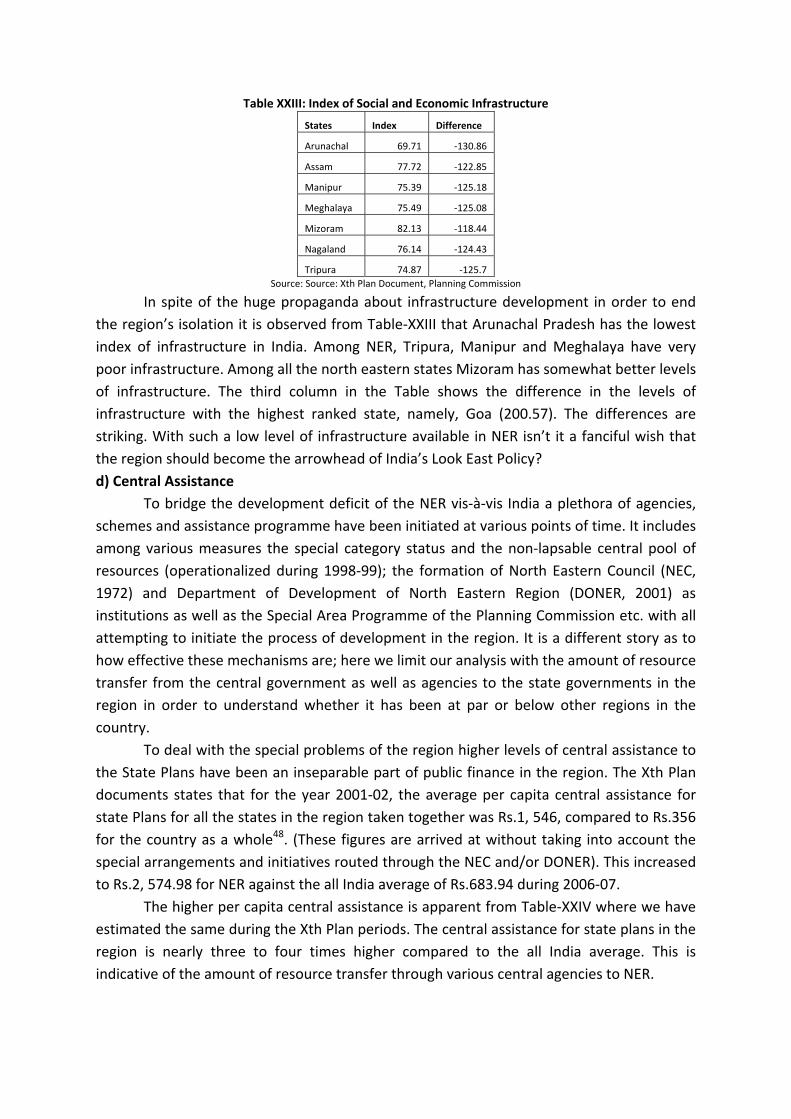
Table XXIII: Index of Social and Economic Infrastructure
States Index Difference
Arunachal 69.71 ‐130.86
Assam 77.72 ‐122.85
Manipur 75.39 ‐125.18
Meghalaya 75.49 ‐125.08
Mizoram 82.13 ‐118.44
Nagaland 76.14 ‐124.43
Tripura 74.87 ‐125.7
Source: Source: Xth Plan Document, Planning Commission
In spite of the huge propaganda about infrastructure development in order to end
the region’s isolation it is observed from Table‐XXIII that Arunachal Pradesh has the lowest
index of infrastructure in India. Among NER, Tripura, Manipur and Meghalaya have very
poor infrastructure. Among all the north eastern states Mizoram has somewhat better levels
of infrastructure. The third column in the Table shows the difference in the levels of
infrastructure with the highest ranked state, namely, Goa (200.57). The differences are
striking. With such a low level of infrastructure available in NER isn’t it a fanciful wish that
the region should become the arrowhead of India’s Look East Policy?
d) Central Assistance
To bridge the development deficit of the NER vis‐à‐vis India a plethora of agencies,
schemes and assistance programme have been initiated at various points of time. It includes
among various measures the special category status and the non‐lapsable central pool of
resources (operationalized during 1998‐99); the formation of North Eastern Council (NEC,
1972) and Department of Development of North Eastern Region (DONER, 2001) as
institutions as well as the Special Area Programme of the Planning Commission etc. with all
attempting to initiate the process of development in the region. It is a different story as to
how effective these mechanisms are; here we limit our analysis with the amount of resource
transfer from the central government as well as agencies to the state governments in the
region in order to understand whether it has been at par or below other regions in the
country.
To deal with the special problems of the region higher levels of central assistance to
the State Plans have been an inseparable part of public finance in the region. The Xth Plan
documents states that for the year 2001‐02, the average per capita central assistance for
state Plans for all the states in the region taken together was Rs.1, 546, compared to Rs.356
for the country as a whole48. (These figures are arrived at without taking into account the
special arrangements and initiatives routed through the NEC and/or DONER). This increased
to Rs.2, 574.98 for NER against the all India average of Rs.683.94 during 2006‐07.
The higher per capita central assistance is apparent from Table‐XXIV where we have
estimated the same during the Xth Plan periods. The central assistance for state plans in the
region is nearly three to four times higher compared to the all India average. This is
indicative of the amount of resource transfer through various central agencies to NER.
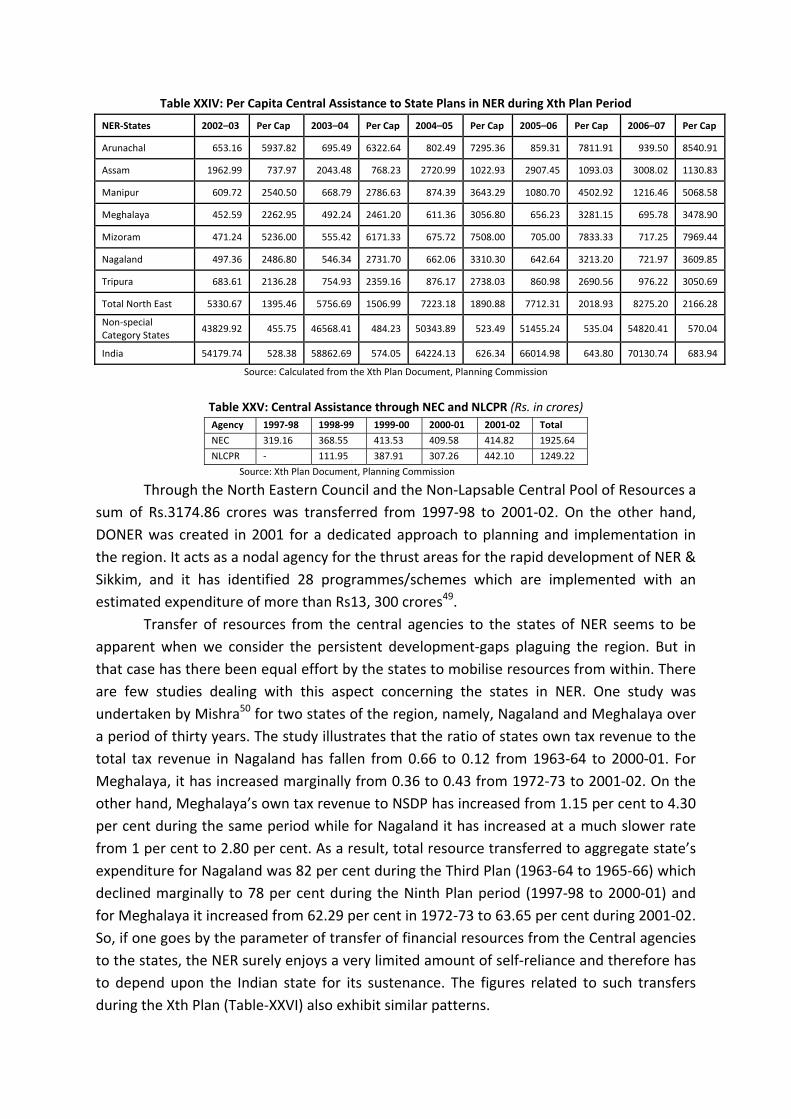
Table XXIV: Per Capita Central Assistance to State Plans in NER during Xth Plan Period
NER‐States 2002–03 Per Cap 2003–04 Per Cap 2004–05 Per Cap 2005–06 Per Cap 2006–07 Per Cap
Arunachal 653.16 5937.82 695.49 6322.64 802.49 7295.36 859.31 7811.91 939.50 8540.91
Assam 1962.99 737.97 2043.48 768.23 2720.99 1022.93 2907.45 1093.03 3008.02 1130.83
Manipur 609.72 2540.50 668.79 2786.63 874.39 3643.29 1080.70 4502.92 1216.46 5068.58
Meghalaya 452.59 2262.95 492.24 2461.20 611.36 3056.80 656.23 3281.15 695.78 3478.90
Mizoram 471.24 5236.00 555.42 6171.33 675.72 7508.00 705.00 7833.33 717.25 7969.44
Nagaland 497.36 2486.80 546.34 2731.70 662.06 3310.30 642.64 3213.20 721.97 3609.85
Tripura 683.61 2136.28 754.93 2359.16 876.17 2738.03 860.98 2690.56 976.22 3050.69
Total North East 5330.67 1395.46 5756.69 1506.99 7223.18 1890.88 7712.31 2018.93 8275.20 2166.28
Non‐special Category States
43829.92 455.75 46568.41 484.23 50343.89 523.49 51455.24 535.04 54820.41 570.04
India 54179.74 528.38 58862.69 574.05 64224.13 626.34 66014.98 643.80 70130.74 683.94
Source: Calculated from the Xth Plan Document, Planning Commission
Table XXV: Central Assistance through NEC and NLCPR (Rs. in crores)
Agency 1997‐98 1998‐99 1999‐00 2000‐01 2001‐02 Total
NEC 319.16 368.55 413.53 409.58 414.82 1925.64
NLCPR ‐ 111.95 387.91 307.26 442.10 1249.22
Source: Xth Plan Document, Planning Commission
Through the North Eastern Council and the Non‐Lapsable Central Pool of Resources a
sum of Rs.3174.86 crores was transferred from 1997‐98 to 2001‐02. On the other hand,
DONER was created in 2001 for a dedicated approach to planning and implementation in
the region. It acts as a nodal agency for the thrust areas for the rapid development of NER &
Sikkim, and it has identified 28 programmes/schemes which are implemented with an
estimated expenditure of more than Rs13, 300 crores49.
Transfer of resources from the central agencies to the states of NER seems to be
apparent when we consider the persistent development‐gaps plaguing the region. But in
that case has there been equal effort by the states to mobilise resources from within. There
are few studies dealing with this aspect concerning the states in NER. One study was
undertaken by Mishra50 for two states of the region, namely, Nagaland and Meghalaya over
a period of thirty years. The study illustrates that the ratio of states own tax revenue to the
total tax revenue in Nagaland has fallen from 0.66 to 0.12 from 1963‐64 to 2000‐01. For
Meghalaya, it has increased marginally from 0.36 to 0.43 from 1972‐73 to 2001‐02. On the
other hand, Meghalaya’s own tax revenue to NSDP has increased from 1.15 per cent to 4.30
per cent during the same period while for Nagaland it has increased at a much slower rate
from 1 per cent to 2.80 per cent. As a result, total resource transferred to aggregate state’s
expenditure for Nagaland was 82 per cent during the Third Plan (1963‐64 to 1965‐66) which
declined marginally to 78 per cent during the Ninth Plan period (1997‐98 to 2000‐01) and
for Meghalaya it increased from 62.29 per cent in 1972‐73 to 63.65 per cent during 2001‐02.
So, if one goes by the parameter of transfer of financial resources from the Central agencies
to the states, the NER surely enjoys a very limited amount of self‐reliance and therefore has
to depend upon the Indian state for its sustenance. The figures related to such transfers
during the Xth Plan (Table‐XXVI) also exhibit similar patterns.
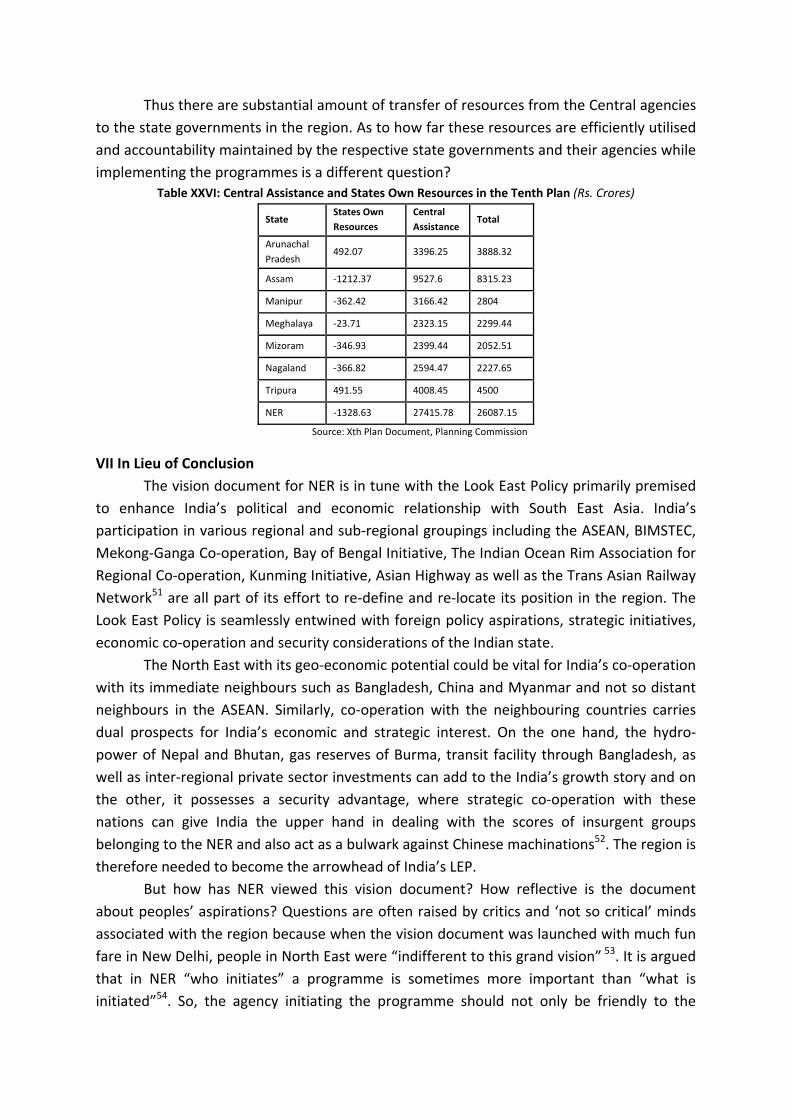
Thus there are substantial amount of transfer of resources from the Central agencies
to the state governments in the region. As to how far these resources are efficiently utilised
and accountability maintained by the respective state governments and their agencies while
implementing the programmes is a different question? Table XXVI: Central Assistance and States Own Resources in the Tenth Plan (Rs. Crores)
State States Own
Resources
Central
Assistance Total
Arunachal
Pradesh 492.07 3396.25 3888.32
Assam ‐1212.37 9527.6 8315.23
Manipur ‐362.42 3166.42 2804
Meghalaya ‐23.71 2323.15 2299.44
Mizoram ‐346.93 2399.44 2052.51
Nagaland ‐366.82 2594.47 2227.65
Tripura 491.55 4008.45 4500
NER ‐1328.63 27415.78 26087.15
Source: Xth Plan Document, Planning Commission
VII In Lieu of Conclusion
The vision document for NER is in tune with the Look East Policy primarily premised
to enhance India’s political and economic relationship with South East Asia. India’s
participation in various regional and sub‐regional groupings including the ASEAN, BIMSTEC,
Mekong‐Ganga Co‐operation, Bay of Bengal Initiative, The Indian Ocean Rim Association for
Regional Co‐operation, Kunming Initiative, Asian Highway as well as the Trans Asian Railway
Network51 are all part of its effort to re‐define and re‐locate its position in the region. The
Look East Policy is seamlessly entwined with foreign policy aspirations, strategic initiatives,
economic co‐operation and security considerations of the Indian state.
The North East with its geo‐economic potential could be vital for India’s co‐operation
with its immediate neighbours such as Bangladesh, China and Myanmar and not so distant
neighbours in the ASEAN. Similarly, co‐operation with the neighbouring countries carries
dual prospects for India’s economic and strategic interest. On the one hand, the hydro‐
power of Nepal and Bhutan, gas reserves of Burma, transit facility through Bangladesh, as
well as inter‐regional private sector investments can add to the India’s growth story and on
the other, it possesses a security advantage, where strategic co‐operation with these
nations can give India the upper hand in dealing with the scores of insurgent groups
belonging to the NER and also act as a bulwark against Chinese machinations52. The region is
therefore needed to become the arrowhead of India’s LEP.
But how has NER viewed this vision document? How reflective is the document
about peoples’ aspirations? Questions are often raised by critics and ‘not so critical’ minds
associated with the region because when the vision document was launched with much fun
fare in New Delhi, people in North East were “indifferent to this grand vision” 53. It is argued
that in NER “who initiates” a programme is sometimes more important than “what is
initiated”54. So, the agency initiating the programme should not only be friendly to the
people but also a knowledgeable part of the process. Any new formulation undertaken by
the Indian state often leads to indifference among the people as they are more influenced
by retrospection instead of future windfalls. There were some attempts made prior to the
finalisation of the vision document, to place it for discussion in the public domain. But either
they were meant to be mere window dressings or the draft committee had little knowledge
of the public space in NER. Public space or for that matter public sphere and their
organisations e.g. the civil society in the region is jettisoned between the state and its
agenda of counter‐insurgency from ‘above’ and the ethno‐nationalist politics of identity
assertion from ‘below’. This leaves very little space for the people and the civil society to
speak in a different tone that does not adhere to either of the two viewpoints. It is not only
a constricted domain but a dangerous space to fiddle with. In this ‘controlled’ public space,
the ‘public’ which occupies the space is either the beneficiary of the state or the
representatives of dominant ethnic groups rewarded for playing to the tunes of the state55.
Therefore, it is hardly surprising that there was no recorded dissent related to the vision
document prepared by six authors and six research associates where only one belonged to
from the region (Assam) 56 during the so‐called discussion with the people of the region. So
the view that people of the region overwhelmingly accepted the document may have few
takers.
Secondly, what are the benefits that will accrue to NER with its current macro‐
economic fundamentals? The trends in our analysis reveal that the contribution of the
primary sector or more specifically agriculture has fallen to nearly a quarter of the NSDP yet
the workforce engaged in this sector has stagnated at about 75 per cent in the rural areas.
On the other hand, there has been an increase in the workforce engaged in this sector in the
urban areas. This indicates that agriculture is overcrowded and also shows that the
development agenda has failed to create opportunities for the shift of workforce to other
sectors. Under these circumstances can only technology‐infusion in agriculture change the
situation?
The secondary sector shows a marginal rise in its contribution to NSDP. But in terms
of workforce employed there is hardly any significant change both in rural and urban areas.
Moreover, whatever improvement that occurred in terms of contribution of this sector has
come from construction. Manufacturing has shown a declining trend both in terms of state
income and employment. Does this indicate a process of deindustrialisation in the region?
The vision document seems to have minced few words to reverse this situation. The long list
of resources endowments that the region is bestowed with does not carry any meaning if
they are not utilised through manufacturing units. There is another aspect to this argument
and that is related to the employment potential that manufacturing possesses. It is
calculated that during the period 1999‐2000 and 2004‐05, manufacturing had the highest
employment elasticity among all other sectors in the economy despite its lower growth
rate57.
The contribution of the tertiary sector has grown by more than 7 percentage points
but it has failed to create additional employment opportunities. Here it is noteworthy that
public administration plays the most significant part in this sector and is the largest source
of urban employment among all the states of NER. Trade, hotels and restaurants employs
nearly one‐quarter of the urban workforce in the region. The question therefore is whether
the higher tertiary sector contribution to the state’s income in the region portrays a strong
economic foundation in NER? The answer seems to be less than affirmative since the
robustness of this tertiary sector is based on public administration and ‘other’ services
instead of other sub‐sectors such as transport, trade, financial services etc. This skewed
nature of the composition of the tertiary sector fails to add much vibrancy to the economic
system and is therefore more of a residual category.
We have observed in our analysis that the rates of unemployment in NER for all
categories (usual, weekly, daily, youth and educated) are very high compared to the rest of
India. It is acute among the youth and more so among the educated youths in the region.
Urban unemployment is higher than in rural areas. Among the youth, the rate of rural
unemployment is higher among males other than in Assam and Tripura while for urban
youth females outnumber males except for Manipur and Meghalaya. For the educated
youth, female unemployment is substantially higher in urban areas. This raises some serious
questions about the type of education imparted as well as the development agenda pursued
in the region in terms of its ability to utilise the manpower generated in NER.
Even a cursory look at the macro‐economic trends and the associated figures will
suggest that the region is caught in a trap of low equilibrium which is sub‐optimal by all
parameters. It needs stimulus for growth which perhaps the vision document identifies in
the form of infrastructure creation and generation of border trade.
Thirdly, the entire hullabaloo in the vision document about border trade being a
panacea for the development of the beleaguered North East generates more heat than
light. Analysis of border trade reveals that the trade that flourishes between NER and the
NC’s is not formal but informal. The range of commodities, the quantum of trade and the
innovation in trading routes are more dynamic in case of informal trade. Ironically, a more
vibrant informal trade is lucrative not only for its players but also for the state and non‐state
agencies. While enquiring about the reasons for high transportation cost of goods through
roadways in NER it was clear that other than hire charges, payment to various underground
groups and to every police station and forest check posts were essential. It was more so
because the trucks carried smuggled goods from Myanmar. But even the vehicles carrying
legal goods had to cough up similar amounts thereby adding to the cost of transportation
e.g. transportation expenditure from Moreh to Dimapur was about Rs. 50,000 per truck
whereas the same for Imphal to Guwahati was Rs. 35,00058.
Here it should be remembered that the aspiration for trade openness is an
important but not a sufficient condition for rapid growth of trade. Trade facilitation, which is
still a far cry in case of trade between NER (India) and its NC’s, happen to be the key factor
that promotes trade. Similarly, while highlighting the importance of tariff liberalisation to
foster trade it is often forgotten that transport liberalisation is also of equal importance in
this regard59. This has somewhat been neglected by our policy framers. India’s contradiction
regarding the opening of the Stilwell road connecting NER with Myanmar is a pointer in this
direction where formal trade liberalisation has failed to be substantiated by transport
liberalisation. In the same vein, trade liberalisation with Bangladesh is yet to bring about
major changes in transport liberalisation. The inability to access Chittagong port for the
traded goods and commodities of NER and the long list of non‐functional LCS’s does not
augur well for a transformation of trade relation.
There are other trade related problems between NER and the NC’s which have to be
dealt with policy reformulations. Formal trade with Myanmar has in fact become restricted
to fewer items (22) now compared to pre‐1994 Border Agreement. These items are found to
be unfavourable for exchange by the traders due to their short supply. The list of viable
items for trading has to be expanded further to boost normal trading relations. On the
other, the local Moreh market has been adversely affected after the Indo‐Myanmar Border
Trade Agreement. It is reported that after the completion of the Nonpalang Market (later on
Tamu Market) on Myanmar’s side by their respective authorities, people from Moreh and
other nearby areas walk to this market through Gate‐II (through which trade on head load is
allowed) and come back after purchasing their required commodities. The local market at
Moreh therefore bears a forlorn appearance60.
The NER‐Myanmar trade suffers from another set of problems. The official exchange
rate of Kyat (the Myanmar currency) is highly overvalued. The official value of Kyat is about
200 times over‐valued in relation to the Indian Rupee61, which makes informal trade more
lucrative. The rule whereby exports from India must precede imports from Myanmar and
the balancing to be completed within a period of six months complicates the process
further. Moreover, India's obsession with Rule of Origin (ROO) certificates for the trading
items i.e. the original country certificate where the commodity is produced and/or
manufactured and Myanmar’s stand of opposing it is hampering regional trade62. Although
India’s concern about ROO is a desperate measure to check dumping of cheap Chinese
goods in Indian markets, considering the fact that Myanmar is already a member of ASEAN,
Rule of Origin certificates does not stand on firm grounds. In fact, it is high time that the RTA
with Myanmar should be re‐looked and updated accordingly to reflect the ground level
trade requirements.
Now with what basket of goods will the NER trade with the NC’s? Has there been any
change in the composition of trade after trade liberalisation? A glimpse into the list of
traded commodities shows that there has been absolutely no change in the commodity
basket. The main formal exports to Myanmar is dried buffalo meat comprising 59 per cent
of the total value of exports while more than 97 per cent of the exported commodities from
NER comprises primary materials namely, tea, coal, limestone and boulders. The latter items
are exported to Bangladesh63 to meet their industrial requirements. While a 14 km conveyer
belt supplying limestone from Kommorah mines to Chattak Cement Company and another
150 km conveyer belt supplying the same raw material from Nongtrai mines to Lafarge
Surma factory in Bangladesh can be regarded as unique industrial architectures, it also
raises important questions about the inability of the state to properly utilise these materials.
Under this situation, where does the vision for “establishment of export oriented units in
the NER the fall out of which is acceleration in social and industrial facilities in the region” 64
work out? Has the region been able to benefit from the economies of scale in production,
externalities and technological innovation? It doesn’t, since there is no production units
located here. In that case the benefit to the region is minimal. It is only that of a supplier of
raw material and a pathway through which the commodities pass.
Fourthly, while one of the cornerstones of Indian development agenda seems to be
‘decentralisation’ the vision document of NER chalks out a different path albeit without
mentioning it. As discussed in our analysis, all the states of NER are severely dependent
upon transfer of resources from the Central agencies due to their inability to garner own
financial resources. Thereby, the vision document reiterates that it is therefore necessary to
have not only centralised funding through DONER but framing of policies and guidelines
should also be done by the same agency. The state governments in the same way will
distribute the funds to the district and village level institutions65. This is not only
centralisation of funding but of thought process too. The centre‐state client‐patron relation
works down to the district level so that loyalty and control is not vitiated. This sort of
centralisation not only breeds corruption but also lessens accountability. Moreover, it will
also lead to further alienation in this already alienated periphery of India.
It should be remembered that as the spatial entity of NER does not overlap with its
economic entity (there are wide ranging variations among the states as well as within
them); there is an urgent requirement for synchronisation of policies and the agenda for
development. This synchronisation should lead to integration rather than centralisation (as
visualised in the vision document). Each individual state in the region is small by all
standards, geographical limits as well as the size of the market. Hence, it is imperative that
we move towards an agenda for a common regional market whereby there is mobility of
goods, factors of production as well as division of labour and lesser duplication of
investment along with opportunities for specialisation. Only then can we have a common
development programme covering the entire region66. The North East Industrial Policy,
1997, is a failure in this direction where the disbursed incentive and revenue forgone for all
the individual states in the region has been Rs.1664.76 crores for a total investment of
Rs.1067.28 crores67. This is surely a case of lack of synchronization in the development
agenda. Can this be regarded as an efficient instrument for promoting industrial growth?
Trade can be an option once we have this kind of integrated approach for NER. But it
must be regarded that trade liberalisation (in terms of international trade) does not have
the same consequences for all the areas. Effects of trade liberalisation on poverty reduction
are not uniform over districts. District level analysis in India68 shows insignificant benefits of
liberalisation with respect to poverty reduction for districts with more exposure to potential
foreign competition. In this regard, regional trade within NER will be a better option instead
of overemphasis on cross border trade (of course without denying its potential) where geo‐
political rather than geo‐economical consideration reign supreme. Establishment of
transport linkages and infrastructure development hereby gains momentum. Efforts should
be undertaken to link all the states with Assam in a much more broadbased way as for them
it is not only the gateway to Indian mainland but also the only pathway to travel from one
state to another and also among the state itself69. Economic integration of the market can
bring about the much required unity of the region which has been otherwise affected by a
process of political disintegration.
Only pumping of central funds and stamping of authority through big development70
projects will lead to dysfunctional development. Centralisation of funds and policy making
will lead to further corruption and alienation. Mere lip service regarding border trade and
showcasing North East as the arrowhead of the much hyped Look East Policy will mean
‘little’ to the people in the region if their growing realisation suggests that under the present
scenario securing the pathway for trade (with only few commodities from the region) is
prime for the Indian state, while ameliorating their condition happens to be the secondary
agenda. Therefore, unless the vision is embedded in the reality of how people foresee their
wellbeing, grandiose designs that the Indian state aspires to erect in the region will not be
realized.
Acknowledgement
I am grateful to all my faculty members, especially Md. Zakaria Siddiqui for his analytical skills,
Professor Amiya Kumar Bagchi and Dr. Ramkrishna Chatterjee for their encouragement during the course of
writing this paper. I owe a lot to Prof. Arunodoy Saha, Vice‐Chancellor, Tripura University for his critical
comments, Mr. Susobhan Talukdar, Planning Commission, New Delhi, for providing me with publications
related to North East India and Dr. Panchanan Das, formerly associated with IDSK for technical insights.
Notes& References 1 The Prime Minister of India, Dr Manmohan Singh, launched the North Eastern Region: Vision 2020 in July
2008 in New Delhi. For a region which hit the headlines for reasons other than development such as
insurgency, dislocation, security threat, drugs and smuggling, this was surely a moment with difference. Retrospectively, insurgency in North East India is a prolonged phenomenon and so is the counter‐insurgency
operation launched by the Indian state. All the states in the region except for Arunachal Pradesh (which also
has a substantial presence of Naga insurgents in Changlang district and adjoining areas) have been a victim of
these operations. More than 2, 80,000 military personnel are deployed in the region and more than Rs 1,858
crores have been spent from 2004‐05 to 2009‐10 and more than 4,551 persons have been killed between 2007
to March 2010 due to various insurgency related operations. The Armed Forces Special Power Act 1958
(AFSPA) which was passed in the Parliament as a “temporary” measure confined to deal with Naga hostilities
has been extended to 101 districts in India. But the end to insurgency remains a distant dream as new entrants
join the ranks and groups of insurgents. Dealing with this ethnic violence has remained within the precincts of
law and order for the Indian state while for those fighting against the state, it remains a legitimate cause. In
the on‐going saga of violence and counter‐violence, the state attempts to relocate the population groups who
are supposedly regarded as the sympathisers to the cause of the insurgents. Mizoram bears a testimony to this
pattern, whereas loss of life and property has affected each and every state in the region with varying
proportions. For a detailed analysis on human rights violation and the role of AFSPA see Navlakha, Gautam,
“On Ending the War against our Own People”, Economic & Political Weekly, February 19, 2011, vol. XLVI, No.8,
pp.24‐28 and for dislocation in Mizoram see, Sundar, Nandini, “Interning Insurgent Population: The Buried
Histories of Indian Democracy”, Economic & Political Weekly, February 5, 2011, vol. XLVI, No.6, pp.47‐57. For
an account of deaths and cost of internal security see http://mha.nic.in/uniquepage.asp?Id_Pk=238 2 Ray, Asok, Kumar, Whither North East India (New Delhi: Om Publications, 2010), pp.192‐93
3 North Eastern Region Vision 2020, Vol. II (New Delhi: Ministry of Development of North Eastern Region,
2008), p.223
4 op cit no.3, p.225
5 op cit no.3, p.261
6 Bezbaruah, M.P, & Dutta, M.K, “Development Experience and Perspective in the North Eastern Region”,
Assam Economic Journal, Vol. XVII, 2004, pp. 47‐56
7 For a detailed analysis regarding the divergence of rates of unemployment among different categories and
their impact on the economy, see, Bagchi, Amiya, Kumar and Das, Panchanan, “Changing Pattern of
Employment under Neo‐liberal Reforms: A Comparative Study of West Bengal and Gujarat”, Indian Journal of
Labour Economics, Vol.48, No.4, pp.945‐973
8 Das, Gurudas, Trade Between the North‐Eastern Region and Neighbouring Countries: Structures and
Implications for Development in Das, Gurudas & Purkayastha, R, K, (eds.), Border Trade: North‐East India and
Neighbouring Countries (New Delhi: Akansha Publishing House, 2000), p. 23‐52
9 ibid
10 ibid
11 Task Force on Connectivity of Trade and Investment in North‐East Regions (New Delhi: Planning
Commission, 2006), p. 38
12 http://megplanning.gov.in/report/Task_Force_Report.pdf
13 ibid
14 ibid
15 Khathing, J.S.R, Indo‐Myanmar Border Trade in Das, Gurudas, Singh, Bijoy, N and Thomas, C.J, Indo‐
Myanmar Border Trade: Status, Problems and Potentials (New Delhi: Akansha Publishing House, 2005), pp.41‐
63
16 ibid
17 Bezbaruah, M.P, “Indo‐Myanmar Border Trade: The Stakes for North East India” accessed at
http://w.w.w.asthabharati.org/Dia_July07/m.p.%20bez%20.htm
18 http://megplanning.gov.in/report/Task_Force_Report.pdf
19 Industrial Development and Export Potential of the North Eastern Region (New Delhi: Indian Institute of
Foreign Trade, 1995)
20 op cit no.8, p.43
21 Border Trade with Bangladesh and Myanmar: Pre‐Investment Feasibility Report (Guwahati: Indian Institute
of Entrepreneurship, 2001)
22 op cit no.17
23 Baruah, Srinath, Certain Observation on Informal Border Trade with Neighbouring Countries and Economic
Prospects of the North Eastern Region, in Das, Gurudas, Singh, Bijoy, N and Thomas, C.J, Indo‐Myanmar Border
Trade: Status, Problems and Potentials (New Delhi: Akansha Publishing House, 2005), p.56
24 There is huge price difference of various commodities in Moreh (due to accessibility from Myanmar) and
other areas in Manipur e.g. nationals from Myanmar sold onion at Rs 5 per kg while the shops in other parts of
Manipur charged Rs 28, Manipuri rice sold for Rs 12.50 a kg in Manipur whereas such varieties are sold for Rs 9
at Moreh border. For a detailed discussion on price difference, see, Sarma, B,K & Goswami, S,N, Border Trade
in North East India: An Overview, in Das, Gurudas, Singh, Bijoy, N and Thomas, C.J, Indo‐Myanmar Border
Trade: Status, Problems and Potentials (New Delhi: Akansha Publishing House, 2005), p.98
25 op cit, no.8, pp.42‐43
26 op cit, no.17
27 op cit, no18
28 op cit, no.8, pp.32‐33
29 Halder, Dilip, Cross‐Border Trade between India and Bangladesh: A Comparison between West Bengal and
North Eastern Region, in Das, Gurudas &Thomas, C, J, Indo‐ Bangladesh Border Trade: Benefiting From
Neighbourhood (New Delhi: Akansha Publishing House, 2008), pp.209‐10
30 Chaudhuri, Sudhakar, K, Cross Border Trade Between India and Bangladesh, Working Paper No.58, NCAER,
New Delhi, 1995
31 India’s Border Trade with Select Neighbouring Countries (New Delhi: Research and Information System,
1996)
32 Bakht, Zaid, Cross Border Illegal Trade in Bangladesh: Composition, Trends and Policy Issues (Dhaka:
Bangladesh Institute of Development Studies, 1996)
33 Rahman, Atier, Bangladesh‐India Economic Relations: Potentials and Imperatives, Artha Beekshan,
December 2004, Vol.13, No.3
34 op cit, no. 29, p214
35 ibid
36 op cit, no. 29, p215
37 Kakoty, Sanjeeb, Trade and Trade Routes: Historical Perspective, in Das, Gurudas &Thomas, C, J, Indo‐
Bangladesh Border Trade: Benefiting From Neighbourhood (New Delhi: Akansha Publishing House, 2008), pp.
312‐13
38 op cit, no.37, pp.318‐20
39, India, Bangla to sign ‘border haat’ deal, The Assam Tribune, October 10, 2010
40 State Plans: Trends, Concerns and Strategies, Vol. III, Tenth Five Year Plan 2002‐07, (New Delhi: Planning
Commission, 2002), p 42
41 Das, Madhushree and Kar, Bimal, Kumar, Population Growth and Changes in Demographic Structures in
North East India, in Deb, B,J, (ed.) Population and Development in North East India (New Delhi: Concept
Publishing House, 2010), pp.20‐23
42 op cit, no. 40, pp.45‐46
43 http://www.nfhsindia.org/nfhs2.shtml
44 http://www.nfhsindia.org/nfhs3.shtml
45 http://en.wikipedia.org/wiki/List_of_Indian_states_and_territories_by_Human_Development_Index
46 Das, Sandwip, Kumar & Das, Monica, Convergence in the Consumption Behaviour: A North‐East
Perspective, in Baruah, Alokesh, (ed.), India’s North‐ East: Developmental Issues In A Historical Perspective
(New Delhi: Manohar& Centre De Sciences Humaines, 2005), pp.331‐51
47 op cit, no.40, pp. 59‐60
48 op cit, no.40, p92
49 op cit, no.40, p94
50 Mishra, B, Public Resource and Its Utilisation: Implications for Development of North‐Eastern Region, in
Das, Gurudas, (ed.), Structural Change and Strategy of Development: Resource‐Industry Linkages in North‐East
India (New Delhi: Akansha Publishing House, 2005), pp.265‐98
51 For a detailed analysis India’s regional and sub‐regional engagements in Asia and their overall implications
in terms of the Look East Policy, see, Saint‐Mezard, Isabel, Eastward Bound: India’s New Positioning in Asia
(New Delhi: Manohar, 2006)
52 McDuie‐Ra, Duncan, “Vision 2020 or re‐vision 1958: the contradictory politics of counter‐insurgency in
India’s regional engagement”, in Contemporary South Asia, Vol.17, No.3, September 2009, pp. 313‐30
53 ibid
54 Das, Samir, Kumar, Looking East via the Northeast: The Ethnic Dimension, accessed at
http://www.mcrg.ac.in/sd.htm
55 op cit, no.52
56 op cit, no.2, p193
57 Employment elasticity is defined as the percentage change in employment in a particular sector divided by
percentage change in its output. Here we have used the log of the variables for our calculation. Estimates were
done by comparing two time periods 1999‐2000 and 2004‐05, the results are as follows:
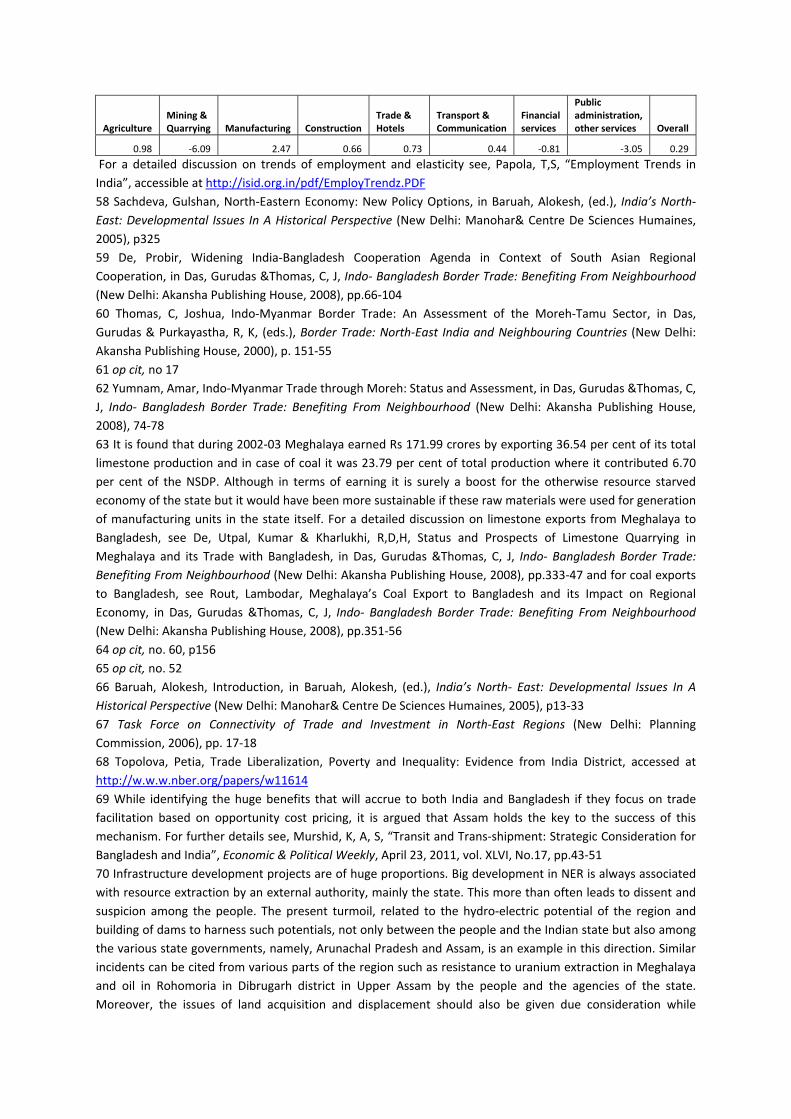
Agriculture Mining & Quarrying Manufacturing Construction
Trade & Hotels
Transport & Communication
Financial services
Public administration, other services Overall
0.98 ‐6.09 2.47 0.66 0.73 0.44 ‐0.81 ‐3.05 0.29
For a detailed discussion on trends of employment and elasticity see, Papola, T,S, “Employment Trends in
India”, accessible at http://isid.org.in/pdf/EmployTrendz.PDF
58 Sachdeva, Gulshan, North‐Eastern Economy: New Policy Options, in Baruah, Alokesh, (ed.), India’s North‐
East: Developmental Issues In A Historical Perspective (New Delhi: Manohar& Centre De Sciences Humaines,
2005), p325
59 De, Probir, Widening India‐Bangladesh Cooperation Agenda in Context of South Asian Regional
Cooperation, in Das, Gurudas &Thomas, C, J, Indo‐ Bangladesh Border Trade: Benefiting From Neighbourhood
(New Delhi: Akansha Publishing House, 2008), pp.66‐104
60 Thomas, C, Joshua, Indo‐Myanmar Border Trade: An Assessment of the Moreh‐Tamu Sector, in Das,
Gurudas & Purkayastha, R, K, (eds.), Border Trade: North‐East India and Neighbouring Countries (New Delhi:
Akansha Publishing House, 2000), p. 151‐55
61 op cit, no 17
62 Yumnam, Amar, Indo‐Myanmar Trade through Moreh: Status and Assessment, in Das, Gurudas &Thomas, C,
J, Indo‐ Bangladesh Border Trade: Benefiting From Neighbourhood (New Delhi: Akansha Publishing House,
2008), 74‐78
63 It is found that during 2002‐03 Meghalaya earned Rs 171.99 crores by exporting 36.54 per cent of its total
limestone production and in case of coal it was 23.79 per cent of total production where it contributed 6.70
per cent of the NSDP. Although in terms of earning it is surely a boost for the otherwise resource starved
economy of the state but it would have been more sustainable if these raw materials were used for generation
of manufacturing units in the state itself. For a detailed discussion on limestone exports from Meghalaya to
Bangladesh, see De, Utpal, Kumar & Kharlukhi, R,D,H, Status and Prospects of Limestone Quarrying in
Meghalaya and its Trade with Bangladesh, in Das, Gurudas &Thomas, C, J, Indo‐ Bangladesh Border Trade:
Benefiting From Neighbourhood (New Delhi: Akansha Publishing House, 2008), pp.333‐47 and for coal exports
to Bangladesh, see Rout, Lambodar, Meghalaya’s Coal Export to Bangladesh and its Impact on Regional
Economy, in Das, Gurudas &Thomas, C, J, Indo‐ Bangladesh Border Trade: Benefiting From Neighbourhood
(New Delhi: Akansha Publishing House, 2008), pp.351‐56
64 op cit, no. 60, p156
65 op cit, no. 52
66 Baruah, Alokesh, Introduction, in Baruah, Alokesh, (ed.), India’s North‐ East: Developmental Issues In A
Historical Perspective (New Delhi: Manohar& Centre De Sciences Humaines, 2005), p13‐33
67 Task Force on Connectivity of Trade and Investment in North‐East Regions (New Delhi: Planning
Commission, 2006), pp. 17‐18
68 Topolova, Petia, Trade Liberalization, Poverty and Inequality: Evidence from India District, accessed at
http://w.w.w.nber.org/papers/w11614
69 While identifying the huge benefits that will accrue to both India and Bangladesh if they focus on trade
facilitation based on opportunity cost pricing, it is argued that Assam holds the key to the success of this
mechanism. For further details see, Murshid, K, A, S, “Transit and Trans‐shipment: Strategic Consideration for
Bangladesh and India”, Economic & Political Weekly, April 23, 2011, vol. XLVI, No.17, pp.43‐51
70 Infrastructure development projects are of huge proportions. Big development in NER is always associated
with resource extraction by an external authority, mainly the state. This more than often leads to dissent and
suspicion among the people. The present turmoil, related to the hydro‐electric potential of the region and
building of dams to harness such potentials, not only between the people and the Indian state but also among
the various state governments, namely, Arunachal Pradesh and Assam, is an example in this direction. Similar
incidents can be cited from various parts of the region such as resistance to uranium extraction in Meghalaya
and oil in Rohomoria in Dibrugarh district in Upper Assam by the people and the agencies of the state.
Moreover, the issues of land acquisition and displacement should also be given due consideration while
undertaking these development programmes. It is important to understand that in a society where capitalist
relation of production is not the dominant form, the connotation attached to resource implies that it is
people’s resource and the ownership of state is not absolute in nature.
Appendix I: Usual Status (Adjusted) Unemployment Rates in NER
Place Male Female Person
Rural 50th 55th 61st 50
th 55th 61st 50
th 55
th 61st
Arunachal Pradesh
16 8 11 2 1 6 10 5 9
Assam 46 32 24 77 66 31 52 39 26
Manipur 12 21 14 7 15 7 10 19 11
Meghalaya 4 5 1 0 3 5 2 4 3
Mizoram 14 14 5 4 3 1 10 9 3
Nagaland 21 26 22 0 20 14 14 24 18
Tripura 14 7 96 58 44 320 23 12 133
All‐India 14 17 16 8 10 18 12 15 17
Urban
Female
Male Person
Arunachal Pradesh
17 14 11 73 100 28 26 29 12
Assam 55 77 24 256 189 91 89 97 72
Manipur 48 69 14 32 62 63 42 67 55
Meghalaya 10 34 1 31 68 35 17 46 35
Mizoram 5 34 5 5 24 26 5 30 19
Nagaland 69 93 22 64 87 72 68 91 55
Tripura 60 54 96 174 85 568 85 58 280
All‐India 40 45 16 62 57 69 45 47 45
Source: 50th, 55th and 61
st Rounds of NSSO
Appendix‐II: Percentage of usual unemployment (Adjusted)‐Persons
Rural 1993‐94 1999‐00 2004‐05 Urban 1993‐94 1999‐00 2004‐05
NER 4.47 2.76 2.61 NER 4.68 8.05 7.57
India 1.2 1.5 1.7 India 4.5 4.7 4.5
Appendix III: Current Weekly Status Unemployment Rates in NER, 1993‐94 to 2004‐05
Place
Rural Urban
Male Female Person Male Female Person
50
Th
55
th
61
St
50
Th
55
th
61
st
50
th
55
Th
61
st
50
th
55
th
61
st
50
Th
55
th
61
St
50
th
55
th
61
st
Aru’chal 18 11 18 4 1 6 12 7 13 17 24 23 72 91 108 26 27 42
Assam 54 45 36 111 88 62 65 53 41 57 84 75 267 197 113 91 104 81
Manipur 17 25 19 7 27 9 13 25 15 48 66 54 27 68 79 42 67 62
Megh’ya 5 5 1 0 3 6 3 4 3 14 34 32 32 68 36 18 46 34
Miz’am 14 18 7 5 4 7 11 12 7 2 29 12 4 24 22 4 27 15
Naga’nd 20 26 36 6 22 17 17 24 27 69 97 45 68 98 92 69 96 59
Tripura 21 9 97 85 46 333 32 13 135 70 57 167 203 89 578 97 62 282
All‐India 30 39 38 30 37 42 30 38 39 52 56 52 84 73 90 58 59 60
Source: 50th,55
th and 61
st Rounds of NSSO
Appendix IV: Percentage of current weekly unemployment‐Persons
Rural 1993‐94 1999‐00 2004‐05 Urban 1993‐94 1999‐00 2004‐05
NER 5.62 3.69 3.62 NER 4.81 8.26 7.93
India 3 3.8 3.9 India 5.8 5.9 6
Appendix V: Current Daily Status Unemployment in NER, 1993‐94 to 2004‐05
Rural
Male
Female
Person
50th 55th 61st 50
th 55th 61st 50
th 55th 61st
Arunachal Pradesh 19 11 16 4 1 11 13 7 14
Assam 70 45 60 124 88 87 78 53 65
Manipur 22 25 19 11 27 11 18 25 16
Meghalaya 6 5 2 2 3 7 4 4 4
Mizoram 10 18 8 5 4 3 9 12 6
Nagaland 21 26 40 6 22 22 17 24 32
Tripura 34 9 122 104 46 374 46 13 161
All India 56 39 80 56 37 87 56 38 82
Urban
Male
Female
Person
50th 55th 61st 50
th 55th 61
st 50th 55th 61st
Arunachal Pradesh 18 24 26 73 91 119 27 27 47
Assam 65 84 81 256 197 140 94 104 90
Manipur 50 66 55 31 68 81 44 67 63
Meghalaya 16 34 37 41 68 39 22 46 38
Mizoram 4 29 13 5 24 22 4 27 16
Nagaland 69 97 47 67 98 104 69 96 64
Tripura 82 57 189 215 89 589 108 62 300
All India 67 56 75 105 73 116 74 59 83
Source: 50th, 55th and 61
st Rounds of NSSO
Appendix VI: Percentage of Current Daily Status Unemployment‐Persons
Rural 1993‐94 1999‐00 2004‐05 Urban 1993‐94 1999‐00 2004‐05
NER 6.81 3.69 5.23 NER 5.02 9.60 8.62
India 5.6 3.8 8.2 India 7.4 7.7 8.3
Appendix VII: Usual Unemployment Rates among Youth (15‐29 years) NER, 1993‐94 to 2004‐05
Rural
Male
Female
Person
50th 55th 61st 50th 55th 61st 50
th 55
th 61st
Arunachal Pradesh 43 23 30 6 4 17 24 52 13
Assam 118 71 66 160 140 72 128 236 87
Manipur 40 49 35 14 45 14 28 120 48
Meghalaya 10 11 2 0 7 14 5 62 10
Mizoram 36 34 11 8 6 3 25 15 22
Nagaland 54 88 75 0 59 36 34 149 74
Tripura 47 26 252 126 125 572 58 227 321
All‐India 35 43 39 19 27 42 29 108 37
Urban 50th 55th 61st 50th 55th 61st 50
th 55
th 61st
Arunachal Pradesh 30 91 54 121 185 74 52 119 48
Assam 159 189 196 461 375 213 236 228 199
Manipur 163 199 192 60 150 146 120 182 174
Meghalaya 38 119 119 99 177 100 62 143 107
Mizoram 16 108 44 14 51 61 15 87 48
Nagaland 175 307 183 73 195 196 149 262 189
Tripura 178 219 449 345 167 808 227 211 601
All‐India 96 108 88 150 139 149 108 112 101
Source: 50th, 55th and 61
st Rounds of NSSO
Appendix VIII: Unemployment Rates Among Youth (15‐29 years) According to Current Weekly Status in NER, 1993‐94 to 2004‐05
Rural
Male
Female
Person
50th 55th 61st 50
th 55
th 61st 50
th 55
th 61
st
Arunachal Pradesh 49 31 35 6 2 17 27 18 27
Assam 134 96 89 214 189 143 153 115 101
Manipur 58 56 48 18 72 21 39 62 36
Meghalaya 10 11 2 ‐ 7 16 5 10 8
Mizoram 36 39 13 13 12 16 27 28 14
Nagaland 54 85 102 18 62 50 43 75 76
Tripura 52 30 257 153 131 583 74 42 327
All‐India 58 73 69 48 68 75 54 72 71
Urban
Male Female Person
50th 55th 61st 50
th 55th 61st 50
th 55th 61st
Arunachal Pradesh 31 72 71 123 158 138 53 98 94
Assam 156 185 216 453 384 254 228 226 223
Manipur 168 203 202 65 154 199 133 186 201
Meghalaya 53 119 102 113 176 102 72 142 102
Mizoram 10 91 32 14 45 50 11 72 40
Nagaland 174 307 184 82 213 245 154 269 209
Tripura 185 228 451 436 157 834 253 218 611
All‐India 114 124 110 185 166 183 128 131 125
Source: 50th, 55th and 61
st Rounds of NSSO
Appendix VIII: Unemployment Rate among Youth (15‐29 years) According to Current Daily Status in NER, 1993‐94 to 2004‐05
Rural
Male Female Person
50th 55th 61
st 50th 55
th 61st 50
th 55
th 61
st
Arunachal Pradesh 50 34 35 8 2 23 29 21 30
Assam 166 123 119 238 249 172 179 146 129
Manipur 65 57 49 24 75 23 49 62 38
Meghalaya 11 13 2 2 10 18 7 11 9
Mizoram 25 41 15 11 11 8 19 30 12
Nagaland 55 93 134 18 85 65 44 90 98
Tripura 69 44 278 181 157 598 92 57 345
All‐India 90 111 120 76 106 127 86 110 121
Urban
Male Female Person
50th 55th 61
st 50th 55
th 61st 50
th 55th 61st
Arunachal Pradesh 31 73 75 126 141 160 54 93 103
Assam 170 224 226 439 427 324 229 266 245
Manipur 173 216 204 83 168 201 145 200 202
Meghalaya 60 121 119 120 182 109 78 145 114
Mizoram 12 100 34 15 63 53 12 84 42
Nagaland 174 310 207 83 234 282 154 283 237
Tripura 206 231 471 444 182 842 267 224 625
All‐India 137 147 137 212 191 215 150 154 153
Source: 50th, 55th and 61
st Rounds of NSSO
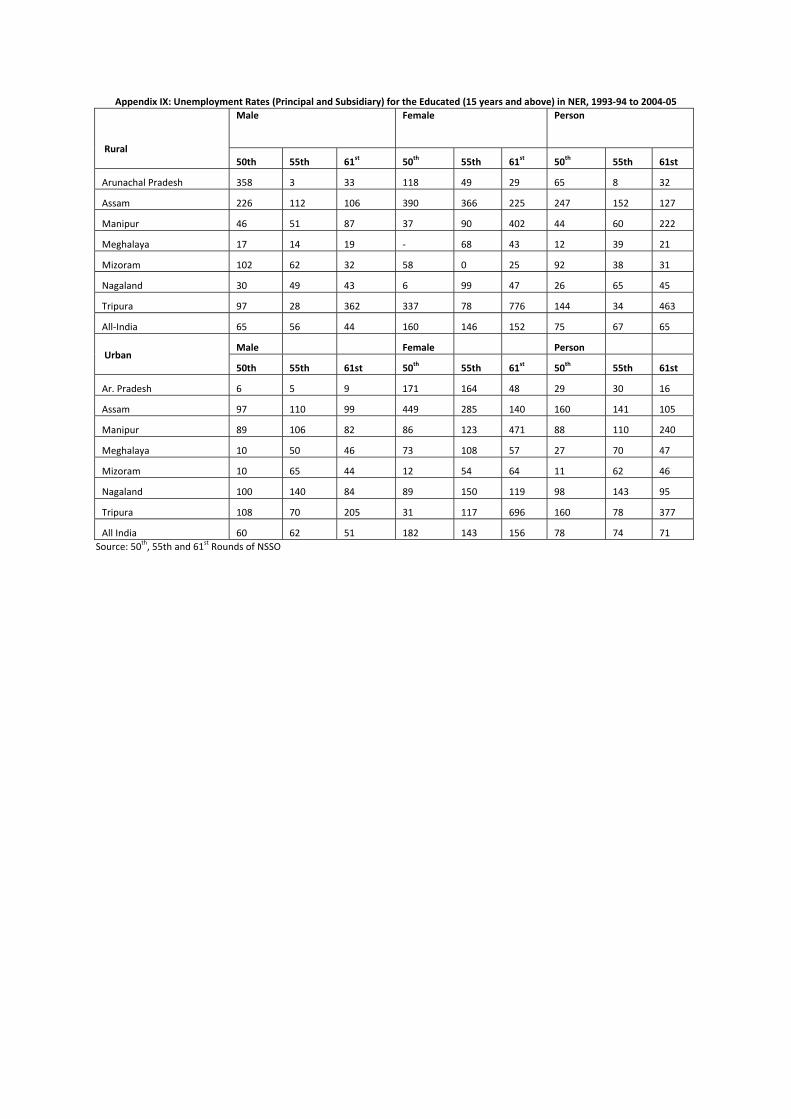
Appendix IX: Unemployment Rates (Principal and Subsidiary) for the Educated (15 years and above) in NER, 1993‐94 to 2004‐05
Rural
Male
Female
Person
50th 55th 61st 50
th 55th 61
st 50
th 55th 61st
Arunachal Pradesh 358 3 33 118 49 29 65 8 32
Assam 226 112 106 390 366 225 247 152 127
Manipur 46 51 87 37 90 402 44 60 222
Meghalaya 17 14 19 ‐ 68 43 12 39 21
Mizoram 102 62 32 58 0 25 92 38 31
Nagaland 30 49 43 6 99 47 26 65 45
Tripura 97 28 362 337 78 776 144 34 463
All‐India 65 56 44 160 146 152 75 67 65
Urban
Male Female Person
50th 55th 61st 50th 55th 61
st 50
th 55th 61st
Ar. Pradesh 6 5 9 171 164 48 29 30 16
Assam 97 110 99 449 285 140 160 141 105
Manipur 89 106 82 86 123 471 88 110 240
Meghalaya 10 50 46 73 108 57 27 70 47
Mizoram 10 65 44 12 54 64 11 62 46
Nagaland 100 140 84 89 150 119 98 143 95
Tripura 108 70 205 31 117 696 160 78 377
All India 60 62 51 182 143 156 78 74 71
Source: 50th, 55th and 61
st Rounds of NSSO
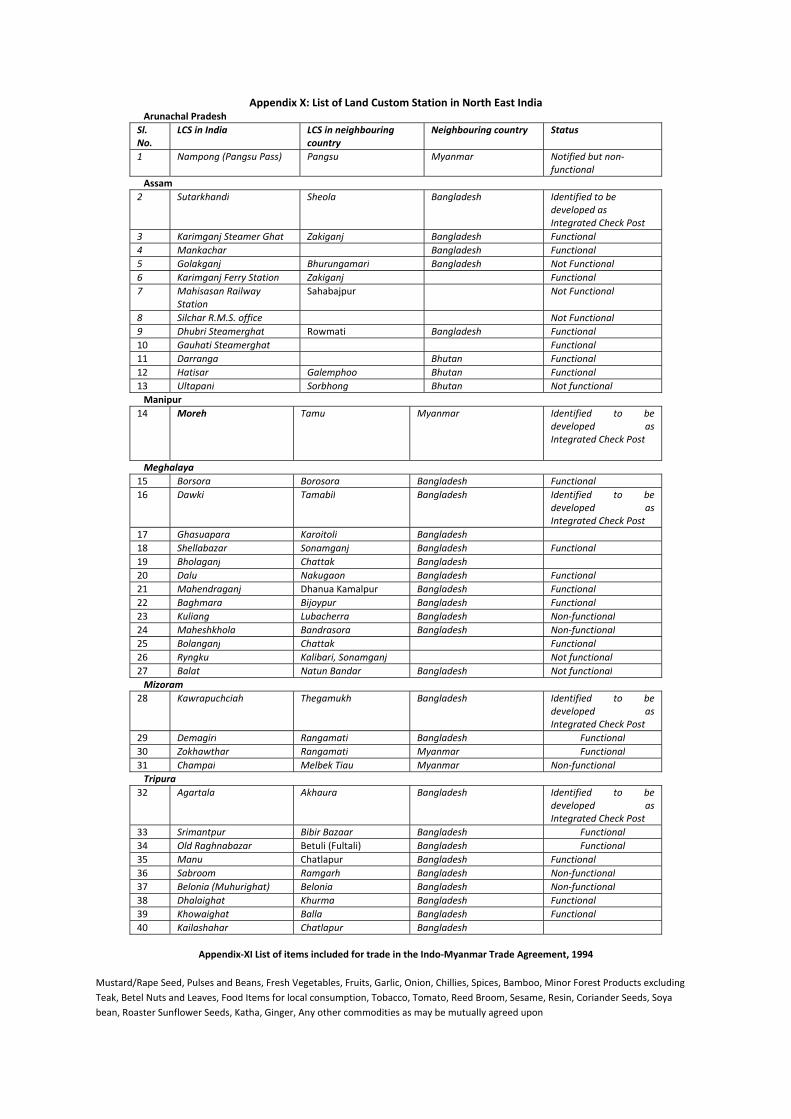
Appendix X: List of Land Custom Station in North East India Arunachal Pradesh
Sl. No.
LCS in India LCS in neighbouring country
Neighbouring country Status
1 Nampong (Pangsu Pass) Pangsu Myanmar Notified but non‐functional
Assam
2 Sutarkhandi Sheola Bangladesh Identified to be developed as Integrated Check Post
3 Karimganj Steamer Ghat Zakiganj Bangladesh Functional
4 Mankachar Bangladesh Functional
5 Golakganj Bhurungamari Bangladesh Not Functional
6 Karimganj Ferry Station Zakiganj Functional
7 Mahisasan Railway Station
Sahabajpur Not Functional
8 Silchar R.M.S. office Not Functional
9 Dhubri Steamerghat Rowmati Bangladesh Functional
10 Gauhati Steamerghat Functional
11 Darranga Bhutan Functional
12 Hatisar Galemphoo Bhutan Functional
13 Ultapani Sorbhong Bhutan Not functional
Manipur
14 Moreh Tamu Myanmar Identified to be developed as Integrated Check Post
Meghalaya
15 Borsora Borosora Bangladesh Functional
16 Dawki Tamabil Bangladesh Identified to be developed as Integrated Check Post
17 Ghasuapara Karoitoli Bangladesh
18 Shellabazar Sonamganj Bangladesh Functional
19 Bholaganj Chattak Bangladesh
20 Dalu Nakugaon Bangladesh Functional
21 Mahendraganj Dhanua Kamalpur Bangladesh Functional
22 Baghmara Bijoypur Bangladesh Functional
23 Kuliang Lubacherra Bangladesh Non‐functional
24 Maheshkhola Bandrasora Bangladesh Non‐functional
25 Bolanganj Chattak Functional
26 Ryngku Kalibari, Sonamganj Not functional
27 Balat Natun Bandar Bangladesh Not functional
Mizoram
28 Kawrapuchciah Thegamukh Bangladesh Identified to be developed as Integrated Check Post
29 Demagiri Rangamati Bangladesh Functional
30 Zokhawthar Rangamati Myanmar Functional
31 Champai Melbek Tiau Myanmar Non‐functional
Tripura
32 Agartala Akhaura Bangladesh Identified to be developed as Integrated Check Post
33 Srimantpur Bibir Bazaar Bangladesh Functional
34 Old Raghnabazar Betuli (Fultali) Bangladesh Functional
35 Manu Chatlapur Bangladesh Functional
36 Sabroom Ramgarh Bangladesh Non‐functional
37 Belonia (Muhurighat) Belonia Bangladesh Non‐functional
38 Dhalaighat Khurma Bangladesh Functional
39 Khowaighat Balla Bangladesh Functional
40 Kailashahar Chatlapur Bangladesh
Appendix‐XI List of items included for trade in the Indo‐Myanmar Trade Agreement, 1994
Mustard/Rape Seed, Pulses and Beans, Fresh Vegetables, Fruits, Garlic, Onion, Chillies, Spices, Bamboo, Minor Forest Products excluding
Teak, Betel Nuts and Leaves, Food Items for local consumption, Tobacco, Tomato, Reed Broom, Sesame, Resin, Coriander Seeds, Soya
bean, Roaster Sunflower Seeds, Katha, Ginger, Any other commodities as may be mutually agreed upon
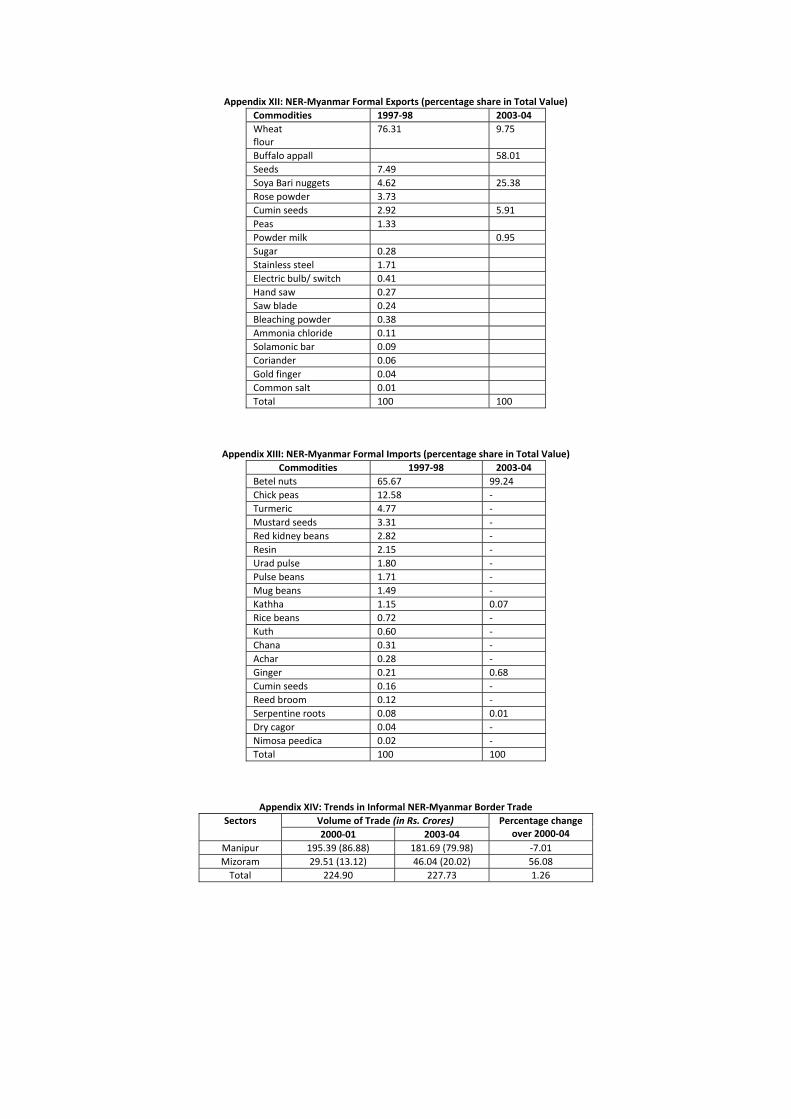
Appendix XII: NER‐Myanmar Formal Exports (percentage share in Total Value)
Commodities 1997‐98 2003‐04
Wheat flour
76.31 9.75
Buffalo appall 58.01
Seeds 7.49
Soya Bari nuggets 4.62 25.38
Rose powder 3.73
Cumin seeds 2.92 5.91
Peas 1.33
Powder milk 0.95
Sugar 0.28
Stainless steel 1.71
Electric bulb/ switch 0.41
Hand saw 0.27
Saw blade 0.24
Bleaching powder 0.38
Ammonia chloride 0.11
Solamonic bar 0.09
Coriander 0.06
Gold finger 0.04
Common salt 0.01
Total 100 100
Appendix XIII: NER‐Myanmar Formal Imports (percentage share in Total Value)
Commodities 1997‐98 2003‐04
Betel nuts 65.67 99.24
Chick peas 12.58 ‐
Turmeric 4.77 ‐
Mustard seeds 3.31 ‐
Red kidney beans 2.82 ‐
Resin 2.15 ‐
Urad pulse 1.80 ‐
Pulse beans 1.71 ‐
Mug beans 1.49 ‐
Kathha 1.15 0.07
Rice beans 0.72 ‐
Kuth 0.60 ‐
Chana 0.31 ‐
Achar 0.28 ‐
Ginger 0.21 0.68
Cumin seeds 0.16 ‐
Reed broom 0.12 ‐
Serpentine roots 0.08 0.01
Dry cagor 0.04 ‐
Nimosa peedica 0.02 ‐
Total 100 100
Appendix XIV: Trends in Informal NER‐Myanmar Border Trade
Sectors Volume of Trade (in Rs. Crores) Percentage change over 2000‐04 2000‐01 2003‐04
Manipur 195.39 (86.88) 181.69 (79.98) ‐7.01
Mizoram 29.51 (13.12) 46.04 (20.02) 56.08
Total 224.90 227.73 1.26
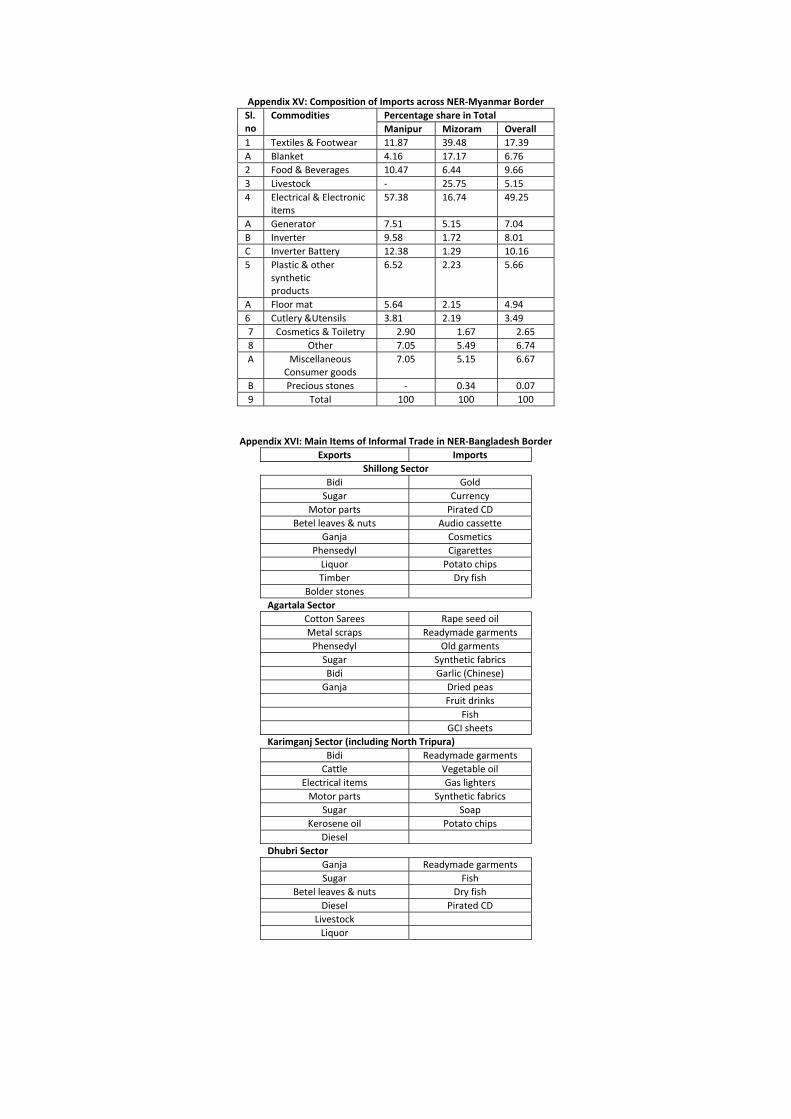
Appendix XV: Composition of Imports across NER‐Myanmar Border
Sl.no
Commodities Percentage share in Total
Manipur Mizoram Overall
1 Textiles & Footwear 11.87 39.48 17.39
A Blanket 4.16 17.17 6.76
2 Food & Beverages 10.47 6.44 9.66
3 Livestock ‐ 25.75 5.15
4 Electrical & Electronic items
57.38 16.74 49.25
A Generator 7.51 5.15 7.04
B Inverter 9.58 1.72 8.01
C Inverter Battery 12.38 1.29 10.16
5
Plastic & other synthetic products
6.52 2.23 5.66
A Floor mat 5.64 2.15 4.94
6 Cutlery &Utensils 3.81 2.19 3.49
7 Cosmetics & Toiletry 2.90 1.67 2.65
8 Other 7.05 5.49 6.74
A Miscellaneous Consumer goods
7.05 5.15 6.67
B Precious stones ‐ 0.34 0.07
9 Total 100 100 100
Appendix XVI: Main Items of Informal Trade in NER‐Bangladesh Border
Exports Imports
Shillong Sector
Bidi Gold
Sugar Currency
Motor parts Pirated CD
Betel leaves & nuts Audio cassette
Ganja Cosmetics
Phensedyl Cigarettes
Liquor Potato chips
Timber Dry fish
Bolder stones
Agartala Sector
Cotton Sarees Rape seed oil
Metal scraps Readymade garments
Phensedyl Old garments
Sugar Synthetic fabrics
Bidi Garlic (Chinese)
Ganja Dried peas
Fruit drinks
Fish
GCI sheets
Karimganj Sector (including North Tripura)
Bidi Readymade garments
Cattle Vegetable oil
Electrical items Gas lighters
Motor parts Synthetic fabrics
Sugar Soap
Kerosene oil Potato chips
Diesel
Dhubri Sector
Ganja Readymade garments
Sugar Fish
Betel leaves & nuts Dry fish
Diesel Pirated CD
Livestock
Liquor
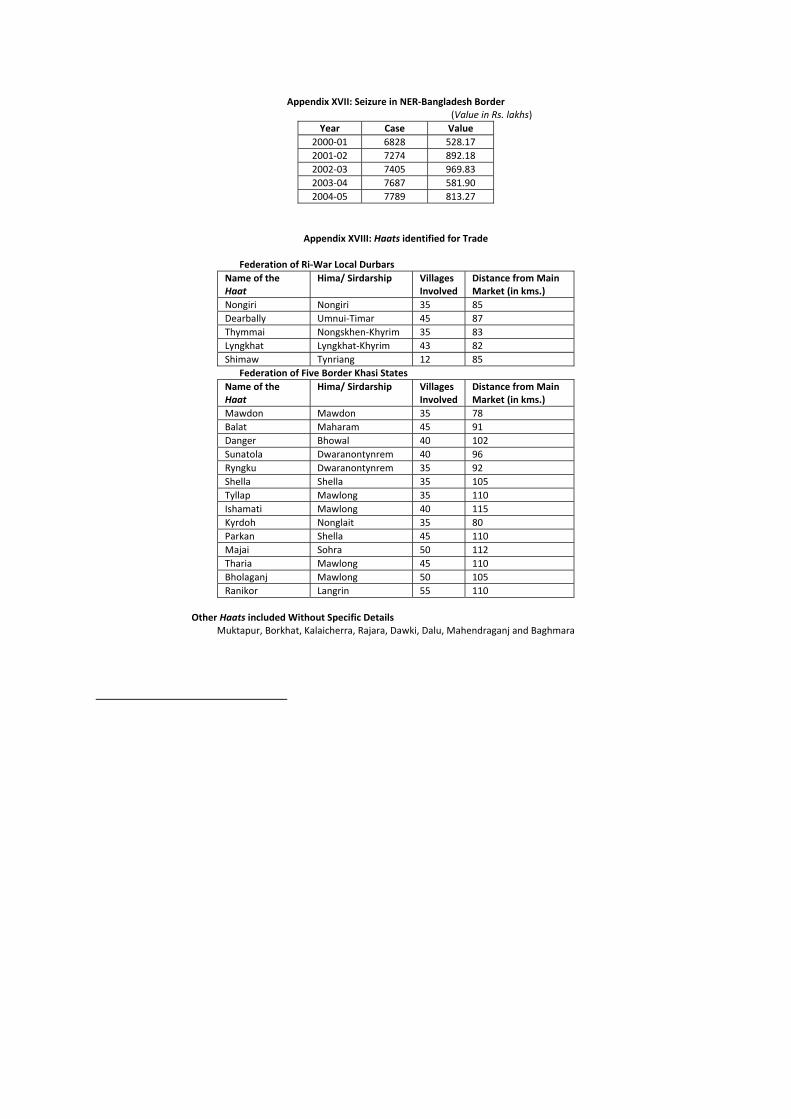
Appendix XVII: Seizure in NER‐Bangladesh Border (Value in Rs. lakhs)
Year Case Value
2000‐01 6828 528.17
2001‐02 7274 892.18
2002‐03 7405 969.83
2003‐04 7687 581.90
2004‐05 7789 813.27
Appendix XVIII: Haats identified for Trade
Federation of Ri‐War Local Durbars
Name of the Haat
Hima/ Sirdarship Villages Involved
Distance from Main Market (in kms.)
Nongiri Nongiri 35 85
Dearbally Umnui‐Timar 45 87
Thymmai Nongskhen‐Khyrim 35 83
Lyngkhat Lyngkhat‐Khyrim 43 82
Shimaw Tynriang 12 85
Federation of Five Border Khasi States
Name of the Haat
Hima/ Sirdarship Villages Involved
Distance from Main Market (in kms.)
Mawdon Mawdon 35 78
Balat Maharam 45 91
Danger Bhowal 40 102
Sunatola Dwaranontynrem 40 96
Ryngku Dwaranontynrem 35 92
Shella Shella 35 105
Tyllap Mawlong 35 110
Ishamati Mawlong 40 115
Kyrdoh Nonglait 35 80
Parkan Shella 45 110
Majai Sohra 50 112
Tharia Mawlong 45 110
Bholaganj Mawlong 50 105
Ranikor Langrin 55 110
Other Haats included Without Specific Details
Muktapur, Borkhat, Kalaicherra, Rajara, Dawki, Dalu, Mahendraganj and Baghmara