Embed Size (px)
Citation preview
Published: October 21, 2013
Justin J. Kringstad, Director
North Dakota Pipeline Authority
Office: 701.220.6227
www.northdakotapipelines.com
NORTH DAKOTA NATURAL GAS
A DETAILED LOOK AT NATURAL GAS GATHERING

1
NORTH DAKOTA
NATURAL GAS
A DETAILED LOOK AT NATURAL
GAS GATHERING
This report is designed to be a factual look at natural gas gathering,
processing, and flaring in North Dakota.
The Bakken – Three Forks Formations
The Bakken/Three Forks (Bakken) is the largest oil field (in square
miles) in North America. It underlies approximately 15,000+ square
miles of North Dakota. The formation has been known about by
geologists for decades, but it wasn’t until 2006 when the use of
horizontal drilling combined with hydraulic fracturing that the Bakken
was considered to be an economic play.
The Bakken formation produces both crude oil and associated natural
gas. Oil is the primary energy resource contained in Bakken wells and
is the principal economic driver for energy producing companies.
Natural Gas Flaring
Flaring occurs when natural gas is burned on location due to a lack of
gathering pipeline infrastructure or economic alternatives. Flaring of
natural gas is a much safer and more environmentally friendly method
of handling the natural gas than simply venting into the atmosphere. By
flaring the gas, it converts the methane to carbon dioxide (CO2) which
has 20-25 times less impact on greenhouse gas emissions.
A gas gathering pipeline and processing plant are the conventional
means to condition the natural gas for retail use. An economic analysis
must be done to determine if it is even feasible to connect a well to an
FLARING
REGULATION
In an effort to conserve this
resource and protect against
waste, the Industrial
Commission Oil and Gas
Division, under the authority
granted in section 38-08-04
of the North Dakota Century
Code, implements and
enforces rules and
regulations to limit the
production of oil produced
from wells that are not yet
connected to a gas-
gathering system.
PRIMARY
CHALLENGES
• Size of resource
• Young age of
development
• Harsh winter
conditions
• Resource potential
still being explored
2
existing pipeline or perhaps to build a new pipeline into an area of ongoing development. Even after the
oil and gas well has been connected to a gas-gathering pipeline and processing facility, there are still
times when the well may flare intermittently, generally due to excessive line pressures or mechanical
issues.
Detailed Challenges to Reducing North Dakota Flaring
Upfront Planning/Coordination
Obtaining Easements
Understanding Bakken Gas Quality
Understanding Production Potential
Properly Sizing New Gas Gathering Pipelines
Enhancing Existing Gathering Pipelines
Sufficient Gas Processing Capacity (Timing and Location Critical)
Adequate Interstate Pipeline Capacity
Ramping Up Flaring Alternatives (Short & Long Term)
Understanding Bakken Natural Gas Quality
A common misconception regarding natural gas flaring in North Dakota is the belief that natural gas
prices are currently too low in the United States to justify new gathering and processing infrastructure.
This belief is based on the existing dry natural gas markets (methane) and could not be any further
from the current reality in North Dakota. In actuality, the value of Bakken natural gas, including the
natural gas liquids (NGLs), makes it very economically attractive to construct the required infrastructure
to capture the resource.
Natural gas produced from the Bakken is very rich in NGLs (Figure 1). One thousand cubic feet (MCF)
of raw natural gas from a Bakken well may contain around eight to twelve gallons of NGLs. These
NGLs (ethane, propane, butane, and natural gasoline) are very valuable with the current market value
of raw natural gas from the Bakken around $6.50-$8.00 per MCF.

3
FIGURE 1
North Dakota Natural Gas Production
Natural gas production has been rising over the last number of years with continued oil development of
the Bakken. Along with the rise in production, the sale of natural gas from North Dakota has also
continued to increase (Figure 2).
FIGURE 2
4
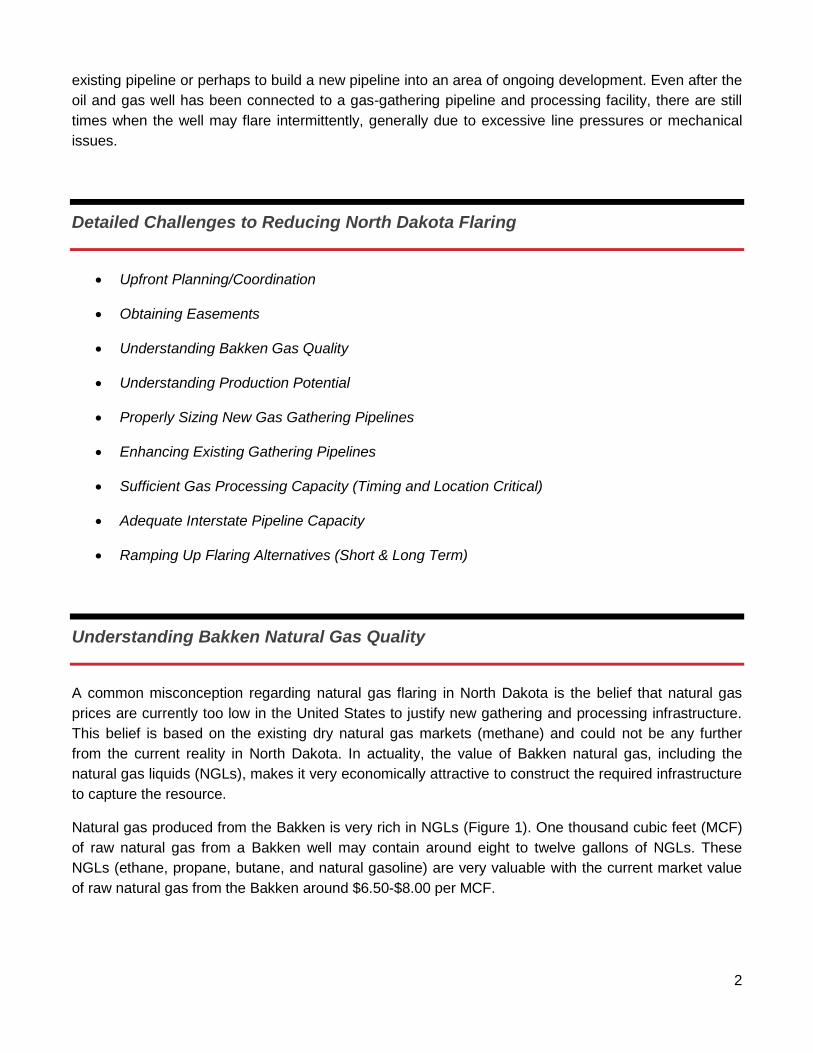
Figure 3 is a chart of recent historical natural gas production and a forecast of two future production
scenarios. The two cases represent different drilling assumptions during the forecasted period.
FIGURE 3
Understanding the Flaring Challenge
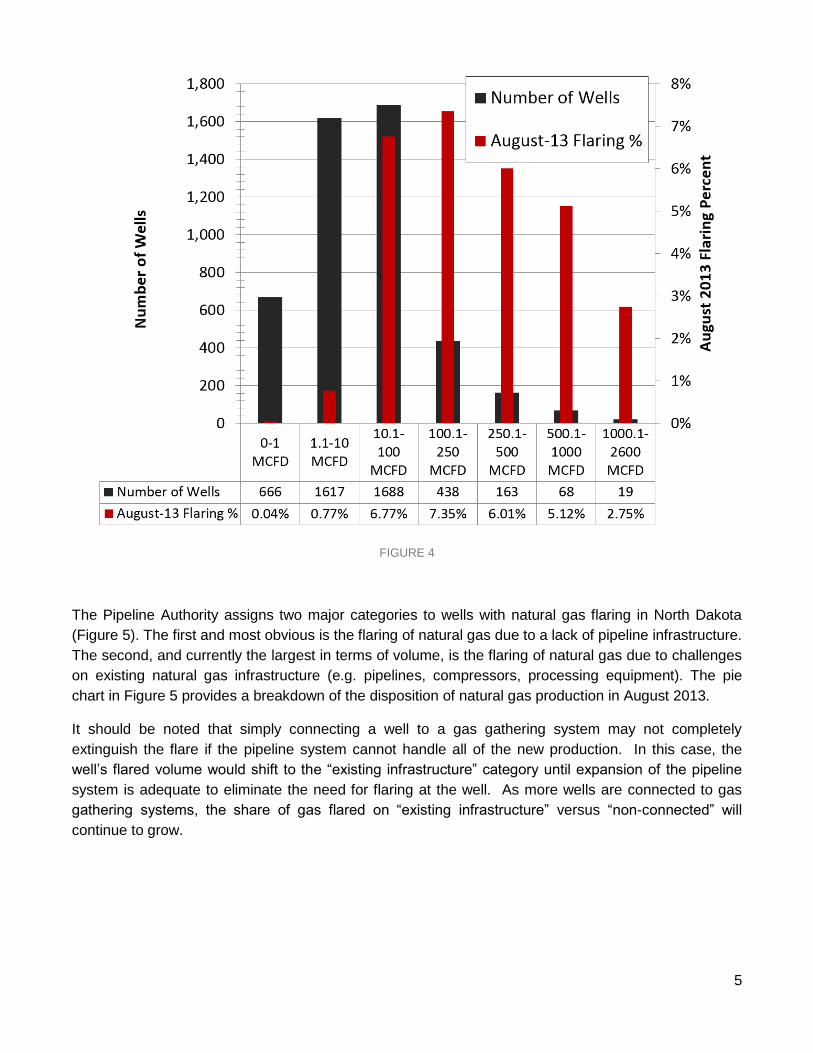
During the month of August 2013, there were 4,659 non-confidential wells flaring natural gas in North
Dakota. The volume of natural gas flared from these wells varies from less than 1 MCFD to more than
2,500 MCFD. Figure 4 shows the distribution of wells flaring and their associated impact on the total
percentage of gas flared in August 2013. It is quickly seen that the number of wells flaring is skewed
towards the low flaring wells, while the largest volumes of gas flaring are associated with few, but larger
flaring wells. As shown in Figure 4, even if the over 2,200 wells flaring 10 MCFD or less were no longer
flaring, the State’s overall flaring percentage would only be reduced by 0.81%.
5
FIGURE 4
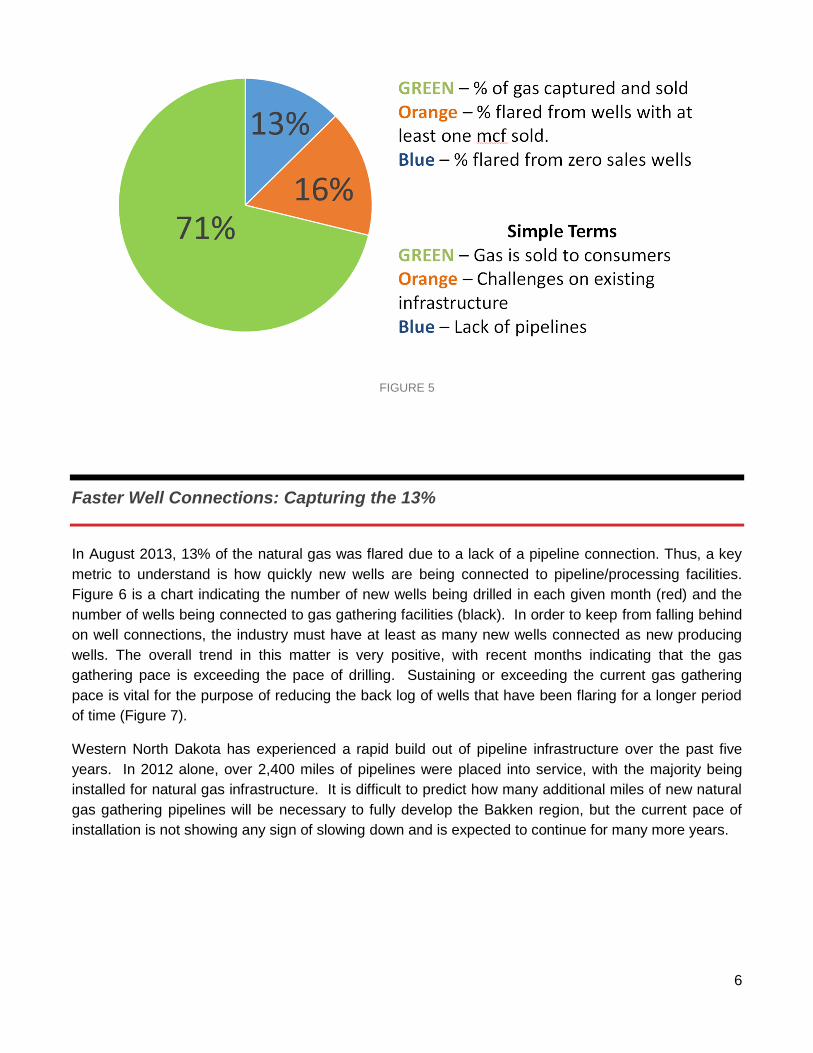
The Pipeline Authority assigns two major categories to wells with natural gas flaring in North Dakota
(Figure 5). The first and most obvious is the flaring of natural gas due to a lack of pipeline infrastructure.
The second, and currently the largest in terms of volume, is the flaring of natural gas due to challenges
on existing natural gas infrastructure (e.g. pipelines, compressors, processing equipment). The pie
chart in Figure 5 provides a breakdown of the disposition of natural gas production in August 2013.
It should be noted that simply connecting a well to a gas gathering system may not completely
extinguish the flare if the pipeline system cannot handle all of the new production. In this case, the
well’s flared volume would shift to the “existing infrastructure” category until expansion of the pipeline
system is adequate to eliminate the need for flaring at the well. As more wells are connected to gas
gathering systems, the share of gas flared on “existing infrastructure” versus “non-connected” will
continue to grow.
6
FIGURE 5
Faster Well Connections: Capturing the 13%
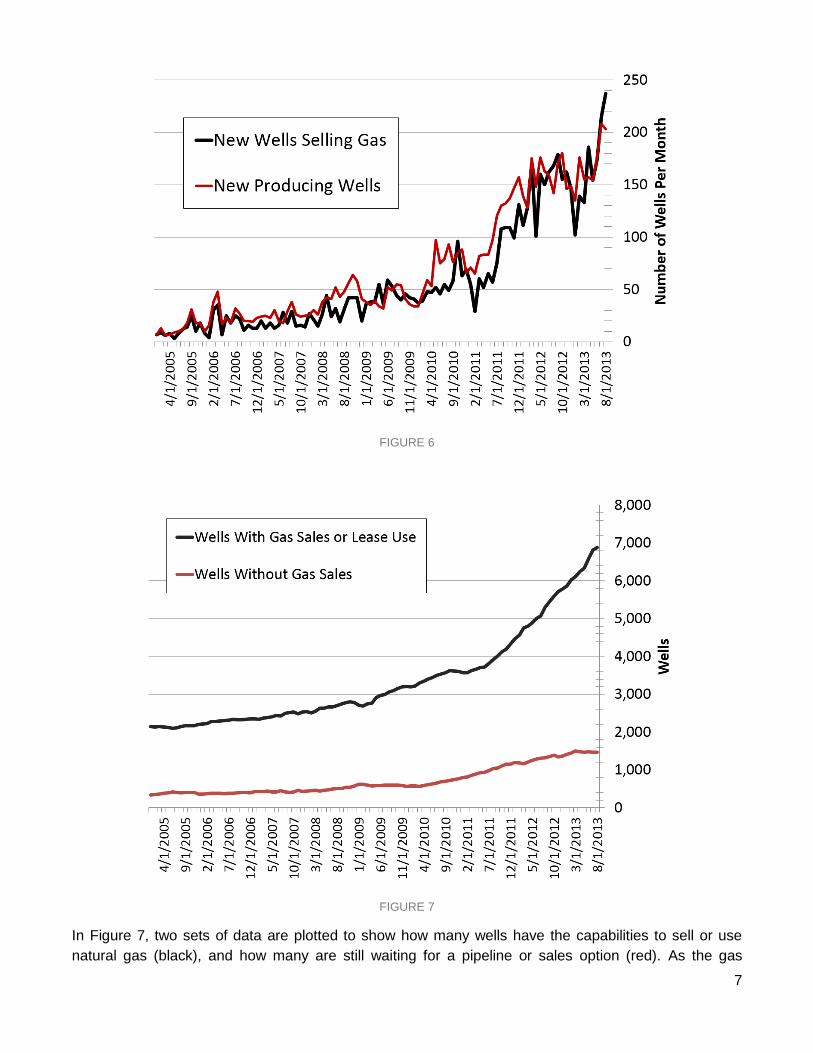
In August 2013, 13% of the natural gas was flared due to a lack of a pipeline connection. Thus, a key
metric to understand is how quickly new wells are being connected to pipeline/processing facilities.
Figure 6 is a chart indicating the number of new wells being drilled in each given month (red) and the
number of wells being connected to gas gathering facilities (black). In order to keep from falling behind
on well connections, the industry must have at least as many new wells connected as new producing
wells. The overall trend in this matter is very positive, with recent months indicating that the gas
gathering pace is exceeding the pace of drilling. Sustaining or exceeding the current gas gathering
pace is vital for the purpose of reducing the back log of wells that have been flaring for a longer period
of time (Figure 7).
Western North Dakota has experienced a rapid build out of pipeline infrastructure over the past five
years. In 2012 alone, over 2,400 miles of pipelines were placed into service, with the majority being
installed for natural gas infrastructure. It is difficult to predict how many additional miles of new natural
gas gathering pipelines will be necessary to fully develop the Bakken region, but the current pace of
installation is not showing any sign of slowing down and is expected to continue for many more years.
7
FIGURE 6
FIGURE 7
In Figure 7, two sets of data are plotted to show how many wells have the capabilities to sell or use
natural gas (black), and how many are still waiting for a pipeline or sales option (red). As the gas
8
gathering infrastructure catches up, the number of wells without gas sales will peak and begin to
decline.
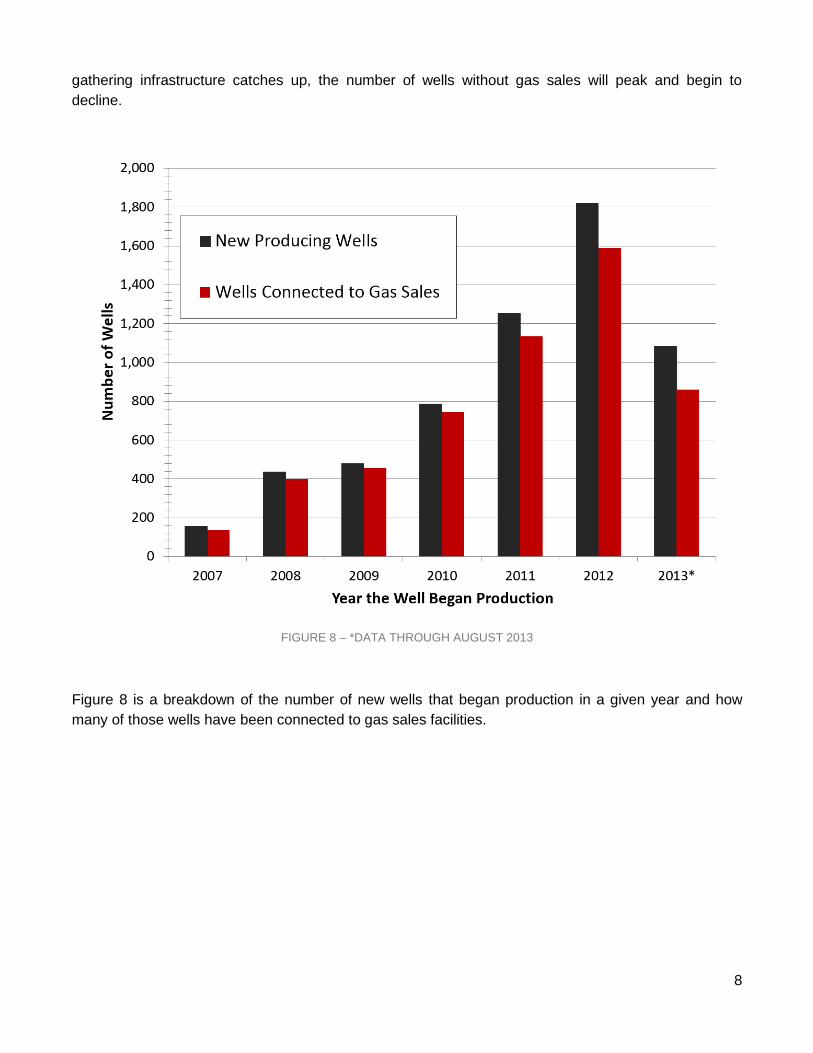
FIGURE 8 – *DATA THROUGH AUGUST 2013
Figure 8 is a breakdown of the number of new wells that began production in a given year and how
many of those wells have been connected to gas sales facilities.
9
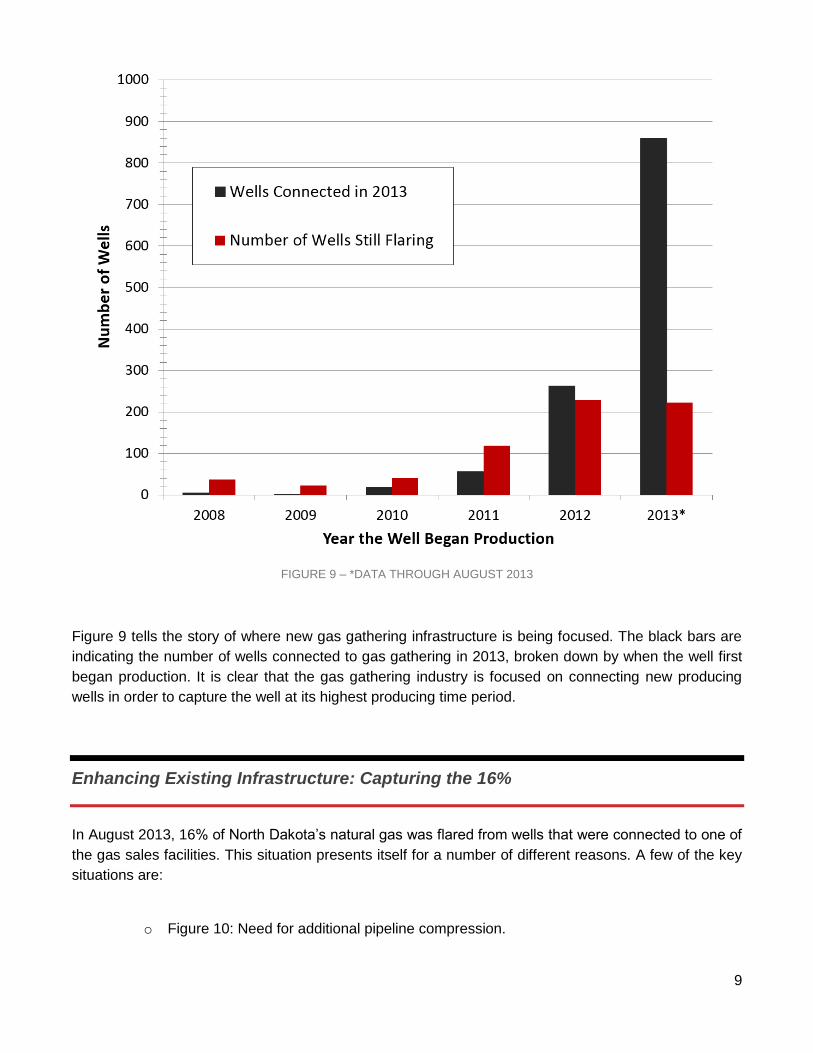
FIGURE 9 – *DATA THROUGH AUGUST 2013
Figure 9 tells the story of where new gas gathering infrastructure is being focused. The black bars are
indicating the number of wells connected to gas gathering in 2013, broken down by when the well first
began production. It is clear that the gas gathering industry is focused on connecting new producing
wells in order to capture the well at its highest producing time period.
Enhancing Existing Infrastructure: Capturing the 16%
In August 2013, 16% of North Dakota’s natural gas was flared from wells that were connected to one of
the gas sales facilities. This situation presents itself for a number of different reasons. A few of the key
situations are:
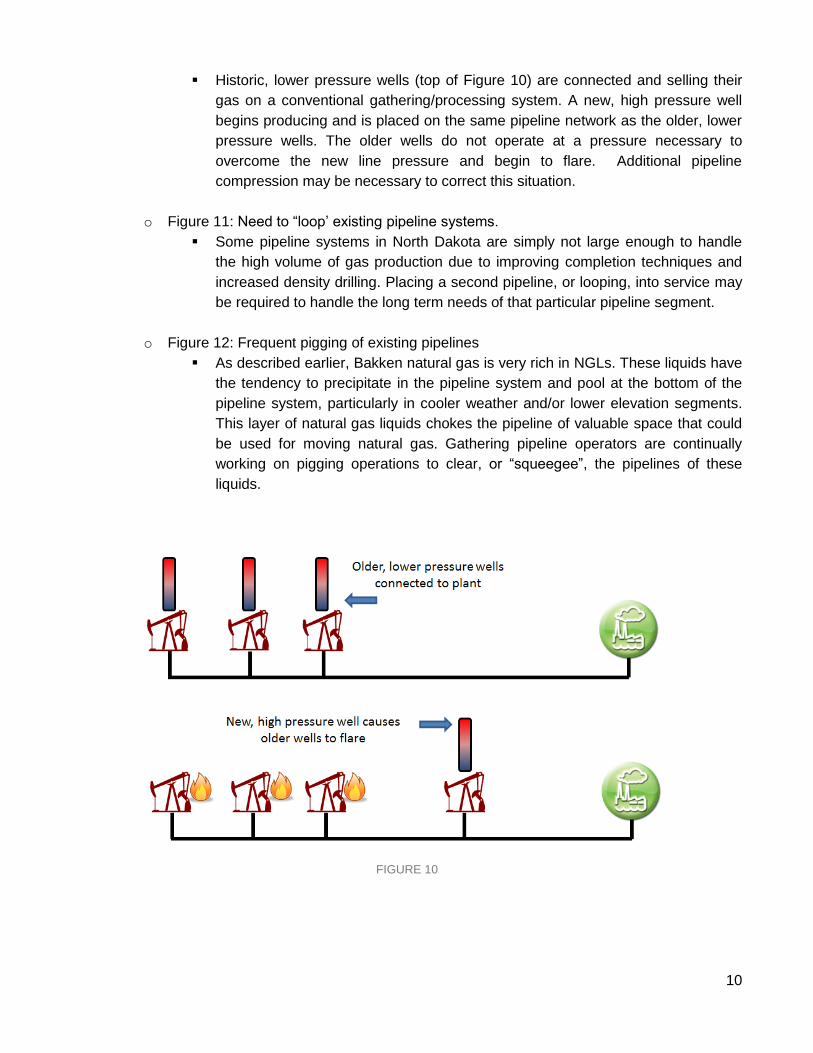
o Figure 10: Need for additional pipeline compression.
10
Historic, lower pressure wells (top of Figure 10) are connected and selling their
gas on a conventional gathering/processing system. A new, high pressure well
begins producing and is placed on the same pipeline network as the older, lower
pressure wells. The older wells do not operate at a pressure necessary to
overcome the new line pressure and begin to flare. Additional pipeline
compression may be necessary to correct this situation.
o Figure 11: Need to “loop’ existing pipeline systems.
Some pipeline systems in North Dakota are simply not large enough to handle
the high volume of gas production due to improving completion techniques and
increased density drilling. Placing a second pipeline, or looping, into service may
be required to handle the long term needs of that particular pipeline segment.
o Figure 12: Frequent pigging of existing pipelines
As described earlier, Bakken natural gas is very rich in NGLs. These liquids have
the tendency to precipitate in the pipeline system and pool at the bottom of the
pipeline system, particularly in cooler weather and/or lower elevation segments.
This layer of natural gas liquids chokes the pipeline of valuable space that could
be used for moving natural gas. Gathering pipeline operators are continually
working on pigging operations to clear, or “squeegee”, the pipelines of these
liquids.
FIGURE 10

11
FIGURE 11
FIGURE 12
12
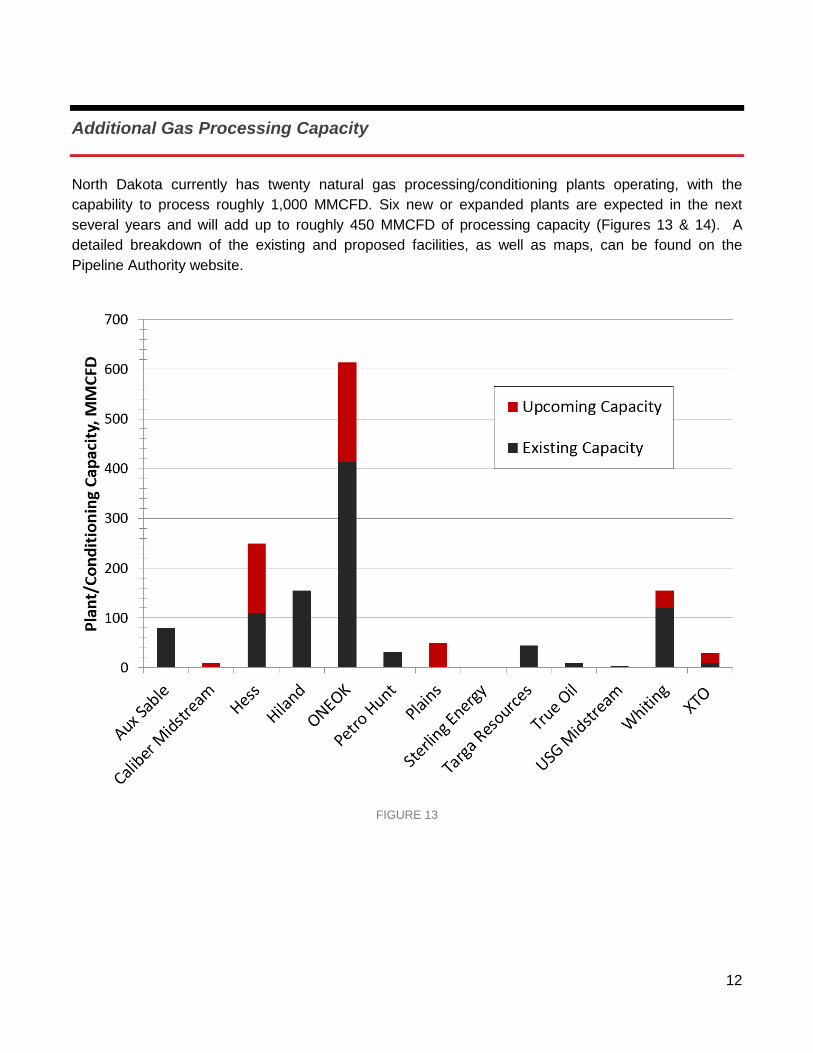
Additional Gas Processing Capacity
North Dakota currently has twenty natural gas processing/conditioning plants operating, with the
capability to process roughly 1,000 MMCFD. Six new or expanded plants are expected in the next
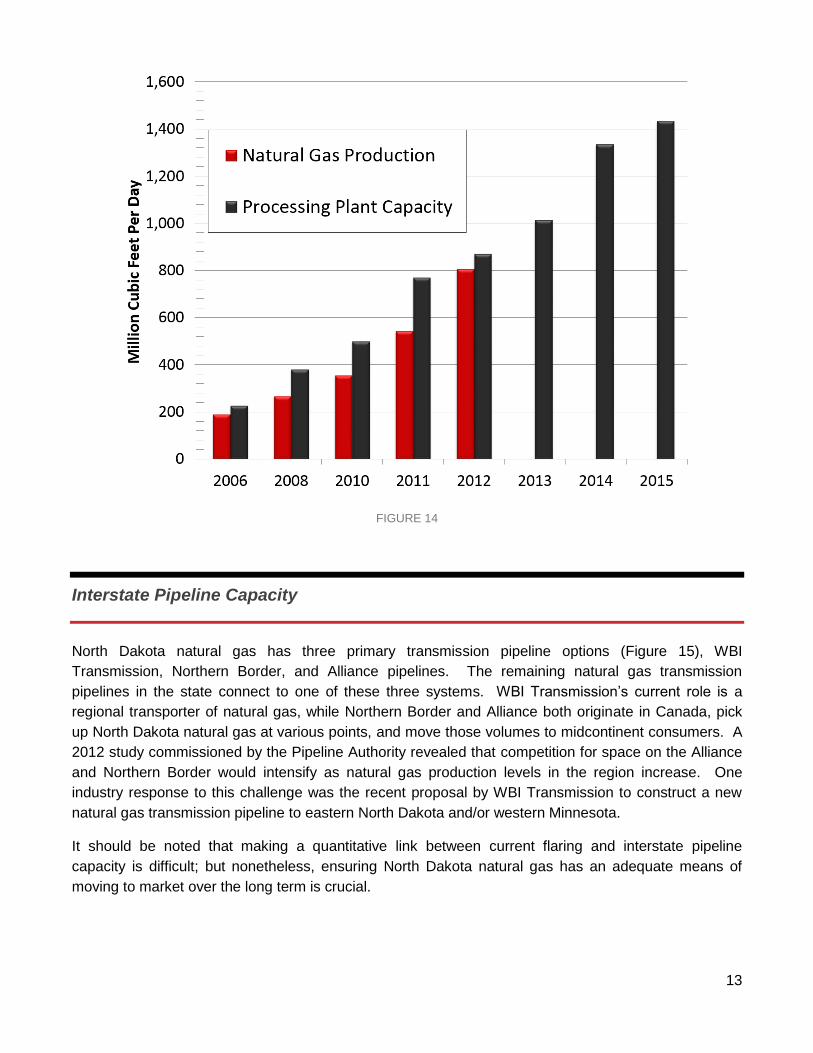
several years and will add up to roughly 450 MMCFD of processing capacity (Figures 13 & 14). A
detailed breakdown of the existing and proposed facilities, as well as maps, can be found on the
Pipeline Authority website.
FIGURE 13
13
FIGURE 14
Interstate Pipeline Capacity
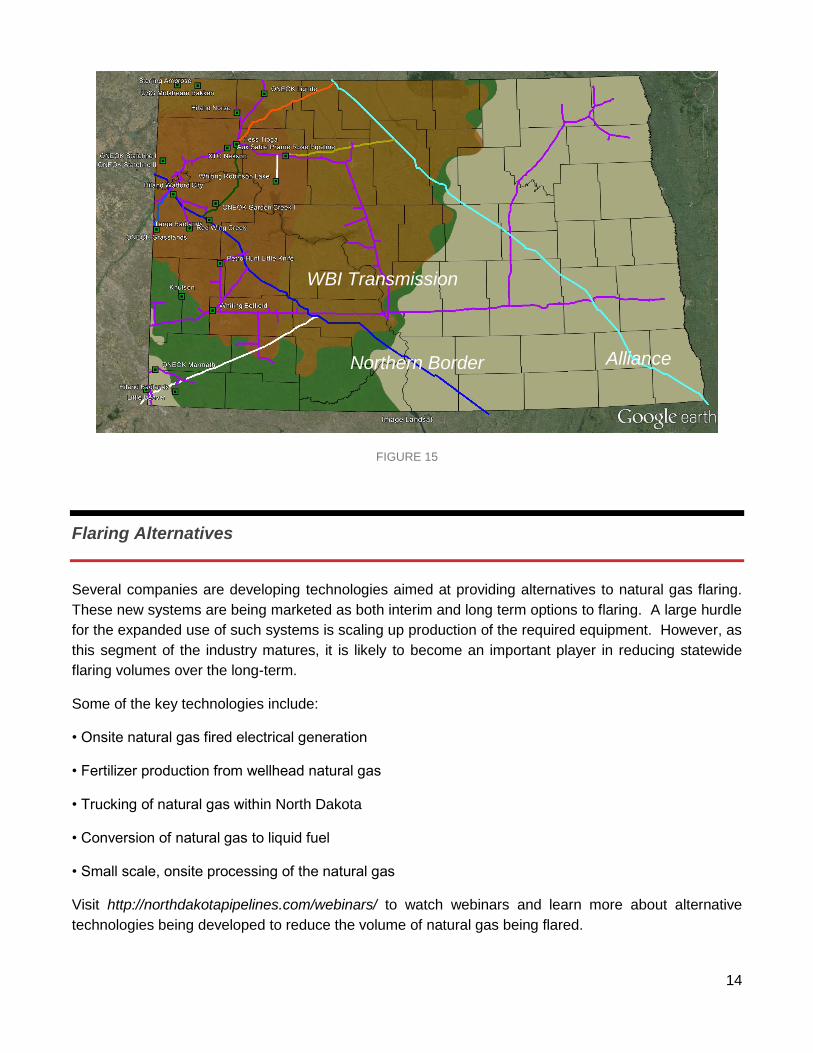
North Dakota natural gas has three primary transmission pipeline options (Figure 15), WBI
Transmission, Northern Border, and Alliance pipelines. The remaining natural gas transmission
pipelines in the state connect to one of these three systems. WBI Transmission’s current role is a
regional transporter of natural gas, while Northern Border and Alliance both originate in Canada, pick
up North Dakota natural gas at various points, and move those volumes to midcontinent consumers. A
2012 study commissioned by the Pipeline Authority revealed that competition for space on the Alliance
and Northern Border would intensify as natural gas production levels in the region increase. One
industry response to this challenge was the recent proposal by WBI Transmission to construct a new
natural gas transmission pipeline to eastern North Dakota and/or western Minnesota.
It should be noted that making a quantitative link between current flaring and interstate pipeline
capacity is difficult; but nonetheless, ensuring North Dakota natural gas has an adequate means of
moving to market over the long term is crucial.
14
FIGURE 15
Flaring Alternatives
Several companies are developing technologies aimed at providing alternatives to natural gas flaring.
These new systems are being marketed as both interim and long term options to flaring. A large hurdle
for the expanded use of such systems is scaling up production of the required equipment. However, as
this segment of the industry matures, it is likely to become an important player in reducing statewide
flaring volumes over the long-term.
Some of the key technologies include:
• Onsite natural gas fired electrical generation
• Fertilizer production from wellhead natural gas
• Trucking of natural gas within North Dakota
• Conversion of natural gas to liquid fuel
• Small scale, onsite processing of the natural gas
Visit http://northdakotapipelines.com/webinars/ to watch webinars and learn more about alternative
technologies being developed to reduce the volume of natural gas being flared.
WBI Transmission
Northern Border Alliance
15
Wellhead Recovery Estimates
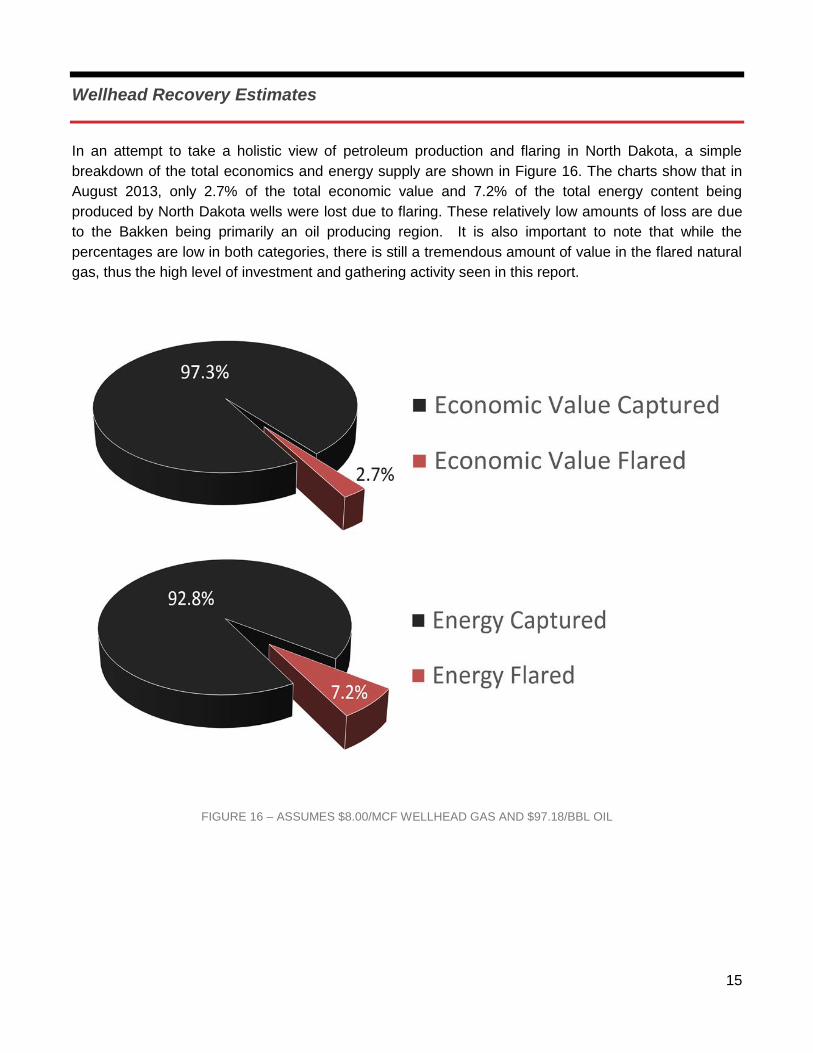
In an attempt to take a holistic view of petroleum production and flaring in North Dakota, a simple
breakdown of the total economics and energy supply are shown in Figure 16. The charts show that in
August 2013, only 2.7% of the total economic value and 7.2% of the total energy content being
produced by North Dakota wells were lost due to flaring. These relatively low amounts of loss are due
to the Bakken being primarily an oil producing region. It is also important to note that while the
percentages are low in both categories, there is still a tremendous amount of value in the flared natural
gas, thus the high level of investment and gathering activity seen in this report.
FIGURE 16 – ASSUMES $8.00/MCF WELLHEAD GAS AND $97.18/BBL OIL
16
United States Natural Gas Flaring
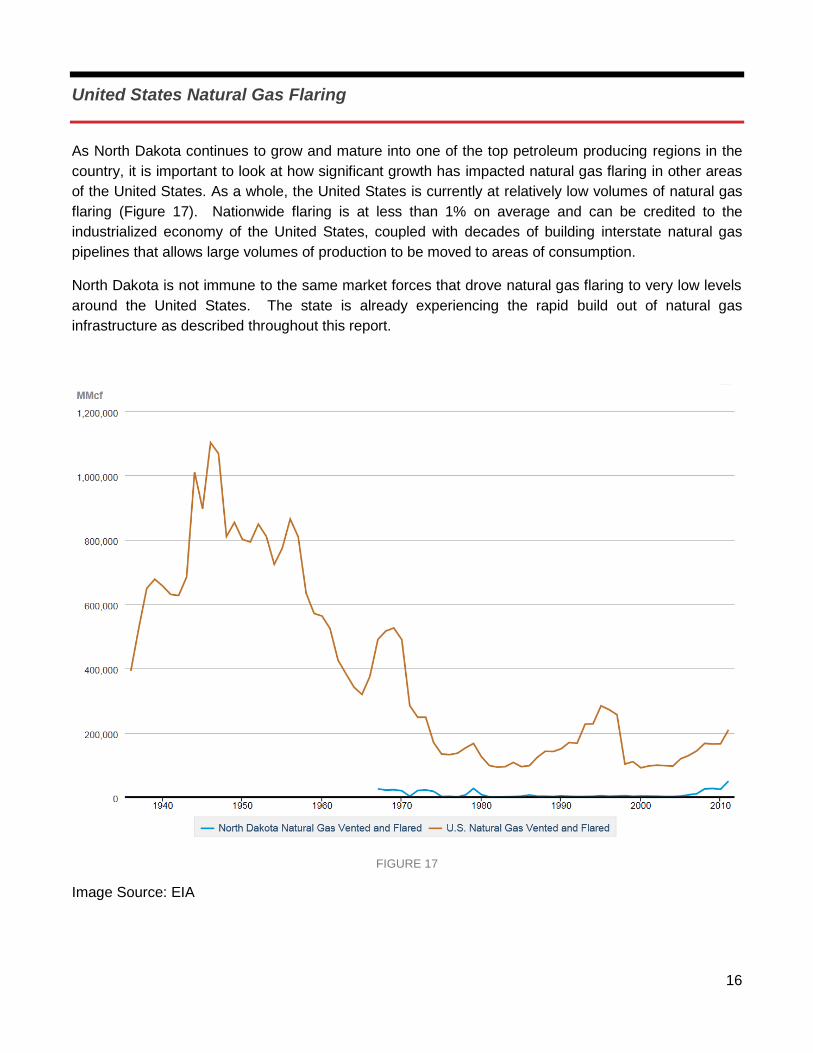
As North Dakota continues to grow and mature into one of the top petroleum producing regions in the
country, it is important to look at how significant growth has impacted natural gas flaring in other areas
of the United States. As a whole, the United States is currently at relatively low volumes of natural gas
flaring (Figure 17). Nationwide flaring is at less than 1% on average and can be credited to the
industrialized economy of the United States, coupled with decades of building interstate natural gas
pipelines that allows large volumes of production to be moved to areas of consumption.
North Dakota is not immune to the same market forces that drove natural gas flaring to very low levels
around the United States. The state is already experiencing the rapid build out of natural gas
infrastructure as described throughout this report.
FIGURE 17
Image Source: EIA
17
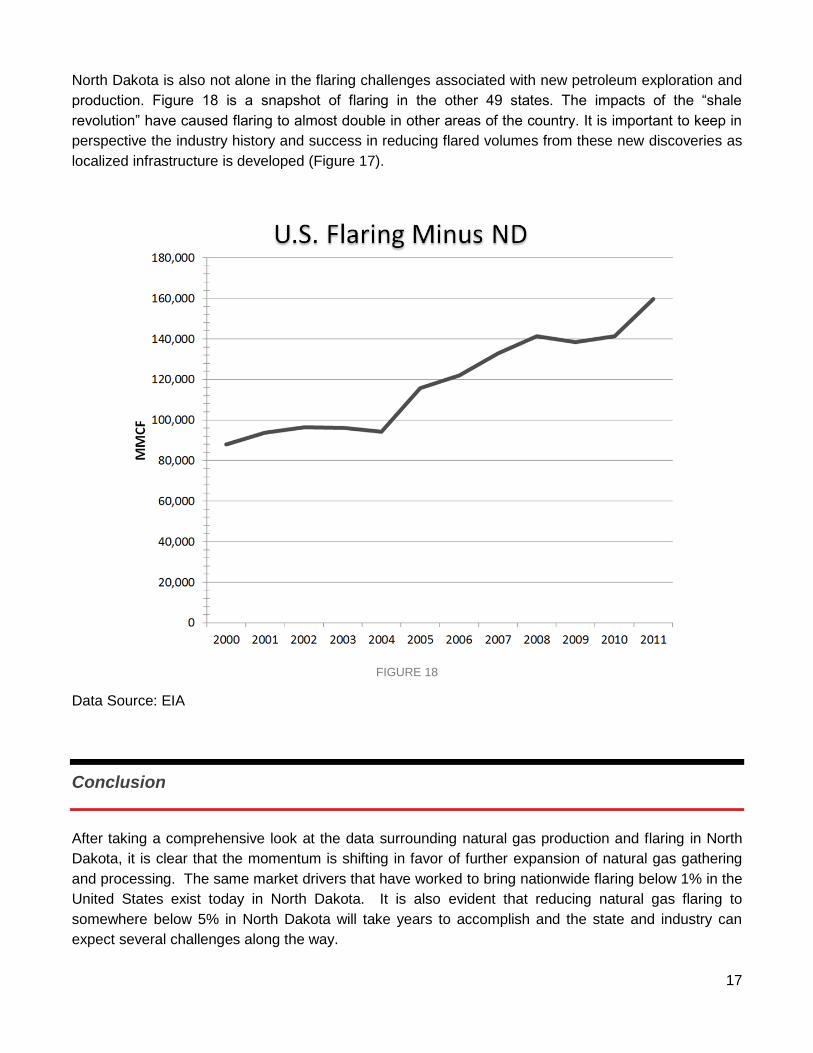
North Dakota is also not alone in the flaring challenges associated with new petroleum exploration and
production. Figure 18 is a snapshot of flaring in the other 49 states. The impacts of the “shale
revolution” have caused flaring to almost double in other areas of the country. It is important to keep in
perspective the industry history and success in reducing flared volumes from these new discoveries as
localized infrastructure is developed (Figure 17).
FIGURE 18
Data Source: EIA
Conclusion
After taking a comprehensive look at the data surrounding natural gas production and flaring in North
Dakota, it is clear that the momentum is shifting in favor of further expansion of natural gas gathering
and processing. The same market drivers that have worked to bring nationwide flaring below 1% in the
United States exist today in North Dakota. It is also evident that reducing natural gas flaring to
somewhere below 5% in North Dakota will take years to accomplish and the state and industry can
expect several challenges along the way.

18
North Dakota is in a unique position to be a global leader in oilfield development. With much of the
Bakken producing region previously undeveloped, this young oilfield can and should become the new
industry standard by utilizing modern materials, technologies, and best practices.
The road ahead for the pipeline industry in North Dakota is long. Building out the natural gas, crude oil,
electrical, water, and other required infrastructure in North Dakota is going to take a great deal of
cooperation and patience between all stakeholders. Despite the inevitable challenges, North Dakota is
positioned to have one of the most advanced oilfields in the world and a petroleum producing region
that current and future citizens of North Dakota can look upon with pride.
Definitions
MCF – Thousand Cubic Feet
MCFD – Thousand Cubic Feet per Day
MMCF – Million Cubic Feet
MMCFD – Million Cubic Feet per Day