Embed Size (px)
Citation preview
3/12/2018
1
North Dakota Infrastructure Needs Studies by Jurisdiction: State, County, Township, Urban and Transit
North Dakota Symposium on Transportation FundingTim Horner – Program Director
Bismarck RadissonMarch 14, 2018
Upper Great Plains Transportation InstituteNorth Dakota State University
Content of Today’s Presentation
• Quick History of Needs Studies– Sponsor of Individual Study
– Study Team Members
– Methods Used
– Data Collection Details
– Results
• Roll-up of All Studies
• Corresponding tables are found in the blue handout
Slide 2
3/12/2018
2
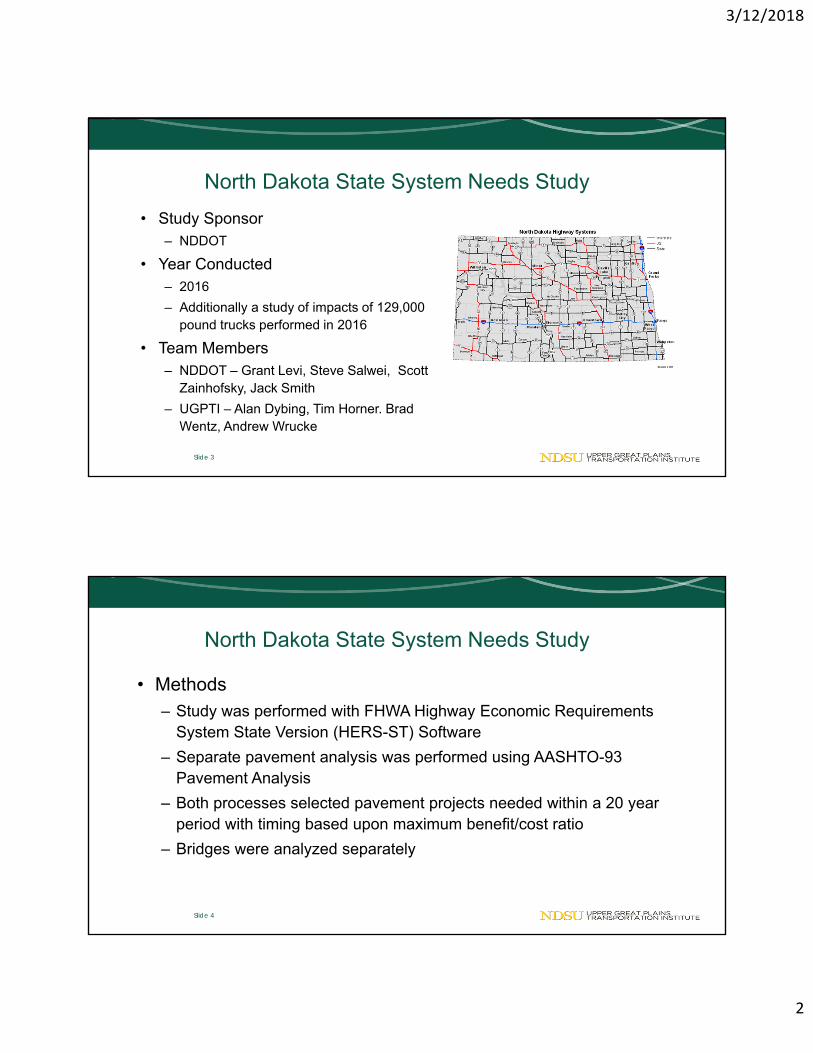
North Dakota State System Needs Study
• Study Sponsor– NDDOT
• Year Conducted– 2016
– Additionally a study of impacts of 129,000 pound trucks performed in 2016
• Team Members– NDDOT – Grant Levi, Steve Salwei, Scott
Zainhofsky, Jack Smith
– UGPTI – Alan Dybing, Tim Horner. Brad Wentz, Andrew Wrucke
Slide 3
North Dakota State System Needs Study
• Methods– Study was performed with FHWA Highway Economic Requirements
System State Version (HERS-ST) Software
– Separate pavement analysis was performed using AASHTO-93 Pavement Analysis
– Both processes selected pavement projects needed within a 20 year period with timing based upon maximum benefit/cost ratio
– Bridges were analyzed separately
Slide 4
3/12/2018
3
North Dakota Truck Harmonization Studyof 129,000 pound trucks - 2016
• Study Sponsor– 2015 Legislature
– Study Team:• NDDOT, UGPTI, NDHP
• ND Dept. of Commerce plus 8 association groups
– 129,000 lb. trucks were modeled to project bridge inventory ratings to compare to current ratings
Slide 5
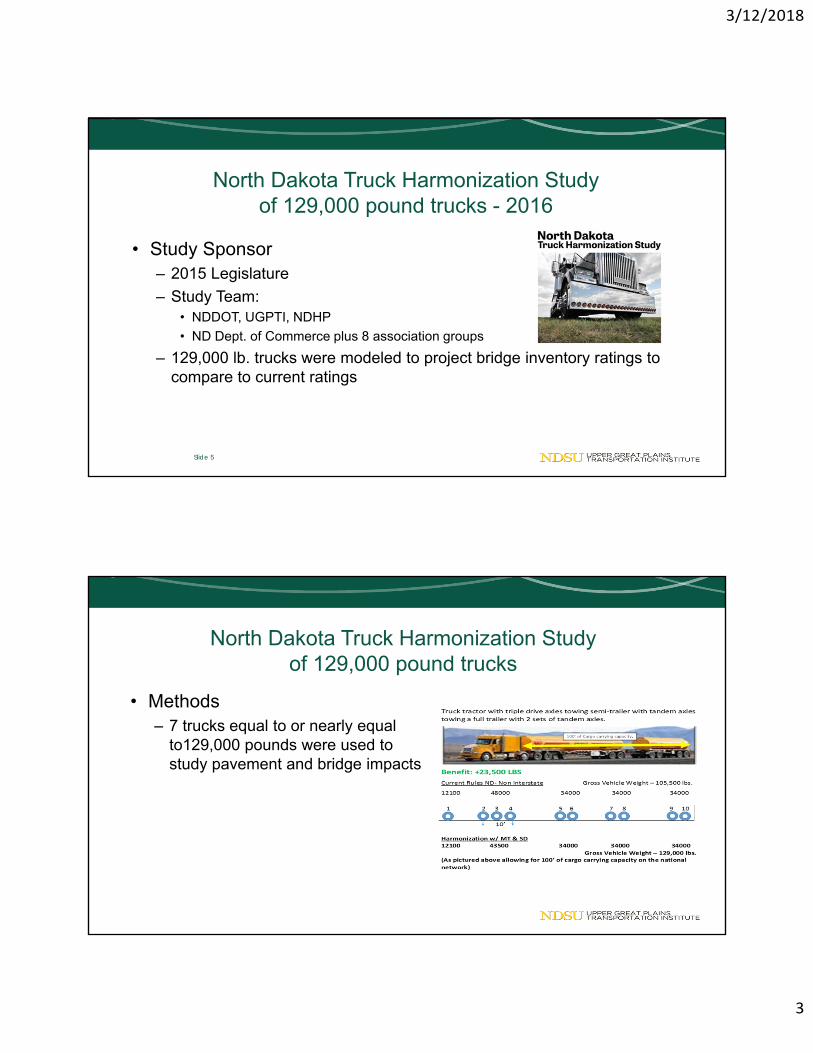
North Dakota Truck Harmonization Studyof 129,000 pound trucks
• Methods– 7 trucks equal to or nearly equal
to129,000 pounds were used to study pavement and bridge impacts
3/12/2018
4
North Dakota Truck Harmonization Studyof 129,000 pound trucks
Methods
• Equivalent Single Axle Loads were calculated for current trucks versus 129 k trucks.
• 129 k trucks were modeled to project bridge inventory ratings to compare to current ratings
Results
• Pavement impacts were negligible since 129,000 lb. trucks have more tandem and triple axles which are more pavement friendly and result in fewer trips
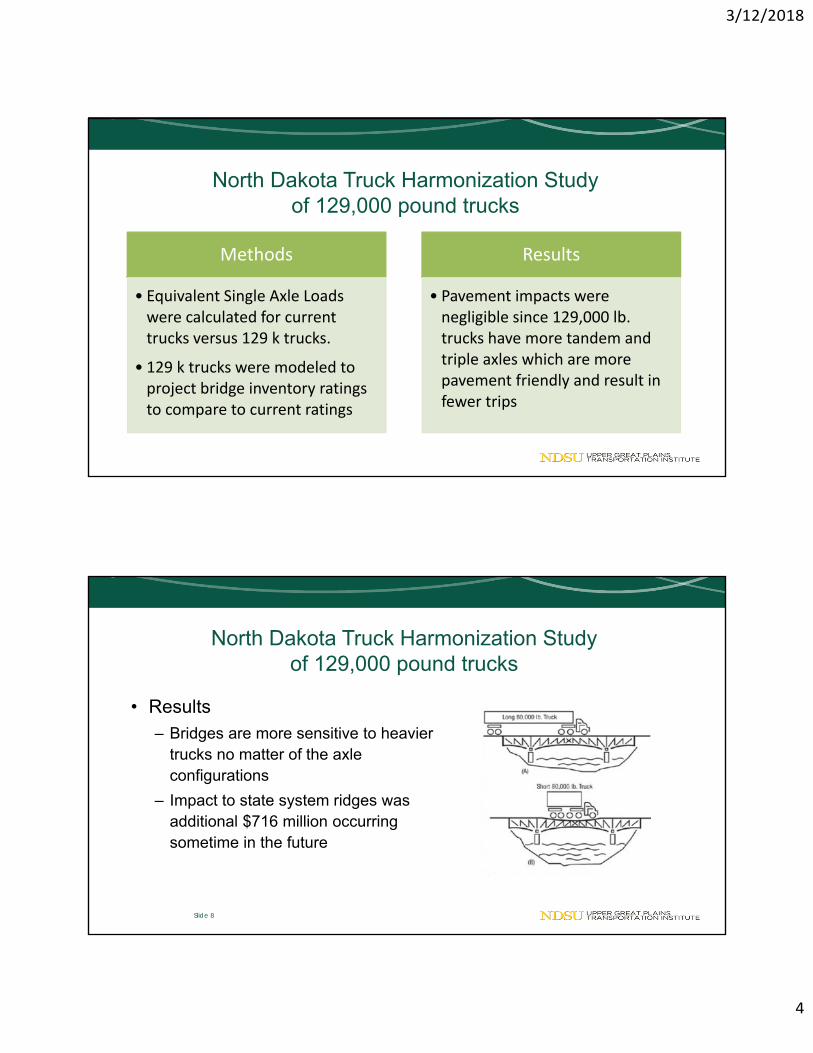
North Dakota Truck Harmonization Studyof 129,000 pound trucks
• Results– Bridges are more sensitive to heavier
trucks no matter of the axle configurations
– Impact to state system ridges was additional $716 million occurring sometime in the future
Slide 8
3/12/2018
5
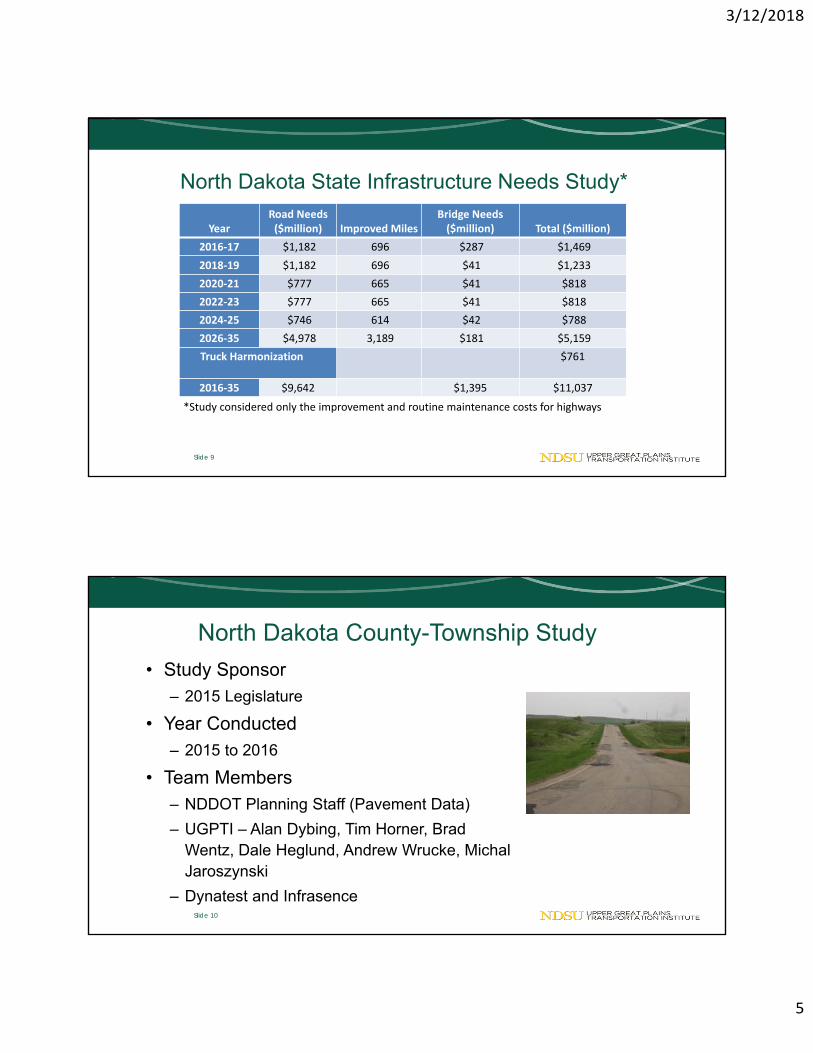
North Dakota State Infrastructure Needs Study*
Slide 9
YearRoad Needs ($million) Improved Miles
Bridge Needs ($million) Total ($million)
2016‐17 $1,182 696 $287 $1,469
2018‐19 $1,182 696 $41 $1,233
2020‐21 $777 665 $41 $818
2022‐23 $777 665 $41 $818
2024‐25 $746 614 $42 $788
2026‐35 $4,978 3,189 $181 $5,159
Truck Harmonization $761
2016‐35 $9,642 $1,395 $11,037
*Study considered only the improvement and routine maintenance costs for highways
North Dakota County-Township Study
• Study Sponsor– 2015 Legislature
• Year Conducted– 2015 to 2016
• Team Members– NDDOT Planning Staff (Pavement Data)
– UGPTI – Alan Dybing, Tim Horner, Brad Wentz, Dale Heglund, Andrew Wrucke, Michal Jaroszynski
– Dynatest and InfrasenceSlide 10
3/12/2018
6
Quick History of County-Township Studies
• 2010 study: UGPTI estimated road investment needs for the 2011 session– 21,500 new wells & increased ag. production
• 2012 study: Updated investment needs– 46,000 new wells, ag. production, & initial bridge study
• 2014 study: More comprehensive data– Higher roadway costs, ag. production, & 60,000 new wells
• 2016 study: First study with GRIT, Oil Production Scenarios
Slide 11
North Dakota County-Township Study
• Methods– Pavement condition collected by NDDOT
– Pavement and soil strength collected by UGPTI through Dynatest & Infrasense
Slide 12
3/12/2018
7
North Dakota County-Township Study
• Methods– Gravel Surveys of Counties and Townships
– Creation of traffic model for entire state to predict truck loads on county and state roads
– Pavement prediction model created to forecast when projects would be needed
Slide 13
Slide 14
*
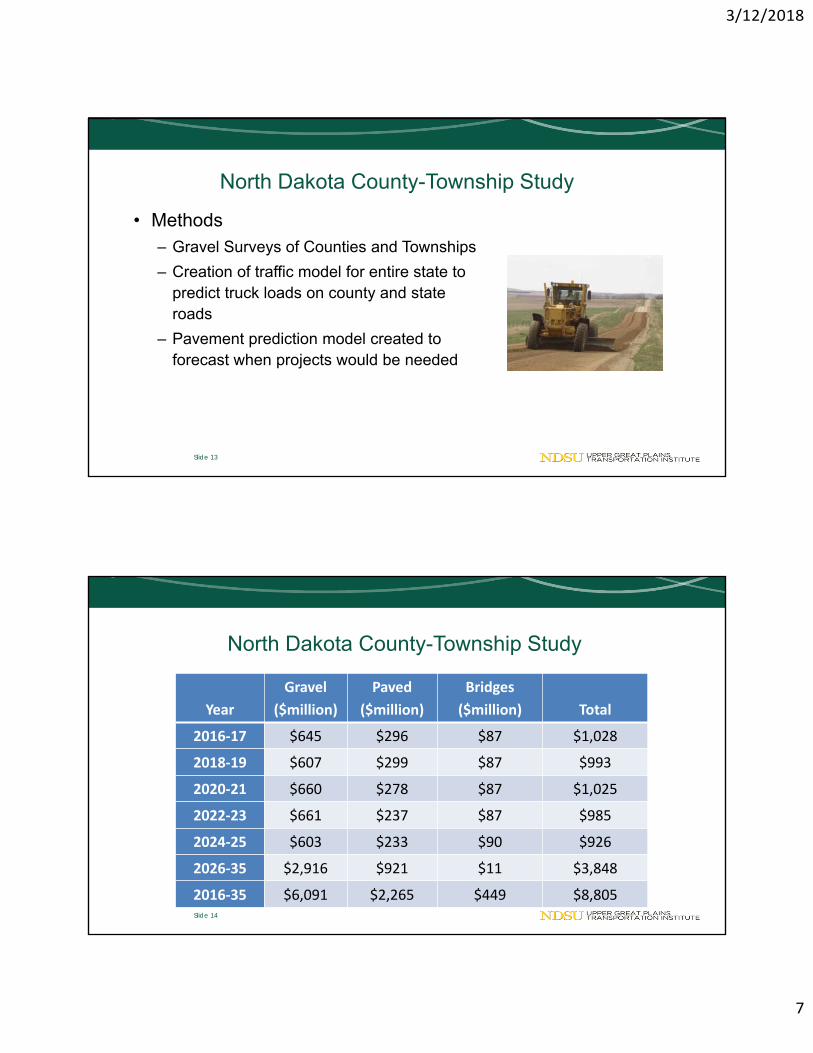
North Dakota County-Township Study
Year
Gravel
($million)
Paved
($million)
Bridges
($million) Total
2016‐17 $645 $296 $87 $1,028
2018‐19 $607 $299 $87 $993
2020‐21 $660 $278 $87 $1,025
2022‐23 $661 $237 $87 $985
2024‐25 $603 $233 $90 $926
2026‐35 $2,916 $921 $11 $3,848
2016‐35 $6,091 $2,265 $449 $8,805
3/12/2018
8
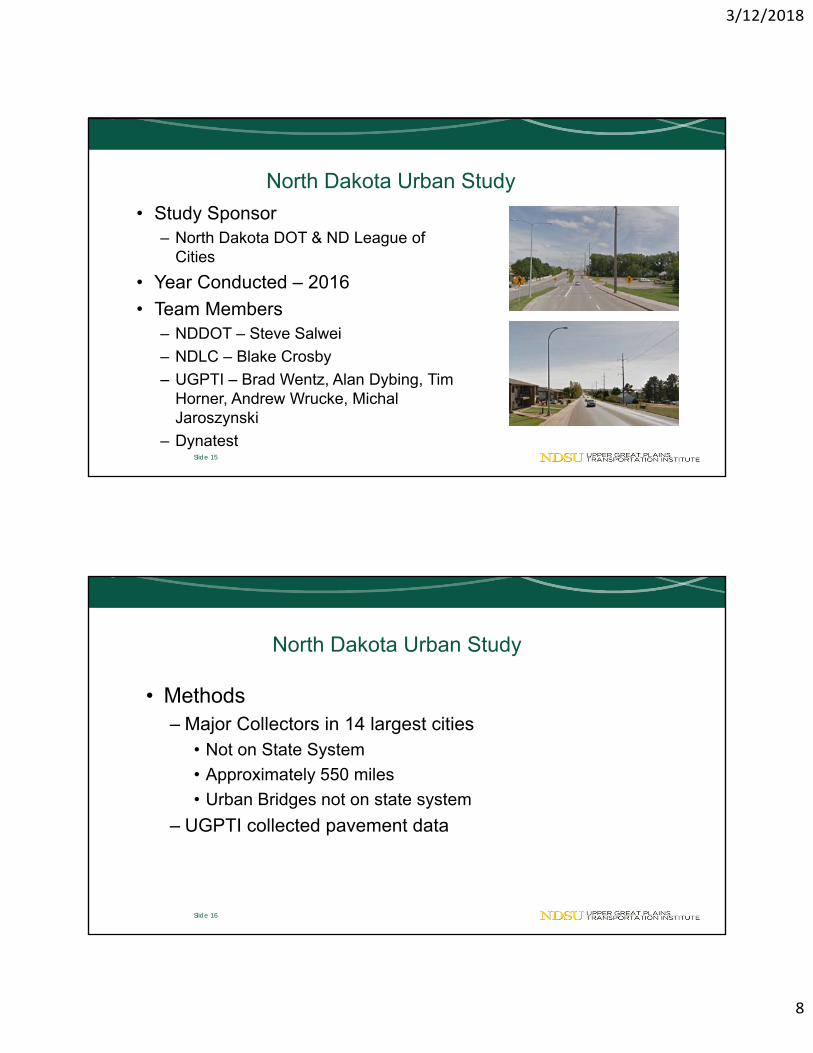
North Dakota Urban Study
• Study Sponsor– North Dakota DOT & ND League of
Cities
• Year Conducted – 2016
• Team Members– NDDOT – Steve Salwei
– NDLC – Blake Crosby
– UGPTI – Brad Wentz, Alan Dybing, Tim Horner, Andrew Wrucke, Michal Jaroszynski
– DynatestSlide 15
North Dakota Urban Study
• Methods– Major Collectors in 14 largest cities
• Not on State System
• Approximately 550 miles
• Urban Bridges not on state system
– UGPTI collected pavement data
Slide 16
3/12/2018
9
North Dakota Urban Study
Slide 17
Year
Roads
($million)
Bridges
($million)
Total
($million)
2016‐17 $141 $8 $149
2018‐19 $97 $8 $105
2020‐21 $80 $8 $88
2022‐23 $70 $8 $78
2024‐25 $43 $8 $51
2026‐35 $171 $2 $173
2016‐35 $601 $42 $643
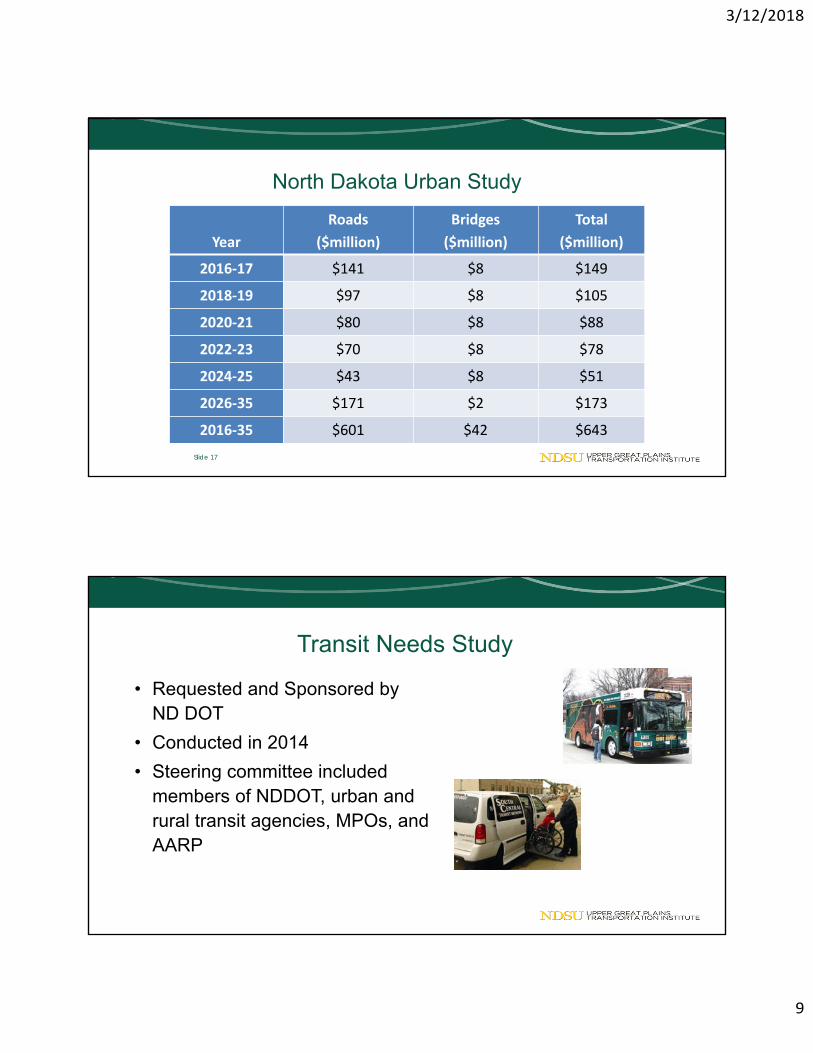
Transit Needs Study
• Requested and Sponsored by ND DOT
• Conducted in 2014
• Steering committee included members of NDDOT, urban and rural transit agencies, MPOs, and AARP
3/12/2018
10
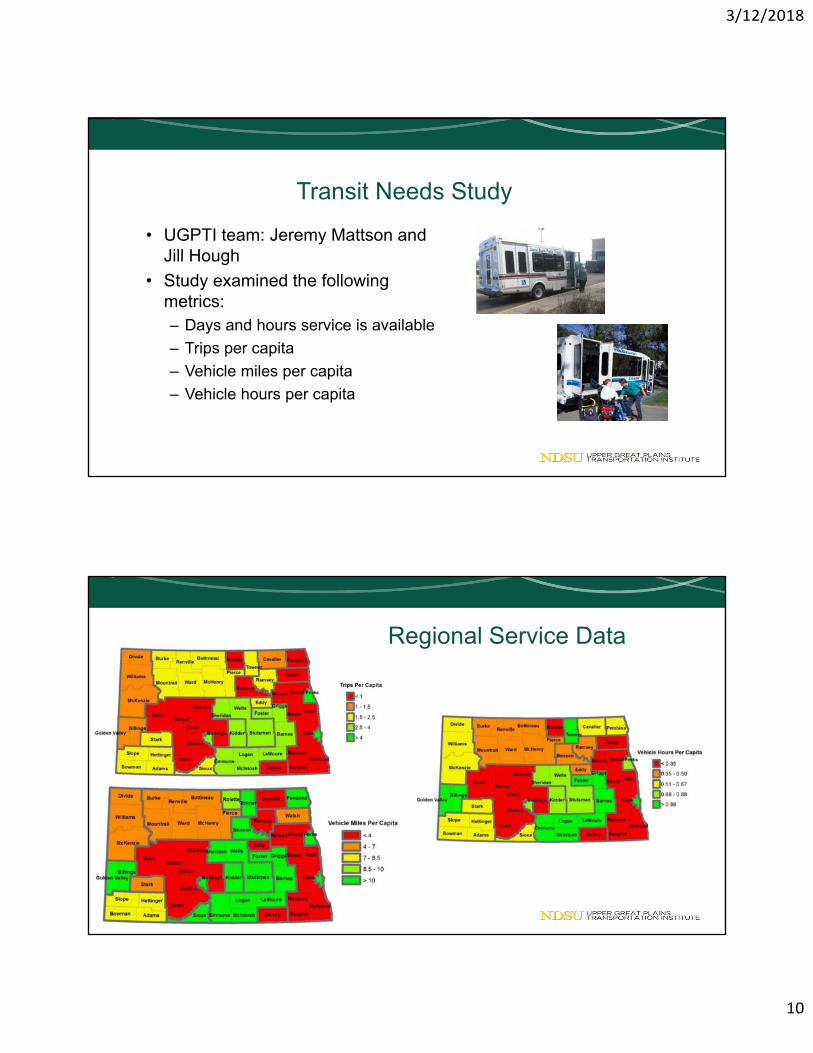
Transit Needs Study
• UGPTI team: Jeremy Mattson and Jill Hough
• Study examined the following metrics:– Days and hours service is available
– Trips per capita
– Vehicle miles per capita
– Vehicle hours per capita
Regional Service Data
3/12/2018
11
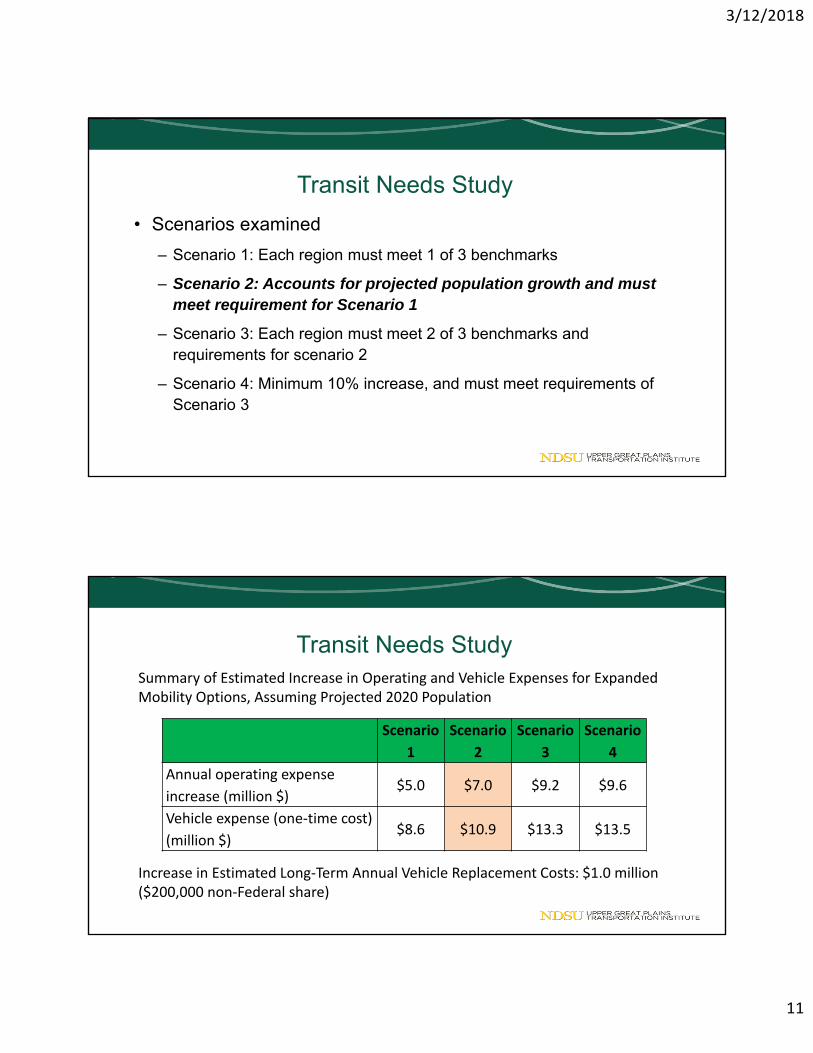
Transit Needs Study
• Scenarios examined
– Scenario 1: Each region must meet 1 of 3 benchmarks
– Scenario 2: Accounts for projected population growth and must meet requirement for Scenario 1
– Scenario 3: Each region must meet 2 of 3 benchmarks and requirements for scenario 2
– Scenario 4: Minimum 10% increase, and must meet requirements of Scenario 3
Transit Needs Study
Scenario
1
Scenario
2
Scenario
3
Scenario
4
Annual operating expense
increase (million $)$5.0 $7.0 $9.2 $9.6
Vehicle expense (one‐time cost)
(million $)$8.6 $10.9 $13.3 $13.5
Summary of Estimated Increase in Operating and Vehicle Expenses for Expanded Mobility Options, Assuming Projected 2020 Population
Increase in Estimated Long‐Term Annual Vehicle Replacement Costs: $1.0 million ($200,000 non‐Federal share)
3/12/2018
12
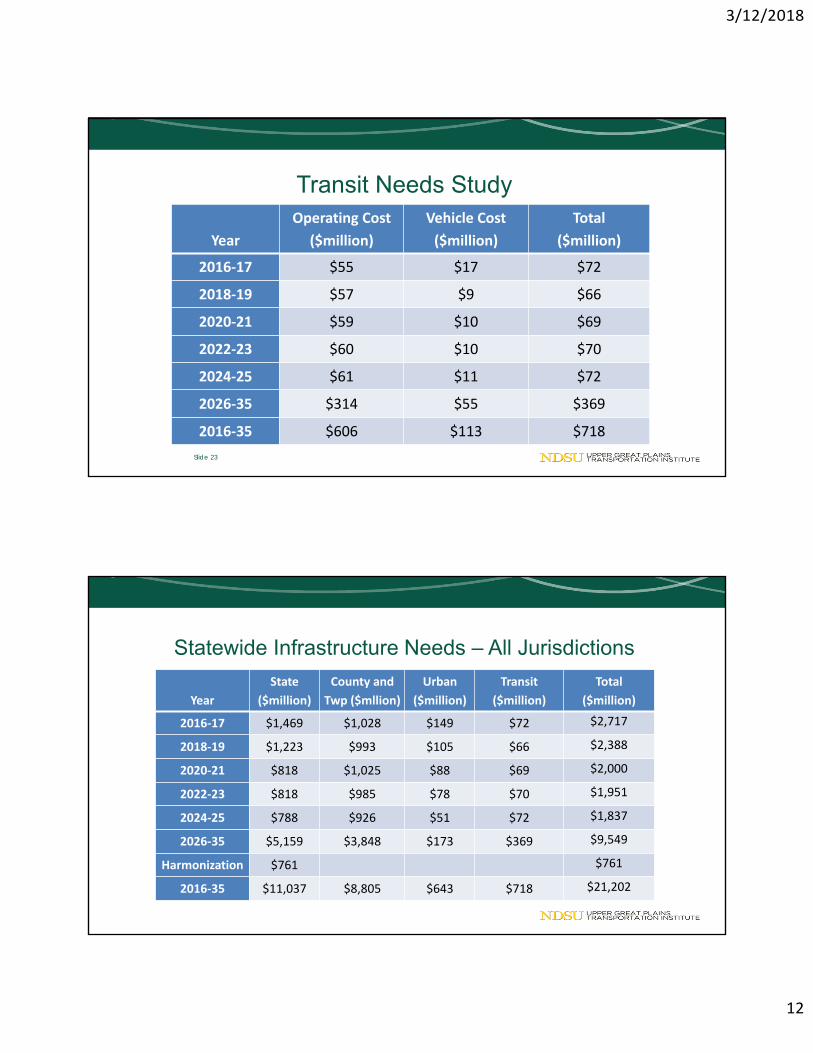
Transit Needs Study
Slide 23
Year
Operating Cost
($million)
Vehicle Cost
($million)
Total
($million)
2016‐17 $55 $17 $72
2018‐19 $57 $9 $66
2020‐21 $59 $10 $69
2022‐23 $60 $10 $70
2024‐25 $61 $11 $72
2026‐35 $314 $55 $369
2016‐35 $606 $113 $718
Statewide Infrastructure Needs – All Jurisdictions
Year
State
($million)
County and
Twp ($mllion)
Urban
($million)
Transit
($million)
Total
($million)
2016‐17 $1,469 $1,028 $149 $72 $2,717
2018‐19 $1,223 $993 $105 $66 $2,388
2020‐21 $818 $1,025 $88 $69 $2,000
2022‐23 $818 $985 $78 $70 $1,951
2024‐25 $788 $926 $51 $72 $1,837
2026‐35 $5,159 $3,848 $173 $369 $9,549
Harmonization $761 $761
2016‐35 $11,037 $8,805 $643 $718 $21,202
3/12/2018
13
Further Information
• Tim Horner – UGPTI
• Alan Dybing – UGPTI
• Jeremy Mattson – UGPTI
• Michal Jaroszynski - UGPTI
![[XLS] · Web view6117 4 4.3 6120 4 4.3 6125 13 13.3 6130 13 13.3 6135 13 13.3 6140 13 13.3 6145 13 13.3 6150 13 13.3 6160 13 13.3 6210 4 4.3 6220 13 13.3 6230 4 4.3 6240 4 4.3 6250](https://img.pdfslide.us/doc/110x75/5b2a094f7f8b9a251e8b792d/xls-web-view6117-4-43-6120-4-43-6125-13-133-6130-13-133-6135-13-133-6140.jpg)