Embed Size (px)
Citation preview
Page 1/20
Nutritional status among primary school studentsand its association on academic performance innorth-central Ethiopia: Cross-sectional study designTigist Eniyew ( [email protected] )
Wachemo University https://orcid.org/0000-0001-6020-4257Fikirtemariam Abebe
Addis Ababa University school of Nursing and MidwiferyDebela Gela
Addis Ababa University School of Nursing and MidwiferyAgezegn Asegid
Wachemo University Department of NursingDawit Tiruneh
Debre-tabor University Department of midwifery
Research article
Keywords: Nutritional status, Academic performance, primary school, child1
Posted Date: February 18th, 2020
DOI: https://doi.org/10.21203/rs.2.13718/v2
License: This work is licensed under a Creative Commons Attribution 4.0 International License. Read Full License
Page 2/20
AbstractBackground: Under-nutrition is a fundamental factor which resulted in delayed cognitive development andunderachievement of academic performance later in children’s life at school. The extent of under-nutritionin Ethiopia has been established well but there are insu�cient evidences about its relationship with theeducational achievement of school-age children.
Objective: To assess the correlation of nutritional status with academic performance among publicprimary school children
Method: - An institution-based cross-sectional study was conducted over 399 primary school children inDebre-Tabor Town, Amhara Regional State North-Central Ethiopia, 2018 after selecting them with simplerandom sampling. The nutritional status was assessed using the anthropometric measurement of WHO2007 reference as Height for Age Z-score (HAZ), Weight for Age Z-score (WAZ) and Body Mass Index forAge Z-score (BAZ). Academic performance was assessed by calculating two semesters of overallsubjects’ average score. Descriptive statistics, Pearson’s correlation test, and linear regression were usedfor statistical analysis. Data were analyzed using SPSS version 24 and nutritional status was analyzedusing WHO AnthroPlus version 1.0.4 (5-19 years).
Result: - Almost half of study participants were male 209(52%), 291(73%) from married family, and177(44%) were comes from family having more than �ve members. The mean age of the studyparticipants were 11.85. The prevalence of stunting, wasting, underweight and overweight was 22%,32.4%, 24.3%, and 1.3% respectively. The prevalence of any form of malnutrition was 56.14% and themean academic performance for study participants was 71.65(±12.63 SD). There was a statisticallysigni�cant positive relationship between academic achievement and HAZ. Age of child and absenteeismwere associated negatively while attending preschool, the type of head of the house, and having breakfasthabits associated positively with the educational achievement of the study participants.
Conclusion:-The prevalence of under-nutrition among study participants was high. Considering thecorrelation of absenteeism, skipping breakfast, having preschool education and HAZ, nutritionalinterventions should be considered at prenatal, infancy and preschool period to sustain positive impactand reducing negative factors.
IntroductionGlobally the death of 45% under-�ve children and 38% of early school leaving are attributed tomalnutrition. Moreover, there is an estimation of over 450million children will be affected by stuntingwhich is the impact of chronic undernutrition by 2025[1];[2, 3].
Only Africa shares 38% stunted, 27% wasted and 24% overweight children in under-�ve children. Morespeci�cally from 59 million continental prevalence East African region constitutes 24% and aggressivelysuffering from stunting compared to the West Africa region which was 19.2% (19.2%) [4].
Page 3/20
Primary education is an instrument to meet United Nation Education, scienti�c and Cultural Organization(UNESCO) goal “quality education and lifelong learning for all by 2030” and “end poverty by 2030”[5].Besides, it is one of the most potent approachs to realize Ethiopia’s current Gross Transformation Program(GTP) development vision to become a middle-income economy by 2025 [6]. Progress had achieved overMillennium Development Goals (MDG) and Education for All (EFA) goals. But, still, 58 million primaryschool-age children are out of school worldwide due to various reason including nutritional challenges[7].
Ethiopian elementary or primary education is free with the target of having less than 1% for dropout andrepetition rate[8]. Previously it was indicated that the factors of poor academic performance in primaryschool children need to be investigated with more powerful design [9]. And also, despite greater demandto improve students’ academic performance in developing countries various hampering factors wereidenti�ed like undernutrition and childrens health status, which adversely affects the ability to learn andpoor performance [10, 11]; [12].
Various researches have been consistently describing the impact of well nourishment for its positiveeffect over intelligence, academic achievements, learning and cognitive performance, maintainingeducation thereby preserving the nation for the grave effect of malnutrition [13] ; [14]; [15]; [16]. Sonutritional intervention is important for children attending primary school since it enhances efforts toreduce levels of malnutrition and supplement better academic achievement in the preschool years.
Malnutrition remains a key crisis in adolescents’ school performance due to inappropriate eating practices[11]. Moreover, primary school children who are suffering from malnutrition exhibit underachievement ofacademic performance with a potential decline in future mental excellence. [17].
Stunting and under-nutrition have immediate and long term effects that range from immediate schooldropout to the worse deprivation of growth and development, and subsequent cognition which negativelyaffects educational achievements[18]; [19].
Various factors of malnutrition like food insecurity, skipping breakfast, overweight, and underweight wereshown a strong association with decreased school performance in UK, Brazil, and the USA [16]; [20]; [21].More speci�cally, Educational underachievement was seen in 31.5% of obese, 30.0% of underweight and22.9% of overweight children respectively [22].
Consistently, the USA school breakfast program was proven the increment of academic achievement overprogram utilizers[21]. Another study also showed Children having frequent breakfast had performed wellin IQ test scores while those who occasionally have breakfast perform low [23]. In Zimbabwe, also havingfrequent meals and taking a regular breakfast, lunch and dinner have show positive effects on children’slearning achievement [19].
In addition to underlying nutritional problems, various studies found that boys suffer more from pooreducational achievement (23%) than girls (18.6%)[22]; [17]. Another study in Morocco also showed a moreprofound effect of malnutrition over the boy’s school grade average than girls. This study reveals 30.1% of
Page 4/20
girls and 38.7% of boys rated as poor for mathematics and 17.1% of girls and 37.3% of boys rated as poorto average [11].
Socio-demographic factors including sex, absenteeism, and distance from school, grade attended,parental socio-economic status and parental involvement in their children’s schooling were found to besigni�cantly associated with primary school children’s academic performance [24-26].
African malnourished school-age children are at risk of repeating grades and dropping out of school withan achievement of 0.2 to 1.2 years less in school education [27]. Moreover, more than a quarter of childrenin sub-Saharan Africa are too thin which is resulted in impaired mental development and low educationalachievement [25]. By 2025 an additional 11.7 million children will be stunted in sub-Saharan Africa whencompared to the 2010 data [1].
Ethiopian Demographic and Health Survey (2016 EDHS) report shows that the prevalence of under-�vesevere malnutrition was 18% for stunting, 3% for wasting and 7% for underweight respectively [28]. TheCost of Hunger in Africa (COHA) summary report revealed that more than 2 out of every 5 children inEthiopia are stunted with 16% repetitions in primary school children and achievement of 1.1 years less inschooling [29].
Even though researches done in South Gondar and Goba Town conclude that nutritional status did notshow an association with the academic performance [12, 26]. Other pocket studies done in various areasof Ethiopia consistently reporting association and effect of undernutrition over mathematics score [12];and overall academic performance [25]; [24].
. Like as it was investigated in various developed and developing countries, the effect of nutritional statuson the school performance needs to be consistently identi�ed in our context for a convincing planner anddiverting potential for intervention since factors differ across various socio-demographic factors. With adiverse role of nurses even as school nurses, the output of this study probably shifts the attention ofschool nurses for speci�c nutritional intervention at school level parallel to other routine services andnurses working in policy design for resource and effort mobilization. By far this study bene�ts the regionaleducation and health o�ce policymakers and zonal planners to intend appropriate nutritionalinterventions through SFP and NEP at school to deal with the impact of malnutrition on academicperformance among primary school children.
MethodsAim, Design, and setting
The study aims, to assess the association of nutritional status with academic performance. An institution-based cross-sectional study was conducted from March 30 to April 30, 2018, at Debre Tabor Town, North-Central Ethiopia which is located 665kms north of Addis Ababa . The 2017 population projection the totalpopulation of the town showed 96,973 [30]. As information obtained from the town education sector, the
Page 5/20
town has two preparatory schools, fourteen elementary schools of which seven governmental, and nineKindergarten schools. The total population of public primary school children was 6,935 of which 49.14%were males.
Participants and Sampling
The study was conducted over primary school attending students. Single population proportion formulawas used to estimate sample size by considering a 95% con�dence level, 0.05 margin of error andaverage academic performance of 62.25% in the study area [26]. The required sample after adding 10% ofthe non-response rate was 399. First simple random sampling was used to select three schools fromseven schools, and then the proportional allocation of sample to the population size of selected schoolwere employed, and then �nal systematic random sampling of every nine students were taken astechniques to obtain �nal study participants after getting complete list of students from each school.
Study instrumentThe �rst part of the data collection tool was a structured socio-demographic questionary prepared tocollect information about parental socio-demographic and economic status was used. This sectionconsists of twenty questions originally prepared in English and translated to local language Amharic andit was adapted from previous studies [12, 26]. The second part of the data collection tool was theweighting scale taken by Prestige digital weight scale [Model: SALTEP weigh-Trony which is British patent2214320, UK regd Design 1-045-766 and USA regd Design D312585 which was calibrated on 11 July2000]. It was taken two times independently by two data collectors and an average was taken for �nalanalysis.
The third part of the data collection tool was height scale, which was measured in meter by data collectorwhile the student stands side to meter posted over the wall. Again this also taken two times byindependent data collectors for having average measurements. The fourth part of the data collection toolwas the WHO standard Reference guideline, 2007. It was used to interpret and judge taken weight andheight during data collection. Accordingly, as HAZ score < -2SD (stunted), WAZ score < -2SD (wasted) andBAZ score < -2SD (underweight) or thin), BAZ > +1SD (overweight) and BAZ > +2SD (obese). The �fth partof the data collection tool was a sheet for measurements of academic performance. It was prepared forrecording two consecutive semester student scores from the school roster.
Data collection
Six trained Health extension workers as a data collectors and two trained BSc nurses as supervisors wererecruited for the process. Consent was obtained from their parents and informed assent was obtainedfrom children for their authorization to get their anthropometric measurements. The data collection wasdone in each section of grade by arranging a convenient time and mobilization of measuring equipment.The previous grade also obtained from schools record o�cers for having statistical tests withanthropometric measurements.
Page 6/20
Data quality control
The Random selection of students who participated in the study was used as quality assurance.Moreover, training of data collectors, conducting pretest over 5% of the population and day to daydiscussion about the progress with supervisors and data collector were activities to maintain the qualityof the study. Other measures were using standard tool to measure and interpret the measurement.
Variables and MeasurementsThe study uses stunting, underweight and wasting as an indicator of nutritional status among studyparticipants. The children’s body weight was measured to the nearest 0.1kg with light closing and barefoot using a digital weighing scale by trained data collectors. At �rst and always before the next child theweight measure scale checked against zero reading. Then the child stood with both feet in the center ofthe scale. This means that the scale reads zero when no weight is placed on it. Their height was measuredusing a meter to the nearest 0.1cm without shoes in a standing position. A Child stood on a �at surfacewith feet �at, together and against the wall. Legs, arms, and shoulders were straight, at sides and levelrespectively.
Academic performance was the dependent variable for the study and operationally measured by takingtwo semester’s average score result of the total subjects obtained from the individual child’s semestergrade report and considered as good if it is more than the mean academic performance and poor if lessthan the mean academic performance. Students’ grade report cards were taken as a measure of academicperformances(Zaini MZ et al., 2005).
Nutritional status: is the child’s state of the body which is determined by anthropometric measurementindices as stunted, wasted, underweight or overweight based on the WHO standard reference 2007 [31].
Anthropometric measurements: is the nutritional status measurement method of primary school childrento identify whether they are stunted, wasted underweight or overweight.
Malnutrition: is a poor nutritional status of primary school children which is expressed in anthropometricindices when the Z-scores for the WHO standards of 2007 are less than or equal to minus two (Z-scores <-2SD) or more than plus one for BAZ (z-score > +1 SD).
Stunting: indicates the nutritional status of the study participants when their height for age z-score is lessthan or equal to minus two (HAZ < -2SD) for the WHO standard reference 2007.
Well nourished: indicate children’s nutritional status which is measured as HAZ greater than minus twostandard deviations (HAZ> -2 SD) to the WHO reference 2007.
Underweight: indicates the child’s nutritional status among the study participants which is measured asbody mass index for age z-score less than or equal to minus two (BAZ<-2SD) of the WHO standardreference 2007.
Page 7/20
Wasting: is the nutritional status of primary school children aged 7-10 years and expressed in weight forage z-score less than or equal to minus two (WAZ < -2SD) of the WHO standard reference 2007.
Overweight: is the school-age childrens nutritional status which is measured in terms of body mass indexfor age z-score greater than or equal to plus one (BAZ ≥ +1 SD) of the WHO standard reference 2007.
Primary school children: - Children who attend primary school(one to eight grade) and are in the age groupof 7-14 years as set by ESDP IV [9].
Data analysisData were checked for completeness, coded, entered, cleaned and checked using Epi-Data 3.1 andanalyzed using SPSS version 24. The nutritional indicators HAZ, WAZ and BAZ were calculated frommeasurements using WHO AnthroPlus version 1.0.4 software and compared with the WHO references2007 data. A descriptive analysis was conducted to get summary data on frequencies, means andstandard deviations of the child and their parental socio-demographic and economic characteristicvariables. Pearson’s correlation test was performed to assess the relationship between nutritional statusand academic performance of the study participants. Linear regression was performed to identifypredictors of academic performance. The statistical signi�cance was declared at P-value ≤ 0.05.
Results
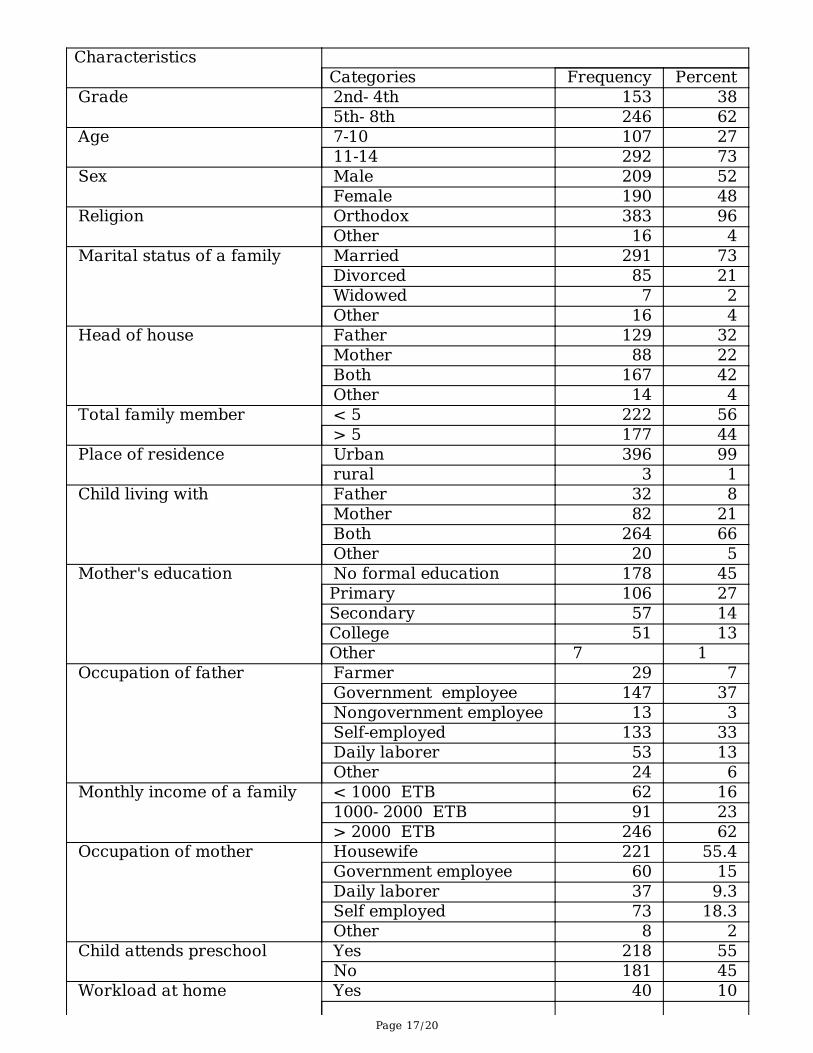
Socio-demographic and economic characteristics of thestudy participantsA total of 399 public primary school children were enrolled with a 100% response rate. Out of theseparticipants, (52%) were males and (48%) were females with a mean age of 12 (±1.9 SD) and 11.8 (±1.8SD) respectively. The Overall mean of the study participants was Mean 11.85 year. Nearly three fourth ofthe study participants (73%) were in the age group 11-14. The large proportion of the participants (62%)came from the second cycle (5-8 grades). Almost all of the children were Orthodox Christian (96%) inreligion, from urban (99%) and married families (73%). The majority of the participants, (42%) wereheaded by both father and mother. More than half of the participants, 56% were from a family size of lessthan �ve.
The majority of the study participants were born from no formal education mothers (45%), governmentemployee fathers (37%), monthly income of >2000 ETB (62%) and house wife mothers (55.4%). Only halfof the study participants, 55% have attended preschool. Regarding breakfast, almost all of theparticipants (97%) ate breakfast and more than half, 55% of them ate breakfast always. Most of theparticipants, 97% travels for less than 30 minutes to go to school with an average time of 14.4minute (±8.4 SD) for males and 15.3minute (±8.8 SD) for females respectively. Most of the participants, (71%) wereabsent from school and 86% of them absent from the school for less than 5 days. (Table 1)
Page 8/20
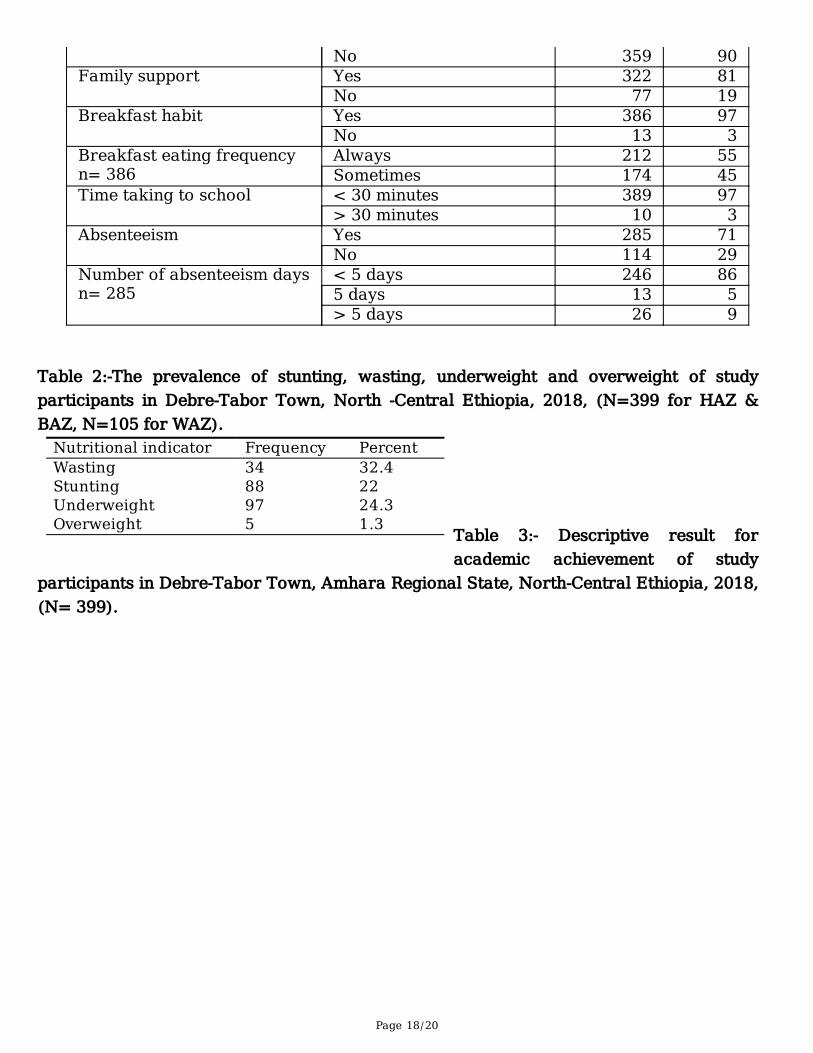
Nutritional status of primary school childrenThe anthropometric assessment of the study participants revealed that the overall prevalence of any formof malnutrition was 56.14%. Out of this, 88 (22%) were stunted, 34 (32.4%) wasted, 97 (24.3%)underweight and 5 (1.3%) overweight. (See Table 2)
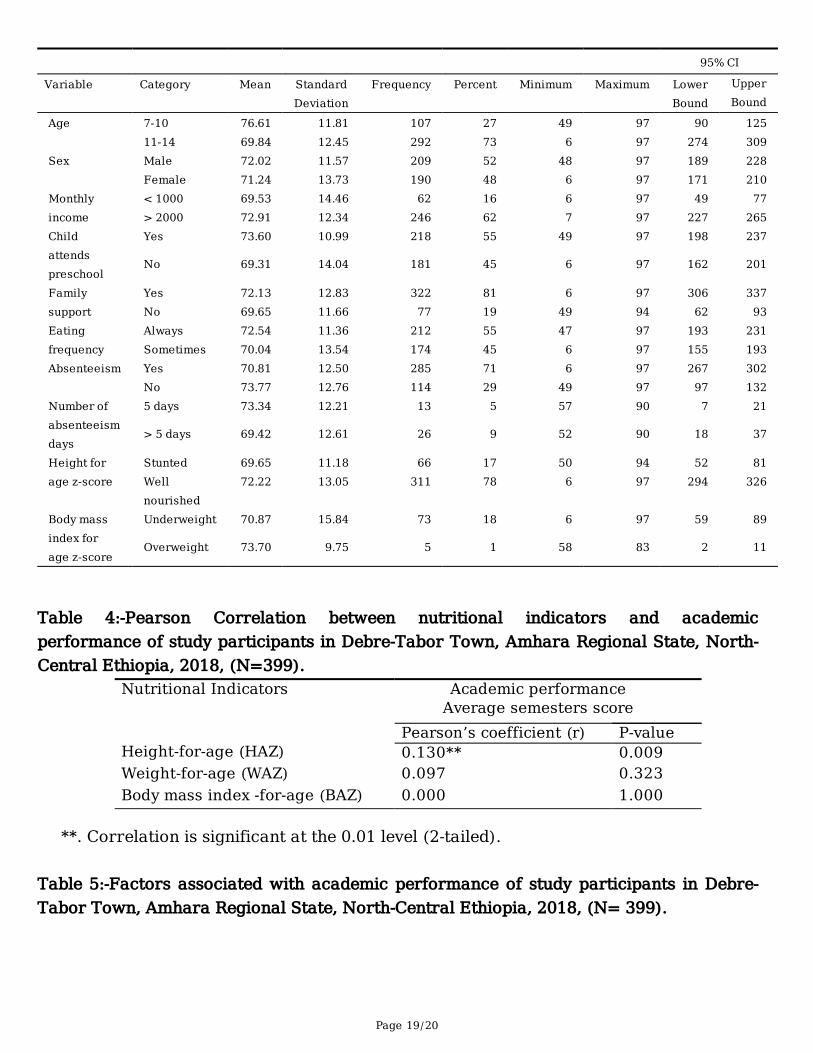
Academic performance of primary school childrenThe mean academic performance for primary school children was 71.65 (±12.63SD) and the female71.24 (±13.73 SD) performance was slightly less than male 72.02 (±11.57 SD). Study participants in theage group 7-10 perform well (76.61±11.81SD) academically when compared with those 11-14 years(69.84±12.45 SD). Children from high monthly income parents performed better (72.91±12.34 SD) thanthose from low (69.53±14.46 SD) income parents. Educational achievement was poor for those whoabsent for more than �ve days (69.42±12.61 SD) when compared to those absent for �ve days(73.34±12.21 SD). Children who were overweight perform better (73.70±9.75 SD) academically whencompared with those underweight (70.87±15.84 SD). Well-nourished children perform better (72.22±13.05SD) academically when compared with stunted children (69.65±11.18 SD). Study participants who atebreakfast sometimes (70.04±13.54) perform slightly less than those at always (72.54±11.36 SD). (SeeTable 3)
Relationship between nutritional status and academicperformanceThere was a statistically signi�cant positive relationship between academic achievement and the HAZ ofthe study participants. This positive relationship indicates that as children become well-nourished theirheight for age z-score increases positively to the appropriate growth and development stage. This, in turn,resulted with enhanced educational achievement(See Table 4)
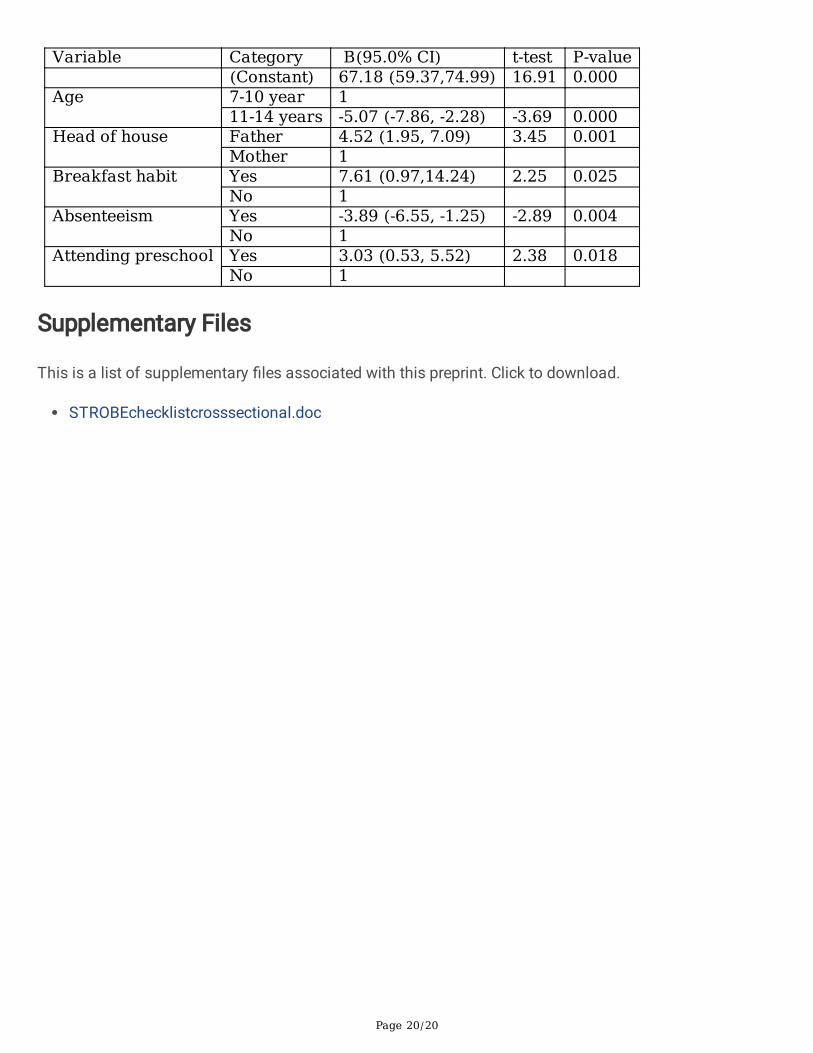
Socio-demographic predicting factors of academicperformanceIn the bivariate linear regression model, variables including head of the house, occupation of father, age ofa child, grade attended by by child, child attending preschool, breakfast habit, absenteeism, and monthlyincome were signi�cantly associated with the academic performance of school-age children. Aftercontrolling confounding factors in the multiple linear regression model, age of the child, head of thehouse, attending preschool, breakfast habit and absenteeism were only variables that signi�cantlyassociated with the educational achievement of the school-age children. Age of the child andabsenteeism were variables that have a statistically signi�cant negative association. Variables includinghead of the house, attending preschool and breakfast habits have a statistically signi�cant positive
Page 9/20
association with educational achievement. An increase of child age by a unit of year decreases meanacademic score by 5.07 (B= -5.07, 95.0% CI: -7.86, -2.28). As students shift their habit from not eatingbreakfast to eating their academic score improved by 7.61 (B=7.61, 95.0% CI: 0.97, 14.24). Again, asstudent committed absenteeism their academic score decreased by 3.89 (B= -3.89, 95.0% CI: -6.55, -1.25).Being preschool attendant increases academic achievement by 3.03 (B= 3.03, 95.0% CI: 0.53, 5.52) andbeing father for head of house increases academic performance by 4.52 (B= 4.52, 95.0% CI: 1.95, 7.09).(Table 5)
DiscussionThis study attempted to assess the association of nutritional status with academic performance and todetermine the socio-demographic and economic predictors of academic performance among publicprimary school children in Debre-Tabor Town, Amhara regional state North-Central Ethiopia.
The overall prevalence of any form of malnutrition for the current study was 56% which is higher than the�nding of Hawa Gelan in 2017 in Oromia, Ethiopia (34.6% ) [25]. However, this �nding is less than the�nding in Sri Lanka in 2015 (60.2%) [17]. This variation could be due to a difference in the two countries’socio-economic differences.
The �nding of this study revealed that the prevalence of stunting was 22% which is higher than a �ndingfrom Oromia, Ethiopia (20.6%), Harar, Ethiopia (8.9%), Adama, Ethiopia (15.6%), India (18.5%) and Brazil(1.7%) [20, 25, 32-34]. On contrary, this �nding was less than the �ndings of Fogera, Ethiopia (37.2%),Kenya (24.5%), Egypt (53.2%) and Lambani, India (37%) [15, 35-37]. The higher prevalence of stuntingcould be early life malnutrition in the young infant period which is a sensitive period for nutrientde�ciencies. This disparity could be due to a difference in the composition of diets with essential nutrientslike proteins, carbohydrates, fats, vitamins and minerals. These macro and micronutrients are vital forbody makeup, immunity and cognitive development of children.
The prevalence of wasting in this study was 32.4% which was almost similar to a �nding in India (33.3%)[38]. However, this �nding was higher than a �nding in Fogera, Ethiopia (30.7%), Hawa Gelan in Oromia,Ethiopia (12.7%), Sidama, Ethiopia (28.2%) and that of Kenya (9.7%) [25, 35, 36, 39]. The �nding ofwasting in this study was lesser when compared with a �nding in Sri Lanka (50.4%) [17]. The discrepancyin acute malnutrition might be due to a difference in children’s health status, nutrient composition(balanced diet), diet size and frequencies of the meal. Acute conditions like diarrhea and upper respiratoryproblems are also key factors for children’s acute malnutrition since it reduces their appetite and impedetheir immunity.
Again in this study, the prevalence of underweight was 24.3% which was almost similar to a �nding inBahir Dar, Ethiopia (24.8%) and the regional state of the study area (24%) [28, 40]. This �nding was higherthan the �ndings in Adama, Ethiopia (21.3%), Oromia, Ethiopia (14.2%), Kenya (14.9%) and that ofLambani, India (14.66 %) [15, 25, 33, 35]. On contrary, this �nding was lesser than �ndings in Fogera,Ethiopia (59.7%) and Sri Lanka (33.7%) [17, 36]. The inconsistency might be due to differences in socio-
Page 10/20
economic status and cultural beliefs about foods. Children from rural areas are more at risk formalnutrition than urban children. Additionally meal frequencies affect children’s nutritional status in whichchildren having regular meals at morning, lunch and night will have better status than those having any ofthe three meals.
The prevalence of overweight in this study was 1.3%. This result is less than a �nding in Adama in 2016,Ethiopia (3.3%), Nigeria in 2013 (37%), Malaysia in 2014 (18.1%) and that of Brazil in 2014 (22%) [20, 33,41, 42]. This disparity might be due to variations in individual nutrient intake and food preferences. Also,differences in socio-economic status could be the reason as Ethiopia is a lower-income country. Lowerincome countries are at risk of food insecurity which affects children’s diet composition, diet size, andfrequency of meal.
For the current study, the mean academic performance for study participants were (71.65±12.63 SD)which is a higher achievement when compared with a study done in Hawa Gelan in Oromia, Ethiopia(67.2% ±15.4% SD), Tach-Gaynt, South Gondar, Ethiopia (62.25%), Hawassa, Ethiopia (35.1 ± 4.1SD), SriLanka in 2015 (<40%) and Nigeria (66.19 ± 17.00 SD) [17, 25, 26, 43, 44]. The variation could be thedifference in the assessment of academic performance, learning methods, learning resourcesaccessibility, tutors given and grading or scoring systems. In this study males perform better (72.02±11.57SD) academically when compared with female students (71.24±13.73 SD). This �nding is consistent witha research �nding in North-Central and South Central Ethiopian that males have performed 2.39 timesbetter than females in academic performances [24, 26]. In contrary �ndings in Nigeria, Morocco, India andAsia, revealed that girls have better educational performance than boys [11, 17, 22, 43]. It may be relatedto the social status of females in the community and recognition of their learning. Moreover, the lack ofrole model and a high percent of students were not passing through preschool training may contribute tothe disparities.
In this study, primary school children from high monthly income parents performed better (72.91±1234SD) than those from low (69.53±14.46 SD) income parents. Educational achievement was poor for thosewho absent for more than �ve days (69.42±12.61SD) when compared to those absent for �ve days(7.343±12.21 SD). Children who were overweight perform better (73.70±9.75 SD) academically whencompared with those underweight (70.87±15.84 SD). Well-nourished children perform better (72.22±13.05SD) academically when compared with stunted children (69.65±11.18 SD). Study participants who atebreakfastsometimes perform poorly (70.04±13.54 SD) when compared with those ate always (72.54±11.36 SD). Students in the age group 7-10 perform well (76.61±11.81SD) academically whencompared with those 11-14 years (69.84±12.45 SD).
The result of this �nding shows that there was a statistically signi�cant positive relationship between HAZand academic achievement (p-value=0.009) which is in line with the �nding done in Goba town and HawaGelan in Oromia, Ethiopia and Sri Lanka [12, 17, 25]. It is also consistent with a �nding in Morocco in 2016
Page 11/20
[11]. This indicates that as children become well-nourished their height for age z-score increases to theappropriate growth and development stage which in turn resulted in positive educational achievement.
In the current analysis, WAZ and BAZ did not show a statistically signi�cant relationship with theacademic performance of the study participants which is consistent with a �nding in various areas ofEthiopian: Tach-Gynt, South Gondar; Gurage Zone; and Goba town [12, 24, 26]. However, this is notconsistent with the �nding in Oromia, Ethiopia and Sri Lanka in which both WAZ and BAZ had signi�cantpositive associations with learning achievement [17, 25]. Even though, it is beyond the scope of this studythe discrepancy could be variation in nutrients taken by children which may have either synergistic orantagonistic effects with each other. At this point, this �nding sought a more powerful study design thatcan indicate a causal relationship among factors.
In this study age of child and absenteeism have a statistically signi�cant negative association witheducational achievement. Predictors including head of the house, attending preschool and breakfast habitassociated positively with the educational achievement of the school-age children. In this study monthlyincome did not show signi�cant association with the academic performance which is opposing to HawaGelan �nding that study participant from high monthly income households perform 2.85 times better thanthose from low monthly income households [25]. In this study breakfast habits and attending preschoolwere signi�cantly positively associated with academic performance. This �nding is con�icting to the�nding in Goba town, Oromia that breakfast habits and attending preschool did not show signi�cantassociation [12]. Variables including sex of the child, residence, maternal education, paternal education,parental occupation,and family size were not signi�cantly associated with an academic performancewhich is parallel to the �nding of Goba town in Oromia, Ethiopia [12]. Absenteeism was signi�cantlyassociated with school-age children’s academic performance which is parallel to the �nding of Tach-Gyntin South Gonar, Ethiopia [26].
This study revealed that as the age of child increases by a unit of year in children aged 11-14 years theireducational achievement decreases by 5.07 when compared to those aged 7-10 years (B: -5.07, 95% CI:-7.86, -2.28). These variations could be due to more attention for pubertal period changes rather thanlearning and attending classes as age increases from 7-10 years to 11-14 years. Adolescence is a periodwhere secondary physiological characteristics are seen which occupied children’s attention not to focuson learning and attending classes. The academic performance of study participants who have eatenbreakfast increases by 7.61 unit change when compared with those who have not eaten breakfast (B:7.61, 95% CI: 0.97, 14.24). This could be the positive effect of breakfast as it replaces energy loss inchildren who spent most of their time on different recreational activities. It also makes students alert andactive to learn, participate and attend classes. A unit changes in absenteeism decreases the academicperformance of students by 3.89 when compared to those who have not absent (B: -3.89, 95% CI: -6.55,-1.25). This could be due to the negative effect of absenteeism in which students miss importantopportunities like lectures and class exercise solutions from their teachers, group discussions with theirclassmates and other school populations.
Page 12/20
Attending preschool enhances academic performance by 3.03 unit change when compared with thosewho didn’t attend preschool (B: 3.03, 95% CI: 0.53, 5.52). This might be the opportunity that children whohave attended preschool could have better awareness about the school environment, enhancedcommunication skill and better social interaction which prepared them for learning and attending class.
STRENGTHS AND LIMITATIONS OF THE STUDYUsing a wider range of student class grades from two to eight and a large sample size can be taken asstrength of this study. But, this study was con�ned to public schools, as a result, it may decreasecon�dence about all students in the study area a since signi�cant number of students were attendingeducation in private schools. This study also fails to provide evidence about the causal relationship andonly limited to thedescription of a possible association. Moreover, it would have been better and morepowerful if the study was incorporated measurements of biochemical parameters in addition toanthropometric measurements that may help to describe and rationalize some of the discrepancies withother studies. A limited number of variables under study may not show the whole factor of schoolperformance and the absence of follow-up and control group also decrease the power of analysis.Furthermore, other factors of poor academic performance like peer in�uence, teaching style, and teacherfactors were not also considered in this study which can also be taken as a limitation.
ConclusionsThe present study revealed that the prevalence of under-nutrition among school-age children is high in thestudy area with a large overall prevalence of malnutrition. The prevalence for each nutritional indicatorwas 22% for stunting, 32.4% for wasting, 24.3% for underweight and 1.3% for overweight. The meanacademic performance of the study participants was 71.65±12.63 SD. A signi�cant positive relationshipwas seen between HAZ and the academic achievement of the study participants. In this study age of thechild, head of the house, attending preschool, breakfast habit and absenteeism were variables thatsigni�cantly associated with the educational achievement of the study participants. As result,
The zonal health and education bureau should work in collaboration with other organizations (NGOs) tocombat malnutrition and to strengthen the positive effect of nutrition on the educational achievement ofprimary school children. The school teachers should encourage students to have breakfast, attend classattentively, motivate female students and create the opportunity to discuss with family about studentstatus.
We also recommend researchers to conduct a further study with a strong study design to investigate thetrue relationship between nutritional status and academic achievement of school-age children.
DeclarationsEthical clearance and consent for participation
Page 13/20
Ethical clearance was obtained from Addis Ababa University school of Nursing and midwifery Ethicalcommittee with Rf No aau/chs/chsg14/2018 on February 07/2018. A formal written letter was given toDebre-Tabor Town Education Sector, Health bureau and to the respective primary schools and healthcenters. Then a written consent was obtained from the parents of the participant children and informedassent was obtained from children for their authorization to get their anthropometric measurements.Codes were given to the study participants in order to keep their con�dentiality.
Consent for publication
Not applicable
Competing interest
The authors declare that they have no competing interest
TE: contribute to conception, design write the proposal, participate in data collection supervision, andanalyze the data. FA: had revised the proposal, participate in data collection and research reports. DG: hadrevised the proposal, participate in data collection and research reports. AA: had revised the design, theproposal, and research report and prepare the manuscript. DT: had revised the proposal and researchreport. All authors read and approved the �nal manuscript.
Acknowledgments
Author detail
1 Lecturer at Wachemo University Department of Pediatrics and child health nursing
2a Lecturer at school of Nursing and midwifery, College of health science Addis Ababa university
2b Lecturer at school of Nursing and midwifery, College of health science Addis Ababa university
2cLecterur at Wachemo Univesity department of Nursing and Ph.D. Fellow at Haramaya Univesity Schoolof Nursing and midwifery.
3 Lecturer at Debre-tabor University Department of midwifery and Ph.D. Fellow at Haramaya university
AbbreviationsBAZ: Body Mass Index for Age Z-score; EDHS: Ethiopian Demographic Health Survey; EFA: Education forAll; ESDP: Education Sector Development Program; GTP: Growth and Transformation Program; HAZ:Height for Age Z-score; IQ: Intelligence Quotient; MDG: Millennium Development Goals; NGOs: Non-Governmental Organizations; NEP: Nutrition Education Program; SBP: School Breakfast Program; UN:United Nation; UNICEF: United Nations Children’s Fund; USDA: United States Department of Agriculture;UNESCO: United Nations, Educational, Scienti�c and Cultural Organization; WAZ:Weight for Age Z-score
Page 14/20
References1. Lane Js: A Life Free From Hunger. In. UK, London Save the Children; 2012.
2. Watkins K: The State of The World'S Children 2016, A fair chance for every child. United nationsChildren’s fund (UniCef) June 2016:14.
3. Haddad L, Hawkes C, Webb P, Thomas S, Beddington J, Waage J, Flynn D: A new global researchagenda for food. Nature 2016, 540(7631):30-32.
4. Hayashi C, Krasevec J, Kumapley R, Mehra V, de Onis M, Borghi E, Blössner M, Urrutia M, Prydz E,Serajuddin U: Levels and trends in child malnutrition. UNICEF/WHO/World Bank Group joint childmalnutrition estimates: key �ndings of the 2017 edition. 2017.
5. UNESCO: Education 2030 Framework for Action: Towards inclusive and equitable quality educationand lifelong learning for all. In. Edited by UNESCO; 2015.
�. Education for All 2015 National Review Report: Ethiopia”. In.; 2015.
7. UNESCO, EFA, UNICEF: Fixing the Broken Promise of Education for All: Findings from the GlobalInitiative on Out-of-School Children. Unesco Institute for Statistics, Montreal 2015.
�. Azubuike B: Impact of Different Types of Schooling on Achievement in the School System: Evidencefrom Ethiopia. 2015.
9. Federal, Ministry, of, Education: Education Sector Development Programme V (ESDP V):ProgrammeAction Plan. In. Addis Ababa,Ethiopia: Federal Ministry of Education,Federal Democratic Republic ofEthiopia; 2015.
10. Berezowitz C, Bontrager A, Schoeller D: School gardens enhance academic performance and dietaryoutcomes in children. J Sch Health 2015, 85(8): 508-518.
11. Hioui M, Ahami A, Aboussaleh Y, Rusinek S: The Relationship between Nutritional Status andEducational Achievements in the Rural School Children of Morocco. J Neurol Neurol Disord 2016,3(1):101.
12. Haile D, Nigatu D, Gashaw K, Demelash H: Height for age z score and cognitive function areassociated with Academic performance among school children aged 8–11 years old. Archives ofPublic Health 2016, 74(1):17.
13. Kamath S, Venkatappa K, Sparshadeep E: Impact of Nutritional Status on Cognition inInstitutionalized Orphans: A Pilot Study. Journal of clinical and diagnostic research: JCDR 2017,11(3).
14. Rausch R: Nutrition and Academic Performance in School-Age Children The Relation to Obesity andFood Insu�ciency. J Nutr Food Sci 2013, 3(2):190.
15. Naik S, Itagi S, Patil M: Relationship between nutritional status and academic achievement oflambani school children. International Journal of Recent Scienti�c Research 2015, 6:3235-3238.
1�. Faught E, Williams P, Willows N, Asbridge M, Veugelers P: The association between food insecurityand academic achievement in Canadian school-aged children. Public health nutrition 2017,20(15):2778-2785.
Page 15/20
17. Sarma M, Wijesinghe D, Sivananthawerl T: The Effects of Nutritional Status on EducationalPerformance of Primary School Children in the Plantation Sector in Nuwara Eliya Educational Zone.Tropical Agricultural Research 2015, 24(3).
1�. Prado E, Dewey K: Nutrition and brain development in early life. Nutrition reviews 2014, 72(4):267-284.
19. Chinyoka K: Impact of Poor Nutrition on the Academic Performance of Grade Seven learners: A Caseof Zimbabwe. International Journal of Learning and Development 2014, 4(3):73-84.
20. Izidoro, Silva G, Lourelli S, Juliana Nunes, Oliveira T: The in�uence of nutritional status on schoolperformance. Revista CEFAC 2014, 16(5):1541-1547.
21. Center, for, Deasease, Control: Health and academic achievemen, healthy kids. Successful students.Stronger communities. In: Centers for Disease Control and Prevention. Clifton Road NE, Atlanta, GA;2014: 1-12.
22. Bansal N: Relationship between nutritional status and academic performance in school children. .International Journal of Applied Home Science 2017, 4(9 & 10 ):736-740.
23. Jianghong L, Wei-Ting H, Barbra D, Charlene C: Regular breakfast consumption is associated withincreased IQ in kindergarten children. Early Human Development 2013, 89 257-262.
24. Melese B: Effect of Intestinal Parasitic Infection, Anemia and Nutritional Status on AcademicPerformance of Primary School Children in Two Districts of Gurage Zone, South Central Ethiopia. ECNutrition 2017, 10(4):149-157.
25. Abebe F, Geleto A, Sena L, Hailu C: Predictors of academic performance with due focus onundernutrition among students attending primary schools of Hawa Gelan district, SouthwestEthiopia: a school based cross sectional study. BMC Nutrition 2017, 3(1):30.
2�. Admasie A, Ali A, Kumie A: Assessment of demographic, health and nutrition related factors to aschool performance among school children in Arb-Gebeya Town, Tach-Gaynt Woreda, South Gondar,Ethiopia. Ethiopian Journal of Health Development 2013, 27(2):104-110.
27. NEPAD, Planning, African, Union, Commission: The Cost of Hunger in Africa: Social and EconomicImpact of Child Undernutrition in Egypt, Ethiopia, Swaziland and Uganda. 2014.
2�. Central, Statistical, Agency, (CSA), ICF: Ethiopia Demographic and Health Survey 2016: Key IndicatorsReport. . In. Edited by Addis Ababa, Ethiopia. Rockville, Maryland, USA. CSA and ICF; 2016: 1-59.
29. Ministry, Of, Education.: The Cost of Hunger in Ethiopia:Implications for the Growth andTransformation of Ethiopiia,The Social and Economic Impact of Child Undernutrition in EthiopiaSummary Report. In. Edited by State Minister of Health FDRoE. Addis Ababa, Ethiopia: African UnionCommission, World Food Programme, United Nations Economic Commission for Africa,; 2015.
30. Central, Statistics, Agency: Population Projection of Ethiopia for All Regions At Wereda Level from2014 – 2017. In.; 2013: 1-118.
31. World, Health, Organization: WHO AnthroPlus for personal computers Manual: Software forassessing growth of the world's children and adolescents. Geneva: WHO, 2009(http://www.who.int/growthref/tools/en/ ). 2009:1-54.
Page 16/20
32. Mes�n F, Berhane Y, Worku A: Prevalence and associated factors of stunting among primary schoolchildren in Eastern Ethiopia. Nutrition and Dietary Supplements 2015, 7:61-68.
33. Roba K, Abdo M, Wakayo T: Nutritional Status and Its Associated Factors among School AdolescentGirls in Adama City, Central Ethiopia. Journal of Nutrition & Food Sciences 2016, 6(3):8.
34. Anurag S, Syed E, Payal M, Ved P, Bhushan K: Nutritional status of school-age children - A scenario ofurban slums in India. Archives of Public Health 2012, 70(8).
35. Mwaniki E, Makokha A: Nutrition status and associated factors among children in public primaryschools in Dagoretti, Nairobi, Kenya. African Health Sciences March 2013, Vol 13( Issue 1 ):39-46.
3�. Mekonnen H, Tadesse T, Kisi T: Malnutrition and its correlates among rural primary school children ofFogera district, northwest Ethiopia. Journal of Nutritional Disorders and Therapy S 2013, 12:2161-0509.
37. Abdelaziz S, Youssef M, Rene L, Sedrak A, Labib J: Nutritional Status and Dietary Habits of SchoolChildren in Beni-Suef Governorate, Egypt. Food and Nutrition Sciences 2015, 6(01):54.
3�. Anurag Srivastava, Syed M , Ved P , Shrotriya and Bhushan K: "Nutritional Status of RuralSchool‐Going Children (6‐12 Years) of Mandya District, Karnataka". Int J Sci Stud 2014, 2(2):39-43.
39. Tsedeke W, Tefera B, Debebe M: Prevalence of Acute Malnutrition (Wasting) and Associated Factorsamong Preschool Children Aged 36-60 Months at Hawassa Zuria, South Ethiopia: A CommunityBased Cross Sectional Study. Journal of Nutrition & Food Sciences 2016, 6(2).
40. Feleke, Berhanu E: Nutritional Status and Intestinal Parasite in School Age Children: A ComparativeCross-Sectional Study. International journal of pediatrics 2016, 2016.
41. Lee Y, Abdul w, Manan W: Mutritional status, academic performance and parental feeding practicesof primary school children in a rural district in Kelantan, Malaysia. Prog Health Sci , 2014, 4(1):144-152.
42. Arike A, Victoria O, Olubunmi R: Prevalence of Malnutrition of Pupils in Primary Schools in Ado LocalGovernment Area of Ekiti State, Nigeria International Journal of Science and Research, July 2013, 2(7).
43. Opoola F, Adebisi S, Ibegbu A: The study of nutritional status and academic performance of primaryschool children in Zaria, Kaduna State, Nigeria. Annals of Bioanthropology 2016, 4(2):96.
44. Yohannes N, Taye G, Sebro, Ayele: Modeling of Academic Achievement of Primary School Students inEthiopia Using Bayesian Multilevel Approach. Journal of Education and Learning; 2017, 6(1):1-10.
TablesTable 1:- Socio-demographic and economic characteristics of study participants in Debre-Tabor Town, North-Central Ethiopia, 2018, (N=399).
Page 17/20
Characteristics Categories Frequency Percent
Grade 2nd- 4th 153 385th- 8th 246 62
Age 7-10 107 2711-14 292 73
Sex Male 209 52Female 190 48
Religion Orthodox 383 96Other 16 4
Marital status of a family Married 291 73Divorced 85 21Widowed 7 2Other 16 4
Head of house Father 129 32Mother 88 22Both 167 42Other 14 4
Total family member < 5 222 56> 5 177 44
Place of residence Urban 396 99rural 3 1
Child living with Father 32 8Mother 82 21Both 264 66Other 20 5
Mother's education No formal education 178 45Primary 106 27Secondary 57 14College 51 13Other 7 1
Occupation of father Farmer 29 7Government employee 147 37Nongovernment employee 13 3Self-employed 133 33Daily laborer 53 13Other 24 6
Monthly income of a family < 1000 ETB 62 161000- 2000 ETB 91 23> 2000 ETB 246 62
Occupation of mother Housewife 221 55.4Government employee 60 15Daily laborer 37 9.3Self employed 73 18.3Other 8 2
Child attends preschool Yes 218 55No 181 45
Workload at home Yes 40 10
Page 18/20
Nutritional indicator Frequency PercentWasting 34 32.4Stunting 88 22Underweight 97 24.3Overweight 5 1.3
No 359 90Family support Yes 322 81
No 77 19Breakfast habit Yes 386 97
No 13 3Breakfast eating frequencyn= 386
Always 212 55Sometimes 174 45
Time taking to school < 30 minutes 389 97> 30 minutes 10 3
Absenteeism Yes 285 71No 114 29
Number of absenteeism daysn= 285
< 5 days 246 865 days 13 5> 5 days 26 9
Table 2:-The prevalence of stunting, wasting, underweight and overweight of studyparticipants in Debre-Tabor Town, North -Central Ethiopia, 2018, (N=399 for HAZ &BAZ, N=105 for WAZ).
Table 3:- Descriptive result foracademic achievement of study
participants in Debre-Tabor Town, Amhara Regional State, North-Central Ethiopia, 2018,(N= 399).
Page 19/20
95% CI
Variable Category Mean StandardDeviation
Frequency Percent Minimum Maximum LowerBound
UpperBound
Age 7-10 76.61 11.81 107 27 49 97 90 12511-14 69.84 12.45 292 73 6 97 274 309
Sex Male 72.02 11.57 209 52 48 97 189 228Female 71.24 13.73 190 48 6 97 171 210
Monthlyincome
< 1000 69.53 14.46 62 16 6 97 49 77> 2000 72.91 12.34 246 62 7 97 227 265
Childattendspreschool
Yes 73.60 10.99 218 55 49 97 198 237
No 69.31 14.04 181 45 6 97 162 201
Familysupport
Yes 72.13 12.83 322 81 6 97 306 337No 69.65 11.66 77 19 49 94 62 93
Eatingfrequency
Always 72.54 11.36 212 55 47 97 193 231Sometimes 70.04 13.54 174 45 6 97 155 193
Absenteeism Yes 70.81 12.50 285 71 6 97 267 302No 73.77 12.76 114 29 49 97 97 132
Number ofabsenteeismdays
5 days 73.34 12.21 13 5 57 90 7 21
> 5 days 69.42 12.61 26 9 52 90 18 37
Height forage z-score
Stunted 69.65 11.18 66 17 50 94 52 81Wellnourished
72.22 13.05 311 78 6 97 294 326
Body massindex forage z-score
Underweight 70.87 15.84 73 18 6 97 59 89
Overweight 73.70 9.75 5 1 58 83 2 11
Table 4:-Pearson Correlation between nutritional indicators and academicperformance of study participants in Debre-Tabor Town, Amhara Regional State, North-Central Ethiopia, 2018, (N=399).
Nutritional Indicators Academic performanceAverage semesters score
Pearson’s coefficient (r) P-valueHeight-for-age (HAZ) 0.130** 0.009Weight-for-age (WAZ) 0.097 0.323Body mass index -for-age (BAZ) 0.000 1.000
**. Correlation is significant at the 0.01 level (2-tailed).
Table 5:-Factors associated with academic performance of study participants in Debre-Tabor Town, Amhara Regional State, North-Central Ethiopia, 2018, (N= 399).
Page 20/20
Variable Category B(95.0% CI) t-test P-value (Constant) 67.18 (59.37,74.99) 16.91 0.000Age 7-10 year 1
11-14 years -5.07 (-7.86, -2.28) -3.69 0.000Head of house Father 4.52 (1.95, 7.09) 3.45 0.001
Mother 1 Breakfast habit Yes 7.61 (0.97,14.24) 2.25 0.025
No 1 Absenteeism Yes -3.89 (-6.55, -1.25) -2.89 0.004
No 1 Attending preschool Yes 3.03 (0.53, 5.52) 2.38 0.018
No 1
Supplementary Files
This is a list of supplementary �les associated with this preprint. Click to download.
STROBEchecklistcrosssectional.doc
![Cross sectional study.pptx [Read-Only]...Descriptive cross-sectional study Analytic cross-sectional study Repeated cross-sectional study 7 Descriptive Collected number of cases and](https://img.pdfslide.us/doc/110x75/5f0c07f77e708231d43368fd/cross-sectional-studypptx-read-only-descriptive-cross-sectional-study-analytic.jpg)